Li-Distribution in Compounds of the Li2O-MgO-Al2O3-SiO2-CaO System—A First Survey


Abstract
:1. Introduction
2. Background
2.1. Important Binary Phase Systems Containing Li
2.2. Important Ternary Phase Systems Containing Li
3. Materials and Methods
3.1. Materials
Chemicals
3.2. Methods
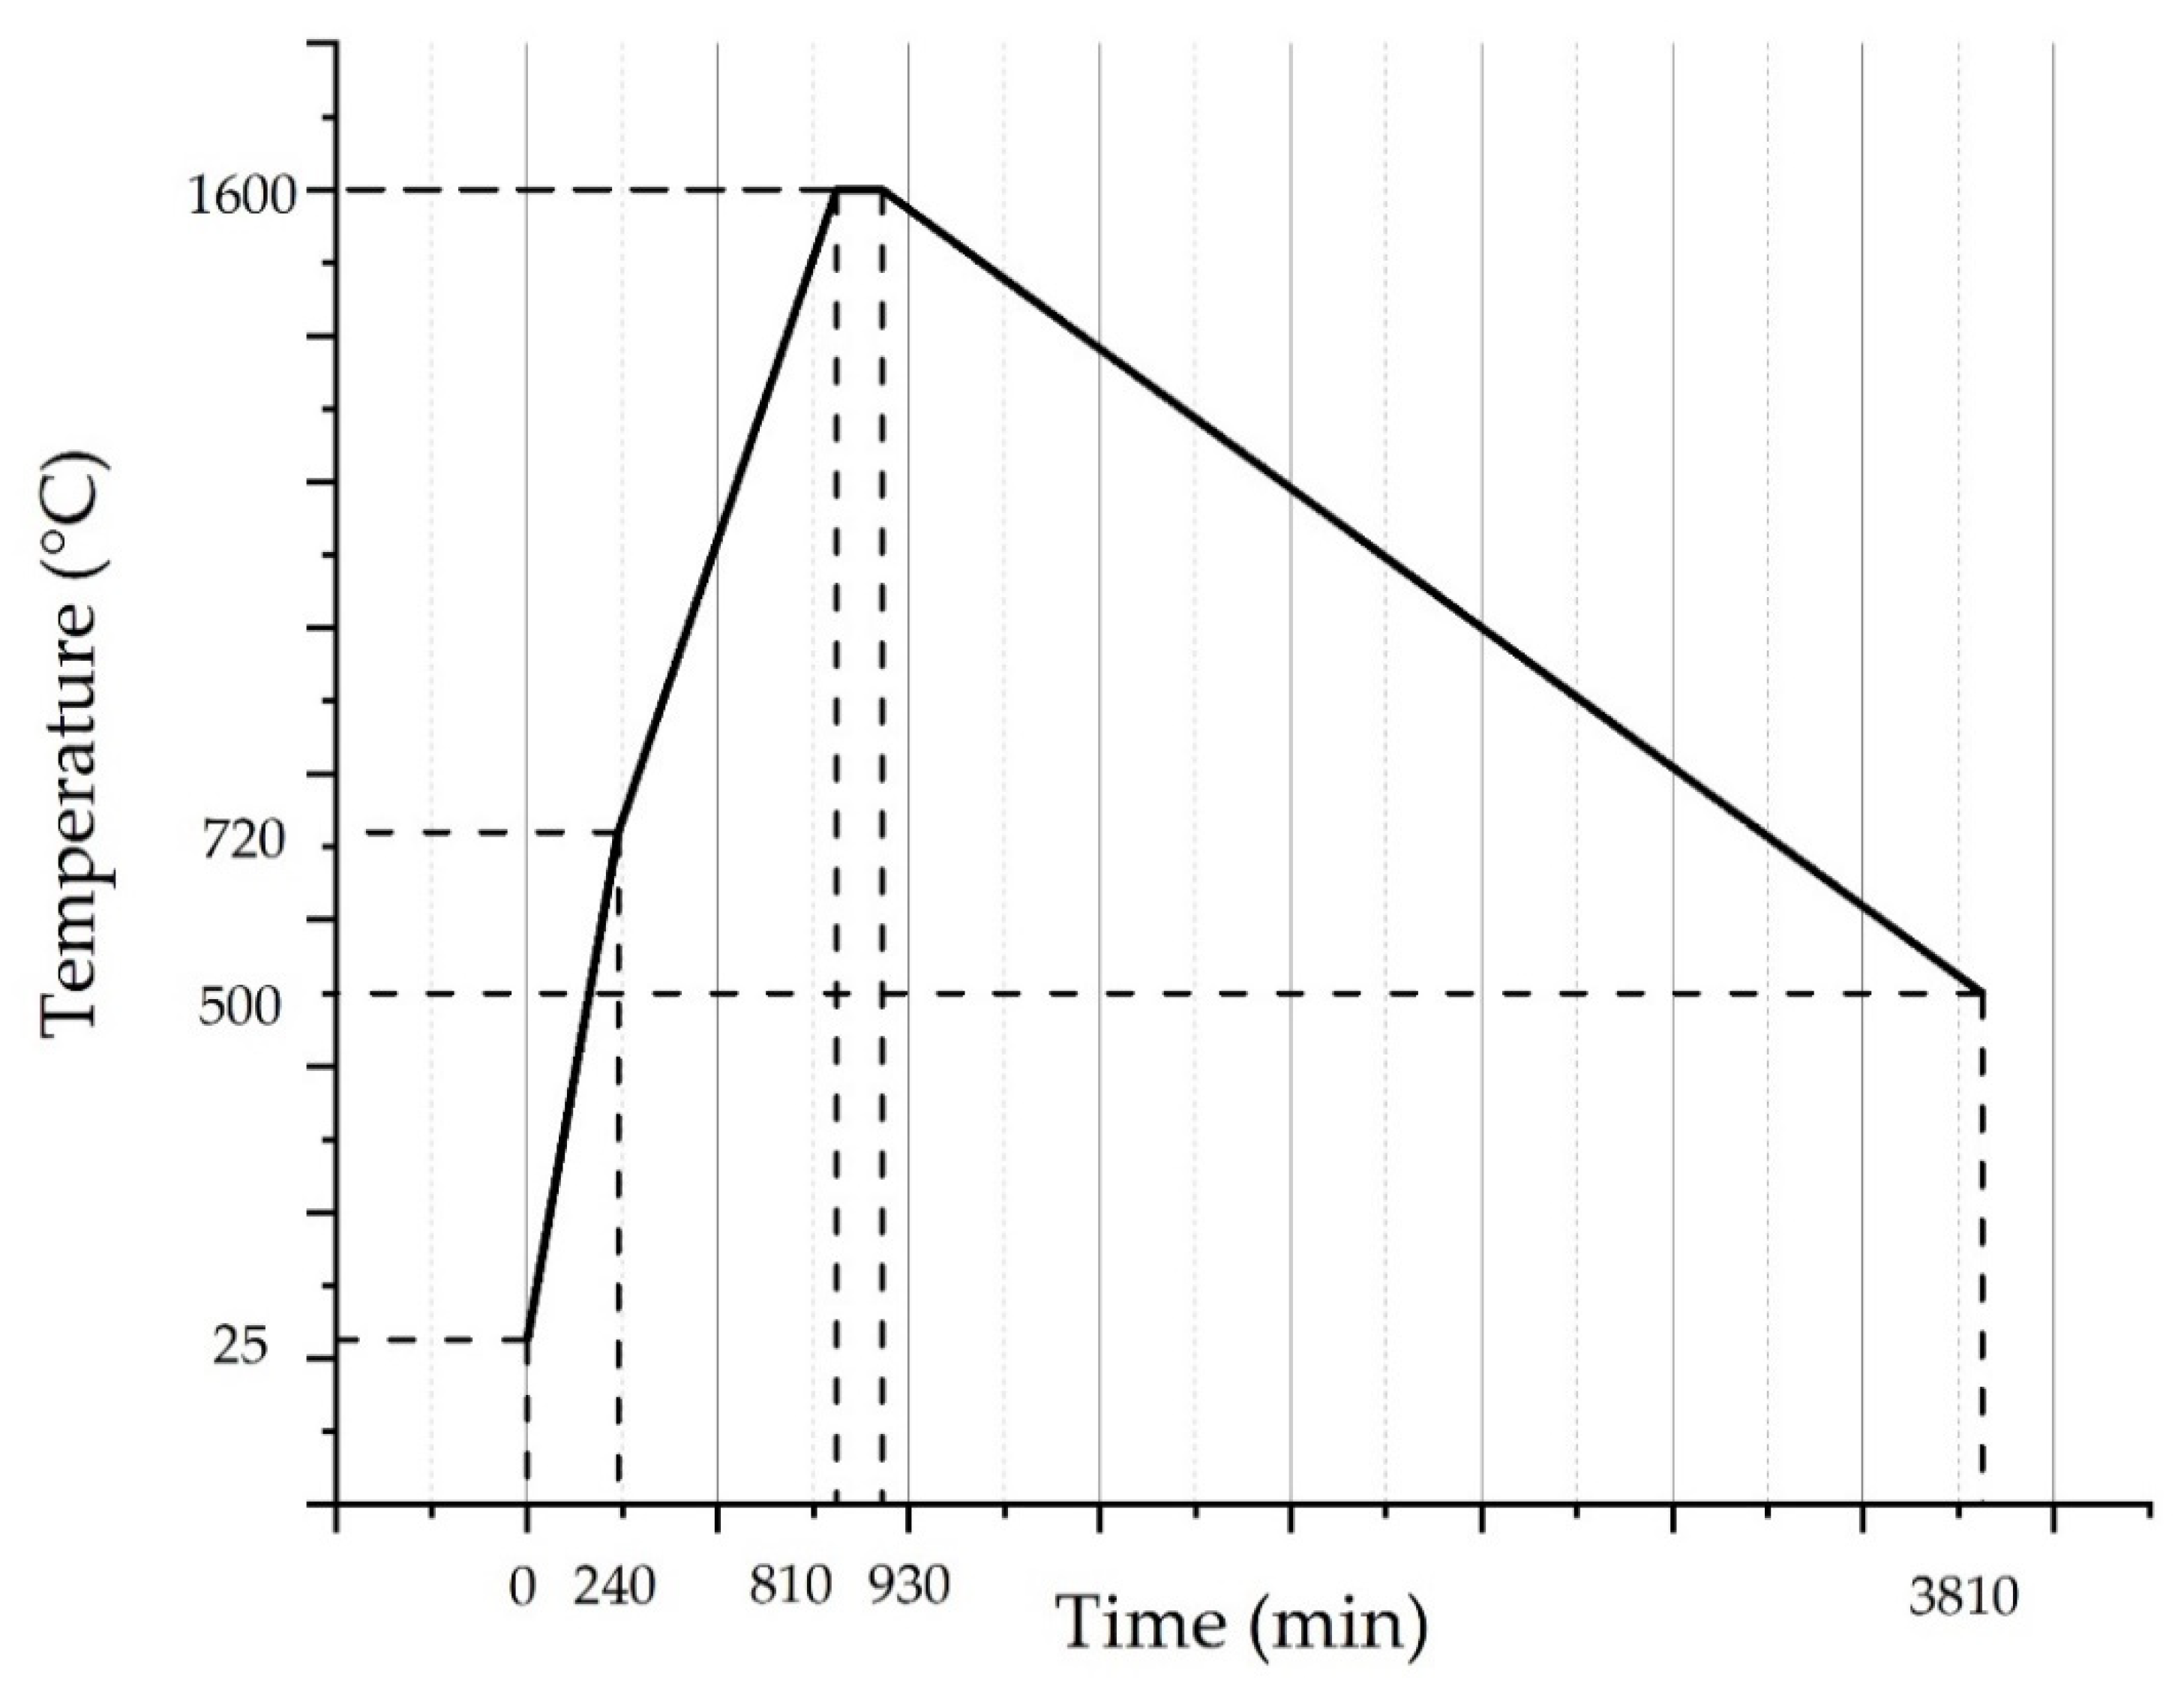
3.2.1. Experiments
3.2.2. Chemical Bulk Analysis
3.2.3. Mineralogical Investigation
3.2.4. Thermodynamic Modeling
4. Results
4.1. Bulk Chemistry of the Melt Experiments
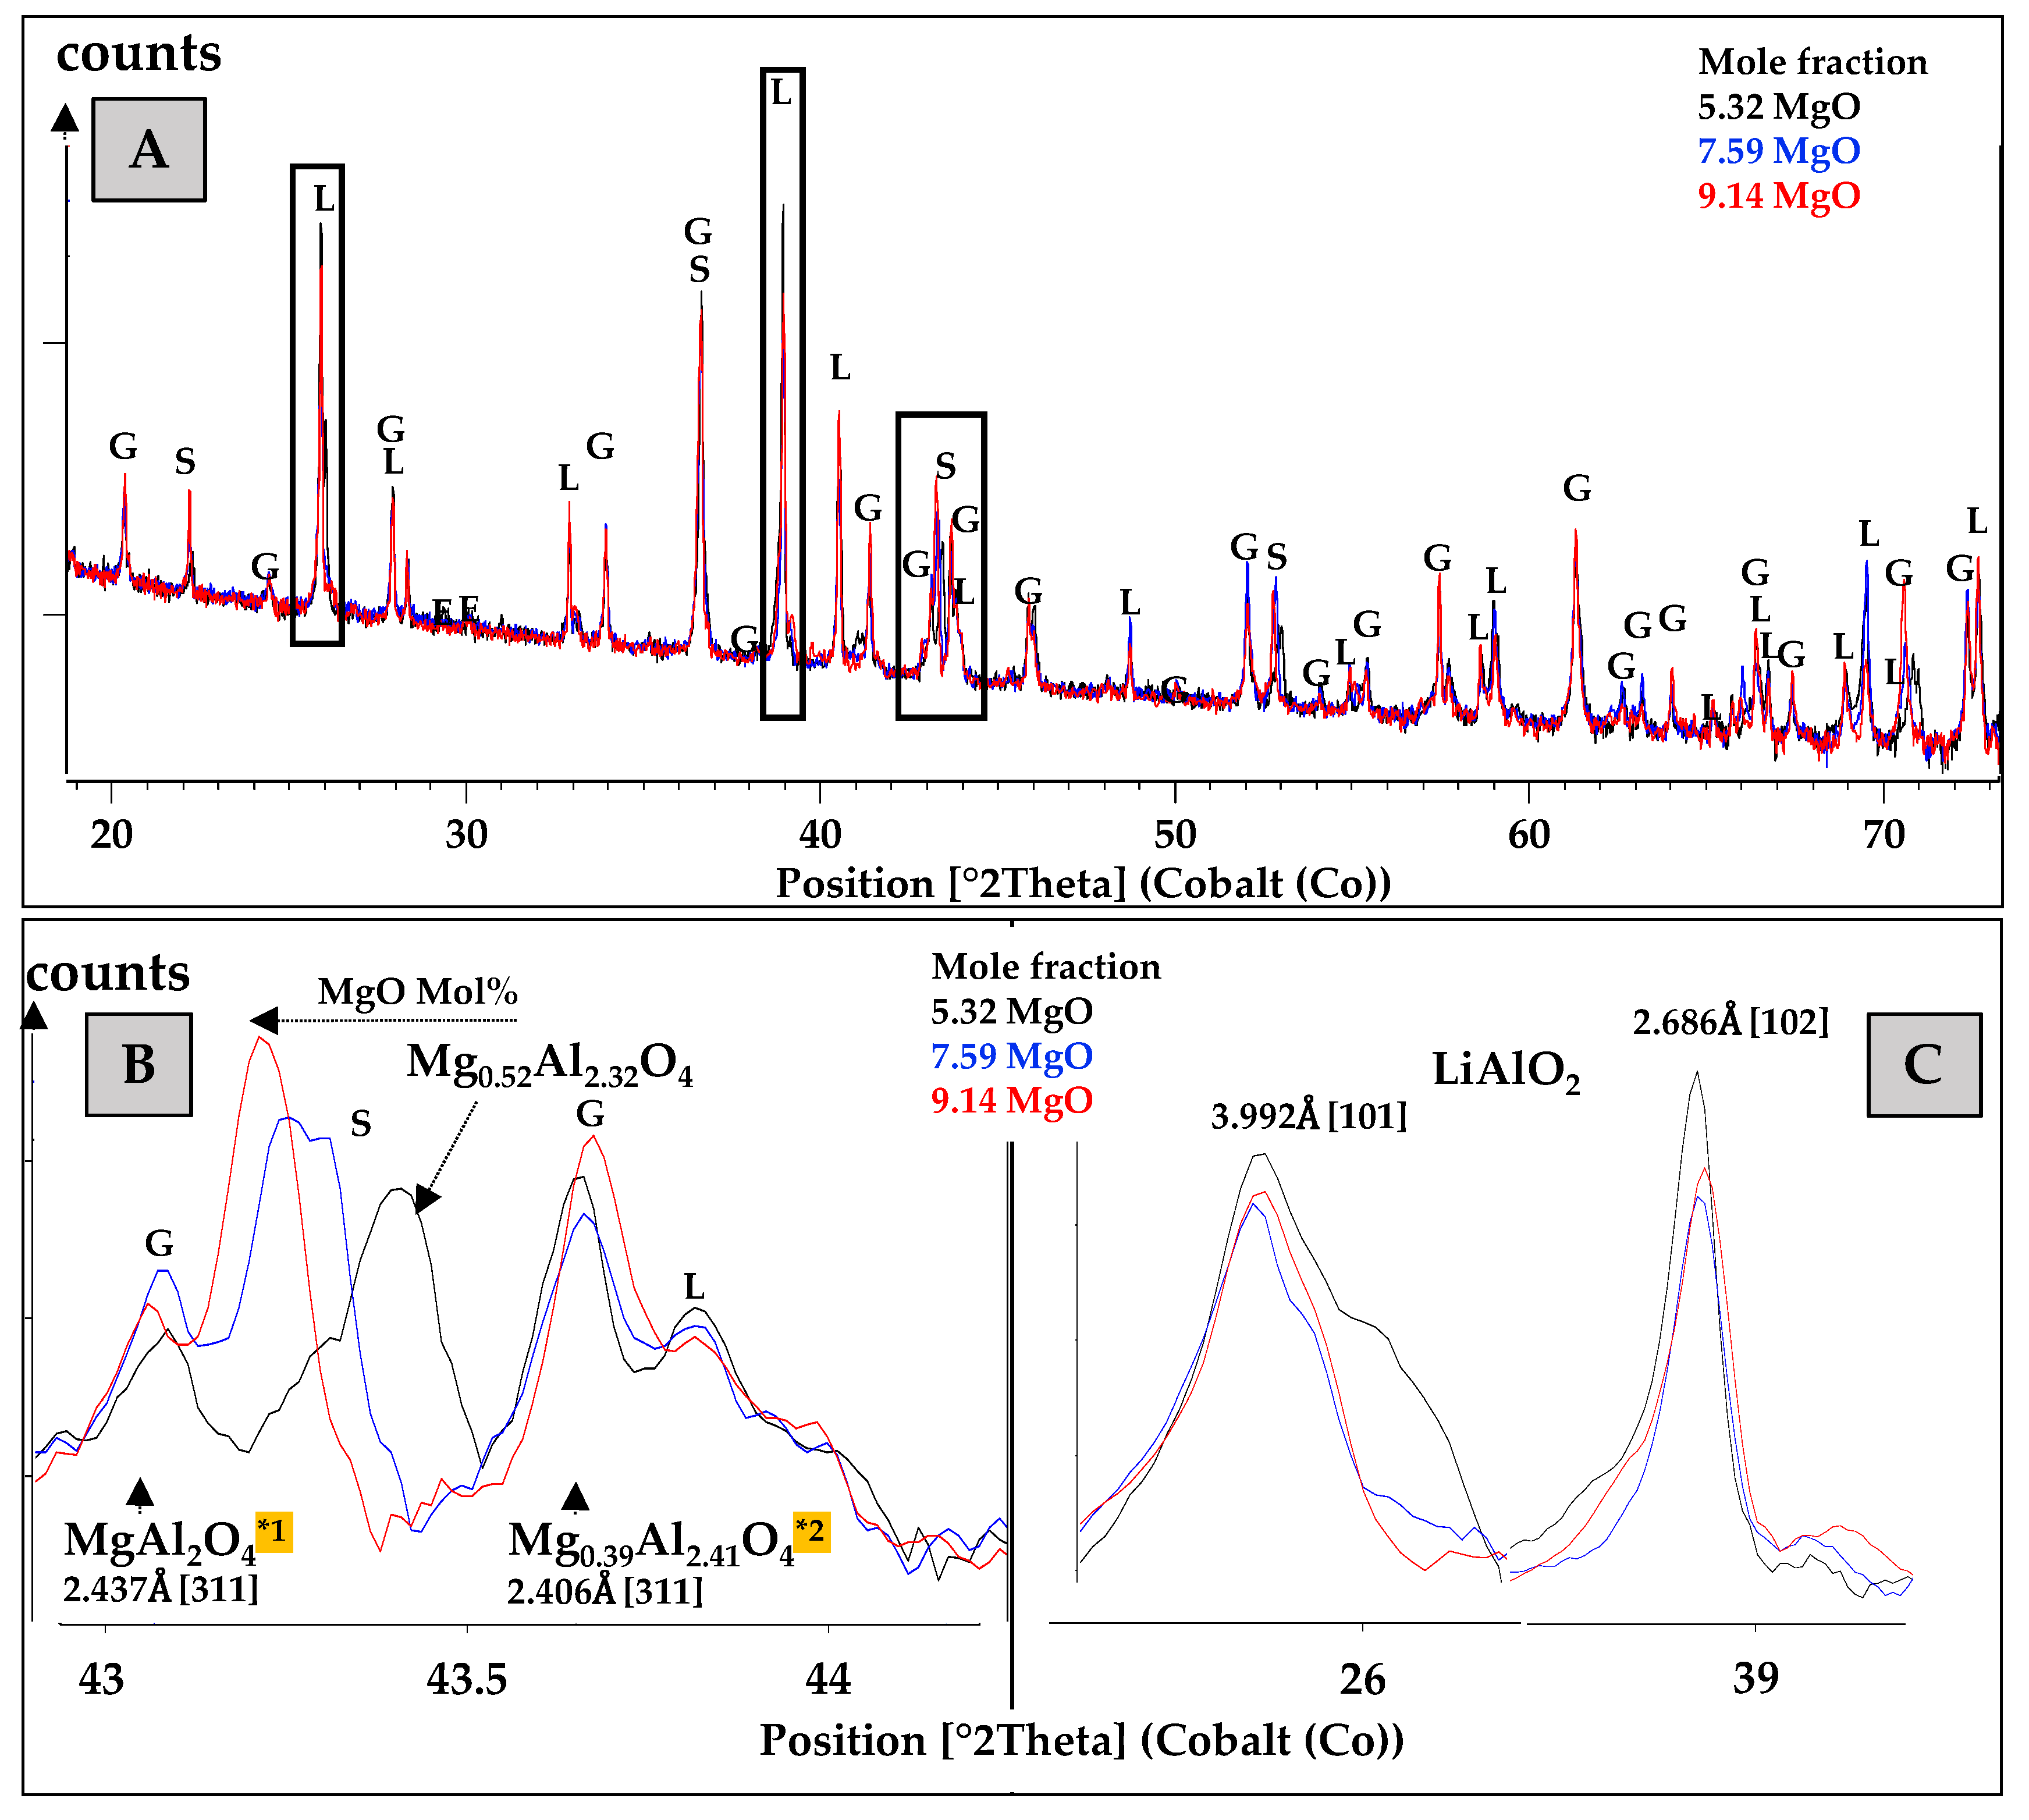
4.2. PXRD Comparison of the Three Melt Experiments
4.3. EPMA Results
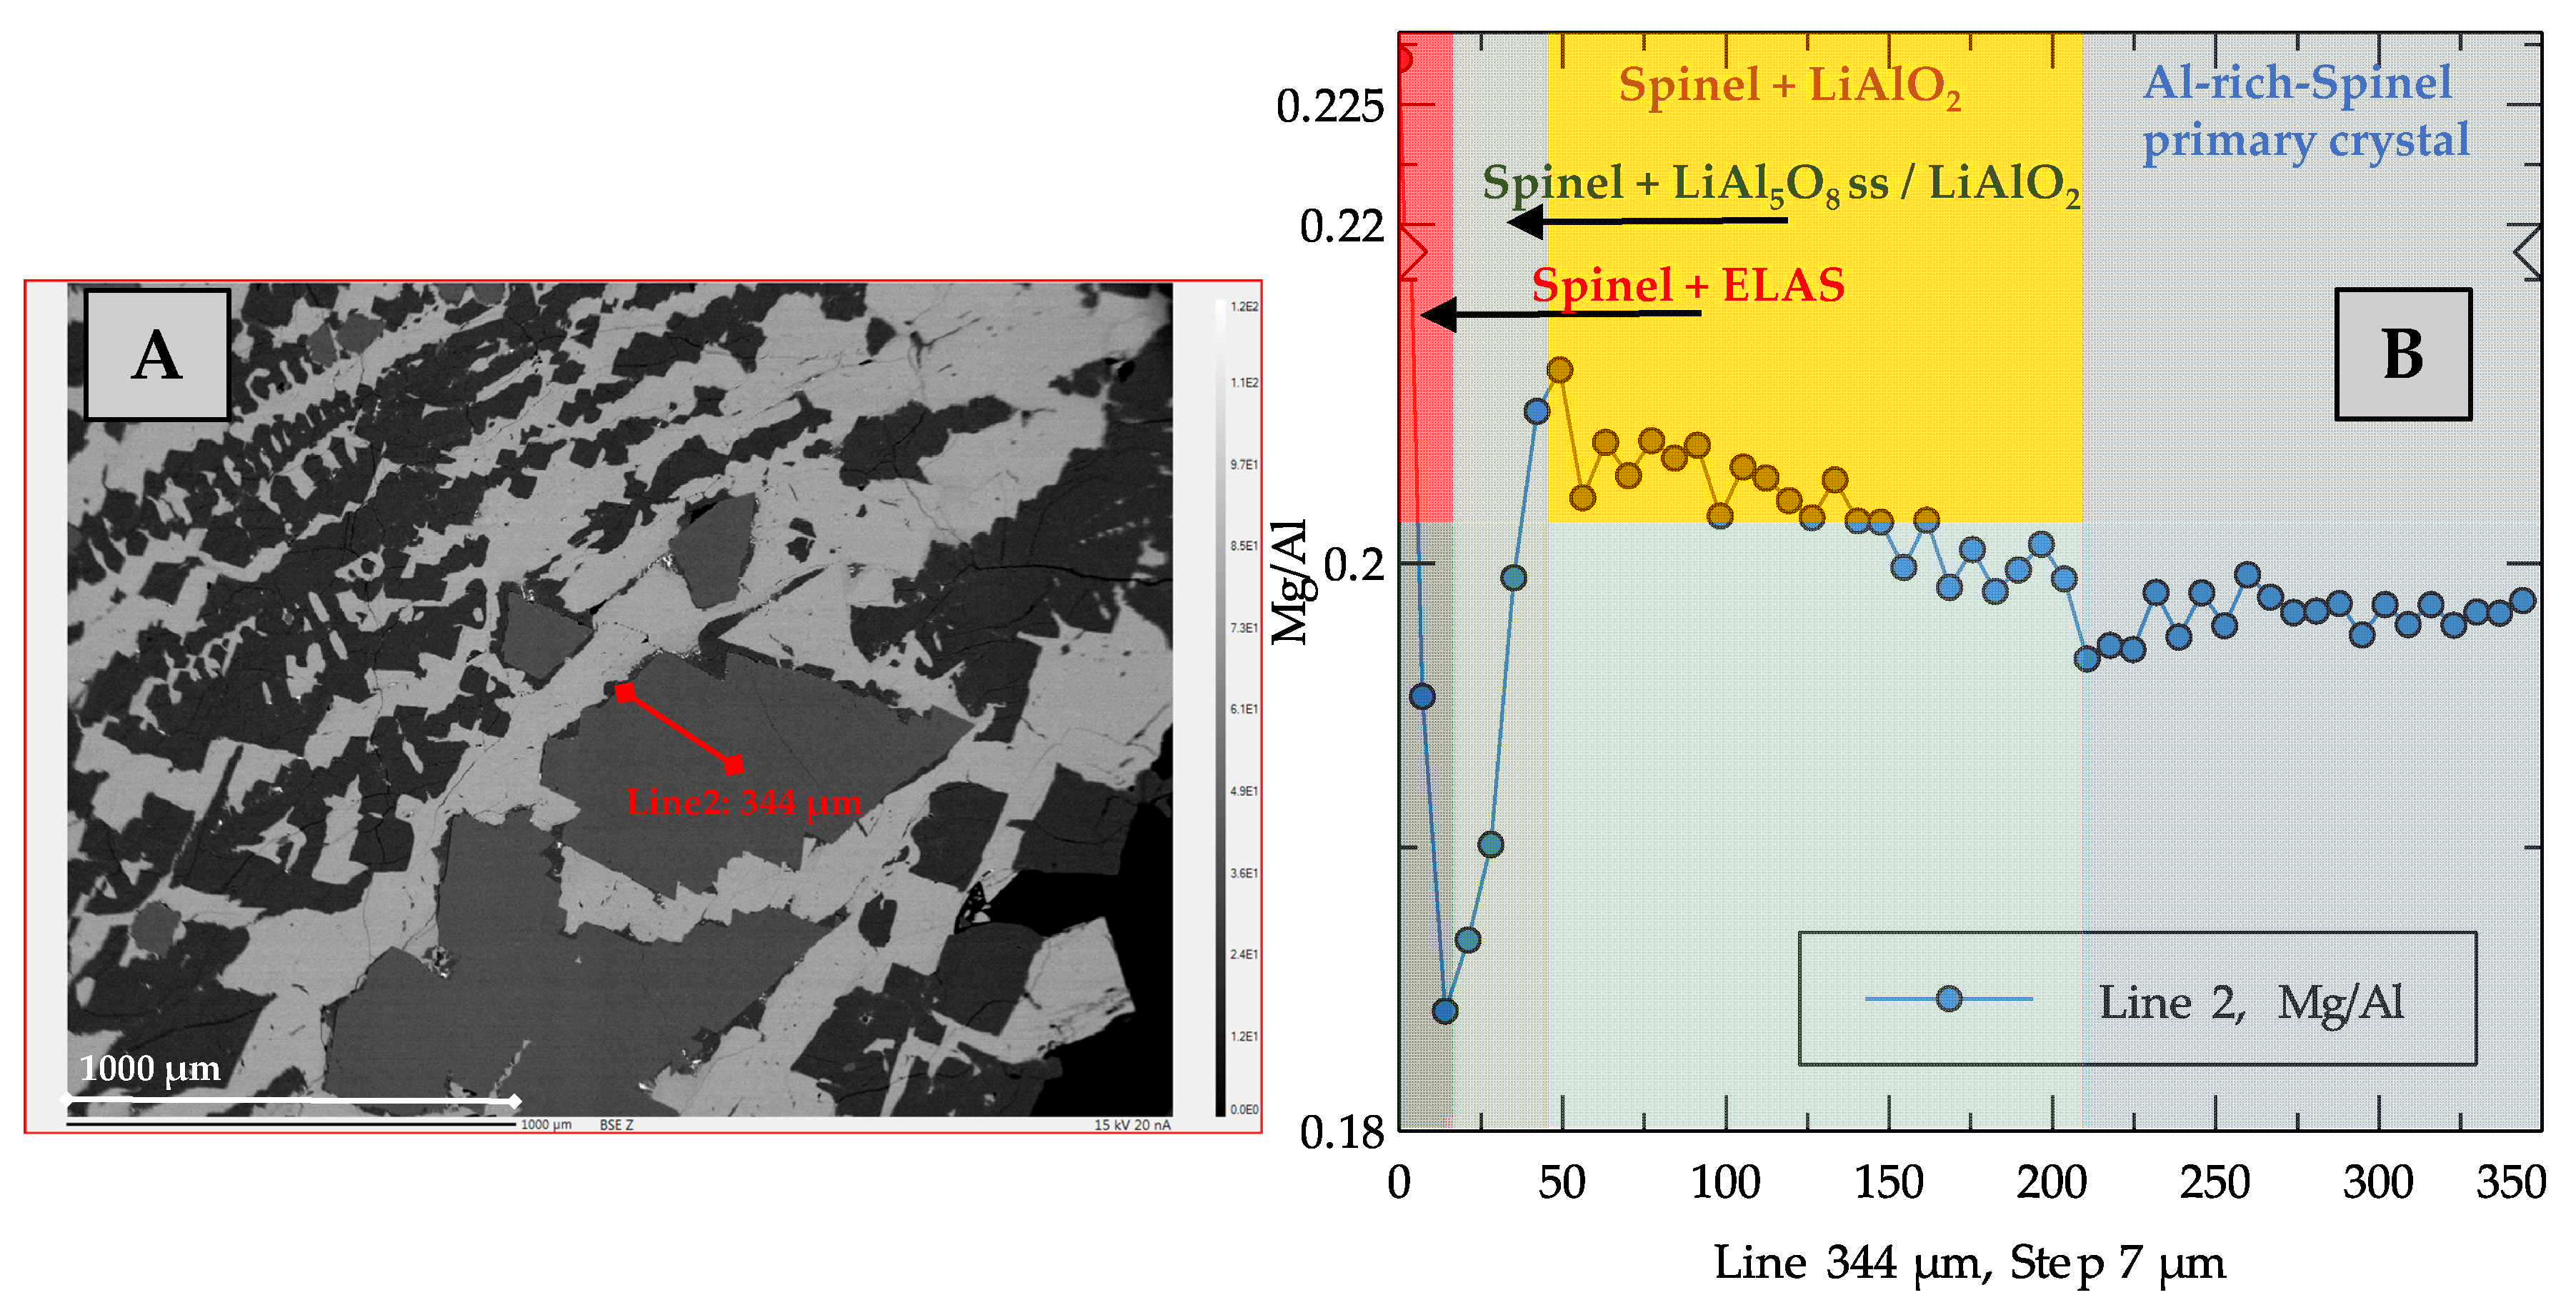
- Spinel: Mg1−(3/2y)Al2+yO4
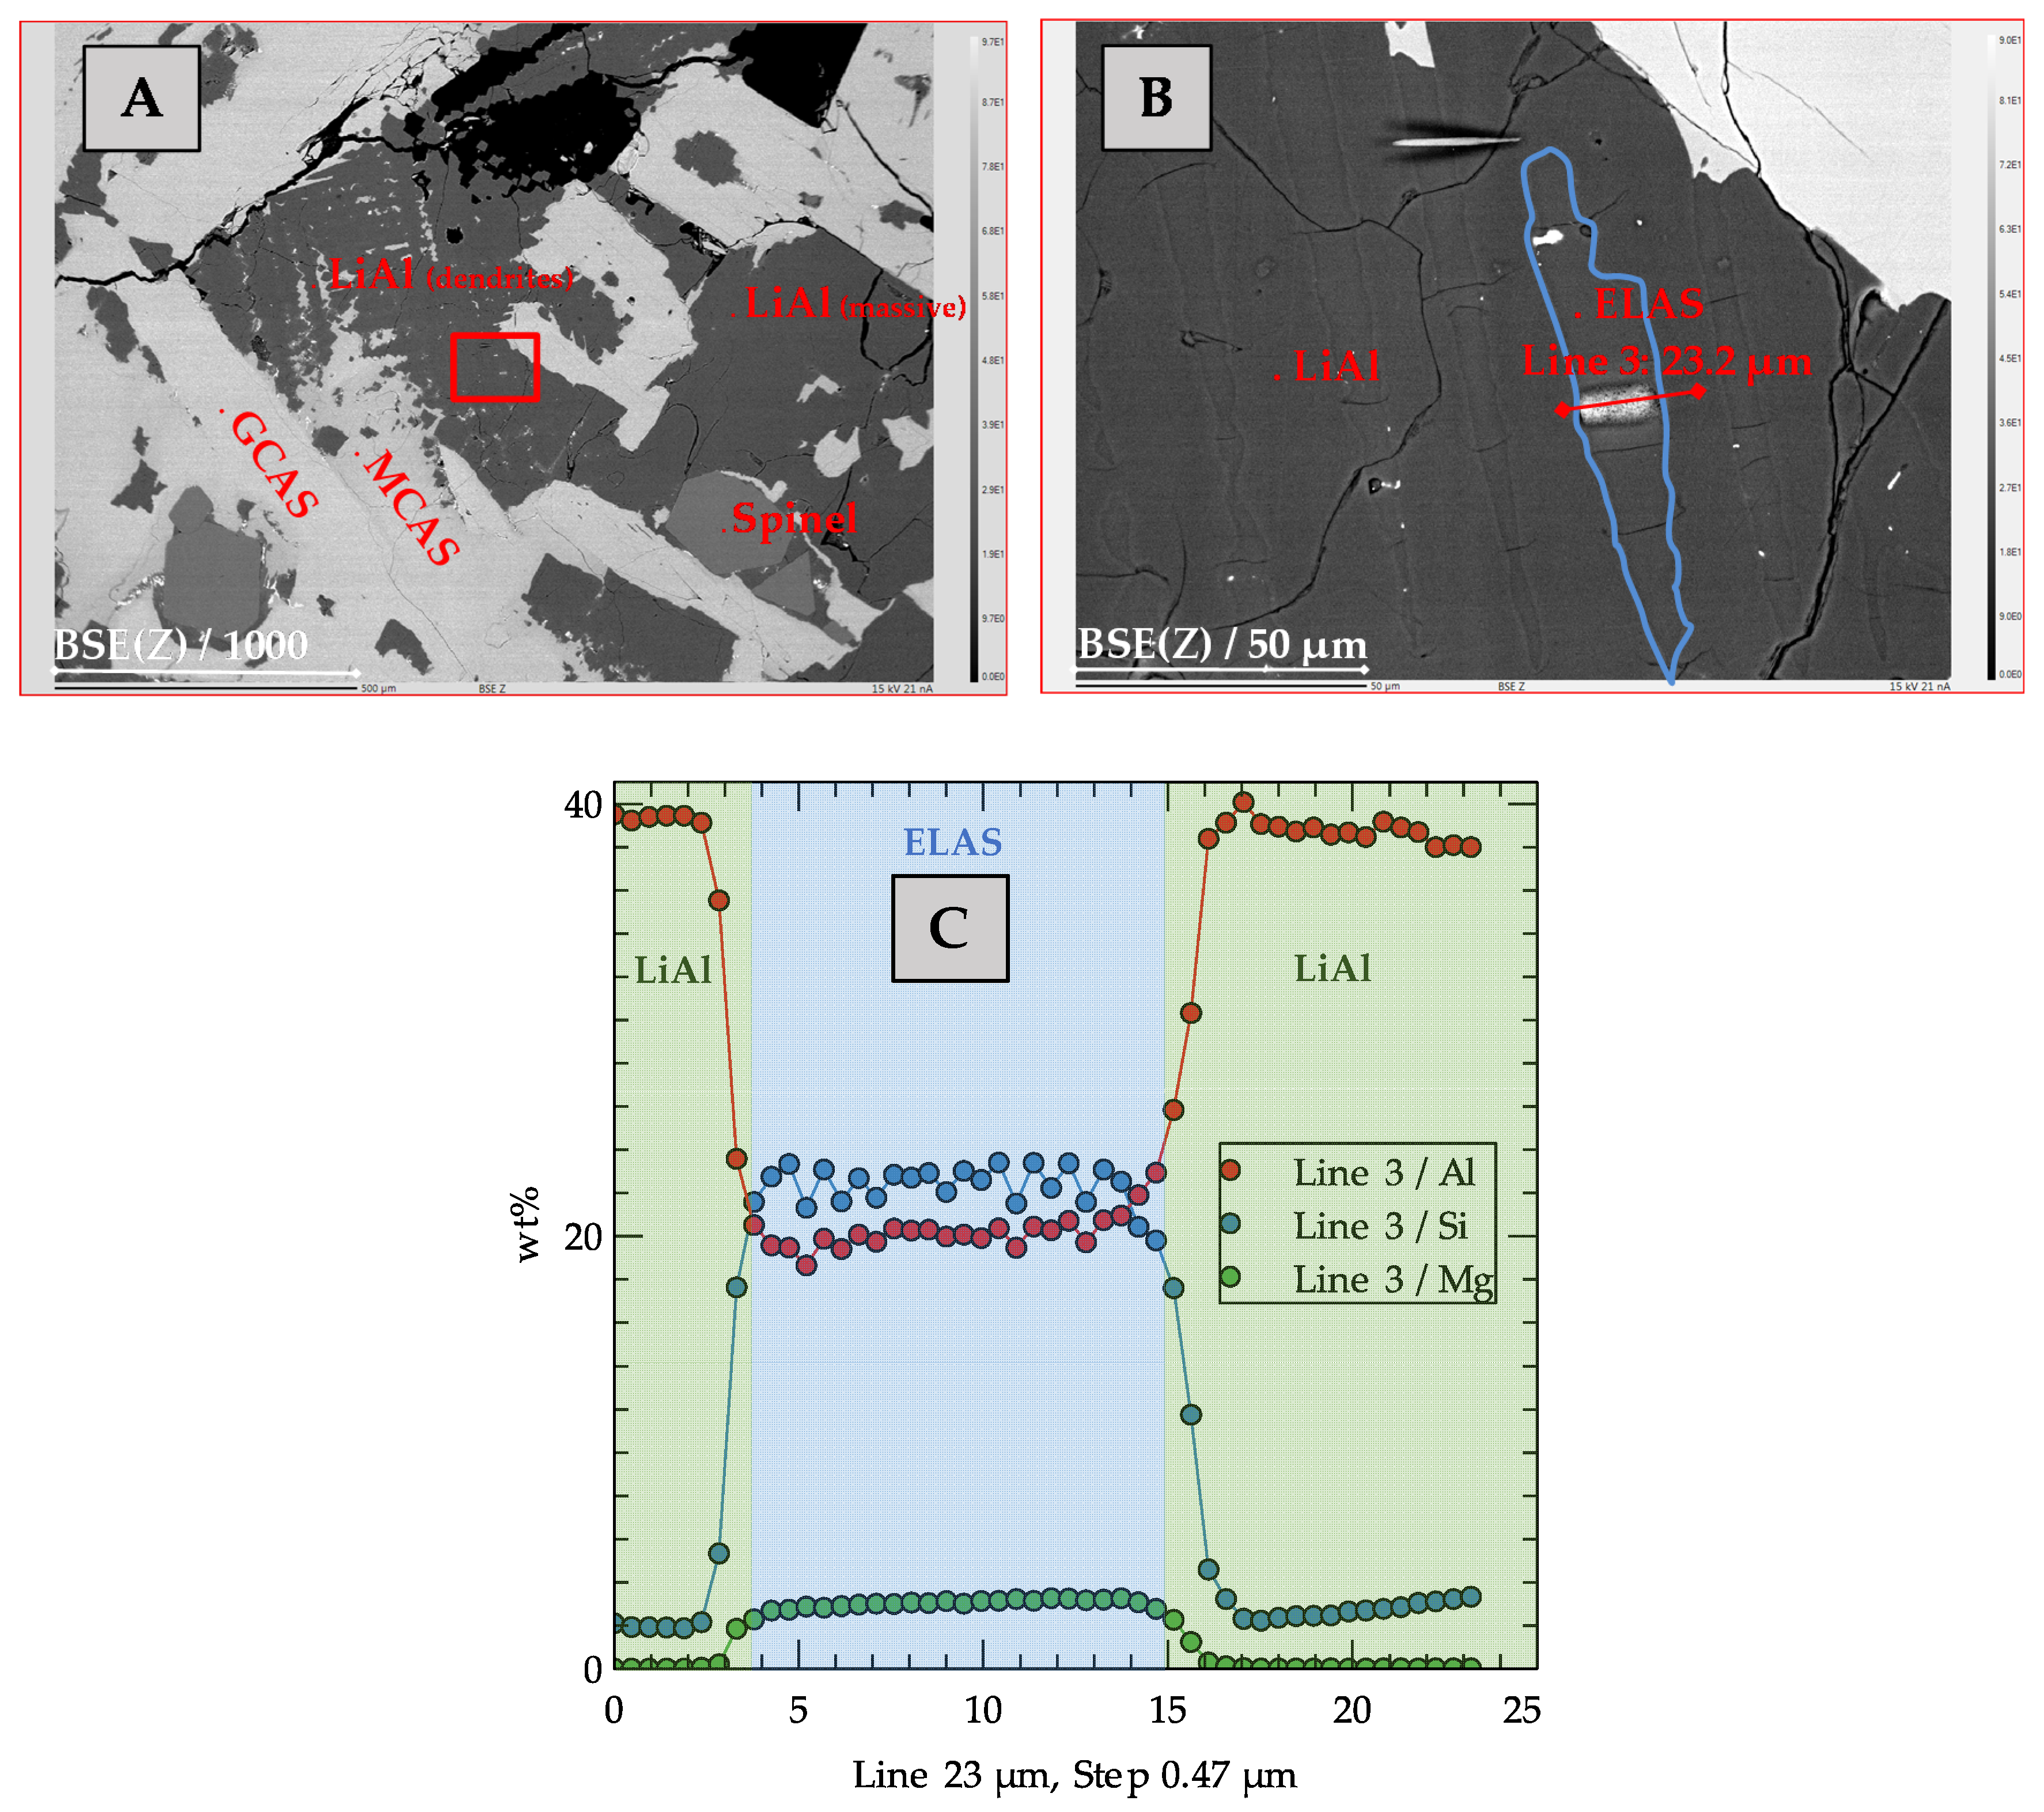
- Lithium aluminate (LiAl): Li1−x(Al1−xSix)O2
- Eucryptite-like lithium alumosilicate (ELAS): Li1−xMgy(Al)(Al3/2y+xSi2−x−3/2y)O6
- Gehlenite-like calcium-alumosilicate (GCAS): Ca2AL2SiO7 with minute amounts of Mg
- Melilite-like calcium-alumosilicate (MCAS): (Na,Ca,Li)2(Al,Mg,Li)(Al,Si)2O7, which according to the calculations (Section 4.3.3) can also be a potential host for Li
4.3.1. Lithium Aluminate (LiAl) and Lithium-Alumosilicate (ELAS)
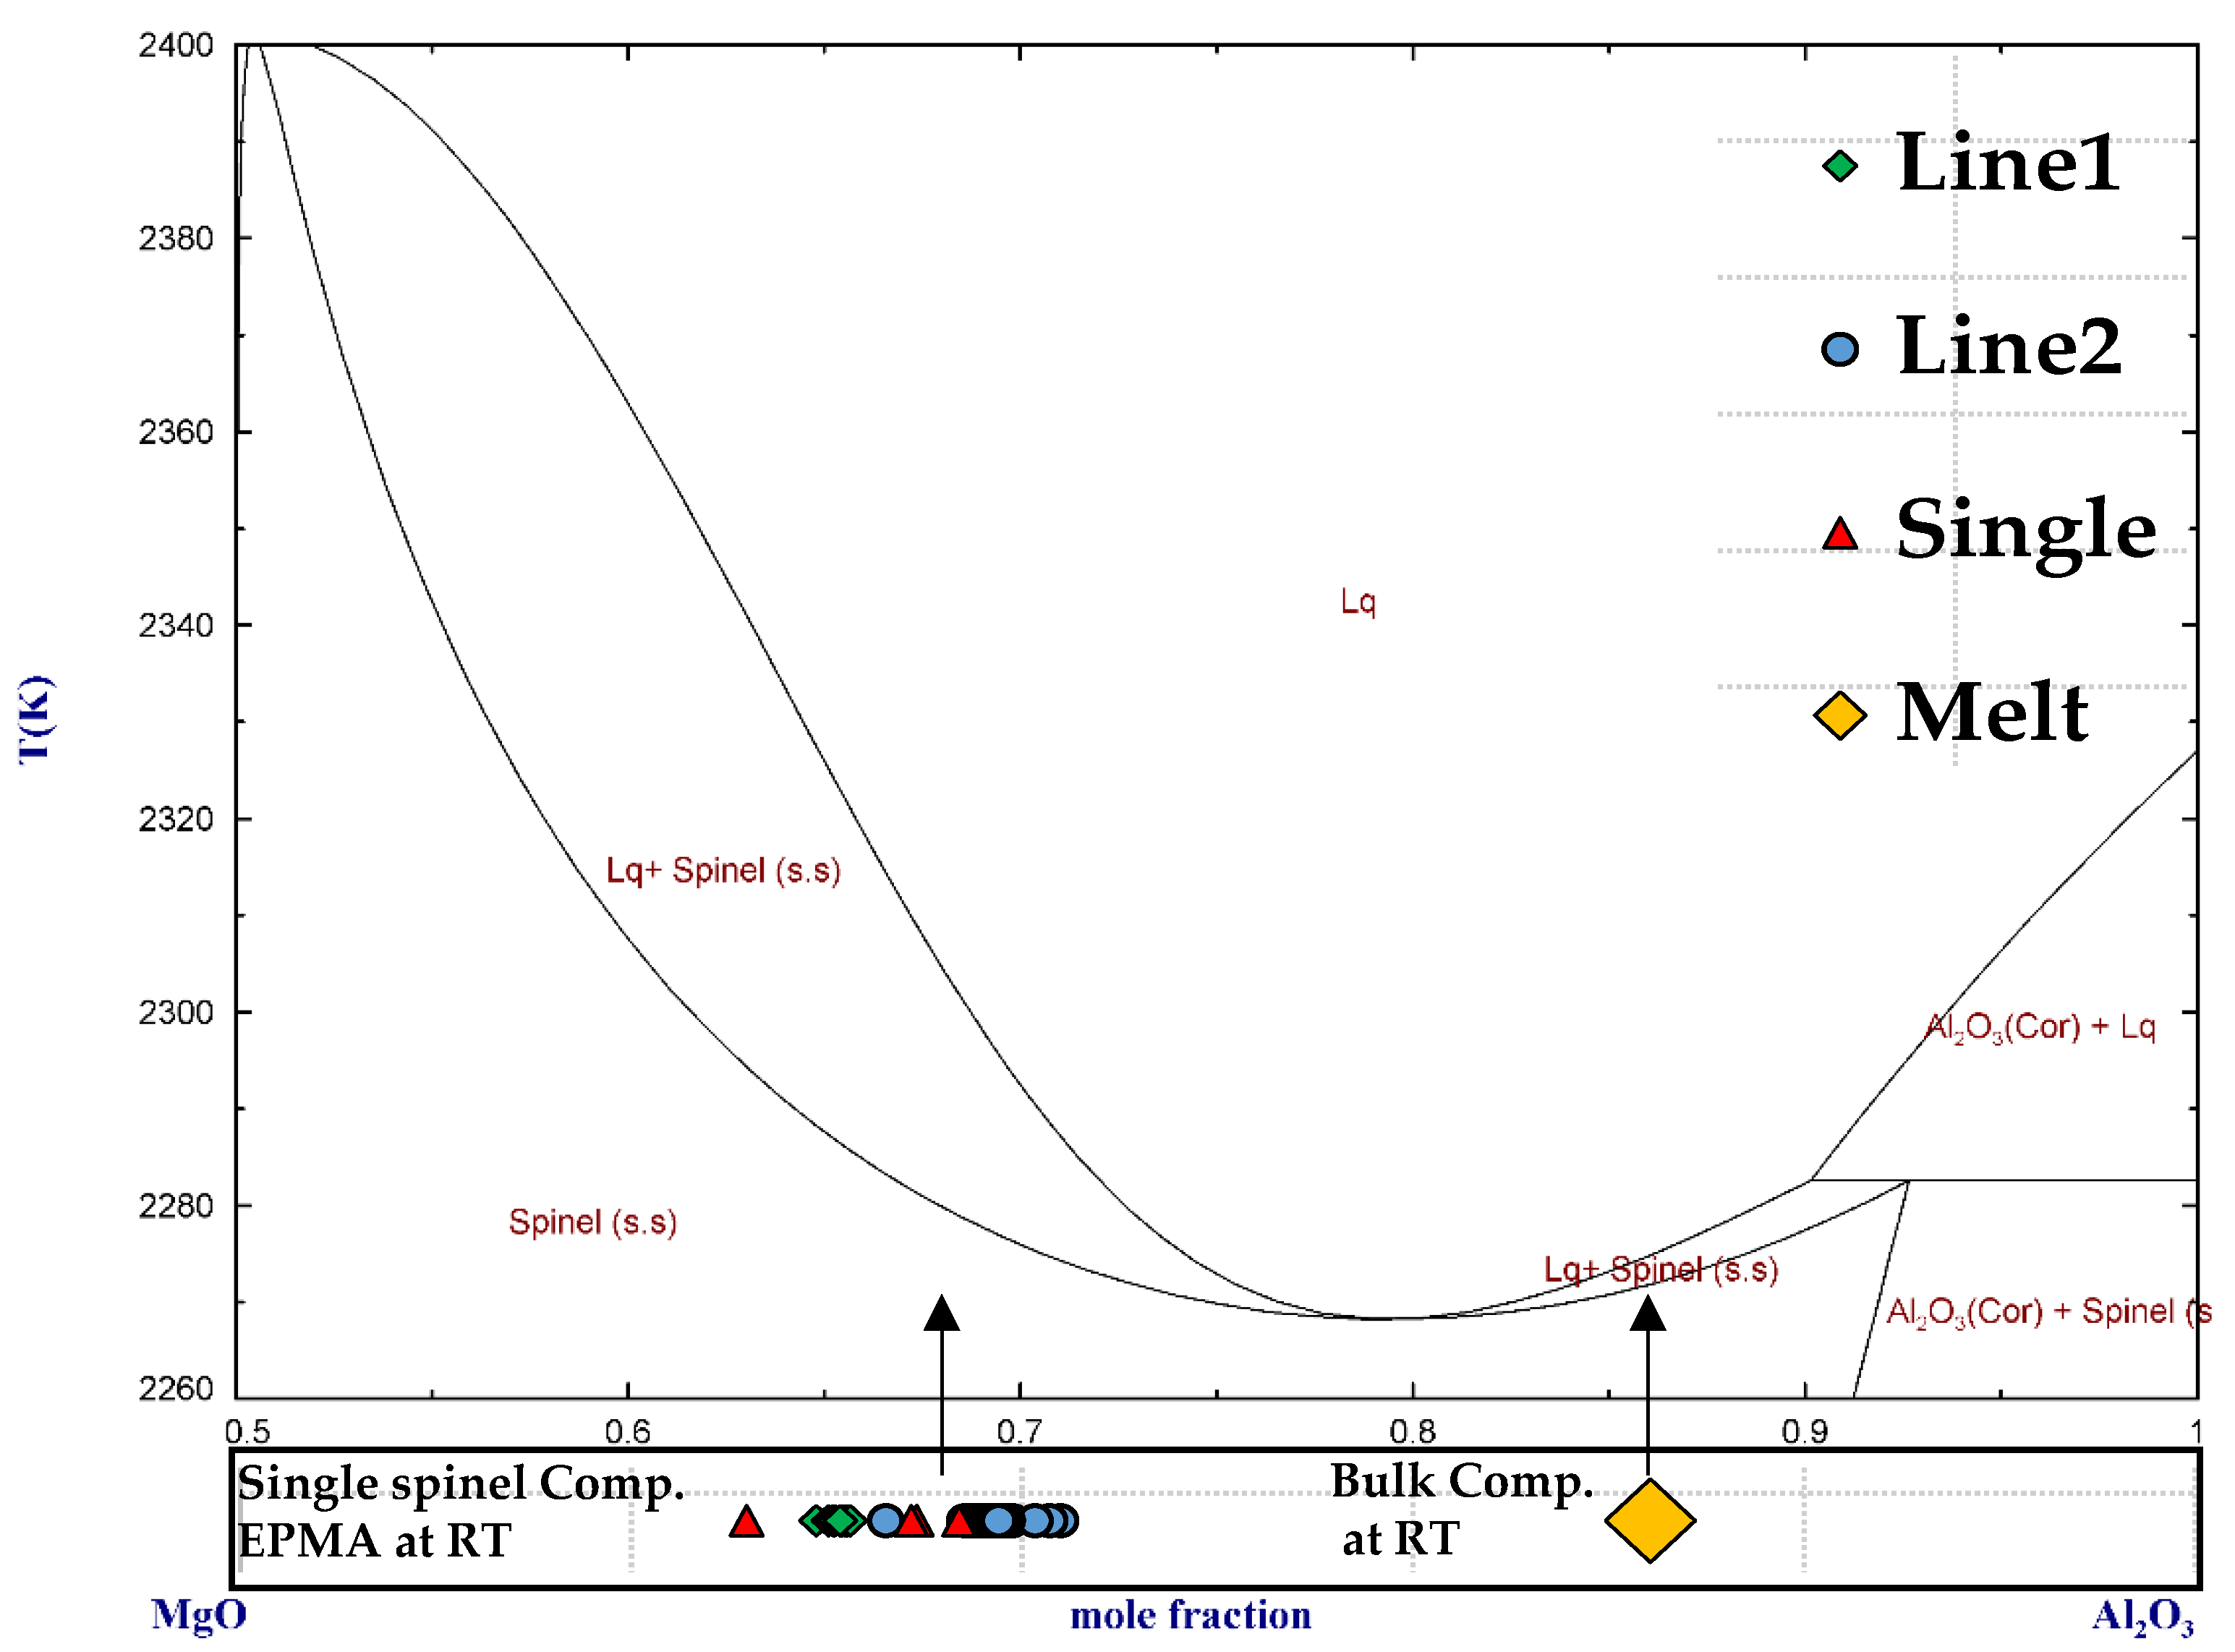
4.3.2. Spinel
4.3.3. Ca-Alumosilicate (GCAS/MCAS)
- GCAS: High Al, low Si, very low Mg and virtually no Na
- MCAS: Low Al, high Si, ~3 wt.% Mg and 0.7–2.3 wt.% Na/Li is plausible
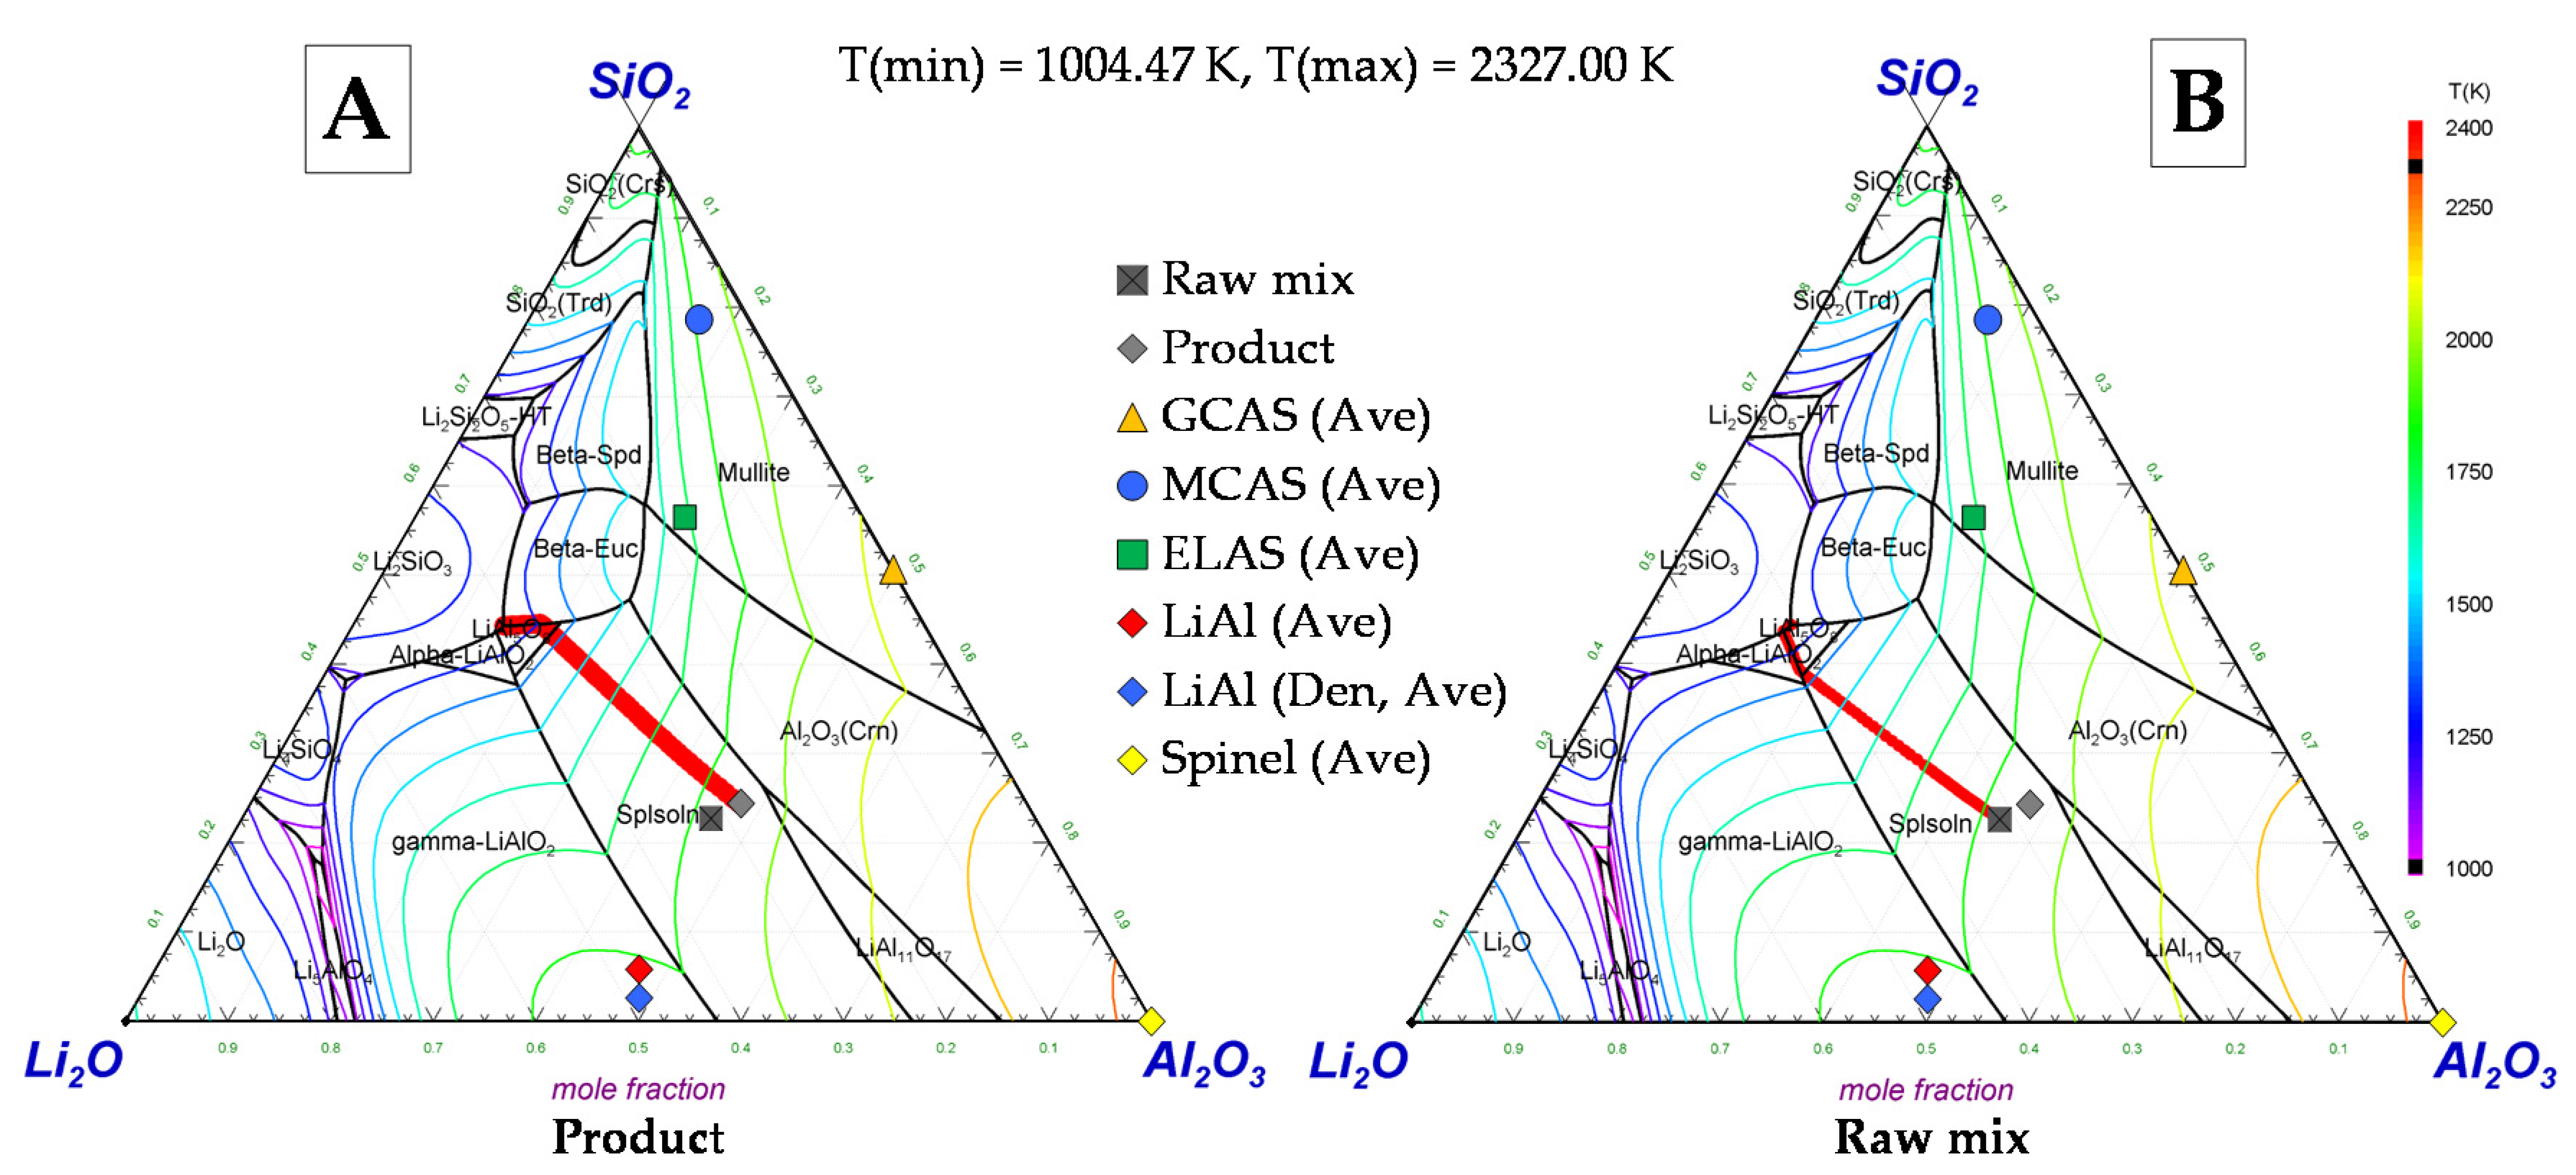
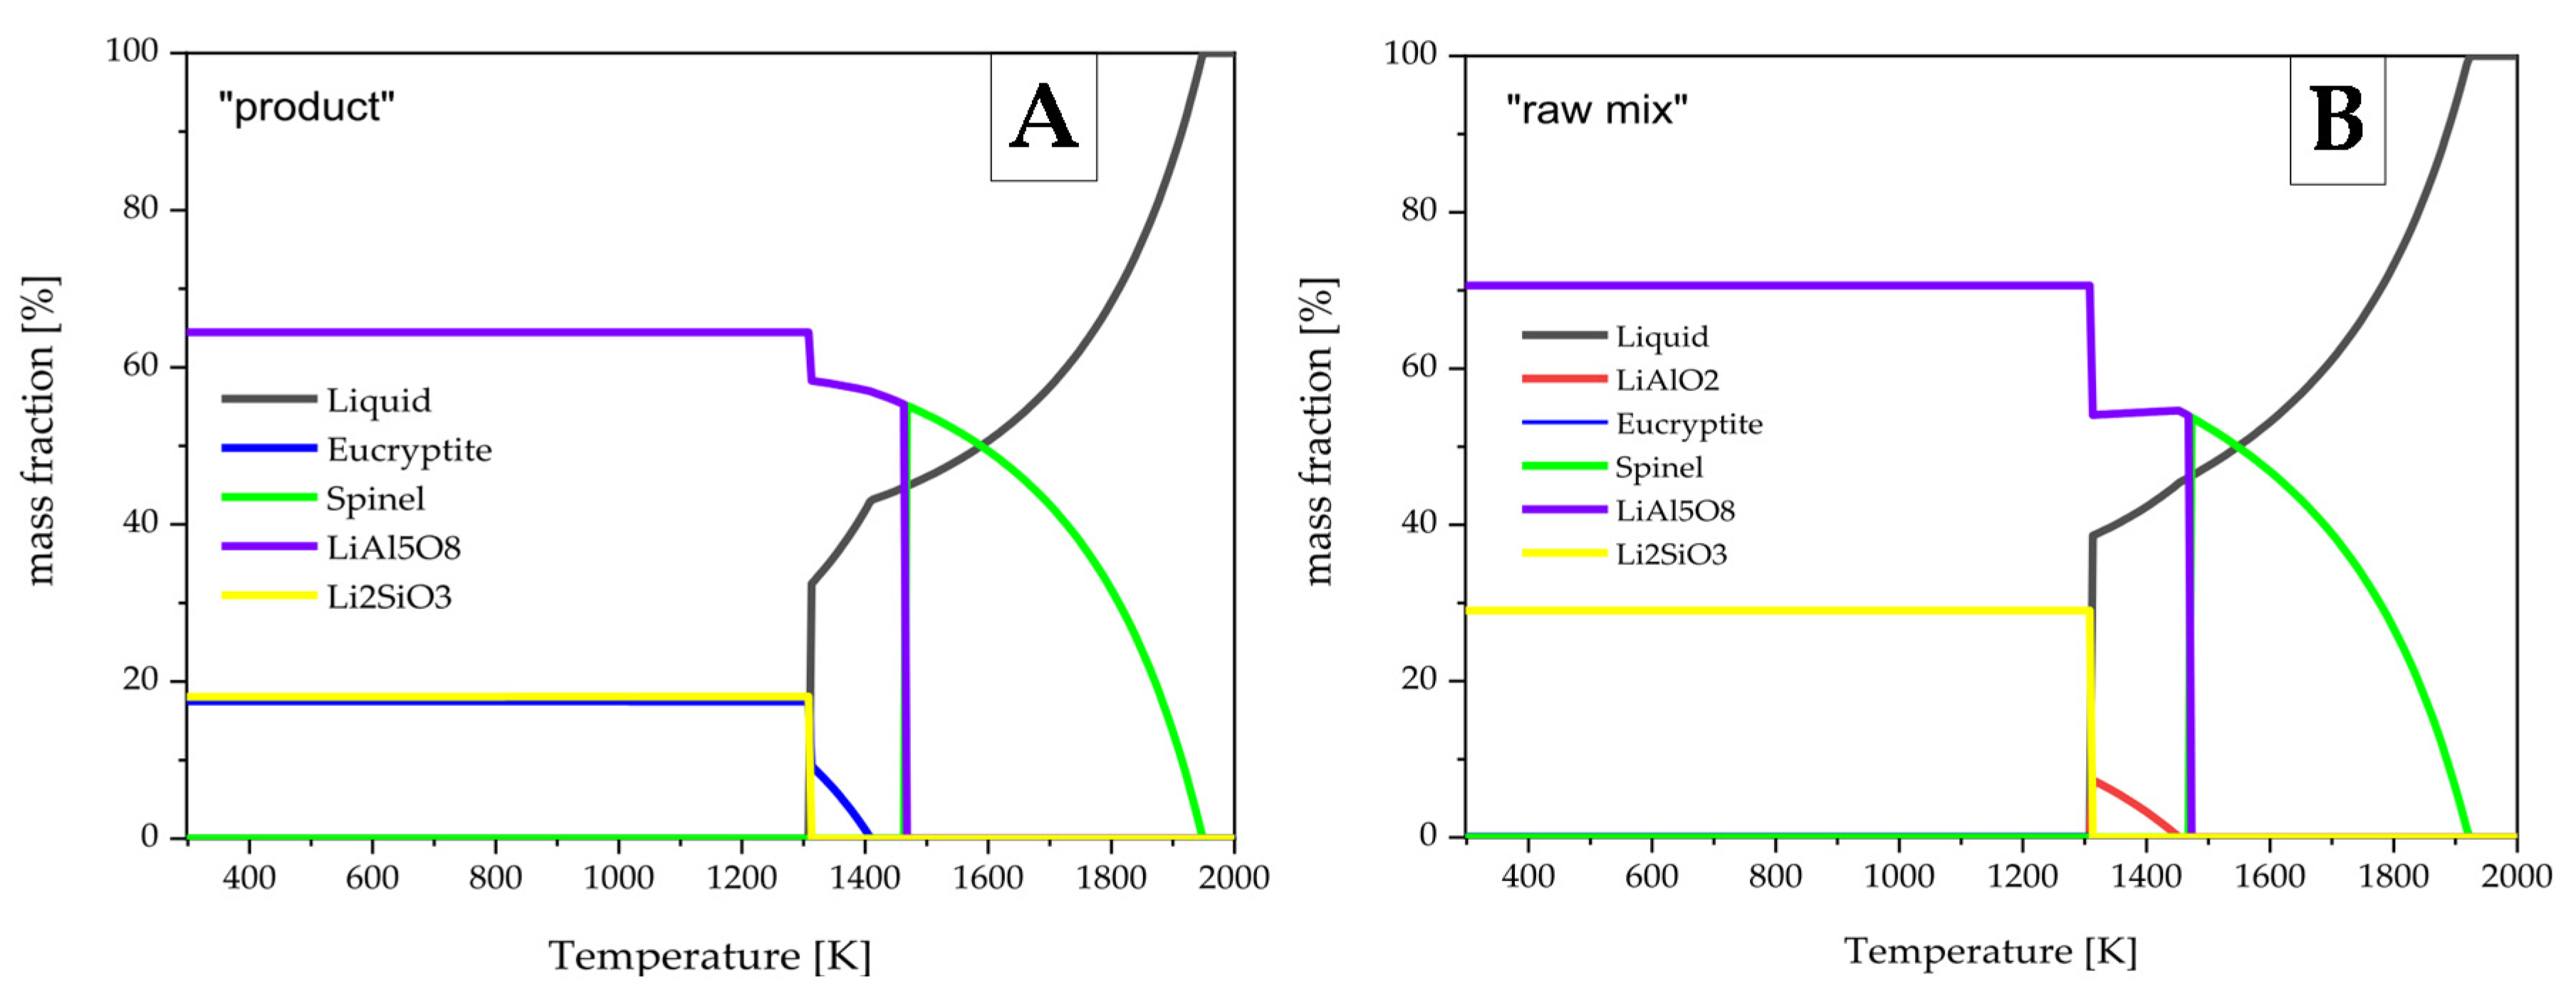
4.4. Comparison of Experimental Findings with Thermodynamically Modeled Subsystems
5. Discussion
5.1. Spinel-Like Oxides
5.2. LiAl and ELAS
5.3. Ca-Alumosilicate
6. Conclusions and Outlook
Author Contributions
Funding
Acknowledgments
Conflicts of Interest
References
- Haas, A.; Elwert, T.; Goldmann, D.; Schirmer, T. Challenges and research needs in flotation of synthetic metal phases, EMPRC 06/25-06/26/2018. In Proceedings of the European Mineral Processing & Recycling Congress; GDMB Verlag GmbH, Ed.; GDMB: Clausthal-Zellerfeld, Germany, 2018; ISBN 978-3-940276-84-1. [Google Scholar]
- Elwert, T.; Goldmann, D.; Schirmer, T.; Strauß, K. Recycling von Li-Ionen-Traktionsbatterien; Recycling und Rohstoffe: Neuruppin, Germany, 2012; pp. 679–690. [Google Scholar]
- Elwert, T.; Strauss, K.; Schirmer, T.; Goldmann, D. Phase composition of high lithium slags from the recycling of lithium ion batteries. World Metall. ERZMETALL 2012, 65, 163–171. [Google Scholar]
- Konar, B.; Dong-Geun, K.; Jung, I.-H. Coupled Phase Diagram Experiments and Thermodynamic Optimization of the Binary Li2O-MgO and Li2O-CaO Systems and Ternary Li2O-MgO-CaO System. Ceram. Int. 2017, 43, 13055–13062. [Google Scholar] [CrossRef]
- Konar, B.; Van Ende, M.-A.; Jung, I.-H. Critical Evaluation and Thermodynamic Optimization of the Li2O-Al2O3 and Li2O-MgO-Al2O3 Systems. Metall. Mater. Trans. B 2018, 49, 2917–2944. [Google Scholar] [CrossRef]
- Aoyama, M.; Yusuke, A.; Koji, I.; Sawao, H.; Shinobu, H.; Iwamoto, Y. Synthesis and Characterization of Lithium Aluminate Red Phosphors. J. Lumin. 2013, 135, 211–215. [Google Scholar] [CrossRef]
- Kale, M.A.; Joshi, C.P.; Moharil, S.V. Combustion Synthesis of Some Compounds in the Li2O-Al2O3 System. Int. J. Self-Propagating High-Temp. Synth. 2012, 21, 19–24. [Google Scholar] [CrossRef]
- Datta, R.K.; Rustum, R. Phase Transitions in LiAl5O8. J. Am. Ceram. Soc. 1963, 46, 388–390. [Google Scholar] [CrossRef]
- Li, X.; Kobayashi, T.; Zhang, F.; Kimoto, K.; Sekine, T. A New High-Pressure Phase of LiAlO2. J. Solid State Chem. 2004, 177, 1939–1943. [Google Scholar] [CrossRef]
- Lewin, E.M.; Robbins, C.R.; McMurdie, H.F.; Reser, M.K. Phase Diagrams for Ceramists. Volume 1: Figures 1-2066. 5; American Ceramic Society: Columbus, OH, USA, 1985; ISBN 10: 0916094049. [Google Scholar]
- Konar, B.; Van Ende, M.-A.; Jung, I.-H. Critical Evaluation and Thermodynamic Optimization of the Li-O, and Li2O-SiO2 Systems. J. Eur. Ceram. Soc. 2017, 37, 2189–2207. [Google Scholar] [CrossRef]
- Konar, B.; Dong-Geun, K.; Jung, I.-H. Critical Thermodynamic Optimization of the Li2O-Al2O3-SiO2 System and Its Application for the Thermodynamic Analysis of the Glass-Ceramics. J. Eur. Ceram. Soc. 2018, 38, 3881–3904. [Google Scholar] [CrossRef]
- Iwatsuki, M.; Norio, T.; Fukasawa, T. Analysis of a Magnesium-Containing: β-Eucryptite Solid Solution by the Lattice Constant Method and Its Application. Bull. Chem. Soc. Jpn. 1975, 48, 1217–1221. [Google Scholar] [CrossRef] [Green Version]
- Downs, R.T.; Hall-Wallace, M. The American Mineralogist Crystal Structure Database. Am. Mineral. 2003, 88, 247–250. [Google Scholar]
- Lafuente, B.; Downs, R.T.; Yang, H.; Stone, N. The power of databases: The RRUFF project. In Highlights in Mineralogical Crystallography; Armbruster, T., Danisi, R.M., Eds.; W. De Gruyter: Berlin, Germany, 2016; pp. 1–30. [Google Scholar]
- Jercinovic, M.J.; Williams, M.L.; Allaz, J.; Donovan, J.J. Trace analysis in EPMA. IOP Conf. Ser. Mater. Sci. Eng. 2012, 32, 012012. [Google Scholar] [CrossRef]
- Merlet, C. Quantitative Electron Probe Microanalysis: New Accurate Φ (ρz) Description. In Electron Microbeam Analysis; Boekestein, A., Pavićević, M.K., Eds.; Springer: Vienna, Austria, 1992; Volume 12, pp. 107–115. [Google Scholar] [CrossRef]
- Pelton, A.D.; Degterov, S.A.; Eriksson, G.; Robelin, C.; Dessureault, Y. The modified quasichemical model I—Binary solutions. Metall. Mater. Trans. B 2000, 31, 651–659. [Google Scholar] [CrossRef]
- Pelton, A.D.; Chartrand, P. The modified quasi-chemical model: Part II. Multicomponent solutions. Metall. Mater. Trans. A 2001, 32, 1355–1360. [Google Scholar] [CrossRef]
- Pelton, A.D. A general “geometric” thermodynamic model for multicomponent solutions. Calphad 2001, 25, 319–328. [Google Scholar] [CrossRef]
- Barry, T.I.; Dinsdale, T.A.T.; Gisby, J.A.; Hallstedt, B.; Hillert, M.; Jansson, B.; Taylor, J.R. The compound energy model for ionic solutions with applications to solid oxides. J. Phase Equilibria 1992, 13, 459–475. [Google Scholar] [CrossRef]
- Bale, C.W.; Bélisle, E.; Chartrand, P.; Decterov, S.A.; Eriksson, G.; Gheribi, A.E.; Hack, K.; Jung, I.H.; Kang, Y.B.; Melançon, J.; et al. FactSage thermochemical software and databases, 2010–2016. Calphad 2016, 54, 35–53. [Google Scholar] [CrossRef] [Green Version]
- Okrusch, M.; Matthes, S. Mineralogie: Eine Einführung in die Spezielle Mineralogie, Petrologie und Lagerstättenkunde, 9th ed.; Springer Spektrum: Berlin, Germany, 2014. [Google Scholar]
- Shannon, R.D. Revised effective ionic radii and systematic studies of interatomic distances in halides and chalcogenides. Acta Crystallogr. Sect. A 1976, 32, 751–767. [Google Scholar] [CrossRef]
- Ahmadein, M.; Wu, M.; Ludwig, A. Analysis of Macrosegregation Formation and Columnar-to-Equiaxed Transition during Solidification of Al-4wt.% Cu Ingot Using a 5-Phase Model. J. Cryst. Growth 2015, 417, 65–74. [Google Scholar] [CrossRef] [PubMed] [Green Version]


| Sample | Li2CO3 | CaCO3 | SiO2 | Al2O3 | MgO |
|---|---|---|---|---|---|
| Content | % | % | % | % | % |
| 1 | 22.87 | 22.40 | 16.36 | 32.97 | 5.40 |
| 2 | 22.51 | 21.55 | 16.08 | 32.17 | 7.70 |
| 3 | 22.32 | 21.24 | 15.63 | 31.54 | 9.27 |
| wt.% | Average Spod. | %StDev., Spod. | Ref. Spod. | R (%) | Average LiAl | %StDev., LiAl | Ref. LiAl | R (%) |
|---|---|---|---|---|---|---|---|---|
| Al | 15.04 | 0.35 | 14.4 | 104 | 41.24 | 0.22 | 40.9 | 101 |
| Mg | 0.00 | n. a. | 0.0 | n. a. | 0.01 | n. a. | 0.0 | n. a. |
| Ti | 0.00 | n. a. | 0.0 | n. a. | 0.00 | n. a. | 0.0 | n. a. |
| Mn | 0.05 | n. a. | 0.0 | n. a. | 0.00 | n. a. | 0.0 | n. a. |
| Fe | 0.02 | n. a. | 0.0 | n. a. | 0.03 | n. a. | 0.0 | n. a. |
| Ca | 0.01 | n. a. | 0.0 | n. a. | 0.01 | n. a. | 0.0 | n. a. |
| K | 0.00 | n. a. | 0.0 | n. a. | 0.00 | n. a. | 0.0 | n. a. |
| Si | 28.71 | 0.56 | 30.0 | 96 | 0.01 | n. a. | 0.0 | n. a. |
| Na | 0.10 | 2.83 | 0.09 | 112 | 0.00 | n. a. | 0.0 | n. a. |
| Raw Mix (Mole Fraction) | Product (Mole Fraction) | Recovery % | |||||||
|---|---|---|---|---|---|---|---|---|---|
| V1 | V2 | V3 | V1 | V2 | V3 | V1 | V2 | V3 | |
| Al2O3 | 32.90 | 32.10 | 31.48 | 34.21 | 33.64 | 33.63 | 3.99 | 4.79 | 6.86 |
| CaO | 22.35 | 21.50 | 21.19 | 22.79 | 22.57 | 22.13 | 1.97 | 4.95 | 4.44 |
| Li2O | 22.81 | 22.46 | 22.28 | 20.00 | 18.69 | 17.57 | −12.35 | −16.77 | −21.11 |
| MgO | 5.32 | 7.59 | 9.14 | 5.32 | 8.27 | 9.90 | −0.11 | 9.03 | 8.32 |
| SiO2 | 16.32 | 16.05 | 15.60 | 17.43 | 16.59 | 16.53 | 6.81 | 3.40 | 5.98 |
| Na2O | 0.3 | 0.3 | 0.3 | 0.3 | 0.23 | 0.2 | −14.0 | −21.4 | −28.6 |
| wt.% | Virtual Compounds | ELAS (Opt.) | ELAS, Meas. | ELAS %StDev. | LiAl (Opt.) | LiAl (Meas.) | LiAl %StDev. | ||
|---|---|---|---|---|---|---|---|---|---|
| LiAlO2 | Mg0.5AlO2 | SiO2 | |||||||
| Al | 40.9 | 37.9 | 0.0 | 20.1 | 20.1 | 3.2 | 38.9 | 38.9 | 1.4 |
| Mg | 0.0 | 17.1 | 0.0 | 3.1 | 3.0 | 7.5 | 0.0 | 0.0 | n. a. |
| Ti | 0.0 | 0.0 | 0.0 | 0.0 | 0.0 | n. a. | 0.0 | 0.0 | n. a. |
| Mn | 0.0 | 0.0 | 0.0 | 0.0 | 0.1 | n. a. | 0.0 | 0.0 | n. a. |
| Fe | 0.0 | 0.0 | 0.0 | 0.0 | 0.1 | n. a. | 0.0 | 0.1 | n. a. |
| Ca | 0.0 | 0.0 | 0.0 | 0.0 | 0.0 | 8.9 | 0.0 | 0.0 | n. a. |
| K | 0.0 | 0.0 | 0.0 | 0.0 | 0.0 | n. a. | 0.0 | 0.0 | n. a. |
| Si | 0.0 | 0.0 | 46.7 | 23.2 | 22.4 | 3.6 | 2.5 | 2.5 | 18.3 |
| Na | 0.0 | 0.0 | 0.0 | 0.0 | 0.0 | n. a. | 0.0 | 0.0 | n. a. |
| O (Calc.) | 48.5 | 45.0 | 53.3 | 50.2 | 49.5 | n. a. | 49.0 | 49.1 | n. a. |
| Li (Calc.) | 10.5 | 0.0 | 0.0 | 3.4 | 3.4 | n. a. | 10.01 | 10.01 | n. a. |
| Mult. | 0.33 | 0.18 | 0.49 | ← Multiplication factors for ELAS (Opt.) | |||||
| Mult. | 0.95 | 0 | 0.049 | ← Multiplication factors for LiAl (Opt.) | |||||
| Sum | 100 | 100 | 100 | 100 | 98.7 | 100.4 | 100.6 | ||
| wt.% | Virtual Compounds | LiAl (Opt.) | LiAl (Dend.) (Meas.) | LiAl (Dend.) % StDev. | |
|---|---|---|---|---|---|
| LiAlO2 | SiO2 | ||||
| Al | 40.9 | 0.0 | 40.3 | 40.3 | 0.4 |
| Mg | 0.0 | 0.0 | 0.0 | 0.0 | n. a. |
| Ti | 0.0 | 0.0 | 0.0 | 0.0 | n. a. |
| Mn | 0.0 | 0.0 | 0.0 | 0.0 | n. a. |
| Fe | 0.0 | 0.0 | 0.0 | 0.0 | n. a. |
| Ca | 0.0 | 0.0 | 0.0 | 0.0 | n. a. |
| K | 0.0 | 0.0 | 0.0 | 0.0 | n. a. |
| Si | 0.0 | 46.7 | 1.1 | 1.1 | 12.3 |
| Na | 0.0 | 0.0 | 0.0 | 0.0 | n. a. |
| O (Calc.) | 48.5 | 53.3 | 49.0 | 49.1 | n. a. |
| Li (Calc.) | 10.5 | 0.0 | 10.36 | 10.36 | n. a. |
| Mult. | 0.98 | 0.024 | ← Multiplication factors for LiAl (Opt.) | ||
| Sum | 100 | 100 | 100.8 | 100.9 | |
| wt.% | Virtual Compounds | ||||
|---|---|---|---|---|---|
| Li2Si3O7 | Na2Si3O7 | Ca2AL2SiO7 | Ca2MgSi2O7 | Ca3Si2O7 | |
| Al | 0.0 | 0.0 | 19.7 | 0.0 | 0.0 |
| Mg | 0.0 | 0.0 | 0.0 | 8.9 | 0.0 |
| Ti | 0.0 | 0.0 | 0.0 | 0.0 | 0.0 |
| Mn | 0.0 | 0.0 | 0.0 | 0.0 | 0.0 |
| Fe | 0.0 | 0.0 | 0.0 | 0.0 | 0.0 |
| Ca | 0.0 | 0.0 | 29.2 | 29.4 | 41.7 |
| K | 0.0 | 0.0 | 0.0 | 0.0 | 0.0 |
| Si | 40.1 | 34.8 | 10.2 | 20.6 | 19.5 |
| Na | 0.0 | 19.0 | 0.0 | 0.0 | 0.0 |
| O (Calc.) | 53.3 | 46.2 | 40.8 | 41.1 | 38.8 |
| Li (Calc.) | 6.6 | 0.0 | 0.0 | 0.0 | 0.0 |
| Multiplicator | |||||
| GCAS | 0.00 | 0.00 | 0.98 | 0.03 | 0.00 |
| MCAS | 0.092 | 0.084 | 0.40 | 0.33 | 0.093 |
| Sum | 100 | 100 | 100 | 100 | 100 |
| wt.% | GCAS (Opt.) | GCAS (meas.) | GCAS %StDev. | MCAS (Opt.) | MCAS Meas. | MCAS %StDev. |
|---|---|---|---|---|---|---|
| Al | 19.2 | 19.2 | 2.8 | 7.87 | 7.87 | 10.7 |
| Mg | 0.3 | 0.3 | 46.0 | 2.94 | 2.94 | 5.2 |
| Ti | 0.0 | 0.0 | n. a. | 0.00 | 0.01 | n. a. |
| Mn | 0.0 | 0.0 | n. a. | 0.00 | 0.02 | n. a. |
| Fe | 0.0 | 0.1 | n. a. | 0.00 | 0.07 | n. a. |
| Ca | 29.4 | 29.4 | 0.4 | 25.25 | 25.25 | 4.0 |
| K | 0.0 | 0.0 | n. a. | 0.00 | 0.02 | n. a. |
| Si | 10.6 | 10.2 | 4.4 | 19.29 | 19.29 | 3.5 |
| Na | 0.0 | 0.0 | n. a. | 1.59 | 1.59 | 23.5 |
| O (Calc.) | 41.1 | 40.6 | n. a. | 42.25 | 42.29 | n. a. |
| Li (Calc.) | 0.0 | 0.0 | n. a. | 0.61 | 0.61 | n. a. |
| Sum | 100.6 | 99.7 | 99.8 | 100.0 |
Publisher’s Note: MDPI stays neutral with regard to jurisdictional claims in published maps and institutional affiliations. |
© 2020 by the authors. Licensee MDPI, Basel, Switzerland. This article is an open access article distributed under the terms and conditions of the Creative Commons Attribution (CC BY) license (http://creativecommons.org/licenses/by/4.0/).
Share and Cite
Schirmer, T.; Qiu, H.; Li, H.; Goldmann, D.; Fischlschweiger, M. Li-Distribution in Compounds of the Li2O-MgO-Al2O3-SiO2-CaO System—A First Survey. Metals 2020, 10, 1633. https://doi.org/10.3390/met10121633
Schirmer T, Qiu H, Li H, Goldmann D, Fischlschweiger M. Li-Distribution in Compounds of the Li2O-MgO-Al2O3-SiO2-CaO System—A First Survey. Metals. 2020; 10(12):1633. https://doi.org/10.3390/met10121633
Chicago/Turabian StyleSchirmer, Thomas, Hao Qiu, Haojie Li, Daniel Goldmann, and Michael Fischlschweiger. 2020. "Li-Distribution in Compounds of the Li2O-MgO-Al2O3-SiO2-CaO System—A First Survey" Metals 10, no. 12: 1633. https://doi.org/10.3390/met10121633