


Training Characteristics, Performance, and Body Composition of Three U23 Elite Female Triathletes throughout a Season


Abstract
:1. Introduction
2. Materials and Methods
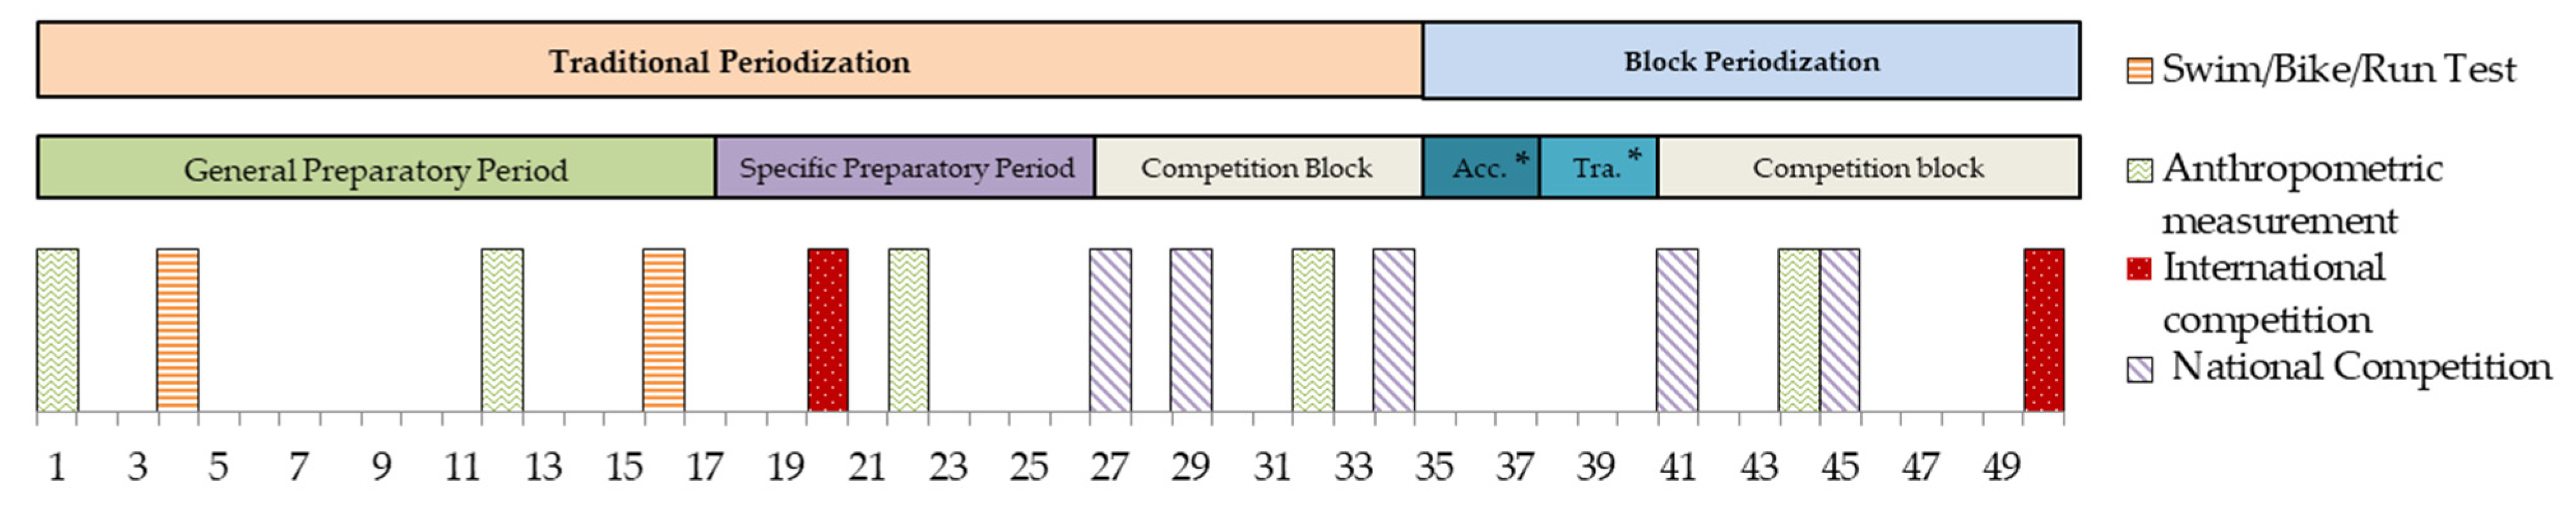
2.1. Experimental Design
2.2. Participants
2.3. Data Collection
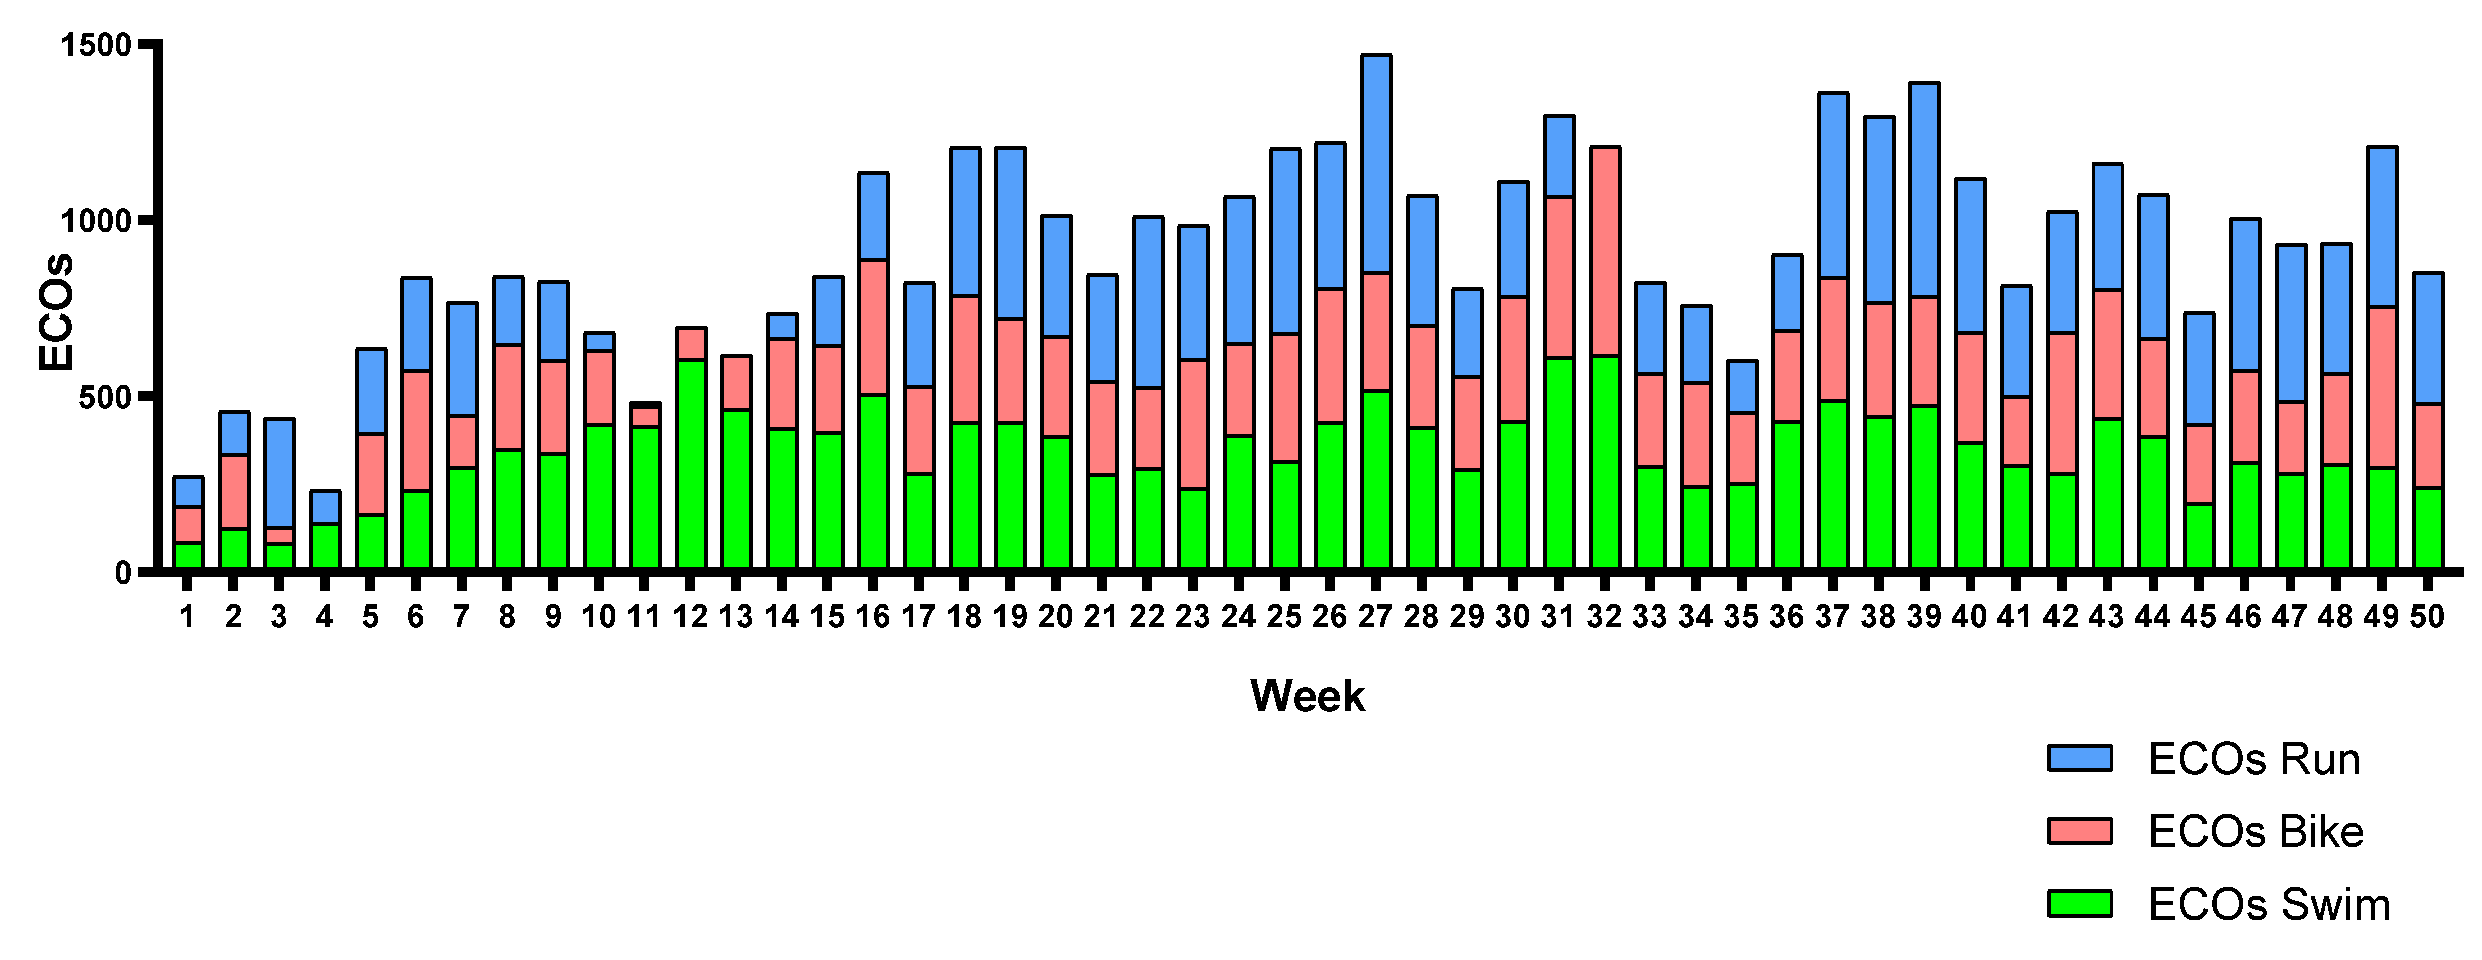
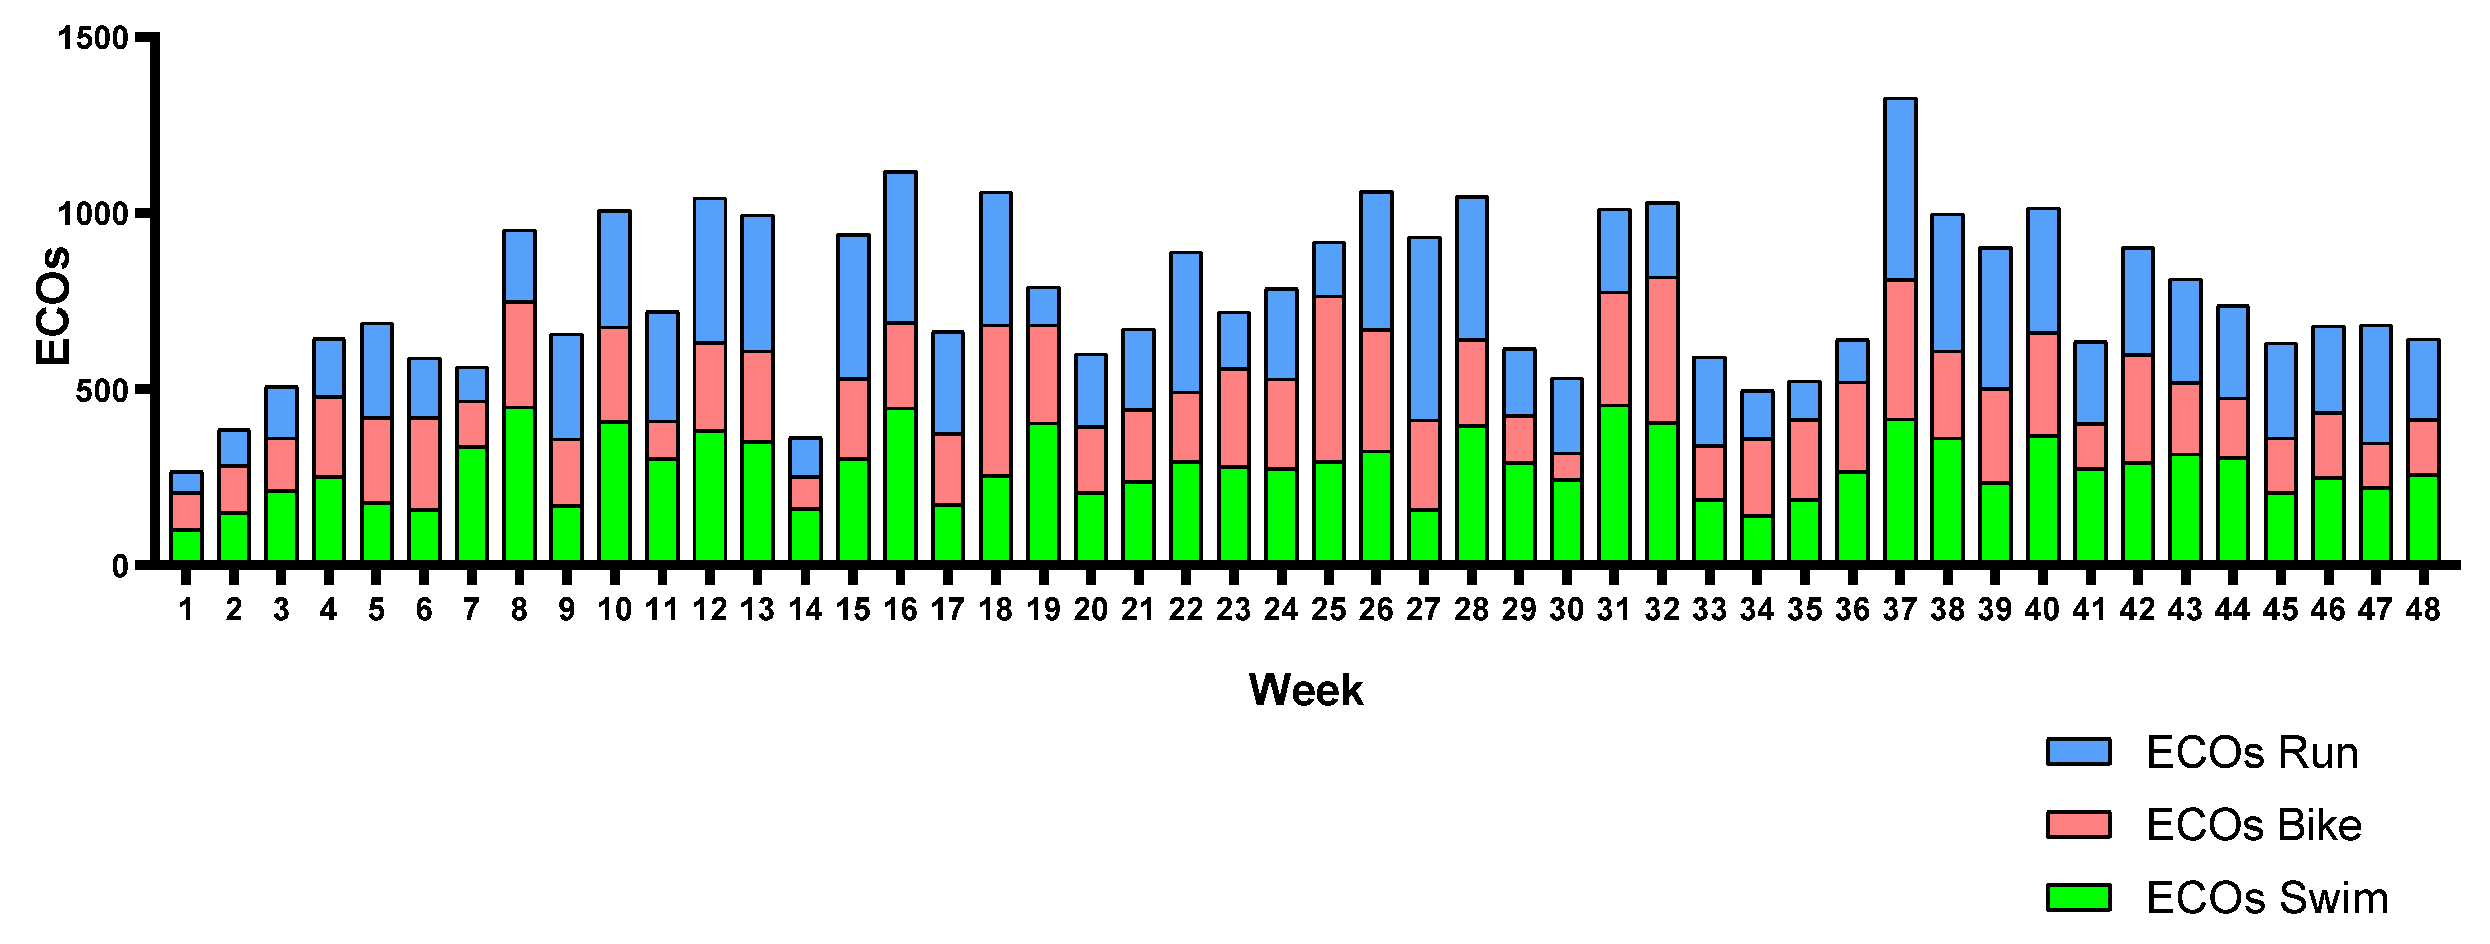
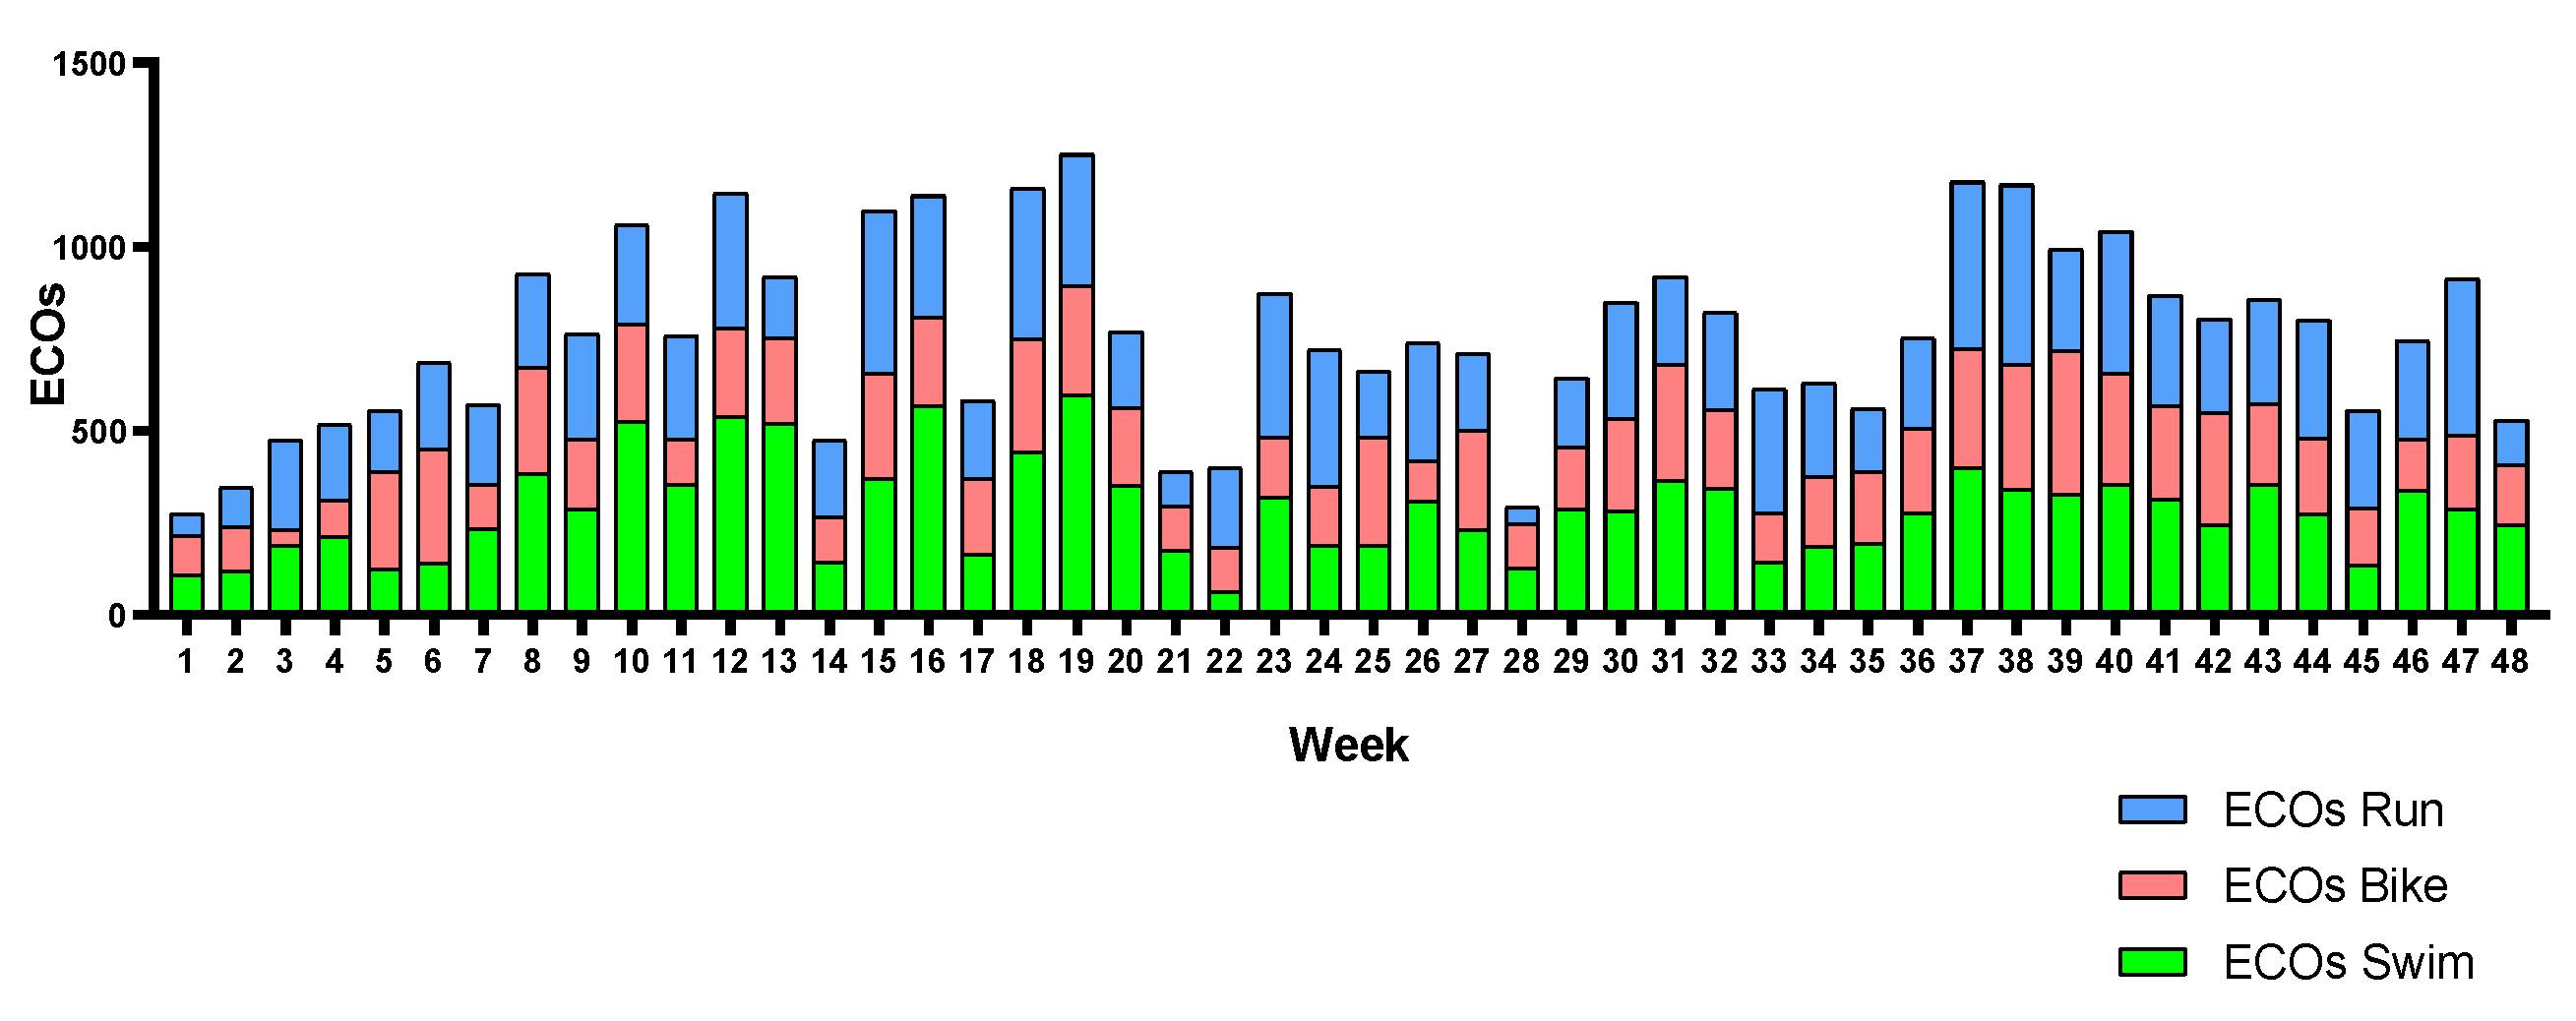
2.4. Training Characteristics and Control of the Training Load
2.5. Data Analysis
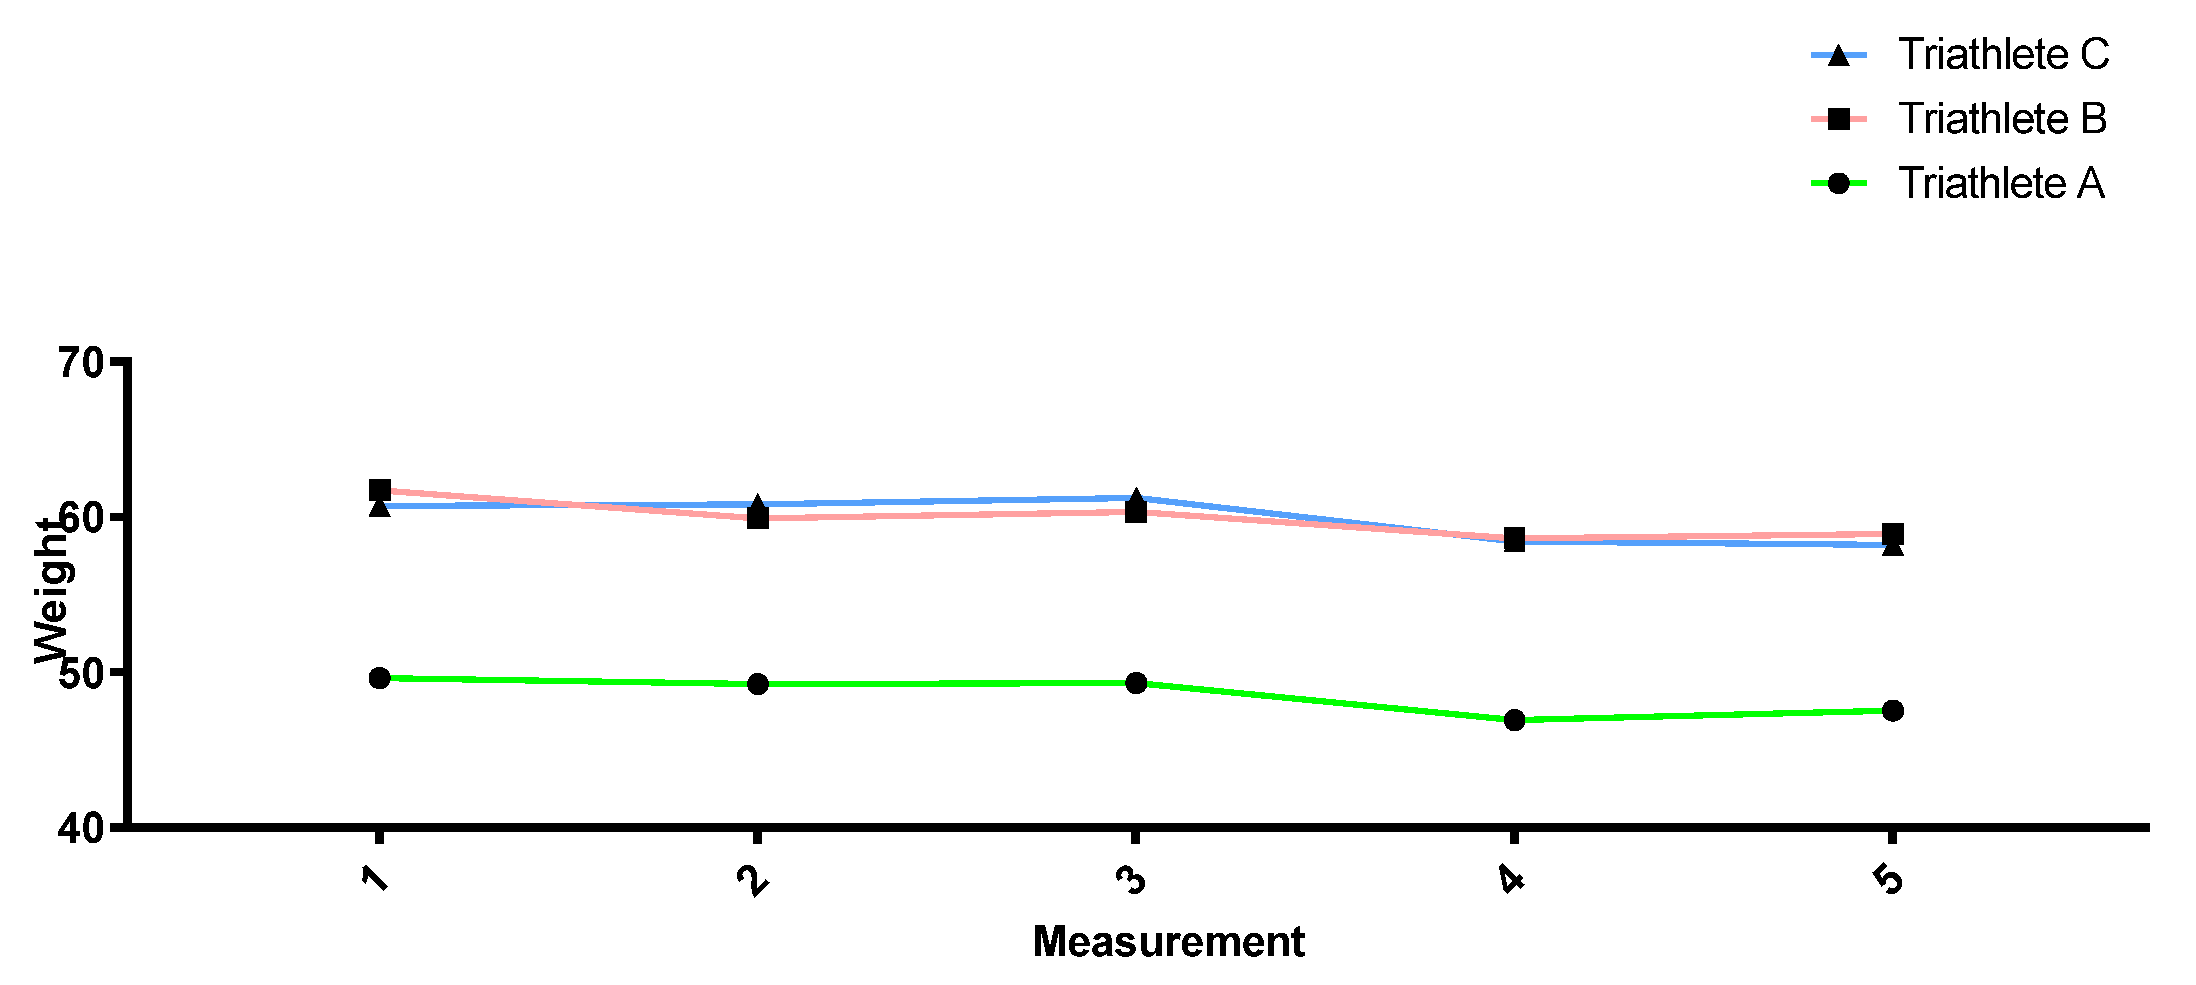
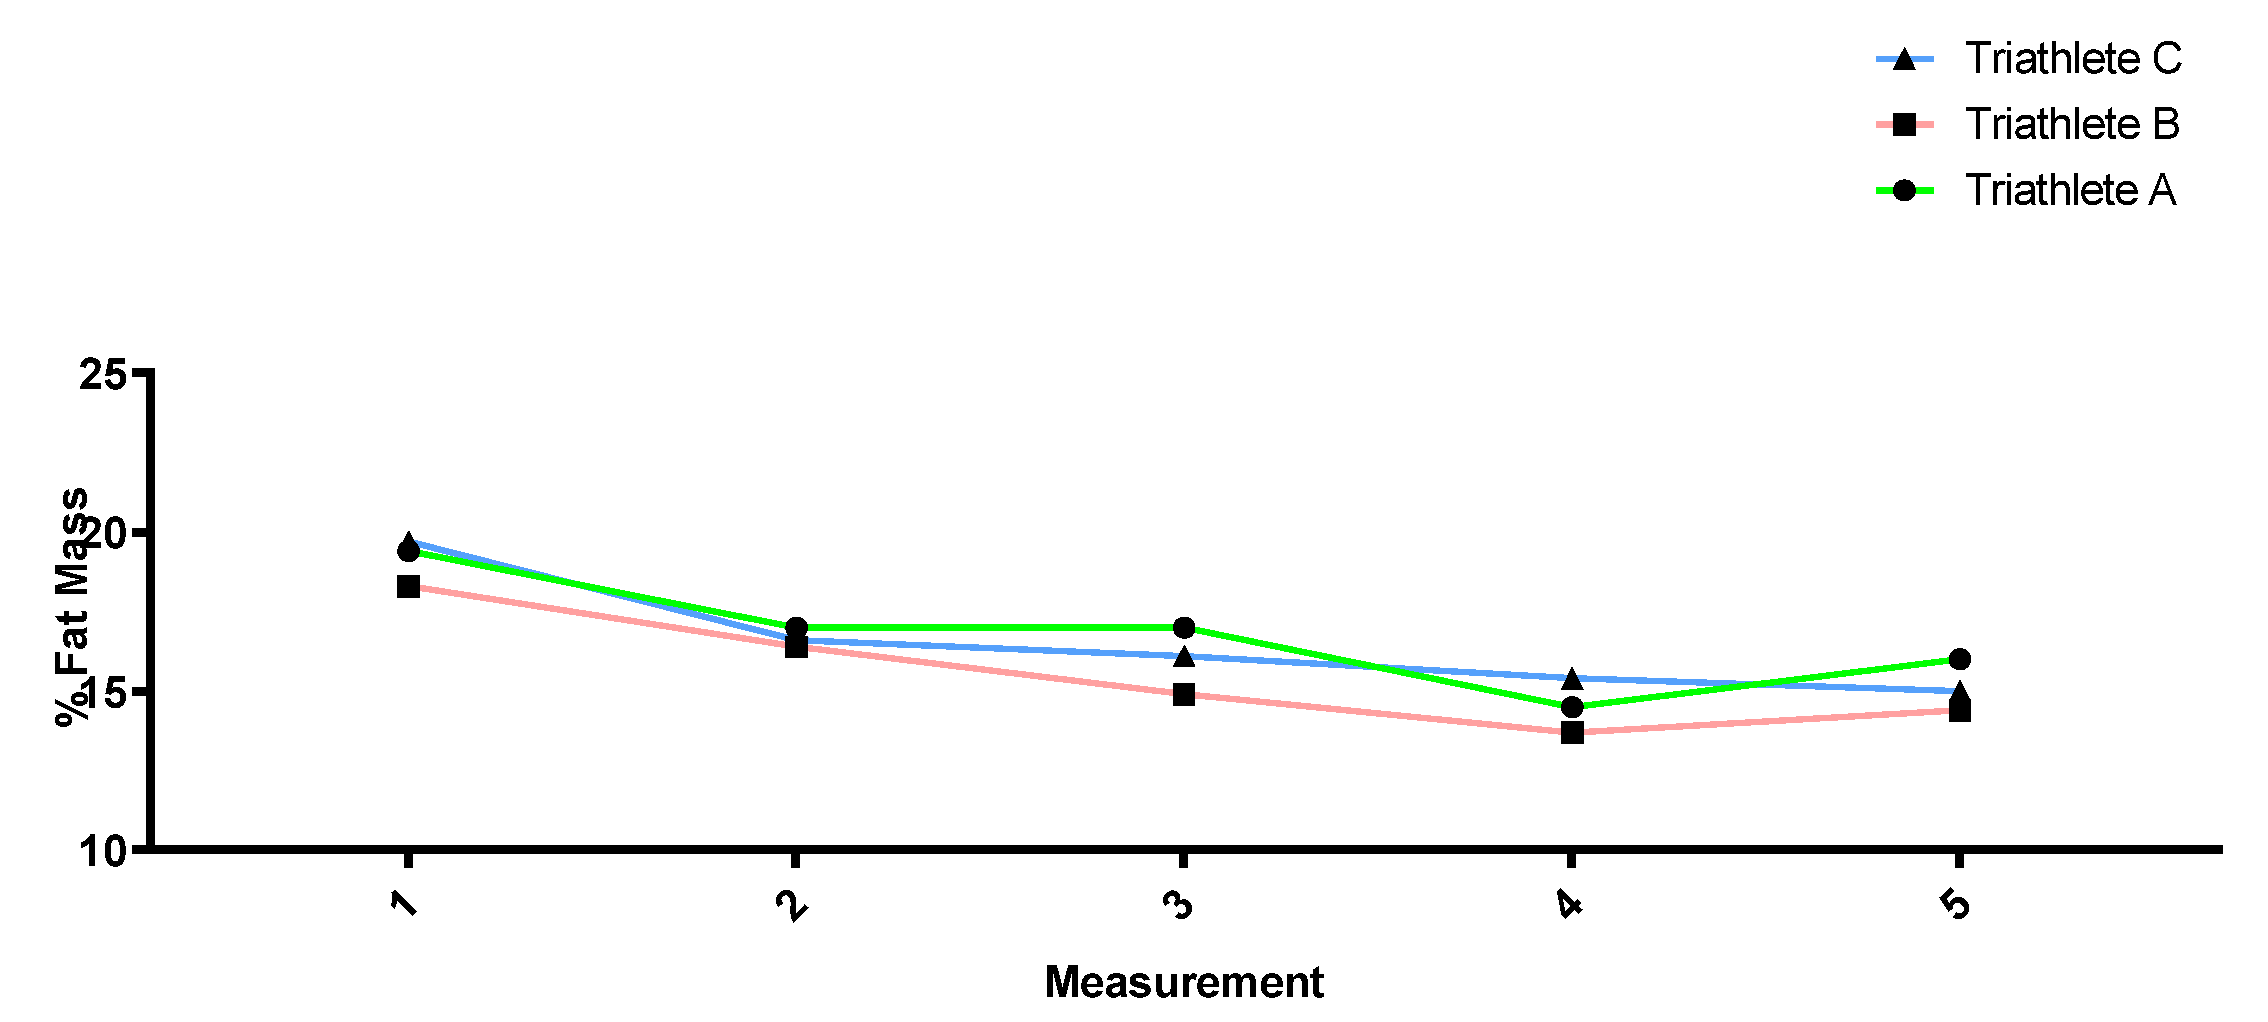
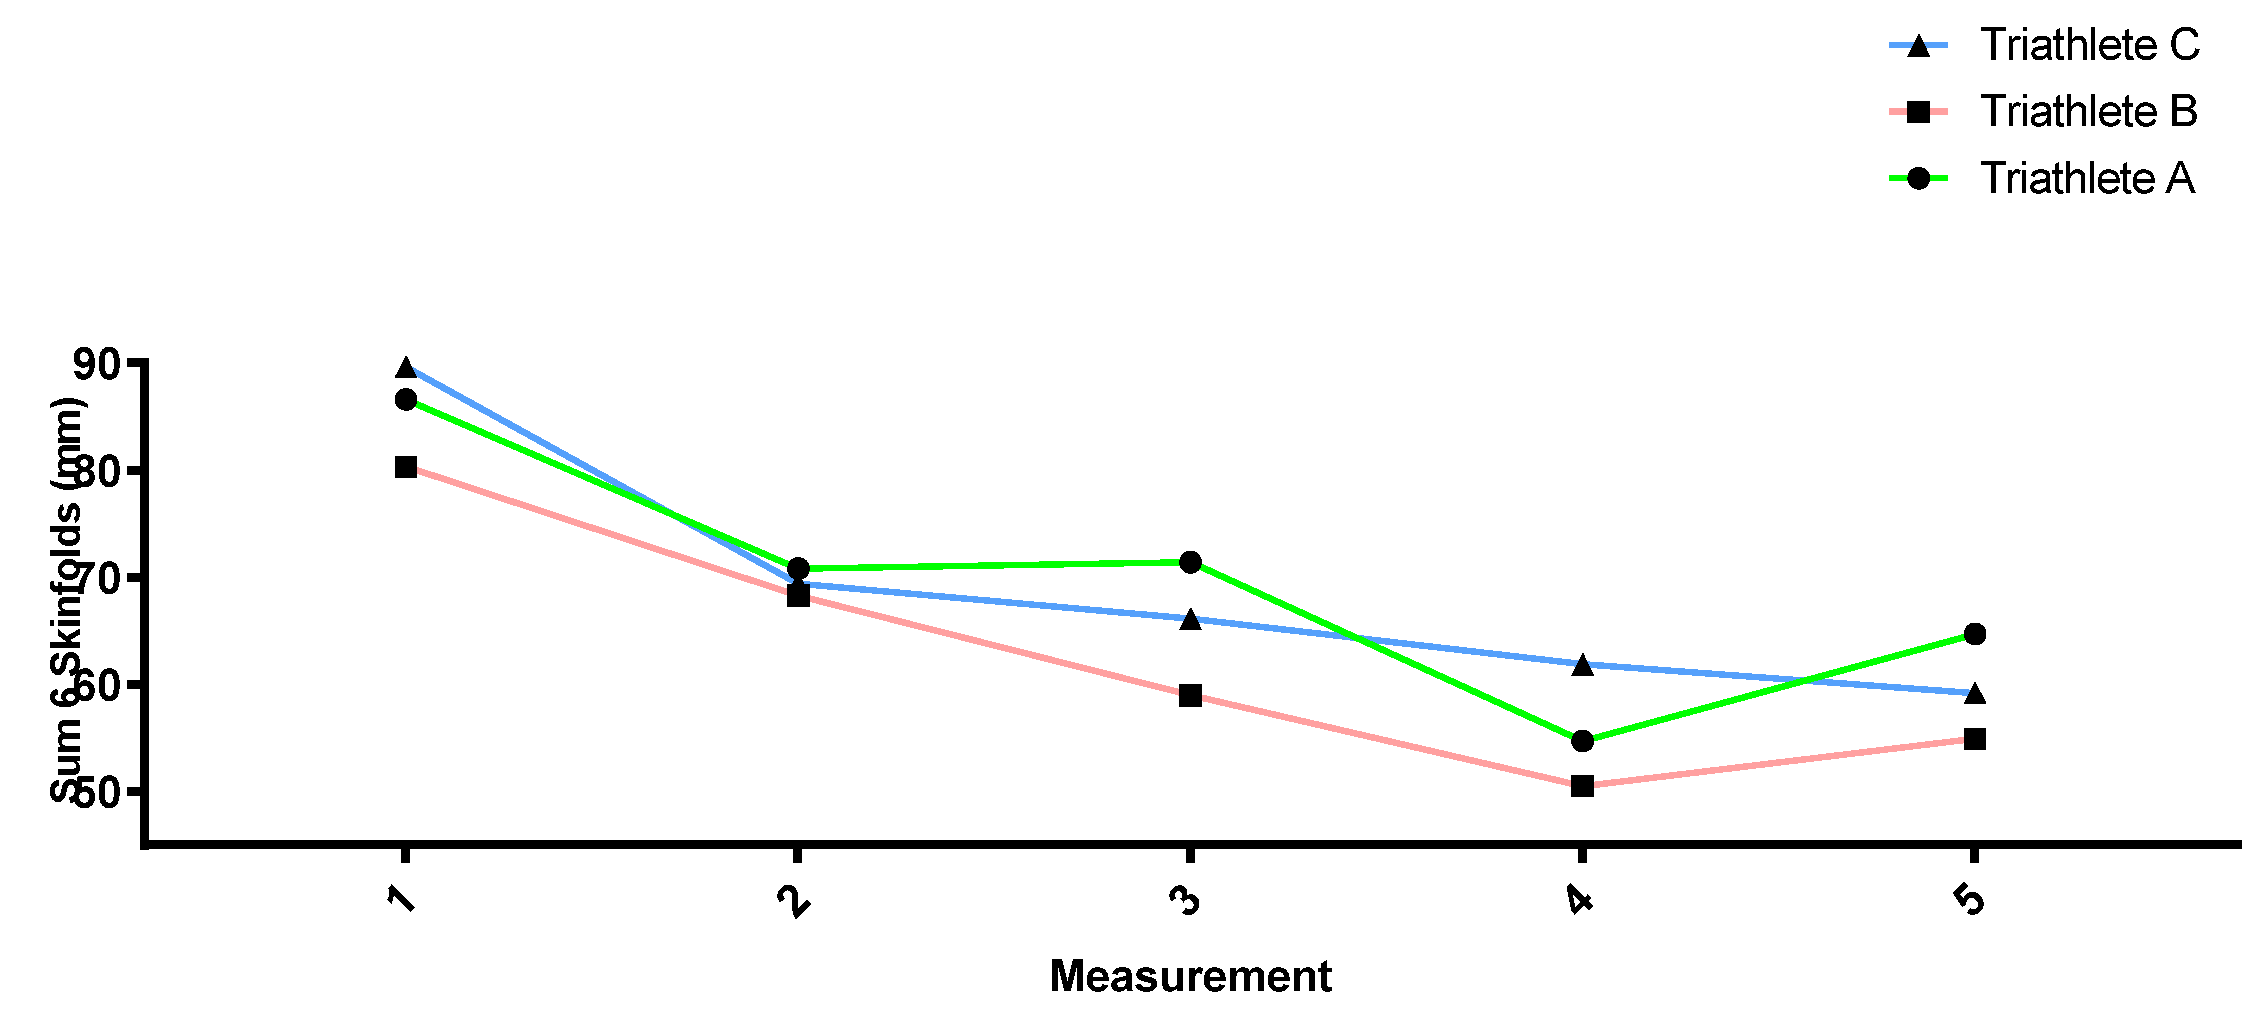
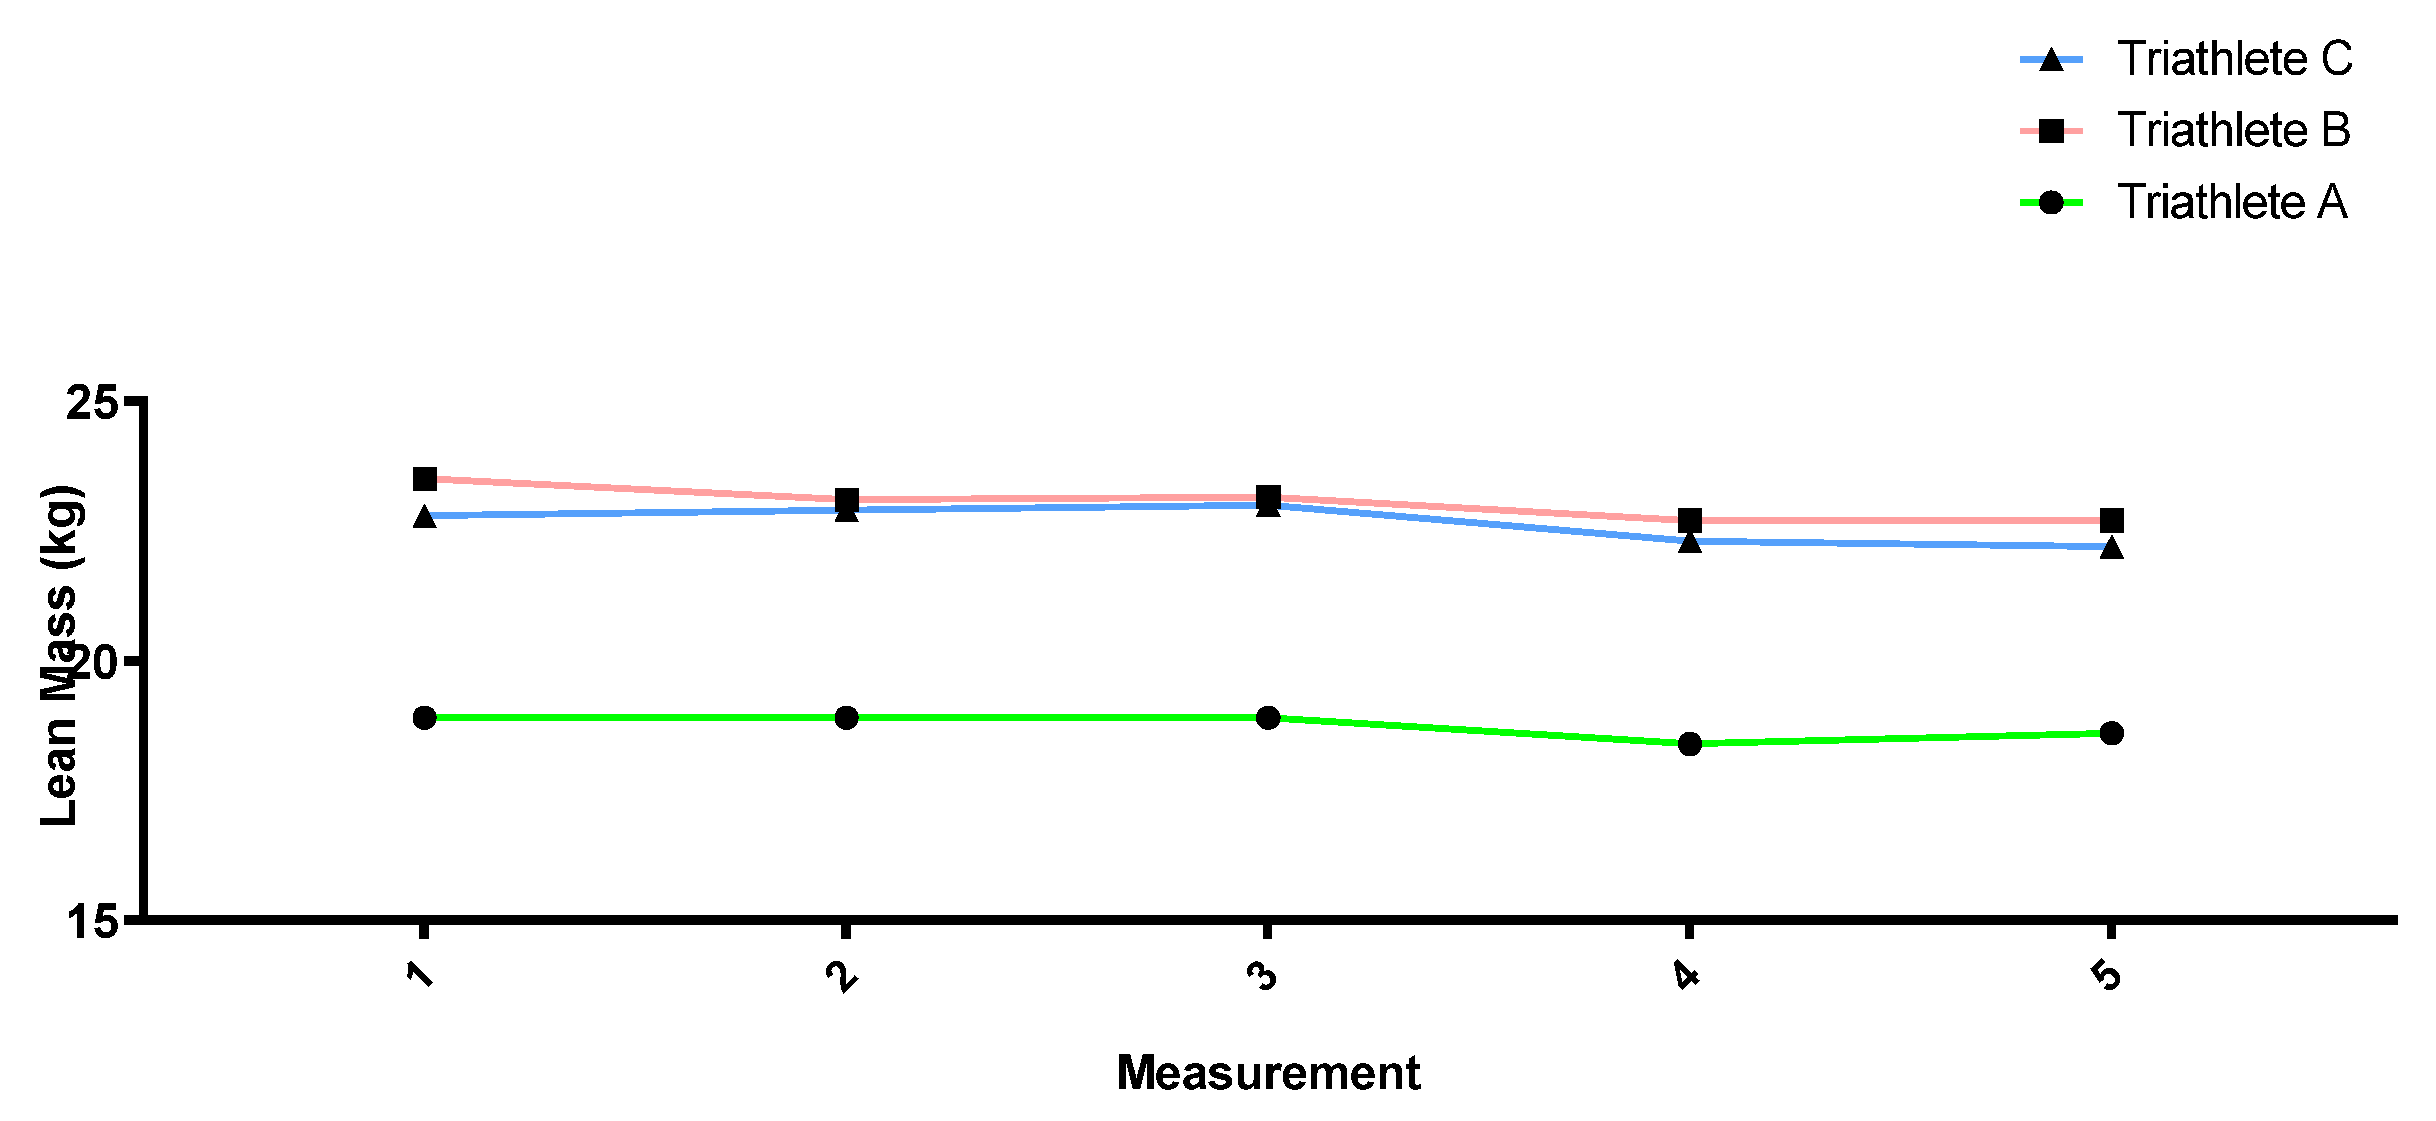
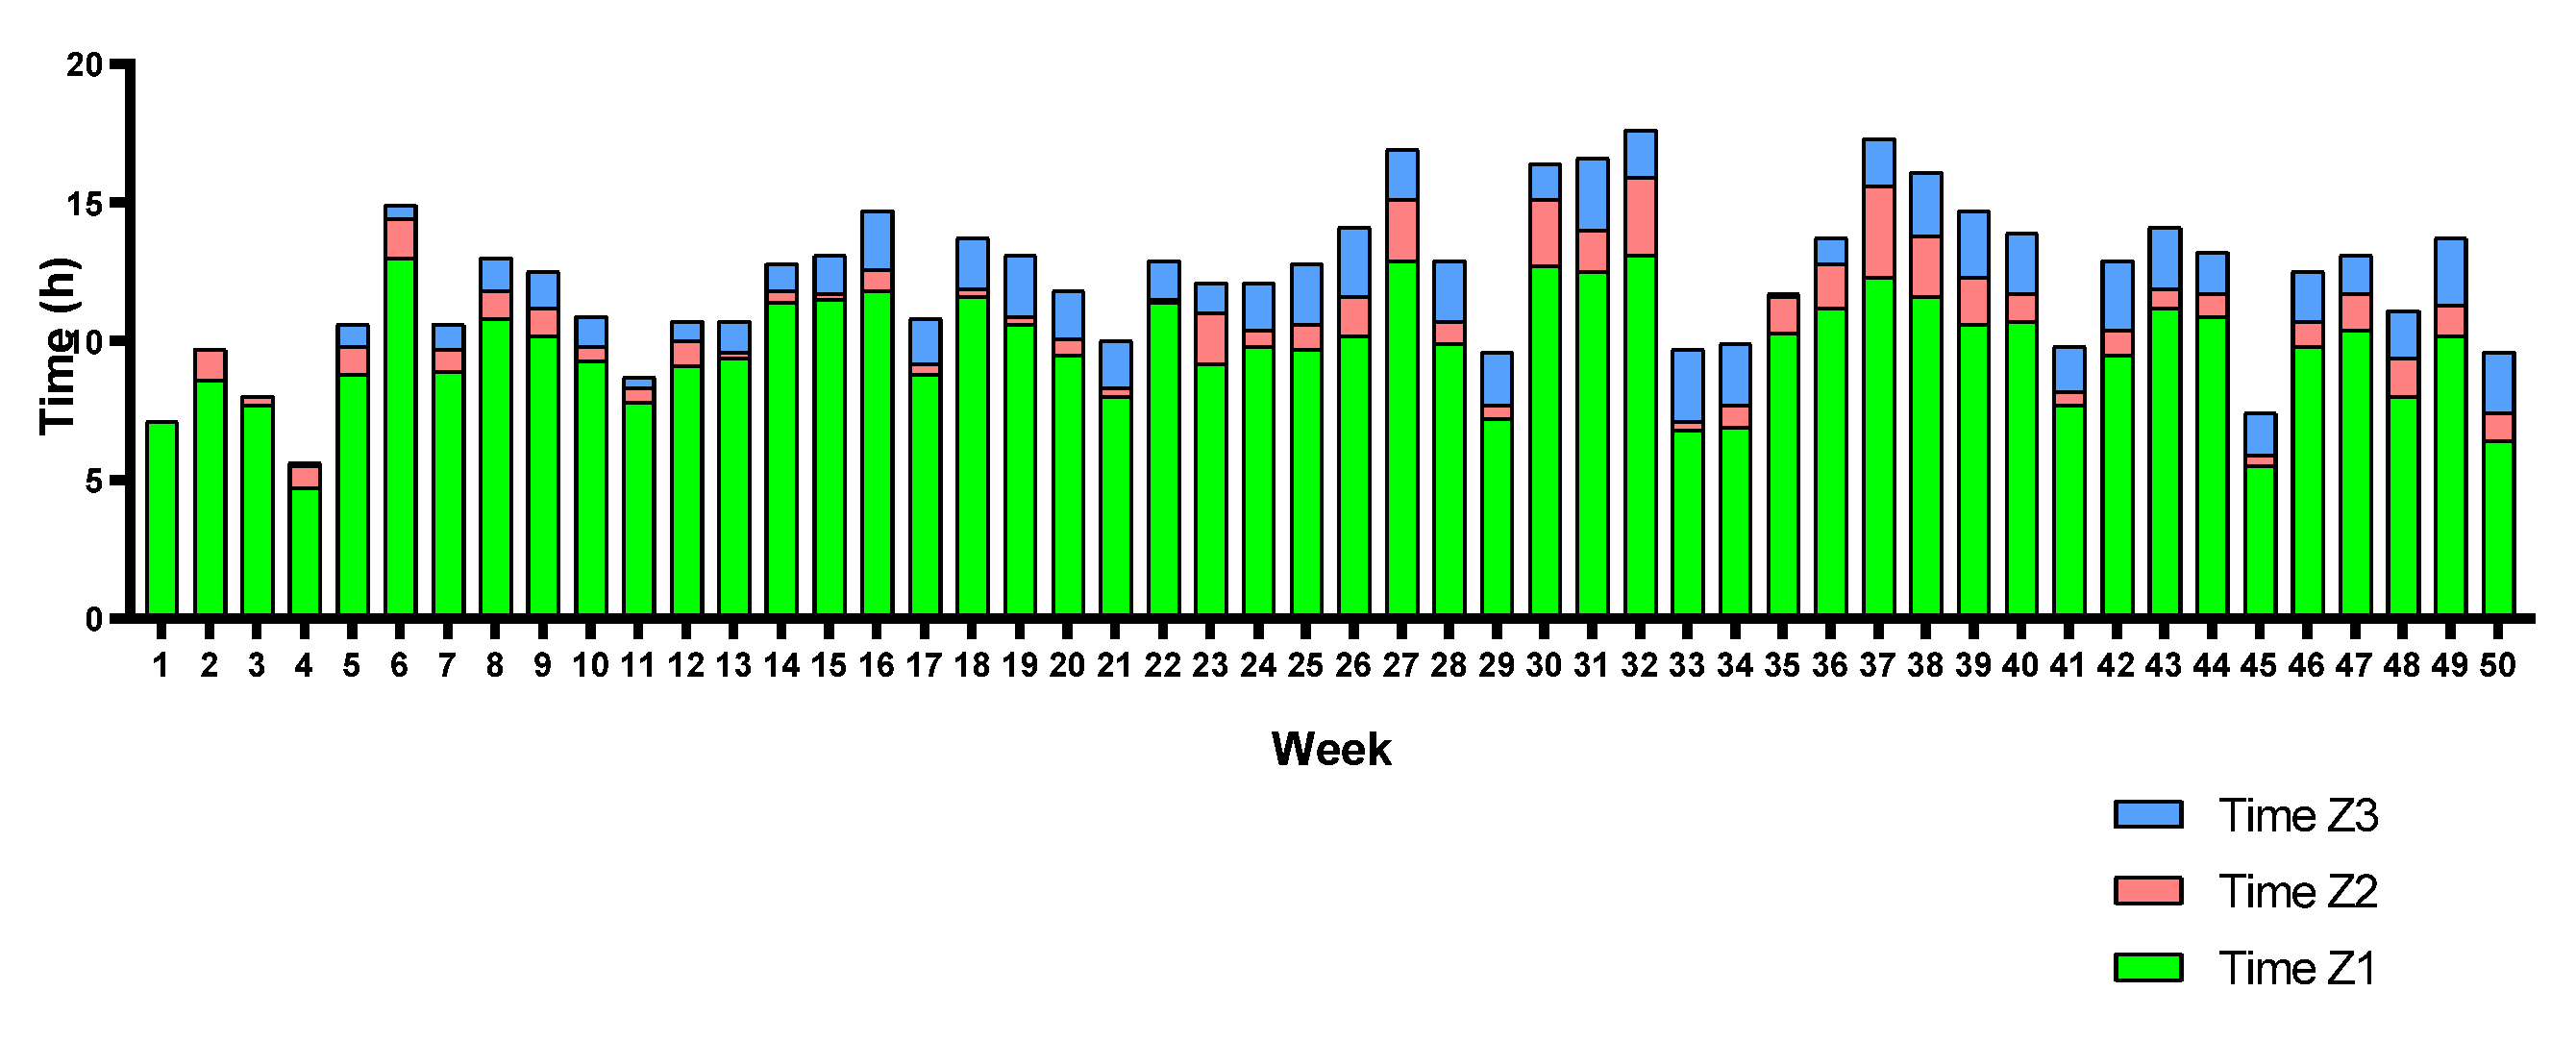
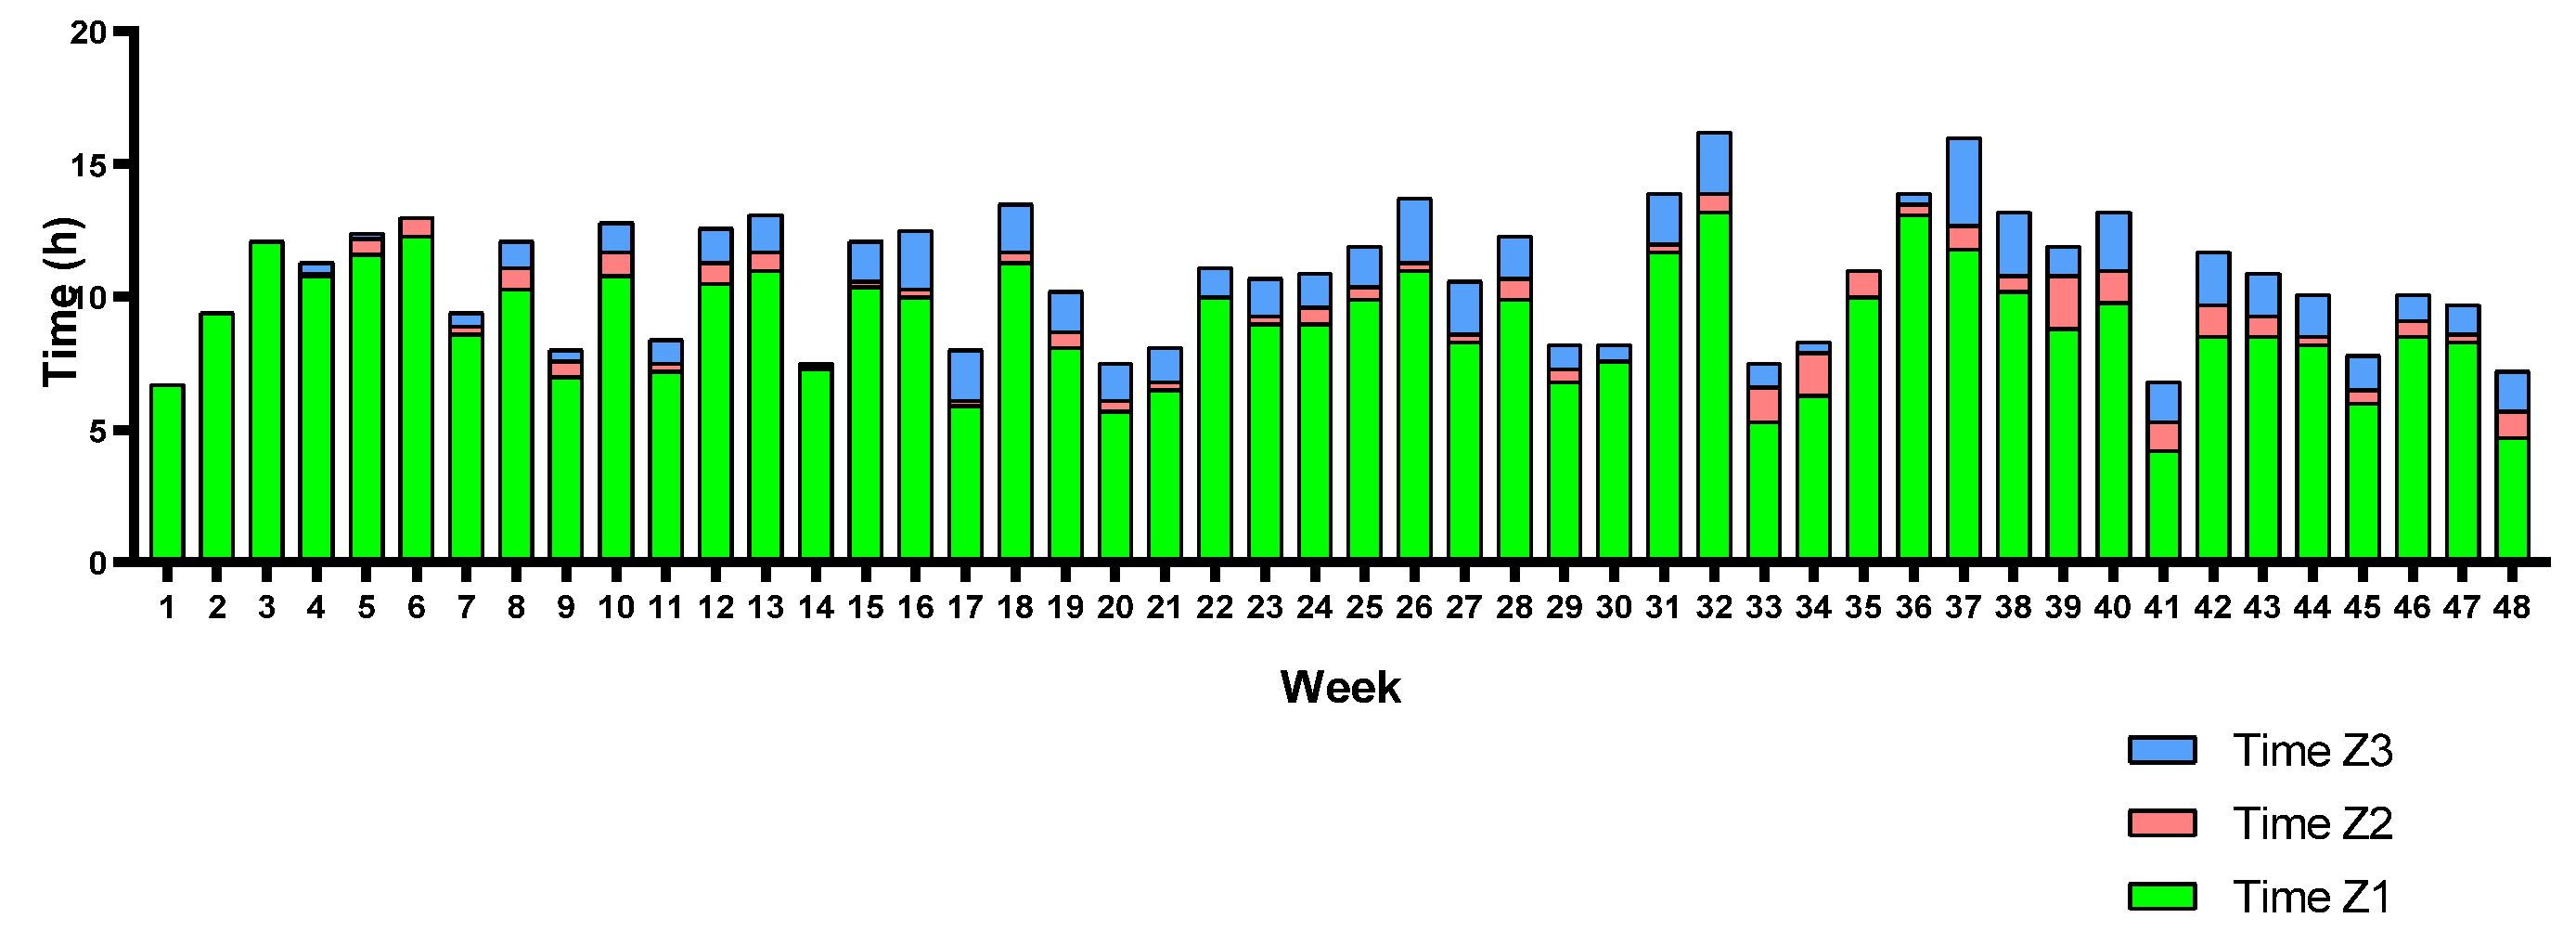
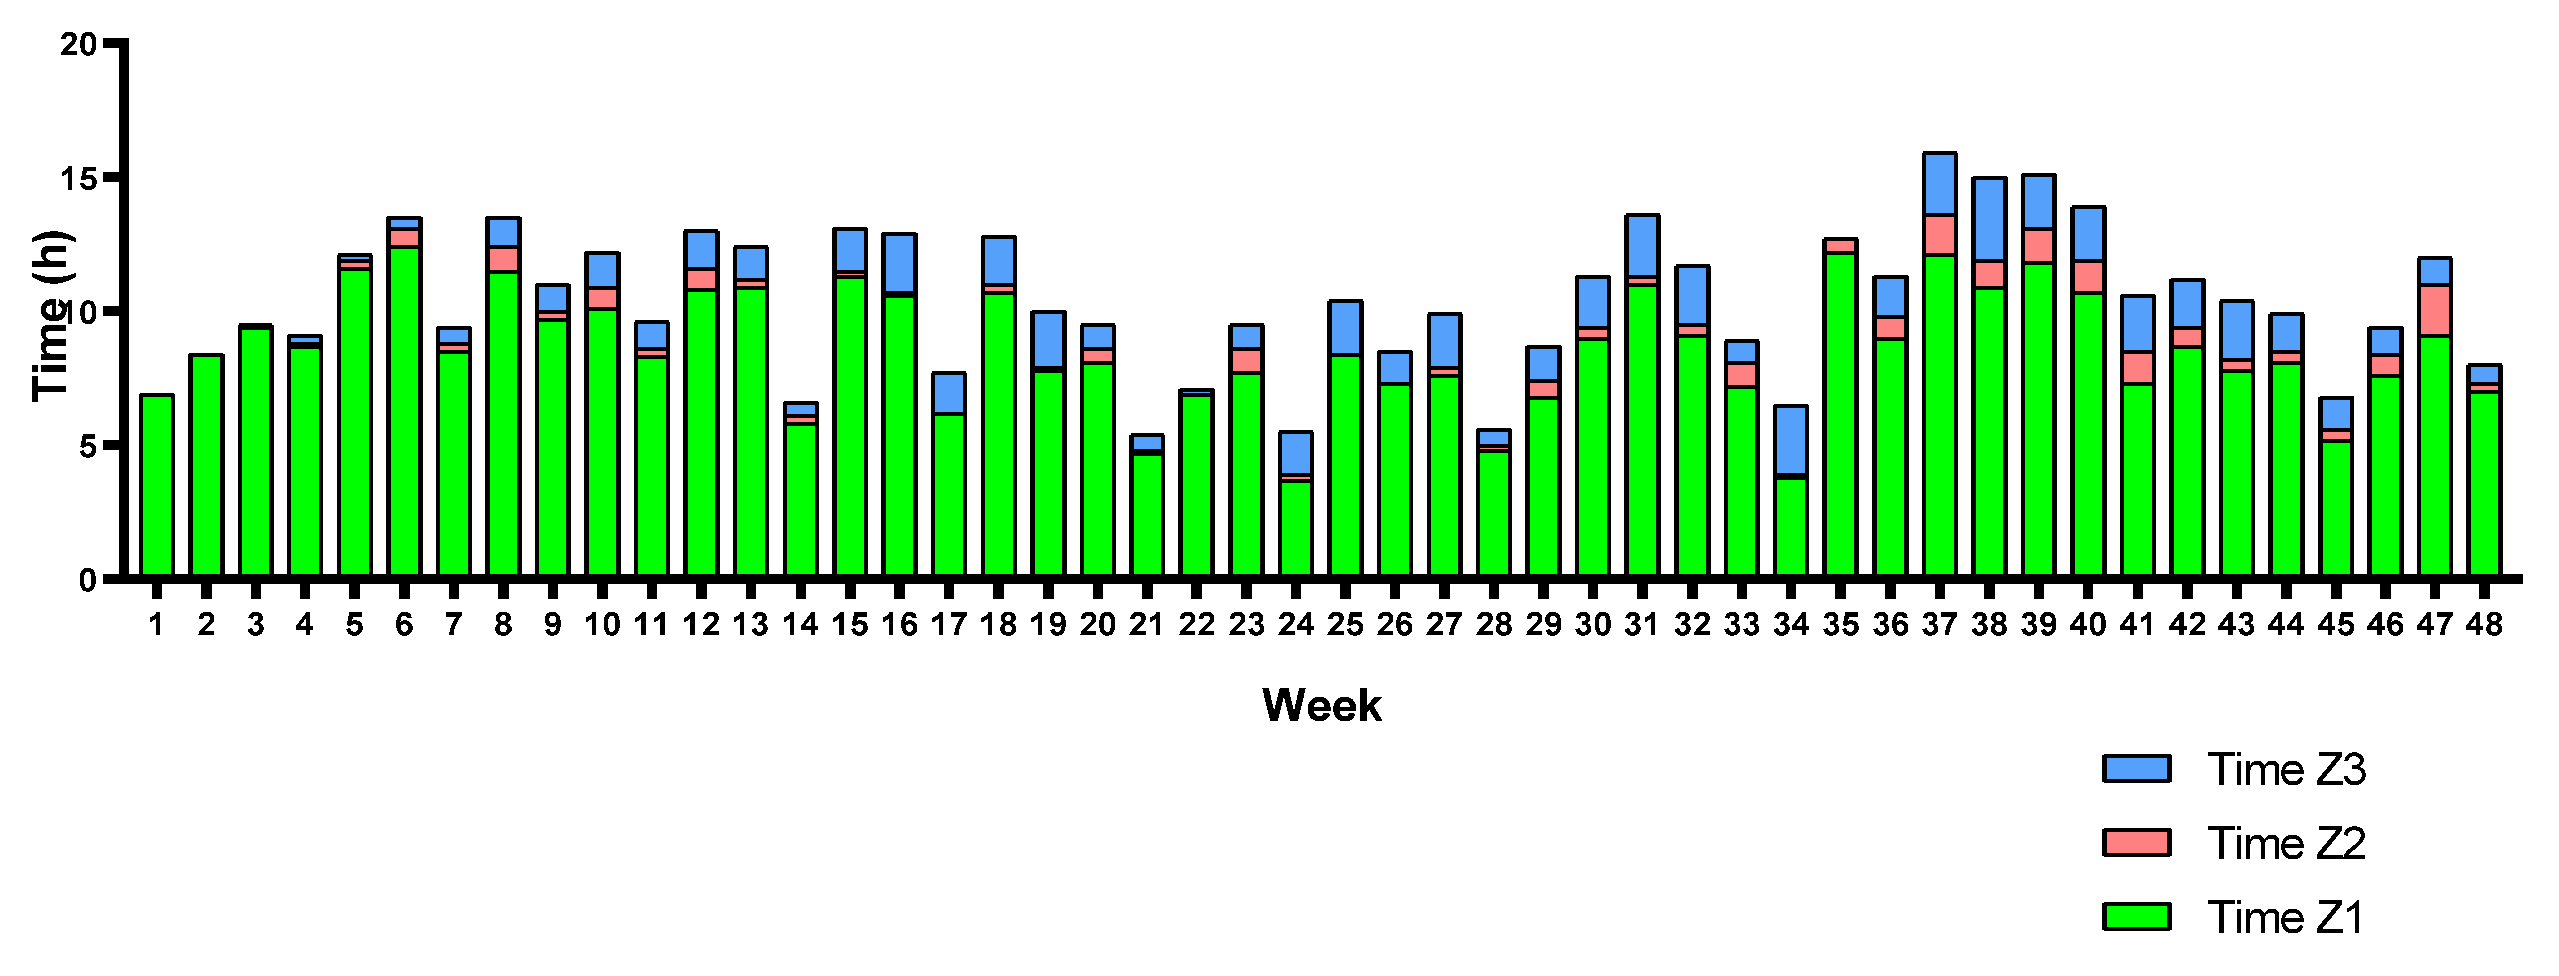
3. Results
4. Discussion
5. Conclusions
Author Contributions
Funding
Institutional Review Board Statement
Informed Consent Statement
Data Availability Statement
Acknowledgments
Conflicts of Interest
References
- The Spanish Triathlon Federation (FETRI). FETRI Competition Regulations; The Spanish Triathlon Federation (FETRI): Madrid, Spain, 2016; pp. 1–64. [Google Scholar]
- ITU Olympic Triathlon—World Triathlon. Available online: https://triathlon.org/olympics (accessed on 22 September 2023).
- Cesaneli, L.; Ylaité, B.; Calleja-González, J.; Leite, N.; Iovane, A.; Messina, G. Transition from Youth Categories to Elite Cycling: Relationships between Early Career Performance and UCI World Tour Success. J. Sports Med. Phys. Fit. 2022, 62, 1577–1583. [Google Scholar] [CrossRef]
- Cejuela, R.; Selles-Perez, S. Training Characteristics and Performance of Two Male Elite Short-Distance Triathletes: From Junior to “World-Class”. Scand. J. Med. Sci. Sports 2023, 33, 2444–2456. [Google Scholar] [CrossRef]
- Cuba-Dorado, A.; Álvarez-Yates, T.; García-García, O. Elite Triathlete Profiles in Draft-Legal Triathlons as a Basis for Talent Identification. Int. J. Environ. Res. Public Health 2022, 19, 881. [Google Scholar] [CrossRef] [PubMed]
- Knechtle, R.; Rüst, C.A.; Rosemann, T.; Knechtle, B. The Best Triathletes Are Older in Longer Race Distances—A Comparison between Olympic, Half-Ironman and Ironman Distance Triathlon. Springerplus 2014, 3, 538. [Google Scholar] [CrossRef] [PubMed]
- Mallett, C.J.; Hanrahan, S.J. Elite Athletes: Why Does the “fire” Burn so Brightly? Psychol. Sport Exerc. 2004, 5, 183–200. [Google Scholar] [CrossRef]
- Gallo, G.; Mateo-March, M.; Gotti, D.; Faelli, E.; Ruggeri, P.; Codella, R.; Filipas, L. How Do World Class Top 5 Giro d’Italia Finishers Train? A Qualitative Multiple Case Study. Scand. J. Med. Sci. Sports 2022, 32, 1738–1746. [Google Scholar] [CrossRef] [PubMed]
- Cejuela, R.; Sellés-Pérez, S. Road to Tokyo 2020 Olympic Games: Training Characteristics of a World Class Male Triathlete. Front. Physiol. 2022, 13, 835705. [Google Scholar] [CrossRef] [PubMed]
- Kenneally, M.; Casado, A.; Gomez-ezeiza, J.; Santos-concejero, J. Training Characteristics of a World Championship 5000-m Finalist and Multiple Continental Record Holder Over the Year Leading to a World Championship Final. Int. J. Sports Physiol. Perform. 2021, 1, 6–10. [Google Scholar] [CrossRef] [PubMed]
- Leo, P.; Spragg, J.; Simon, D.; Lawley, J.S.; Mujika, I. Training Characteristics and Power Profile of Professional U23 Cyclists throughout a Competitive Season. Sports 2020, 8, 167. [Google Scholar] [CrossRef]
- Kenneally, M.; Casado, A.; Gomez-Ezeiza, J.; Santos-Concejero, J. Training Intensity Distribution Analysis by Race Pace vs. Physiological Approach in World-Class Middle- and Long-Distance Runners. Eur. J. Sport Sci. 2021, 21, 819–826. [Google Scholar] [CrossRef]
- Guellich, A.; Seiler, S. Lactate Profile Changes in Relation to Training Characteristics in Junior Elite Cyclists. Int. J. Sports Physiol. Perform. 2010, 5, 316–327. [Google Scholar] [CrossRef] [PubMed]
- Gallo, G.; Leo, P.; March, M.M.; Giorgi, A.; Faelli, E.; Ruggeri, P.; Mujika, I.; Filipas, L. Differences in Training Characteristics between Junior, Under 23 and Professional Cyclists. Int. J. Sports Med. 2021, 43, 1183–1189. [Google Scholar] [CrossRef] [PubMed]
- Zapico, A.G.; Benito, F.J.; Gonzalez, C.B.; Parisi, A.; Pigozzi, F.; Di Salvo, V. Evolution of Physiological and Haematological Parameters with Training Load in Elite Male Road Cyclist: A Longitudinal Study. J. Sports Med. Phys. Fit. 2007, 47, 191–196. [Google Scholar]
- Staff, H.C.; Solli, G.S.; Osborne, J.O.; Sandbakk, Ø. Long-Term Development of Training Characteristics and Performance-Determining Factors in Elite/International and World-Class Endurance Athletes: A Scoping Review. Sports Med. 2023, 53, 1595–1607. [Google Scholar] [CrossRef] [PubMed]
- Hunter, S.K. Sex Differences in Human Fatigability: Mechanisms and Insight to Physiological Responses. Acta Physiol. 2014, 210, 768–789. [Google Scholar] [CrossRef] [PubMed]
- Oosthuyse, T.; Strauss, J.A.; Hackney, A.C. Understanding the Female Athlete: Molecular Mechanisms Underpinning Menstrual Phase Differences in Exercise Metabolism. Eur. J. Appl. Physiol. 2023, 123, 423–450. [Google Scholar] [CrossRef] [PubMed]
- Tarnopolsky, M.A. Gender Differences in Substrate Metabolism during Endurance Exercise. Can. J. Appl. Physiol. 2000, 25, 312–327. [Google Scholar] [CrossRef]
- Miller, A.E.J.; MacDougall, J.D.; Tarnopolsky, M.A.; Sale, D.G. Gender Differences in Strength and Muscle Fiber Characteristics. Eur. J. Appl. Physiol. Occup. Physiol. 1993, 66, 254–262. [Google Scholar] [CrossRef]
- Van Erp, T.; Sanders, D.; De Koning, J.J. Training Characteristics of Male and Female Professional Road Cyclists: A 4-Year Retrospective Analysis. Int. J. Sports Physiol. Perform. 2020, 15, 534–540. [Google Scholar] [CrossRef]
- Tjelta, L.; Tønnessen, E.; Enoksen, E. A Case Study of the Training of Nine Times New York Marathon Winner Grete Waitz. Int. J. Sports Sci. Coach. 2014, 9, 139–157. [Google Scholar] [CrossRef]
- Solli, G.S.; Tønnessen, E.; Sandbakk, Ø. The Training Characteristics of the World’s Most Successful Female Cross-Country Skier. Front. Physiol. 2017, 8, 1069. [Google Scholar] [CrossRef]
- Mujika, I. Olympic Preparation of a World-Class Female Triathlete. Int. J. Sports Physiol. Perform. 2014, 9, 727–731. [Google Scholar] [CrossRef]
- Padilla, S.; Mujika, I.; Orbañanos, J.; Angulo, F. Exercise Intensity during Competition Time Trials in Professional Road Cycling. Med. Sci. Sports Exerc. 2000, 32, 850–856. [Google Scholar] [CrossRef]
- Foster, C. Monitoring Training in Athletes with Reference to Overtraining Syndrome. Med. Sci. Sports Exerc. 1998, 30, 1164–1168. [Google Scholar] [CrossRef]
- Saboul, D.; Balducci, P.; Millet, G.; Pialoux, V.; Hautier, C. A Pilot Study on Quantification of Training Load: The Use of HRV in Training Practice. Eur. J. Sport Sci. 2016, 16, 172–181. [Google Scholar] [CrossRef]
- Cejuela, R.; Esteve-Lanao, J. Quantifying the Training Load in Triathlon. In Triathlon Medicine; Migliorini, S., Ed.; Springer International Publishing: Berlin/Heidelberg, Germany, 2020; pp. 291–316. [Google Scholar]
- Cejuela, R.; Esteve-Lanao, J. Training Load Quantification in Triathlon. J. Hum. Sport Exerc. 2011, 6, 218–232. [Google Scholar] [CrossRef]
- McKay, A.K.A.; Stellingwerff, T.; Smith, E.S.; Martin, D.T.; Mujika, I.; Goosey-Tolfrey, V.L.; Sheppard, J.; Burke, L.M. Defining Training and Performance Caliber: A Participant Classification Framework. Int. J. Sports Physiol. Perform. 2022, 17, 317–331. [Google Scholar] [CrossRef] [PubMed]
- Decroix, L.; De Pauw, K.; Foster, C.; Meeusen, R. Guidelines to Classify Female Subject Groups in Sport-Science Research. Int. J. Sports Physiol. Perform. 2016, 11, 204–213. [Google Scholar] [CrossRef] [PubMed]
- Muñoz, I.; Cejuela, R.; Seiler, S.; Larumbe, E.; Esteve-Lanao, J. Training-Intensity Distribution during an Ironman Season: Relationship with Competition Performance. Int. J. Sports Physiol. Perform. 2014, 9, 332–339. [Google Scholar] [CrossRef]
- Brue, F. Une Variante Du Test de Piste Progressif et Maximal de Leger et Boucher: Le Test Vitesse Vitesse Maximale Aerobie Derrière Cycliste (Test VMA). Bull. Méd. Fed. Fr. Dathlétisme 1985, 7, 1–18. [Google Scholar]
- Davis, J.A. Anaerobic Threshold: Review of the Concept and Directions for Future Research. Med. Sci. Sports Exerc. 1985, 17, 6–21. [Google Scholar] [CrossRef]
- Sweetenham, B.; Atkinson, J. Championship Swim Training; Human Kinetics: Champaign, IL, USA, 2003; ISBN 9780736045438. [Google Scholar]
- Beneke, R. Methodological Aspects of Maximal Lactate Steady State-Implications for Performance Testing. Eur. J. Appl. Physiol. 2003, 89, 95–99. [Google Scholar] [CrossRef]
- Billat, V.L.; Sirvent, P.; Py, G.; Koralsztein, J.P.; Mercier, J. The Concept of Maximal Lactate Steady State: A Bridge between Biochemistry, Physiology and Sport Science. Sports Med. 2003, 33, 407–426. [Google Scholar] [CrossRef]
- Skinner, J.; McLellan, T. The Transition from Aerobic to Anaerobic Metabolism. Res. Q. Exerc. Sport. 1980, 51, 234–248. [Google Scholar] [CrossRef]
- Treff, G.; Winkert, K.; Sareban, M.; Steinacker, J.M.; Sperlich, B. The Polarization-Index: A Simple Calculation to Distinguish Polarized from Non-Polarized Training Intensity Distributions. Front. Physiol. 2019, 10, 707. [Google Scholar] [CrossRef]
- Ross, W.D.; Marfell-Jones, M.J. Kinanthropometry. In Physiological Testing of Elite Athlete; Human Kinetics Publishers Inc.: London, UK, 1991; pp. 223–308. [Google Scholar]
- Lee, R.C.; Wang, Z.; Heo, M.; Ross, R.; Janssen, I.; Heymsfield, S.B. Total-Body Skeletal Muscle Mass: Development and Cross-Validation of Anthropometric Prediction Models. Am. J. Clin. Nutr. 2000, 72, 796–803. [Google Scholar] [CrossRef]
- Withers, R.T.; Craig, N.P.; Bourdon, P.C.; Norton, K.I. Relative Body Fat and Anthropometric Prediction of Body Density of Male Athletes. Eur. J. Appl. Physiol. Occup. Physiol. 1987, 56, 191–200. [Google Scholar] [CrossRef]
- González-Badillo, J.J.; Rodríguez-Rosell, D.; Sánchez-Medina, L.; Ribas, J.; López-López, C.; Mora-Custodio, R.; Yañez-García, J.M.; Pareja-Blanco, F. Short-Term Recovery Following Resistance Exercise Leading or Not to Failure. Int. J. Sports Med. 2016, 37, 295–304. [Google Scholar] [CrossRef]
- Izquierdo-Gabarren, M.; González De Txabarri Expósito, R.; García-PallarIs, J.; Sánchez-Medina, L.; De Villarreal, E.S.S.; Izquierdo, M. Concurrent Endurance and Strength Training Not to Failure Optimizes Performance Gains. Med. Sci. Sports Exerc. 2010, 42, 1191–1199. [Google Scholar] [CrossRef] [PubMed]
- Abbiss, C.R.; Straker, L.; Quod, M.J.; Martin, D.T.; Laursen, P.B. Examining Pacing Profiles in Elite Female Road Cyclists Using Exposure Variation Analysis. Br. J. Sports Med. 2010, 44, 437–442. [Google Scholar] [CrossRef] [PubMed]
- Kyte, K.H.; Stensrud, T.; Berg, T.J.; Seljeflot, I.; Hisdal, J. Vascular Function in Norwegian Female Elite Runners: A Cross-Sectional, Controlled Study. Sports 2022, 10, 37. [Google Scholar] [CrossRef]
- Klusiewicz, A.; Starczewski, M.; Ładyga, M.; Długołęcka, B.; Braksator, W.; Mamcarz, A.; Sitkowski, D. Reference Values of Maximal Oxygen Uptake for Polish Rowers. J. Hum. Kinet. 2014, 44, 121–127. [Google Scholar] [CrossRef]
- Sandbakk, O.; Ettema, G.; Holmberg, H.C. Gender Differences in Endurance Performance by Elite Cross-Country Skiers Are Influenced by the Contribution from Poling. Scand. J. Med. Sci. Sports 2014, 24, 28–33. [Google Scholar] [CrossRef]
- Billat, V.; Lepretre, P.M.; Heugas, A.M.; Laurence, M.H.; Salim, D.; Koralsztein, J.P. Training and Bioenergetic Characteristics in Elite Male and Female Kenyan Runners. Med. Sci. Sports Exerc. 2003, 35, 297–304. [Google Scholar] [CrossRef]
- Jones, A.M. The Physiology of the World Record Holder for the Women’s Marathon. Int. J. Sports Sci. Coach. 2006, 1, 101–116. [Google Scholar] [CrossRef]
- Lamberts, R.P. Predicting Cycling Performance in Trained to Elite Male and Female Cyclists. Int. J. Sports Physiol. Perform. 2014, 9, 610–614. [Google Scholar] [CrossRef] [PubMed]
- Maunder, E.; Seiler, S.; Mildenhall, M.J.; Kilding, A.E.; Plews, D.J. The Importance of ‘Durability’ in the Physiological Profiling of Endurance Athletes. Sports Med. 2021, 51, 1619–1628. [Google Scholar] [CrossRef] [PubMed]
- Rodríguez-López, E.S.; Acevedo-Gómez, M.B.; Romero-Franco, N.; Basas-García, Á.; Ramírez-Parenteau, C.; Calvo-Moreno, S.O.; Fernández-Domínguez, J.C. Urinary Incontinence Among Elite Track and Field Athletes According to Their Event Specialization: A Cross-Sectional Study. Sports Med. Open 2022, 8, 78. [Google Scholar] [CrossRef]
- Karp, J.R. Training Characteristics of Qualifi Ers for the U.S. Olympic Marathon Trials. Int. J. Sports Physiol. Perform. 2007, 2, 72–92. [Google Scholar] [CrossRef]
- Svendsen, I.S.; Gleeson, M.; Haugen, T.A.; Tønnessen, E. Effect of an Intense Period of Competition on Race Performance and Self-Reported Illness in Elite Cross-Country Skiers. Scand. J. Med. Sci. Sports 2015, 25, 846–853. [Google Scholar] [CrossRef]
- Seiler, K.S.; Kjerland, G.Ø. Quantifying Training Intensity Distribution in Elite Endurance Athletes: Is There Evidence for an “Optimal” Distribution? Scand. J. Med. Sci. Sports 2006, 16, 49–56. [Google Scholar] [CrossRef]
- Stöggl, T.; Sperlich, B. Polarized Training Has Greater Impact on Key Endurance Variables than Threshold, High Intensity, or High Volume Training. Front. Physiol. 2014, 5, 33. [Google Scholar] [CrossRef] [PubMed]
- Selles-Perez, S.; Fernández-Sáez, J.; Cejuela, R. Polarized and Pyramidal Training Intensity Distribution: Relationship with a Half-Ironman Distance Triathlon Competition. J. Sports Sci. Med. 2019, 18, 708. [Google Scholar]
- Tjelta, L.I. Three Norwegian Brothers All European 1500 m Champions: What Is the Secret? J. Sports Sci. Coach. 2019, 14, 694–700. [Google Scholar] [CrossRef]
- Filipas, L.; Bonato, M.; Gallo, G.; Codella, R. Effects of 16 Weeks of Pyramidal and Polarized Training Intensity Distributions in Well-Trained Endurance Runners. Scand. J. Med. Sci. Sports 2022, 32, 498–511. [Google Scholar] [CrossRef]
- Holloszy, J.O.; Coyle, E.F. Adaptations of Skeletal Muscle to Endurance Exercise and Their Metabolic Consequences. J. Appl. Physiol. 1984, 56, 831–838. [Google Scholar] [CrossRef]
- Laursen, P.B. Training for Intense Exercise Performance: High-Intensity or High-Volume Training? Scand. J. Med. Sci. Sports 2010, 20, 1–10. [Google Scholar] [CrossRef]
- Issurin, V. Block Periodization versus Traditional Training Theory: A Review. J. Sports Med. Phys. Fit. 2008, 48, 65–75. [Google Scholar]
- Rønnestad, B.R.; Hansen, J. A Scientific Approach to Improve Physiological Capacity of an Elite Cyclist. Int. J. Sports Physiol. Perform. 2018, 13, 390–393. [Google Scholar] [CrossRef]
- Rønnestad, B.R.; Hansen, J.; Thyli, V.; Bakken, T.A. Sandbakk 5-Week Block Periodization Increases Aerobic Power in Elite Cross-Country Skiers. Scand. J. Med. Sci. Sports 2016, 26, 140–146. [Google Scholar] [CrossRef]
- Almquist, N.W.; Eriksen, H.B.; Wilhelmsen, M.; Hamarsland, H.; Ing, S.; Ellefsen, S.; Sandbakk, Ø.; Rønnestad, B.R.; Skovereng, K. No Differences between 12 Weeks of Block- vs. Traditional-Periodized Training in Performance Adaptations in Trained Cyclists. Front. Physiol. 2022, 13, 837634. [Google Scholar] [CrossRef]
- Solli, G.S.; Tønnessen, E.; Sandbakk, Ø. Block vs. Traditional Periodization of HIT: Two Different Paths to Success for the World’s Best Cross-Country Skier. Front. Physiol. 2019, 10, 375. [Google Scholar] [CrossRef]
- Landers, G.J.; Blanksby, B.A.; Ackland, T.R.; Smith, D.A.; Landers, G. Kinanthropometric Differences between World Championship Senior and Junior Elite Triathletes. In Proceedings of the Gatorade International Triathlon Science II Conference Noosa, Australia, 7–8 November 1999. [Google Scholar]
- Saunders, P.U.; Pyne, D.B.; Telford, R.D.; Hawley, J.A. Factors Affecting Running Economy in Trained Distance Runners. Sports Med. 2004, 34, 465–485. [Google Scholar] [CrossRef]
- Tsukahara, Y.; Torii, S.; Yamasawa, F.; Iwamoto, J.; Otsuka, T.; Goto, H.; Kusakabe, T.; Matsumoto, H.; Akama, T. Changes in Body Composition and Its Relationship to Performance in Elite Female Track and Field Athletes Transitioning to the Senior Division. Sports 2020, 8, 115. [Google Scholar] [CrossRef]
- Berryman, N.; Mujika, I.; Arvisais, D.; Roubeix, M.; Binet, C.; Bosquet, L. Strength Training for Middle- and Long-Distance Performance: A Meta-Analysis. Int. J. Sports Physiol. Perform. 2018, 13, 57–63. [Google Scholar] [CrossRef]
- Pareja-Blanco, F.; Rodríguez-Rosell, D.; Sánchez-Medina, L.; Sanchis-Moysi, J.; Dorado, C.; Mora-Custodio, R.; Yáñez-García, J.M.; Morales-Alamo, D.; Pérez-Suárez, I.; Calbet, J.A.L.; et al. Effects of Velocity Loss during Resistance Training on Athletic Performance, Strength Gains and Muscle Adaptations. Scand. J. Med. Sci. Sports 2017, 27, 724–735. [Google Scholar] [CrossRef]
- Lauersen, J.B.; Bertelsen, D.M.; Andersen, L.B. The Effectiveness of Exercise Interventions to Prevent Sports Injuries: A Systematic Review and Meta-Analysis of Randomised Controlled Trials. Br. J. Sports Med. 2014, 48, 871–877. [Google Scholar] [CrossRef]
- Ristolainen, L.; Heinonen, A.; Waller, B.; Kujala, U.M.; Kettunen, J.A. Gender Differences in Sport Injury Risk and Types of Injuries: A Retrospective Twelve-Month Study on Cross-Country Skiers, Swimmers, Long-Distance Runners and Soccer Players. J. Sports Sci. Med. 2009, 8, 443–451. [Google Scholar]


| Triathlete A | Triathlete B | Triathlete C | |||||||
|---|---|---|---|---|---|---|---|---|---|
| Test 1 | Test 2 | %Change | Test 1 | Test 2 | %Change | Test 1 | Test 2 | %Change | |
| Swim | |||||||||
| SL200 (m/s) | 1.37 | 1.39 | 1.4 | 1.35 | 1.39 | 2.8 | 1.41 | 1.43 | 1.4 |
| LT2 | 1.28 | 1.32 | 2.6 | 1.25 | 1.30 | 3.9 | 1.28 | 1.33 | 4.0 |
| LT1 | 1.22 | 1.25 | 2.5 | 1.16 | 1.19 | 2.4 | 1.22 | 1.23 | 1.2 |
| HRMax (bpm) | 184 | 184 | 0.0 | 184 | 187 | 1.6 | 184 | 186 | 1.1 |
| Bike | |||||||||
| VO2Max (mL/kg/min) | 59.8 | 63.9 | 6.9 | 60.7 | 66.8 | 10 | 61.3 | 66.2 | 8.0 |
| W VO2Max | 260 | 280 | 7.7 | 290 | 315 | 8.6 | 290 | 315 | 8.6 |
| W VT2 | 200 | 215 | 7.5 | 240 | 260 | 8.3 | 230 | 250 | 8.7 |
| W VT1 | 155 | 170 | 9.7 | 175 | 195 | 11.4 | 160 | 190 | 18.8 |
| W/kg VO2Max | 5.3 | 5.9 | 12.5 | 4.7 | 5.3 | 12.2 | 4.8 | 5.2 | 8.4 |
| W/Kg VT2 | 4.1 | 4.6 | 12.3 | 3.9 | 4.3 | 12.0 | 3.8 | 4.1 | 8.5 |
| W/kg VT1 | 3.1 | 3.6 | 14.6 | 2.8 | 3.3 | 15.0 | 2.6 | 3.1 | 18.6 |
| HRMax (bpm) | 181 | 182 | 0.6 | 187 | 187 | 0.0 | 183 | 182 | −0.5 |
| Run | |||||||||
| VO2Max (mL/kg/min) | 60.3 | 64.6 | 7.1 | 59.4 | 64.8 | 9.1 | 63.1 | 67.5 | 7.0 |
| S VO2Max | 17.2 | 18.1 | 5.2 | 16.9 | 17.8 | 5.3 | 17.5 | 18.4 | 5.1 |
| S VT2 | 15.1 | 16.3 | 7.9 | 14.5 | 15.4 | 6.2 | 14.8 | 16.0 | 8.1 |
| S VT1 | 13.3 | 13.9 | 4.5 | 13.0 | 13.3 | 2.3 | 13.0 | 13.6 | 4.6 |
| HRMax (bpm) | 186 | 188 | 1.1 | 191 | 195 | 2.1 | 193 | 197 | 2.1 |
| Triathlete A | Triathlete B | Triathlete C | |
|---|---|---|---|
| Training Load | |||
| WA (total ECOs) ( (ds)) | 922 (276) | 770 (226) | 760 (251) |
| Maximum ECOs week | 1361 | 1327 | 1176 |
| Minimum ECOs week | 271 | 266 | 274 |
| %ECOs swimming ( (ds)) | 36.6 (13.2) | 36.1 (11.9) | 37.5 (16.9) |
| %ECOs cycling ( (ds)) | 29.3 (10.7) | 29.5 (11.4) | 27.8 (10.4) |
| %ECOs running ( (ds)) | 34.1 (14.9) | 34.3 (14.9) | 34.8 (13.2) |
| %ECOs Z1 ( (ds)) | 50.8 (13.9) | 55.1 (17.1) | 53.4 (16.8) |
| %ECOs Z2 ( (ds)) | 9.7 (6.5) | 7.8 (7.7) | 5.7 (4.1) |
| %ECOs Z3 ( (ds)) | 40.5 (14.5) | 40.1 (13.7) | 43.2 (14.4) |
| Training Volume | |||
| Total weeks (n) | 50 | 48 | 48 |
| WA training time (h) ( (ds)) | 12.2 (2.7) | 10.8 (2.4) | 10.4 (2.7) |
| Maximum weekly hours | 17.6 | 16.2 | 15.9 |
| Minimum weekly hours | 5.5 | 6.7 | 5.4 |
| % Training time Z1 ( (ds)) | 80.2 (6.9) | 83.3 (8.7) | 82.7 (8.5) |
| % Training time Z2 ( (ds)) | 7.5 (4.2) | 5.8 (4.6) | 4.5 (3.3) |
| % Training time Z3 ( (ds)) | 12.3 (6.0) | 11.9 (6.0) | 12.8 (7.4) |
| Polarization index (a.u.) | 1.92 | 2.08 | 2.13 |
| RACES | |||
| International races (n) | 2 | 1 | 1 |
| National races (n) | 7 | 9 | 8 |
| Local races (n) | 5 | 5 | 4 |
Disclaimer/Publisher’s Note: The statements, opinions and data contained in all publications are solely those of the individual author(s) and contributor(s) and not of MDPI and/or the editor(s). MDPI and/or the editor(s) disclaim responsibility for any injury to people or property resulting from any ideas, methods, instructions or products referred to in the content. |
© 2024 by the authors. Licensee MDPI, Basel, Switzerland. This article is an open access article distributed under the terms and conditions of the Creative Commons Attribution (CC BY) license (https://creativecommons.org/licenses/by/4.0/).
Share and Cite
Sellés-Pérez, S.; Arévalo-Chico, H.; Fernández-Sáez, J.; Cejuela, R. Training Characteristics, Performance, and Body Composition of Three U23 Elite Female Triathletes throughout a Season. Sports 2024, 12, 53. https://doi.org/10.3390/sports12020053
Sellés-Pérez S, Arévalo-Chico H, Fernández-Sáez J, Cejuela R. Training Characteristics, Performance, and Body Composition of Three U23 Elite Female Triathletes throughout a Season. Sports. 2024; 12(2):53. https://doi.org/10.3390/sports12020053
Chicago/Turabian StyleSellés-Pérez, Sergio, Hector Arévalo-Chico, José Fernández-Sáez, and Roberto Cejuela. 2024. "Training Characteristics, Performance, and Body Composition of Three U23 Elite Female Triathletes throughout a Season" Sports 12, no. 2: 53. https://doi.org/10.3390/sports12020053