
Assessing Dietary Nutrient Adequacy and the Effect of Season—Long Training on Body Composition and Metabolic Rate in Collegiate Male Basketball Players


 ,
,  and
and
Abstract
:1. Introduction
2. Materials and Methods
2.1. Participants
2.2. Procedures
2.3. Dietary Analyses and Nutrition Consultations
2.4. Body Composition
2.5. Metabolism
2.6. Statistical Analysis
3. Results
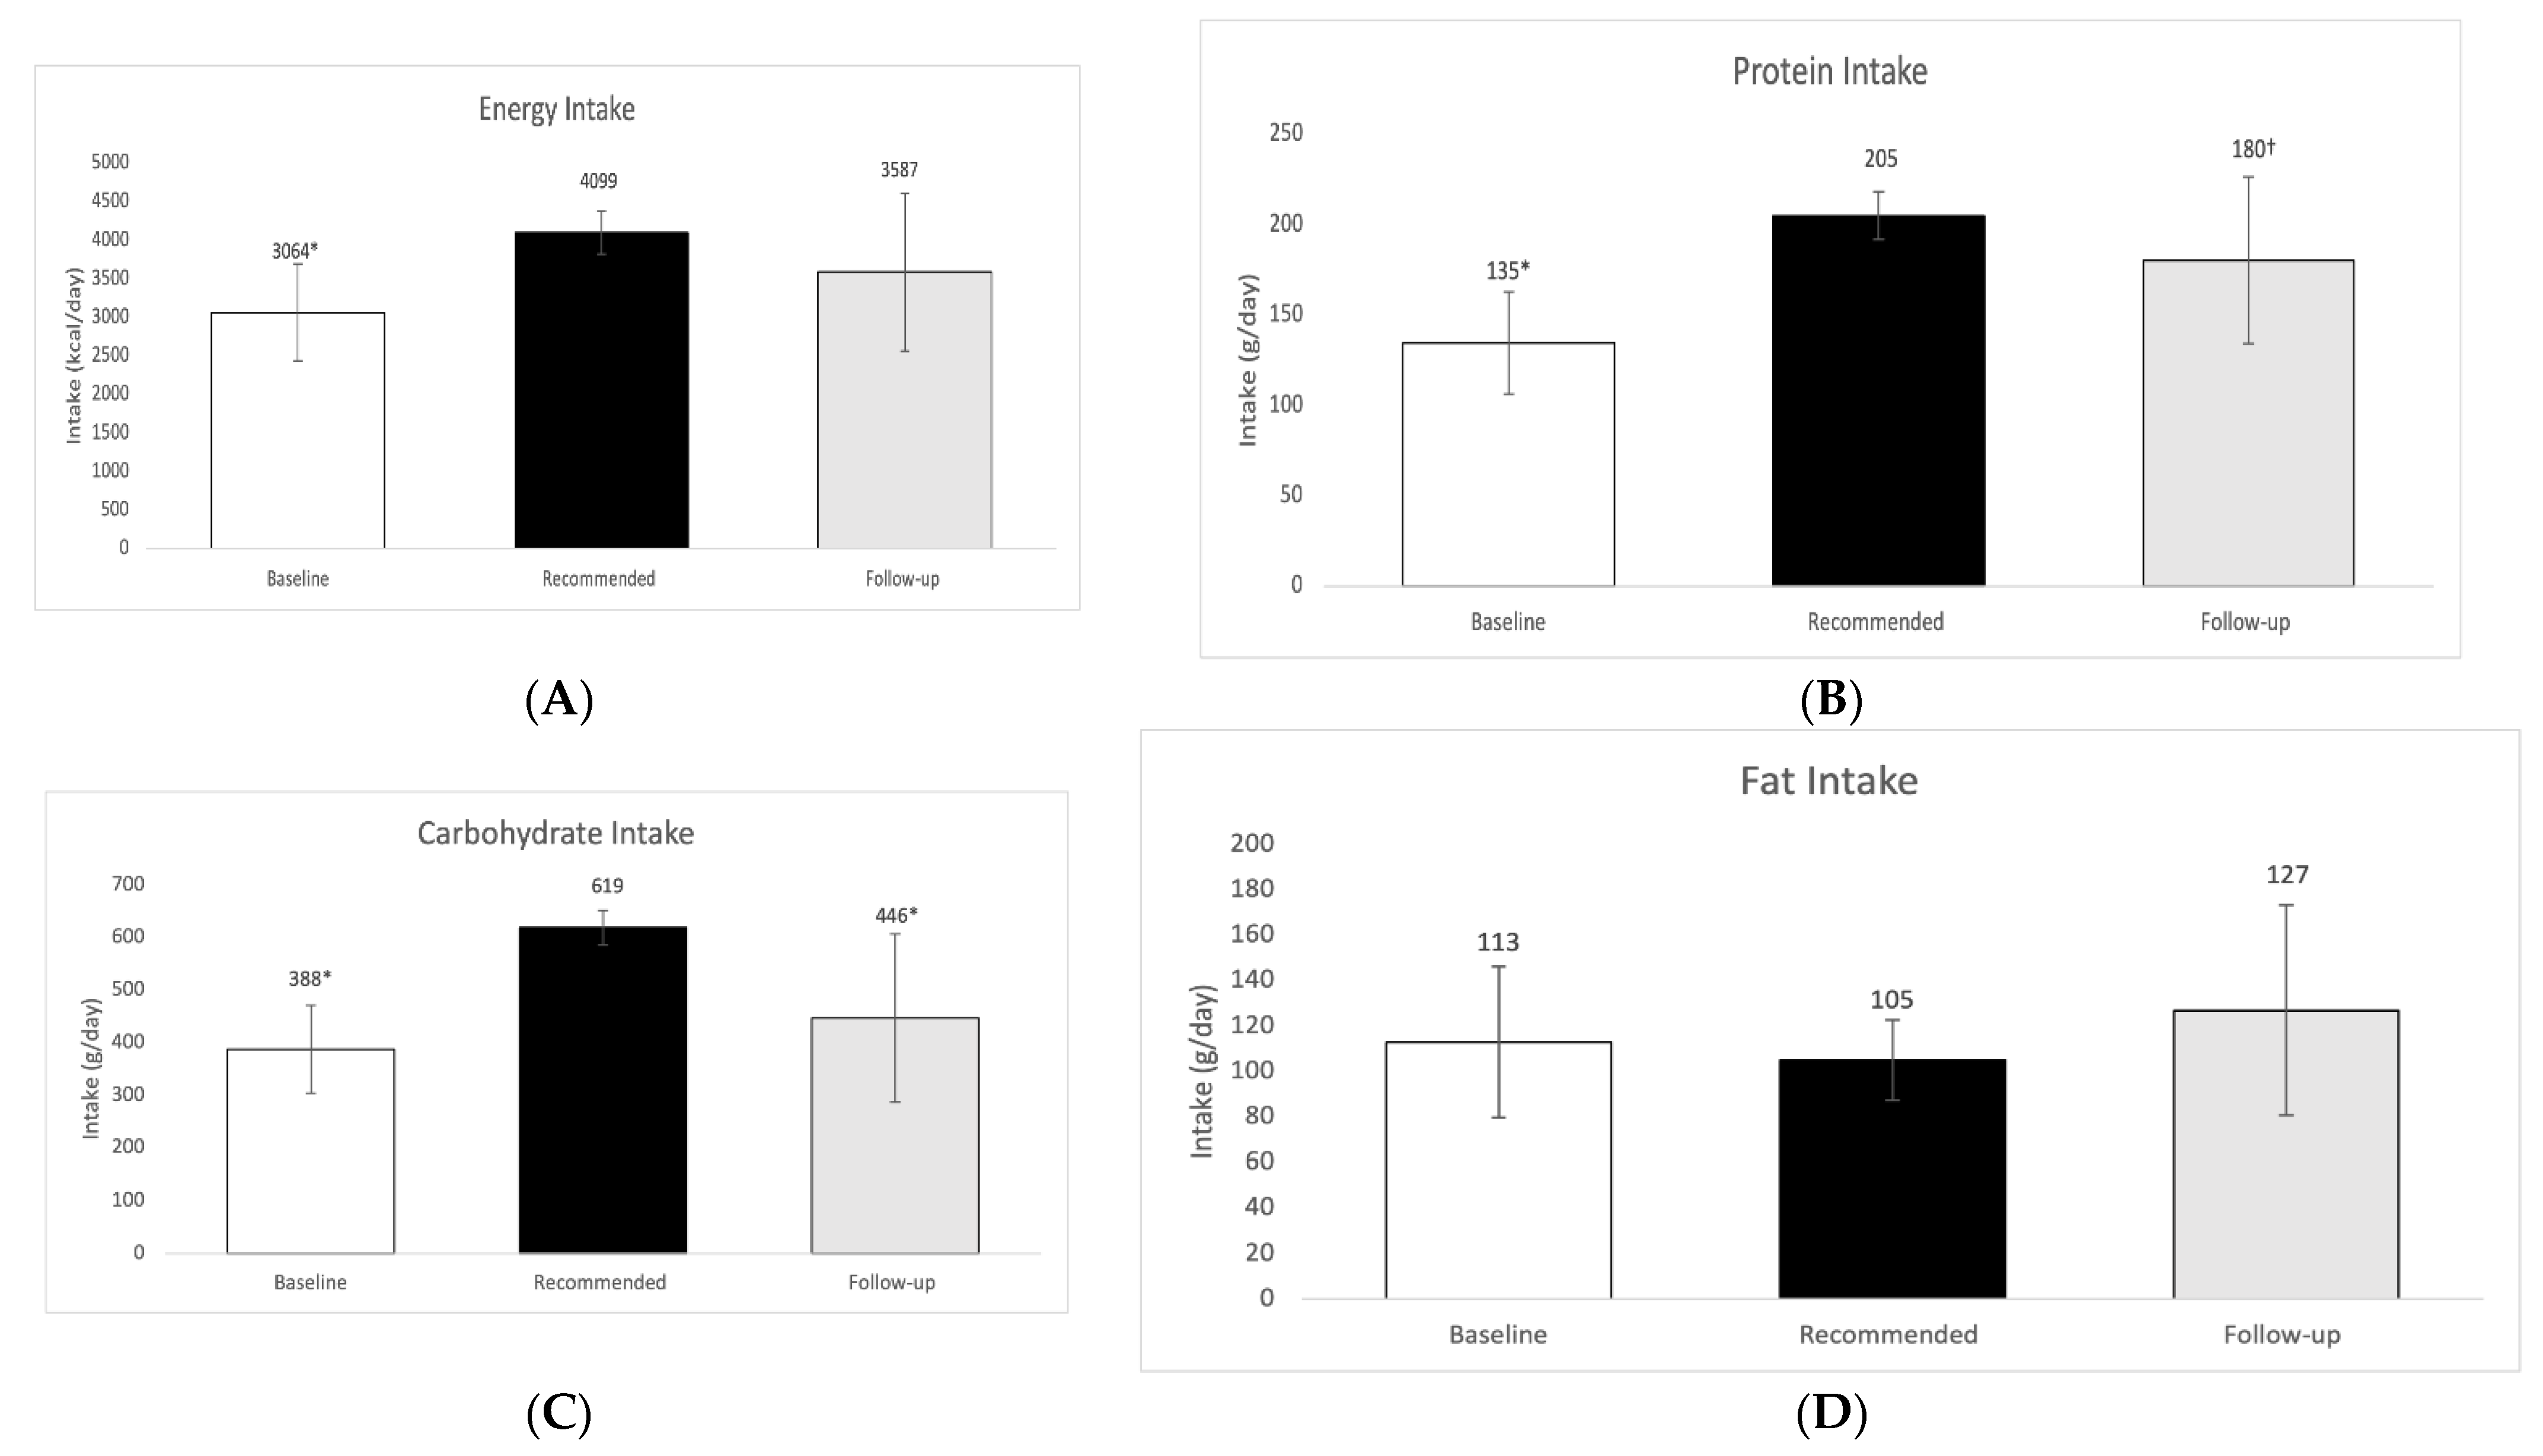
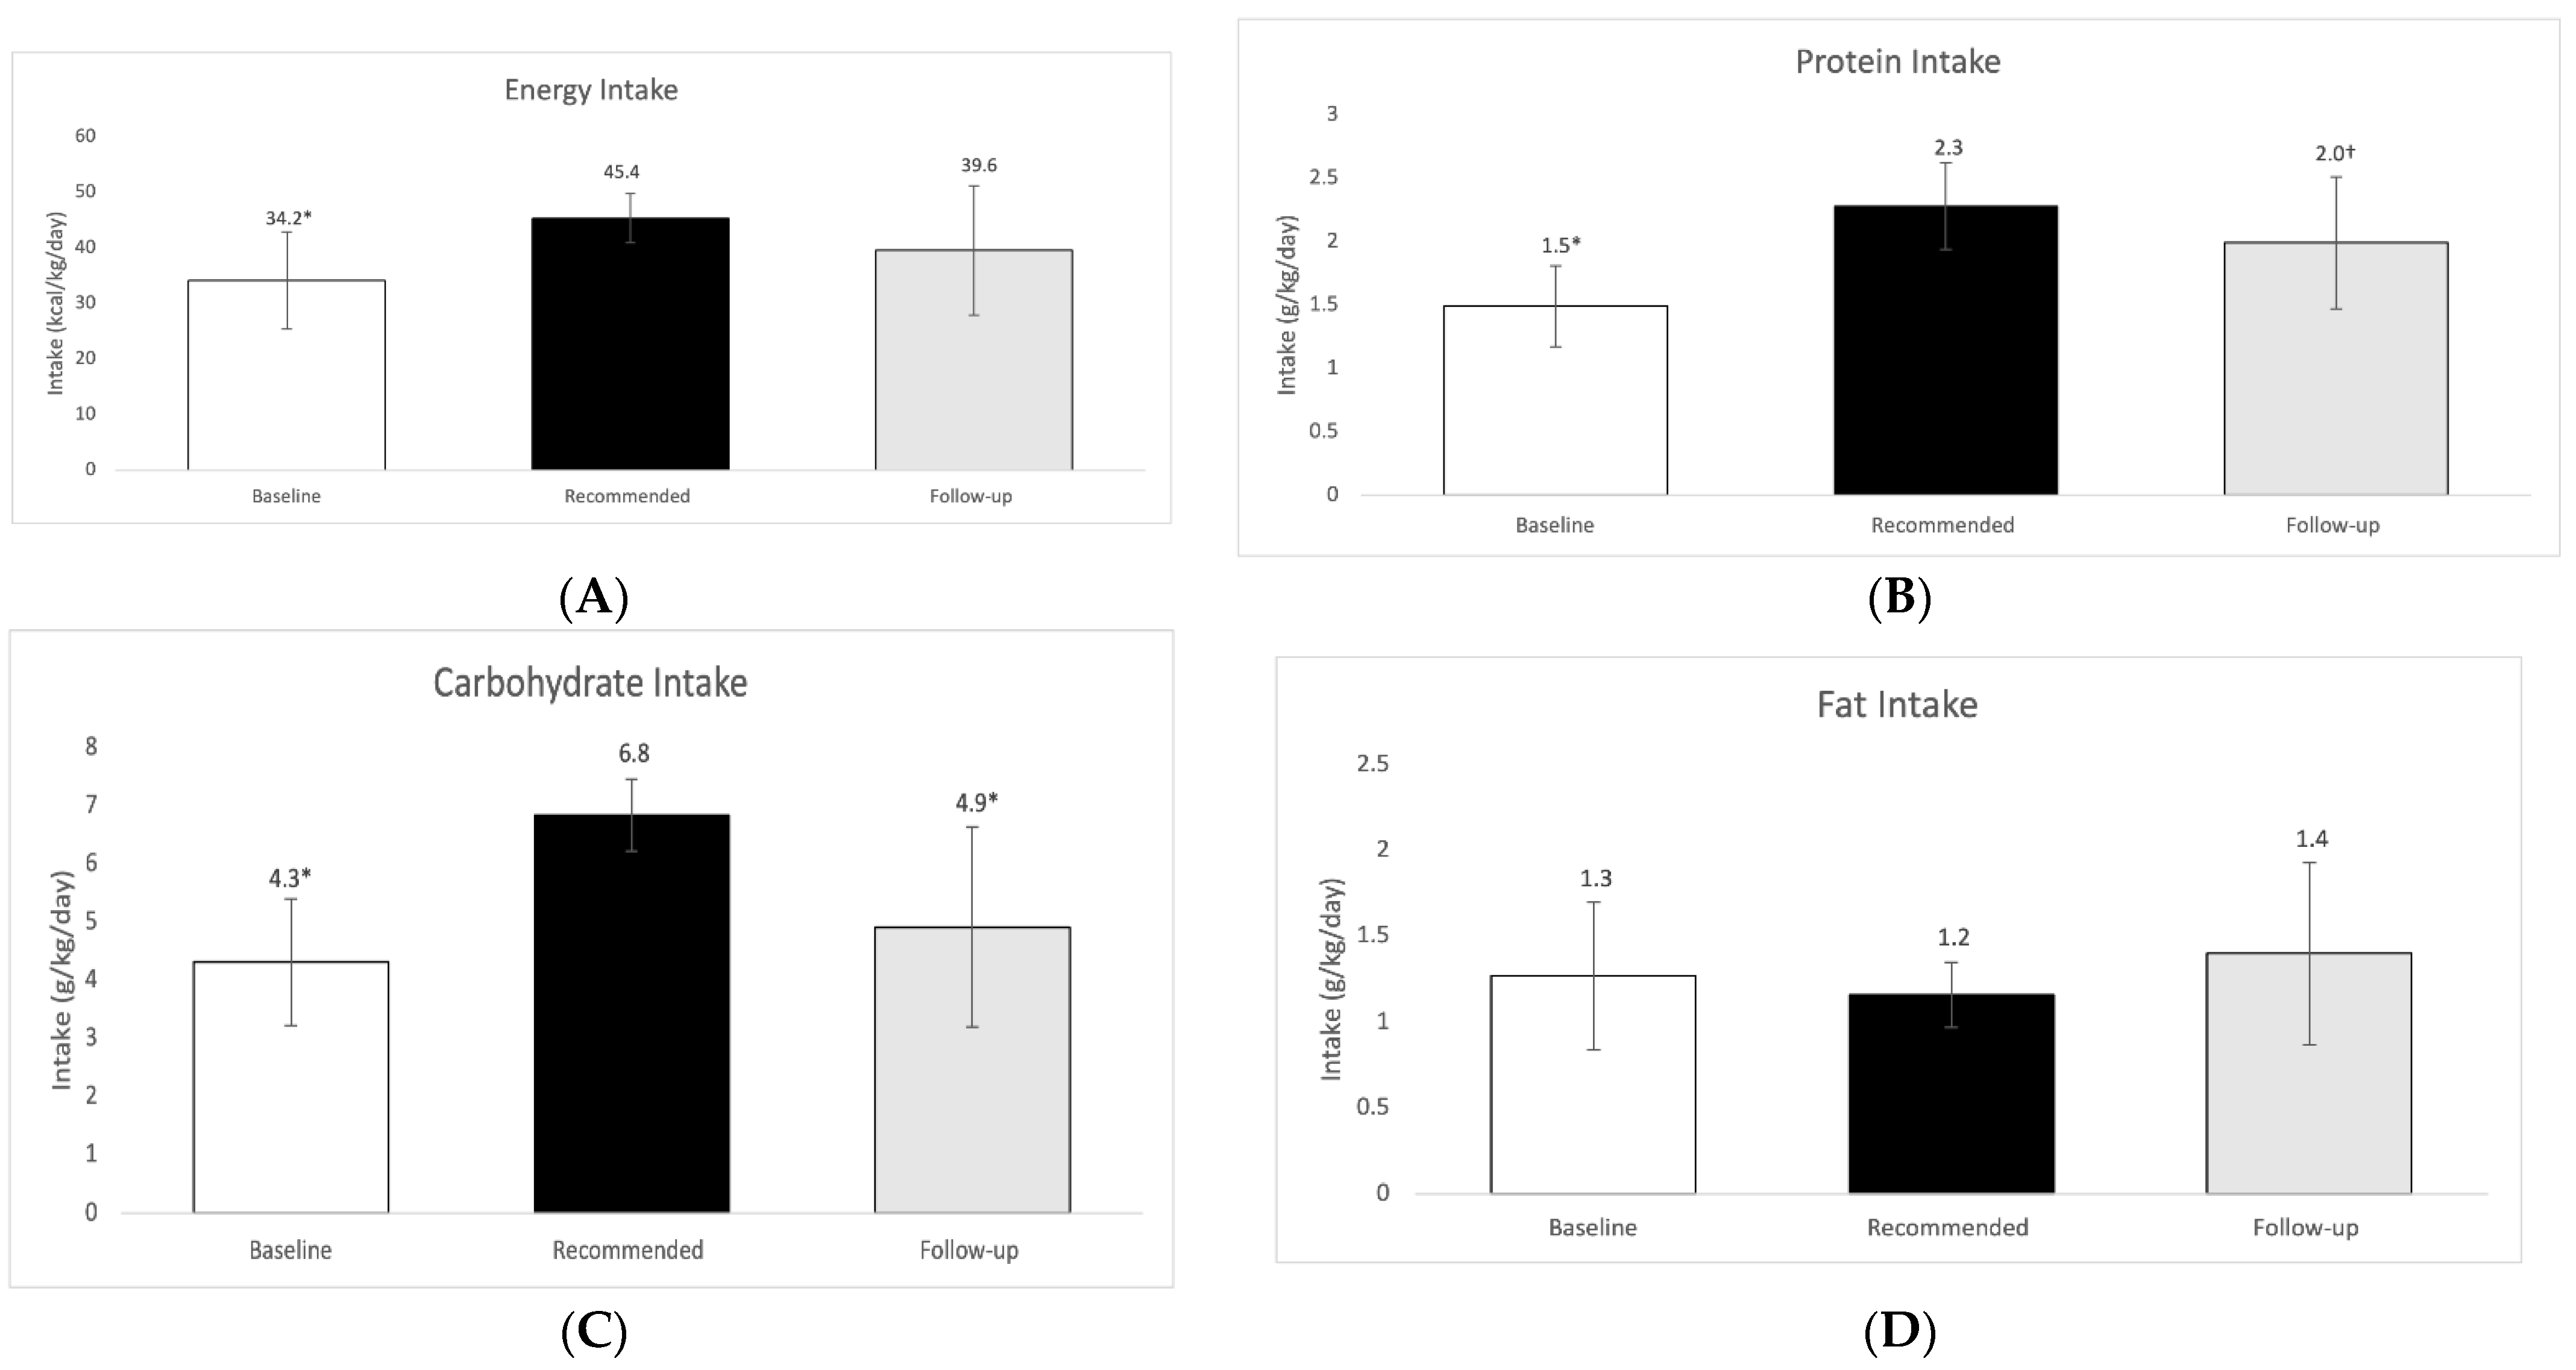
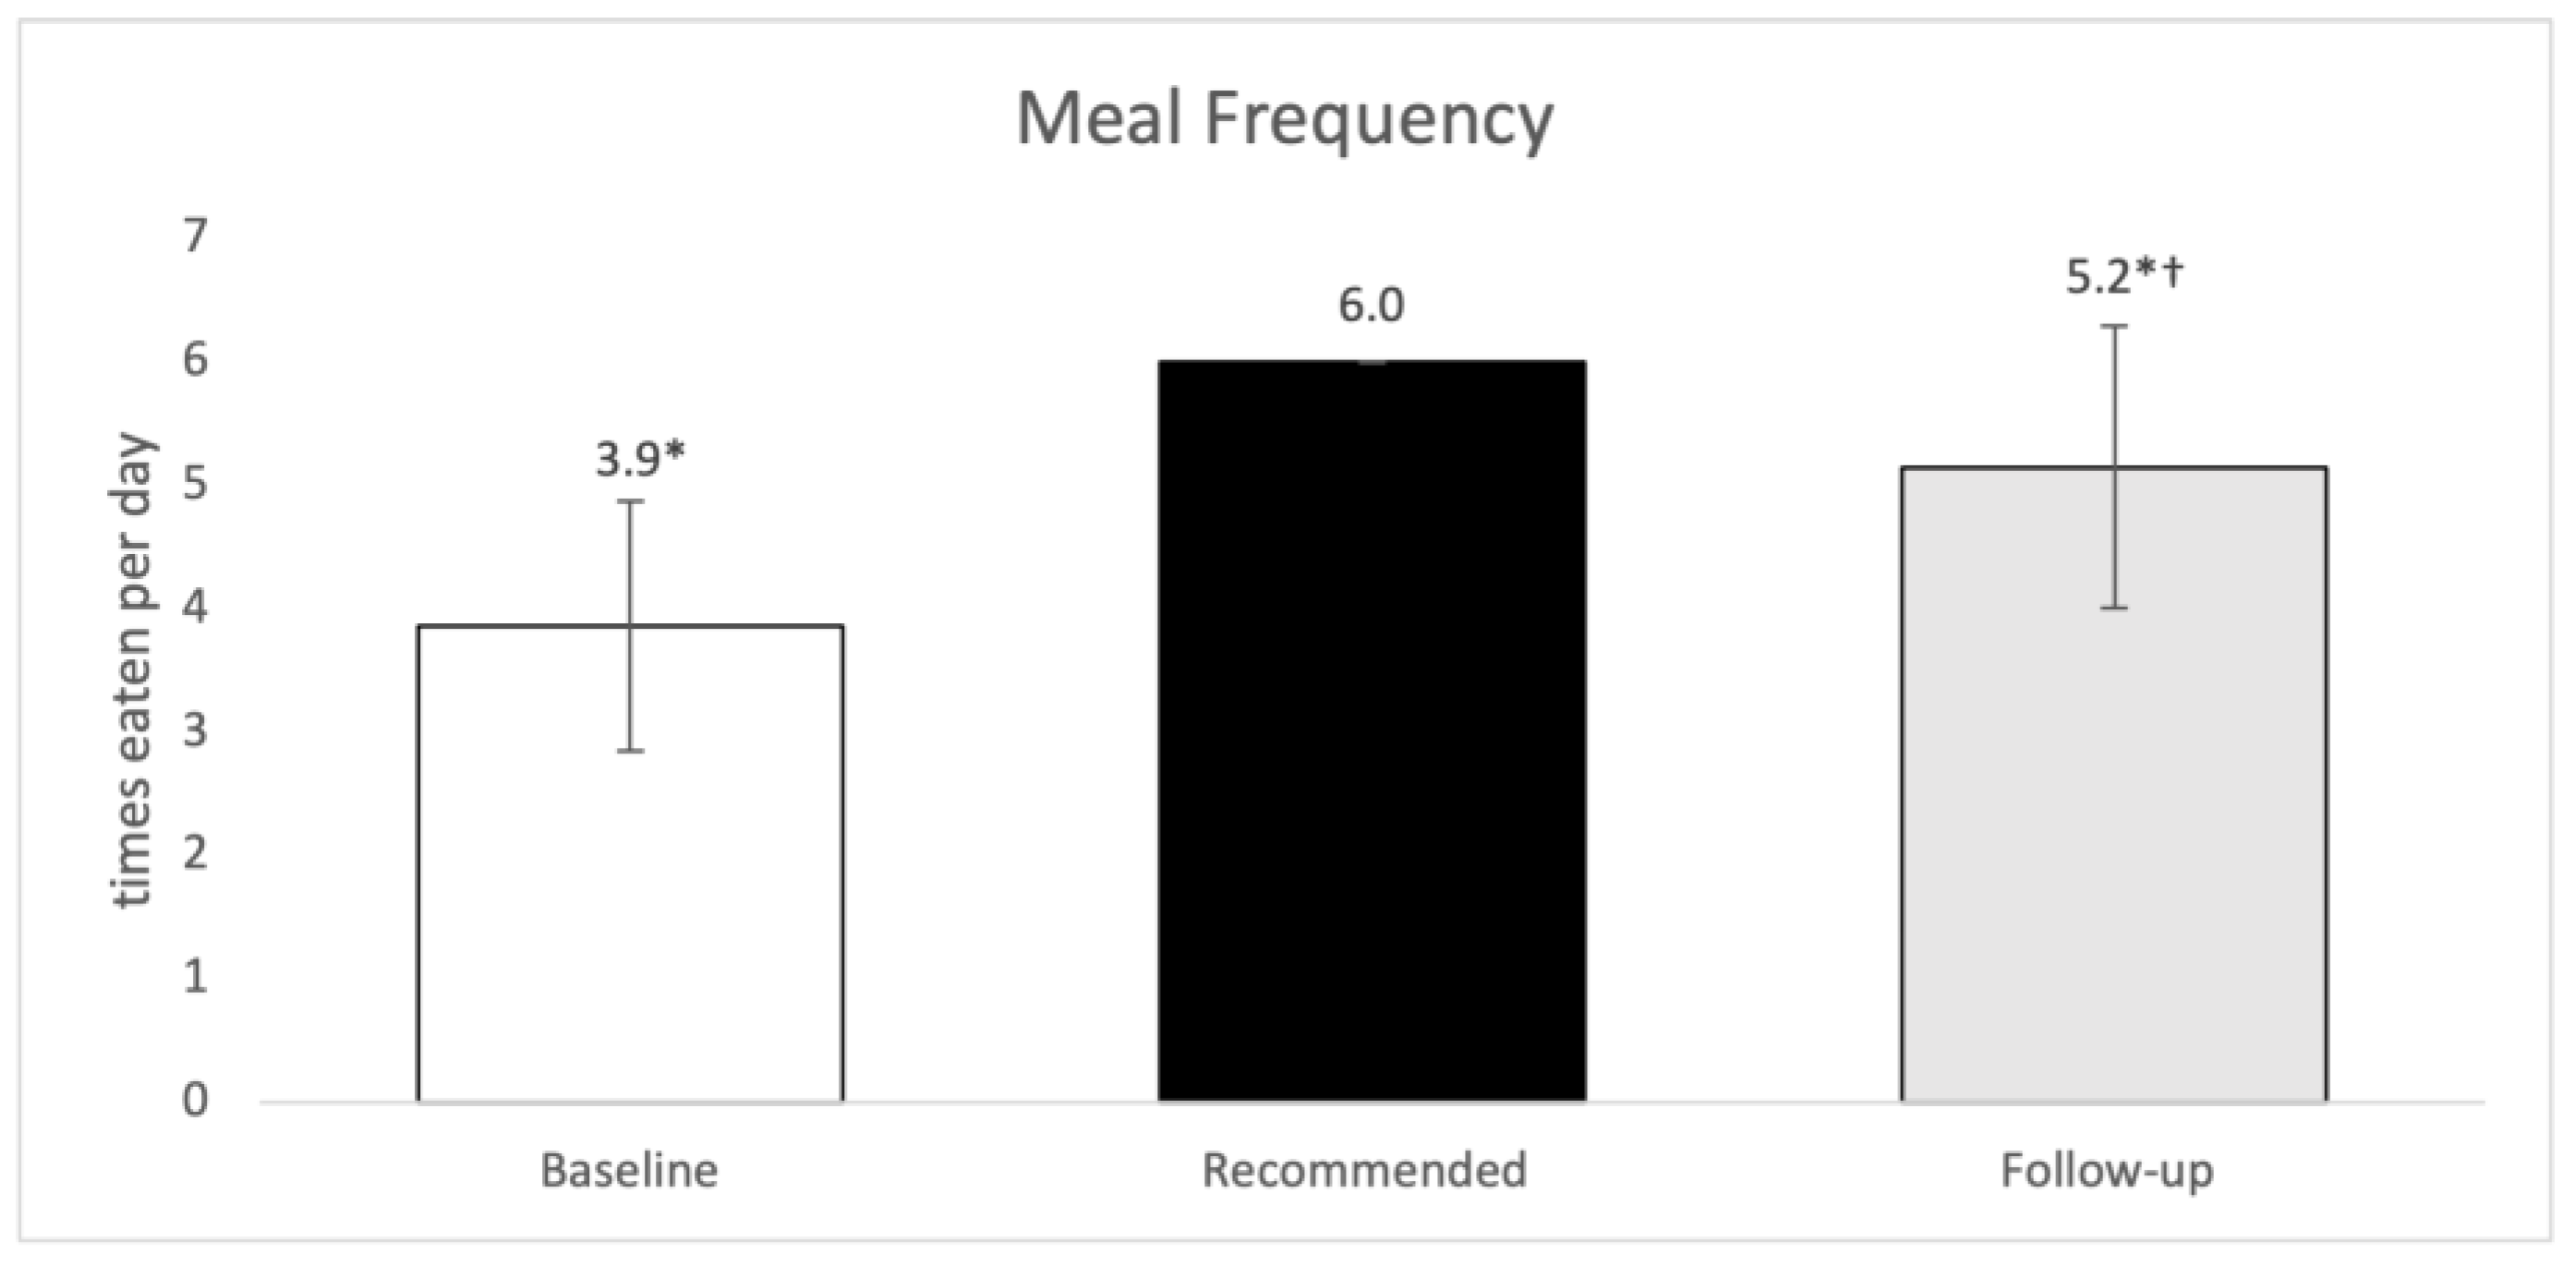
3.1. Dietary Intake
3.2. Body Composition
3.3. Metabolism
4. Discussion
4.1. Dietary Intake
4.2. Body Composition
4.3. Metabolism
4.4. Strengths, Limitations and Future Outlook
5. Conclusions
Author Contributions
Funding
Institutional Review Board Statement
Informed Consent Statement
Data Availability Statement
Acknowledgments
Conflicts of Interest
References
- Osterberg, K. Fueling the Basketball Athlete: The Practitioner’s Approach. Available online: https://www.gssiweb.org/sports-science-exchange/article/sse-168-fueling-the-basketball-athlete-the-practitioners-approach (accessed on 31 March 2022).
- Kerksick, C.M.; Arent, S.; Schoenfeld, B.J.; Stout, J.R.; Campbell, B.; Wilborn, C.D.; Taylor, L.; Kalman, D.; Smith-Ryan, A.E.; Kreider, R.B.; et al. International society of sports nutrition position stand: Nutrient timing. J. Int. Soc. Sports Nutr. 2017, 14, 33. [Google Scholar] [CrossRef]
- Williams, C.; Rollo, I. Carbohydrate Nutrition and Team Sport Performance. Sports Med. 2015, 45, S13–S22. [Google Scholar] [CrossRef] [PubMed]
- Jenner, S.L.; Buckley, G.L.; Belski, R.; Devlin, B.L.; Forsyth, A.K. Dietary Intakes of Professional and Semi-Professional Team Sport Athletes Do Not Meet Sport Nutrition Recommendations-A Systematic Literature Review. Nutrients 2019, 11, 1160. [Google Scholar] [CrossRef] [PubMed]
- Spiteri, T.; Newton, R.U.; Binetti, M.; Hart, N.H.; Sheppard, J.M.; Nimphius, S. Mechanical Determinants of Faster Change of Direction and Agility Performance in Female Basketball Athletes. J. Strength Cond. Res. 2015, 29, 2205–2214. [Google Scholar] [CrossRef] [PubMed]
- Senanayake, S.P.; Fernando, R.S.P.; Maddumage, R.S.; Perera, H.E.H.; Neranja, A.G.K.; Gallage, S.D.; Sandharenu, K.L.K.T.D. Body composition, does it affect the physical performance of basketball players? A pilot study conducted among general sir John Kotelawala defence university (KDU) basketball team. Int. J. Sci. Res. Publ. (IJSRP) 2021, 11, 379–382. [Google Scholar] [CrossRef]
- Dunford, M.; Doyle, J.A.; Killian, L. Nutriiton for Sports & Exercise, 5th ed.; Cengage: Boston, MA, USA, 2021. [Google Scholar]
- Hoffman, F.A., Jr.; Howard, R.; Maresh, C.M.; Kraemer, W.J. Strength, Speed and Endurance Changes During the Course of a Division I Basketball Season. J. Appl. Sport Sci. Res. 1991, 5, 144–149. [Google Scholar]
- Fields, J.B.; Merrigan, J.J.; White, J.B.; Jones, M.T. Seasonal and Longitudinal Changes in Body Composition by Sport-Position in NCAA Division I Basketball Athletes. Sports 2018, 6, 85. [Google Scholar] [CrossRef] [PubMed]
- Siders, W.A.; Bolonchuk, W.W.; Lukaski, H.C. Effects of participation in a collegiate sport season on body composition. J. Sports Med. Phys. Fit. 1991, 31, 571–576. [Google Scholar]
- DRI Recommendations. Available online: https://ods.od.nih.gov/HealthInformation/Dietary_Reference_Intakes.aspx (accessed on 2 April 2022).
- Maykish, A.; Nishisaka, M.M.; Talbott, C.K.; Reaves, S.K.; Kristo, A.S.; Sikalidis, A.K. Comparison of Whey Versus Almond Protein Powder on Nitrogen Balance in Female College Students; The California Almond Protein Powder Project (CAlmond-P3). Int. J. Environ. Res. Public Health 2021, 18, 11939. [Google Scholar] [CrossRef]
- Marthens, J.R.; Sanchez Porush, S.R.; Sharpless, S.A.; Oates, M.K.; Schaffner, A.A.; Sikalidis, A.K.; Reaves, S.K. The Effects of a Baseball Season on Various Body Composition Measurements in NCAA Division I Baseball Players. J. Exerc. Nutr. 2021, 4, 3. [Google Scholar]
- Nepocatych, S.; Balilionis, G.; O’Neal, E. Analysis of Dietary Intake and Body Composition of Female Athletes over a Competitive Season. Montenegrin J. Sports Sci. Med. 2017, 6, 57–65. [Google Scholar] [CrossRef]
- Zanders, B.R.; Currier, B.S.; Harty, P.S.; Zabriskie, H.A.; Smith, C.R.; Stecker, R.A.; Richmond, S.R.; Jagim, A.R.; Kerksick, C.M. Changes in Energy Expenditure, Dietary Intake, and Energy Availability Across an Entire Collegiate Women’s Basketball Season. J. Strength Cond. Res. 2021, 35, 804–810. [Google Scholar] [CrossRef]
- Werner, A.; Thiel, A.; Schneider, S.; Mayer, J.; Giel, K.E.; Zipfel, S. Weight-control behaviour and weight-concerns in young elite athletes—A systematic review. J. Eat. Disord. 2013, 1, 18. [Google Scholar] [CrossRef]
- Tarnopolsky, M.A.; Atkinson, S.A.; MacDougall, J.D.; Chesley, A.; Phillips, S.; Schwarcz, H.P. Evaluation of protein requirements for trained strength athletes. J. Appl. Physiol. 1992, 73, 1986–1995. [Google Scholar] [CrossRef]
- Mettler, S.; Mitchell, N.; Tipton, K.D. Increased protein intake reduces lean body mass loss during weight loss in athletes. Med. Sci. Sports Exerc. 2010, 42, 326–337. [Google Scholar] [CrossRef]
- Short, S.H.; Short, W.R. Four-year study of university athletes’ dietary intake. J. Am. Diet. Assoc. 1983, 82, 632–645. [Google Scholar] [CrossRef]
- Schröder, H.; Navarro, E.; Mora, J.; Seco, J.; Torregrosa, J.M.; Tramullas, A. Dietary Habits and Fluid Intake of a Group of Elite Spanish Basketball Players: A Need for Professional Advice? Eur. J. Sport Sci. 2004, 4, 1–15. [Google Scholar] [CrossRef]
- Nowak, R.K.; Knudsen, K.S.; Schulz, L.O. Body composition and nutrient intakes of college men and women basketball players. J. Am. Diet. Assoc. 1988, 88, 575–578. [Google Scholar] [CrossRef]
- Long, D.; Perry, C.; Unruh, S.A.; Lewis, N.; Stanek-Krogstrand, K. Personal food systems of male collegiate football players: A grounded theory investigation. J. Athl. Train. 2011, 46, 688–695. [Google Scholar] [CrossRef]
- Eugene, A.C.; Agwubuike, E.O. The interface of nutritional practices of selected basketball players of Nnamdi Azikiwe University, Awka, on performance. Glob. J. Health Sci. 2012, 4, 192–198. [Google Scholar] [CrossRef]
- Torres-McGehee, T.M.; Pritchett, K.L.; Zippel, D.; Minton, D.M.; Cellamare, A.; Sibilia, M. Sports nutrition knowledge among collegiate athletes, coaches, athletic trainers, and strength and conditioning specialists. J. Athl. Train. 2012, 47, 205–211. [Google Scholar] [CrossRef] [PubMed]
- Stanforth, P.; Crim, B.; Stanforth, D.; Stults-Kolehmainen, M. Body composition changes among female ncaa division 1 athletes across the competitive season and over a multiyear time frame. J. Strength Cond. Res. 2014, 28, 300–307. [Google Scholar] [CrossRef]
- Sinnging, W.E. Body Composition, Cardiorespiratory Function, and Rule Changes in Women’s Basketball. Am. Assoc. Health Phys. Educ. Recreat. 2013, 44, 313–321. [Google Scholar] [CrossRef]
- Johnson, G.O.; Thorland, W.G.; Housh, T.; Tharp, G.D.; Refsell, M.; Knortz, K. Effect of a competitive season on the body composition of female university athletic teams. Med. Sci. Sports Exerc. 1982, 14, 107. [Google Scholar] [CrossRef]
- Carbuhn, A.F.; Fernandez, T.E.; Bragg, A.F.; Green, J.S.; Crouse, S.F. Sport and training influence bone and body composition in women collegiate athletes. J. Strength Cond. Res. 2010, 24, 1710–1717. [Google Scholar] [CrossRef] [PubMed]
- Hudson, J.F.; Cole, M.; Morton, J.P.; Stewart, C.E.; Close, G.L. Daily Changes of Resting Metabolic Rate in Elite Rugby Union Players. Med. Sci. Sports Exerc. 2020, 52, 637–644. [Google Scholar] [CrossRef] [PubMed]
- McClave, S.A.; Lowen, C.C.; Kleber, M.J.; McConnell, J.W.; Jung, L.Y.; Goldsmith, L.J. Clinical use of the respiratory quotient obtained from indirect calorimetry. J. Parenter. Enter. Nutr. 2003, 27, 21–26. [Google Scholar] [CrossRef]
- Scafoglieri, A.; Clarys, J.P. Dual energy X-ray absorptiometry: Gold standard for muscle mass? J. Cachexia Sarcopenia Muscle 2018, 9, 786–787. [Google Scholar] [CrossRef]
- Cawthon, P.M.; Harrison, S.L.; Rogers-Soeder, T.; Webber, K.; Jonnalagadda, S.; Pereira, S.L.; Lane, N.; Cauley, J.A.; Shikany, J.M.; Farsijani, S.; et al. Body Weight, BMI, Percent Fat and Associations with Mortality and Incident Mobility Limitation in Older Men. Geriatrics 2021, 6, 53. [Google Scholar] [CrossRef]
- Crawford, P.B.; Obarzanek, E.; Morrison, J.; Sabry, Z.I. Comparative advantage of 3-day food records over 24-hour recall and 5-day food frequency validated by observation of 9- and 10-year-old girls. J. Am. Diet. Assoc. 1994, 94, 626–630. [Google Scholar] [CrossRef]


| Number of Players | 13 |
| Age | 20.45 ± 1.20 |
| Height (cm) | 189.86 ± 7.55 |
| Weight (kg) | 91.33 ± 11.62 |
| Scheme of Body Composition Assessments | |||
| September | December | March | |
| DXA scans | X | X | X |
| Measure | Pre-Season (Baseline) | In-Season | Post-Season |
|---|---|---|---|
| Weight (kg) | 91.33 ± 11.62 a | 91.18 ± 10.53 a | 91.46 ± 10.77 a |
| Lean Body Mass (kg) | 74.63 ± 8.87 a | 75.53 ± 8.59 a,b | 75.75 ± 9.26 b |
| % BF | 13.48 ± 3.60 a | 12.39 ± 3.60 b | 12.46 ± 3.54 b |
| Measure | Pre-Season (Baseline) | In-Season | Post-Season |
|---|---|---|---|
| RMR (kcal/day) | 2329.93± 232.85 a | 2491.01± 215.15 b | 2368.95 ± 264.13 a |
| RQ | 0.696 ± 0.04 a | 0.676 ± 0.03 a | 0.763 ± 0.06 b |
Publisher’s Note: MDPI stays neutral with regard to jurisdictional claims in published maps and institutional affiliations. |
© 2022 by the authors. Licensee MDPI, Basel, Switzerland. This article is an open access article distributed under the terms and conditions of the Creative Commons Attribution (CC BY) license (https://creativecommons.org/licenses/by/4.0/).
Share and Cite
Nishisaka, M.M.; Zorn, S.P.; Kristo, A.S.; Sikalidis, A.K.; Reaves, S.K. Assessing Dietary Nutrient Adequacy and the Effect of Season—Long Training on Body Composition and Metabolic Rate in Collegiate Male Basketball Players. Sports 2022, 10, 127. https://doi.org/10.3390/sports10090127
Nishisaka MM, Zorn SP, Kristo AS, Sikalidis AK, Reaves SK. Assessing Dietary Nutrient Adequacy and the Effect of Season—Long Training on Body Composition and Metabolic Rate in Collegiate Male Basketball Players. Sports. 2022; 10(9):127. https://doi.org/10.3390/sports10090127
Chicago/Turabian StyleNishisaka, Morgan M., Sebastian P. Zorn, Aleksandra S. Kristo, Angelos K. Sikalidis, and Scott K. Reaves. 2022. "Assessing Dietary Nutrient Adequacy and the Effect of Season—Long Training on Body Composition and Metabolic Rate in Collegiate Male Basketball Players" Sports 10, no. 9: 127. https://doi.org/10.3390/sports10090127