
Biomechanical and Psychological Predictors of Failure in the Air Force Physical Fitness Test

Abstract
:1. Introduction
2. Methods
Data Understanding and Preparation
- Participants would start with the physical and mental health questionnaires, mental health questionnaires were proctored by a licensed clinical psychologist, immediately followed by a body composition assessment proctored by a registered dietitian.
- The physical questionnaires assessed (1) their six-month history of musculoskeletal injury and whether the member sought medical evaluation for that injury, (2) if the member sustained an injury within the last six months, and if it impacted their participation in physical activities, (3) whether or not they were currently on a duty-limiting medical profile, and (4) on a five-point Likert scale the member indicated their perceived satisfaction with their current fitness level.
- BMI, body fat percentage, and muscle mass percentage were assessed by using the InBody230 (InBody LTD, Seoul, Republic of Korea) bioelectrical impedance analyzer [20].
- The assessment concluded with the administration of the APFT, which is further described below.
3. Statistical Analysis
3.1. Metrics
3.2. Classical Modeling
3.3. Neural Network Modeling
- A multi-dimensional hyperparameter search (neurons, layers, learning rate, epochs, and batch size) was performed on the training dataset using three-fold cross validation. Total neuron count was limited by the Widrow recommendation [31].
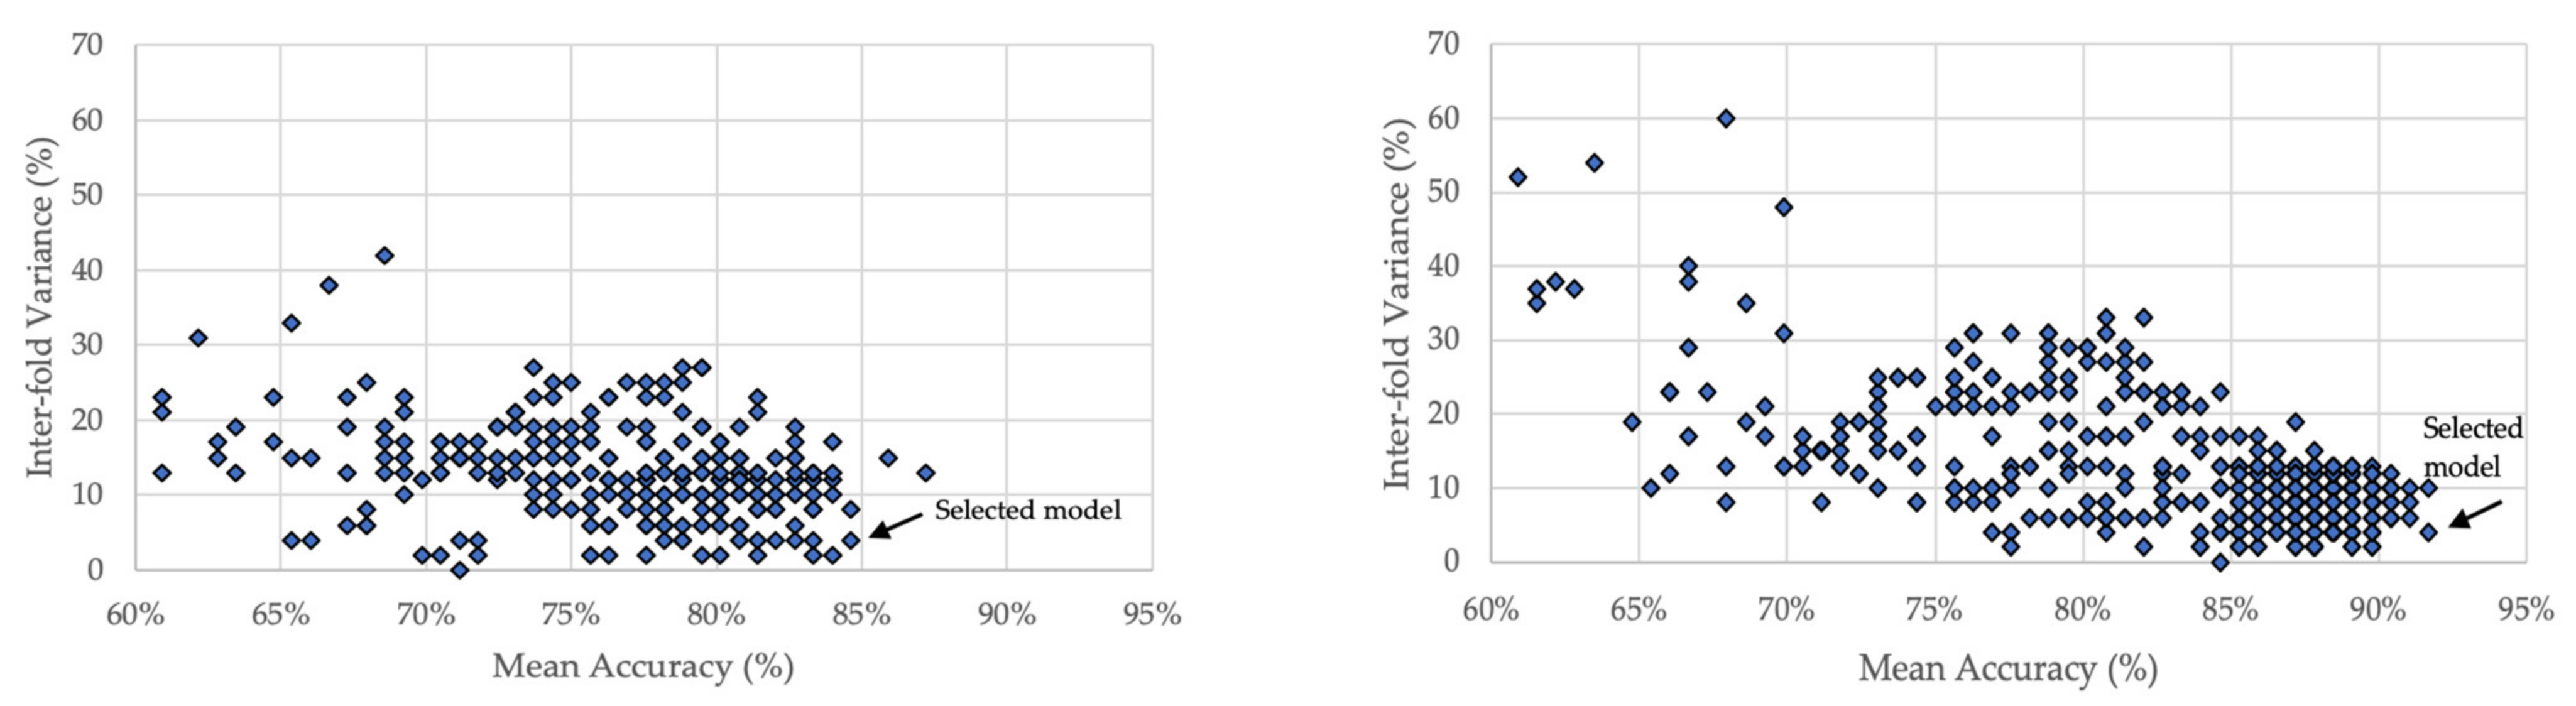
- Overfitting was monitored by comparing the accuracy of each fold. Models with >5% inter-fold accuracy variance were not considered for selection.
- An optimal set of hyperparameters was determined by the highest mean fold accuracy of the remaining models.
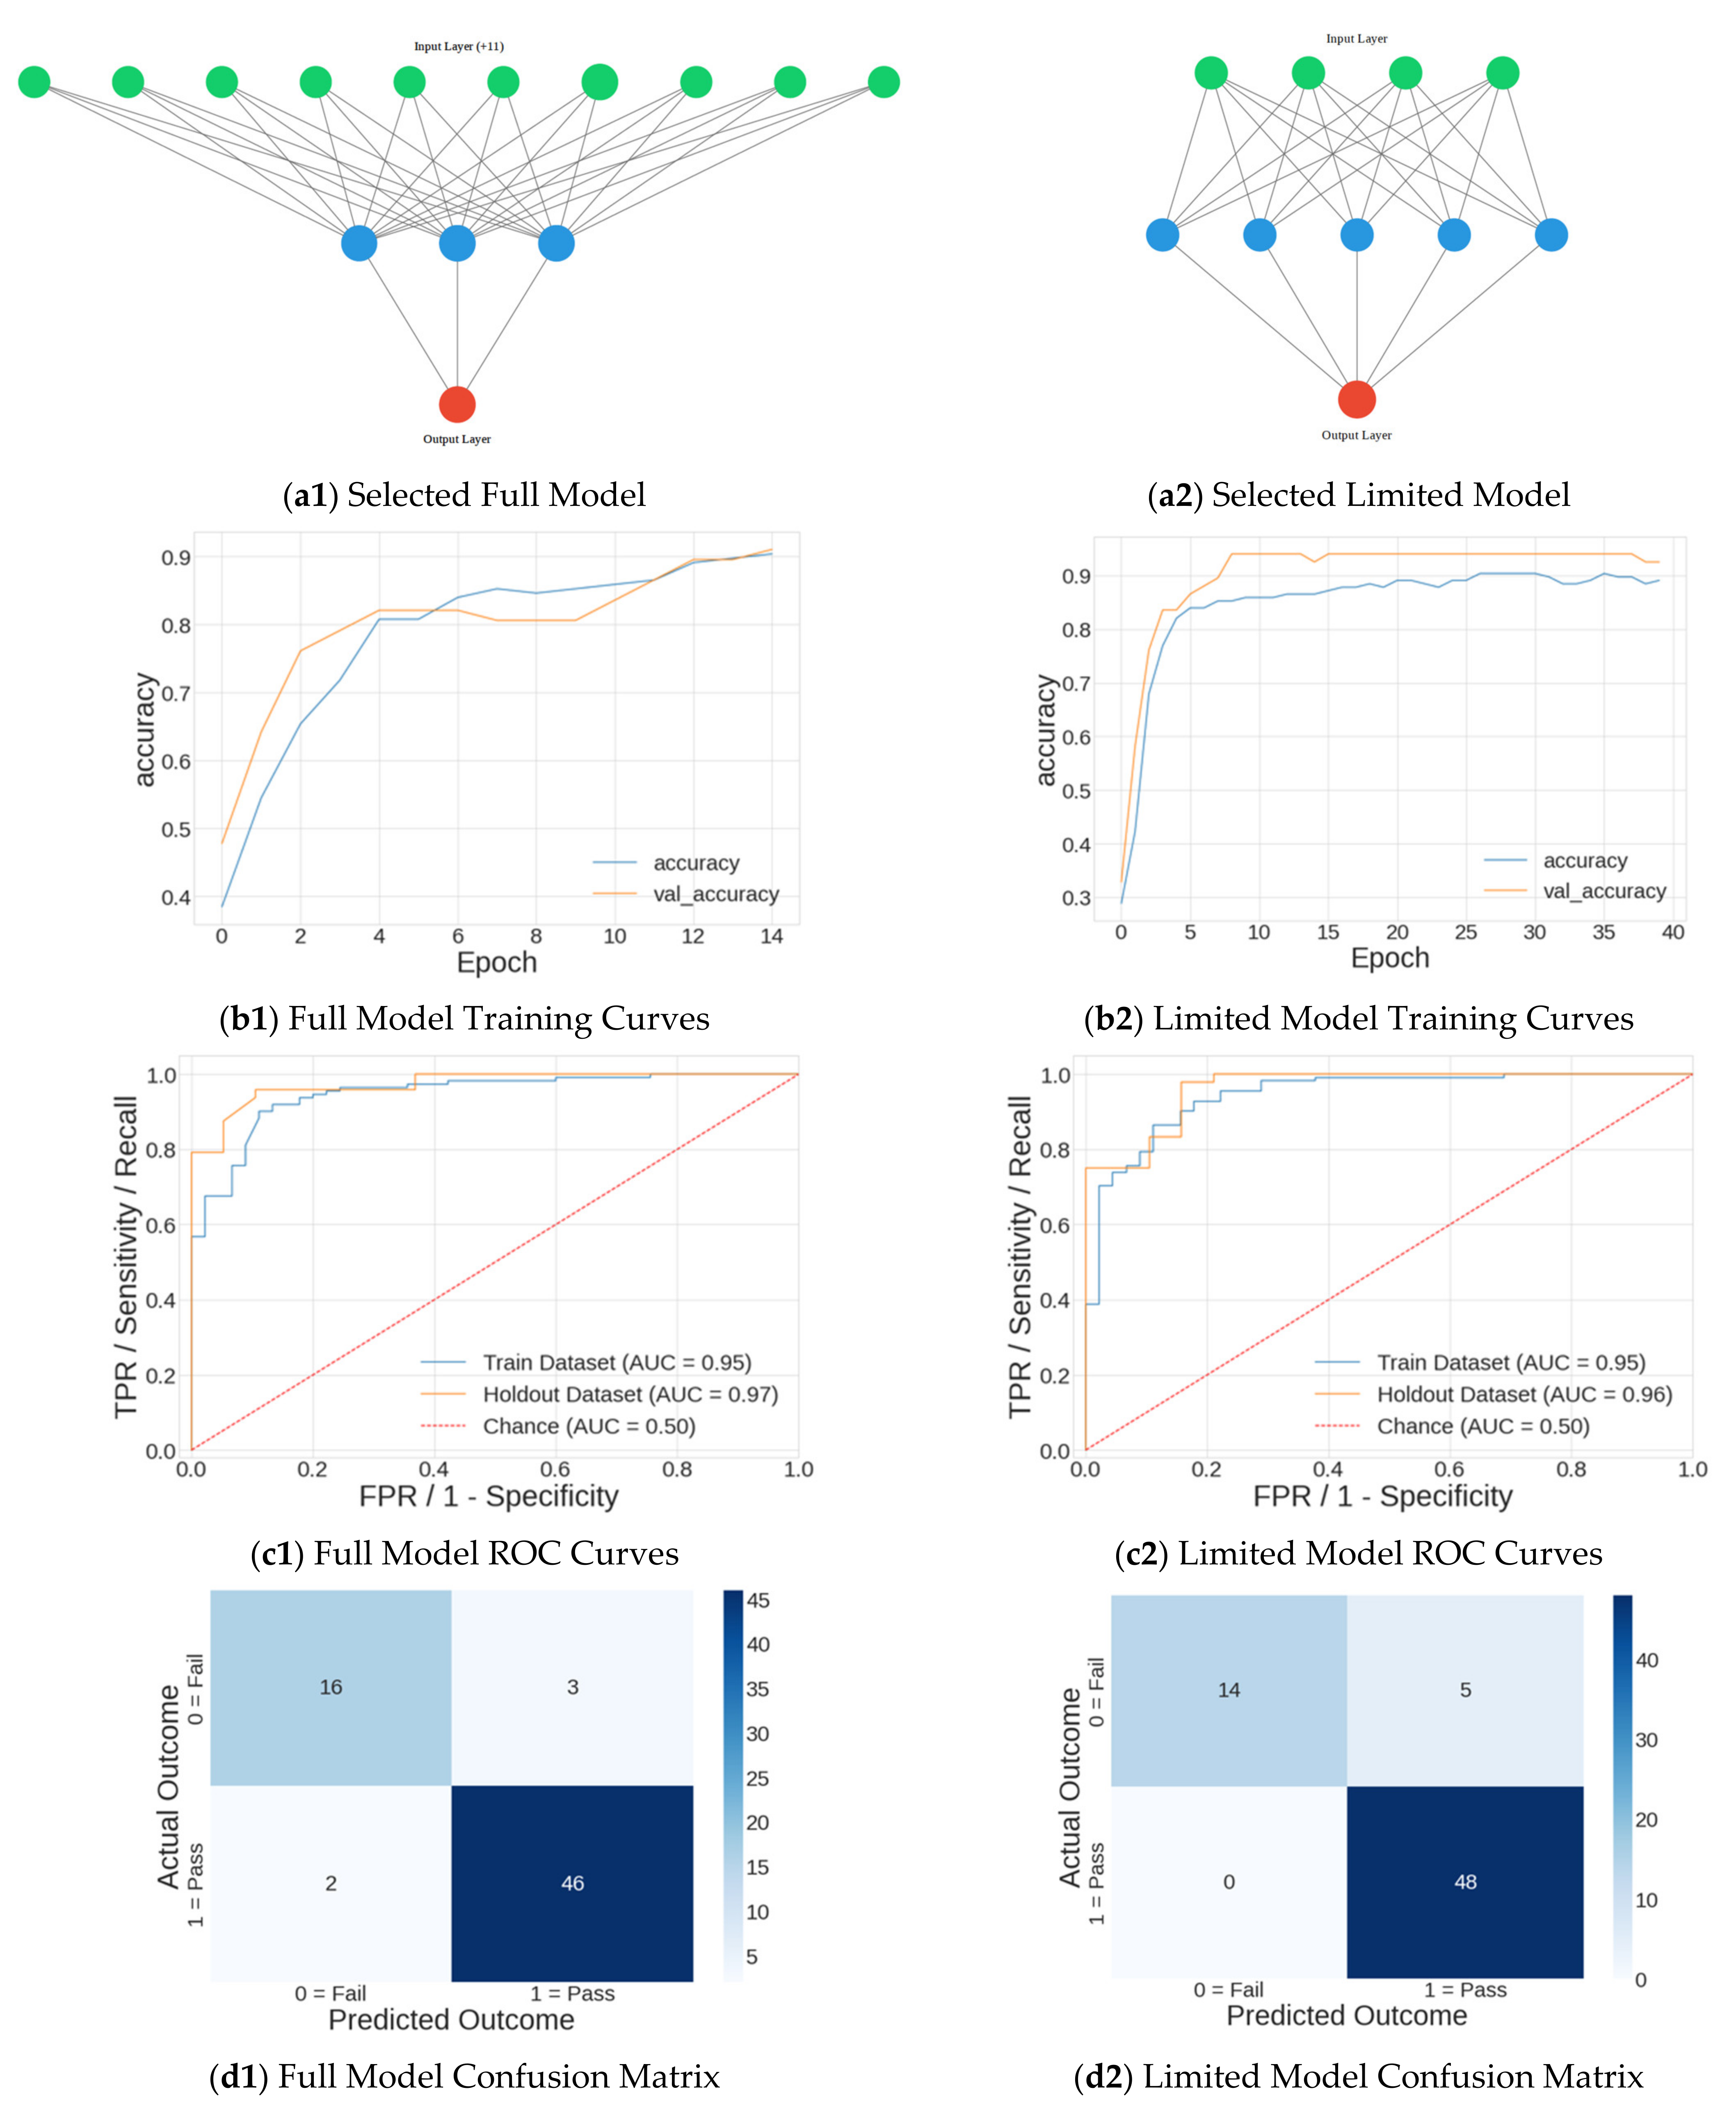
- Using the optimal hyperparameters, the model was then retrained on the entire training dataset.
- The model was validated by measuring metrics on the holdout dataset.
4. Results
4.1. Model Results
4.2. Classical Modeling
4.3. Neural Network Modeling
5. Discussion
6. Conclusions
Author Contributions
Funding
Institutional Review Board Statement
Informed Consent Statement
Data Availability Statement
Acknowledgments
Conflicts of Interest
Authors’ Note
References
- Molloy, J.; Pendergrass, T.; Lee, I.; Hauret, K.; Chervak, M.; Rhon, D. Musculoskeletal Injuries and United States Army Readiness. Part II: Management Challenges and Risk Mitigation Initiatives. Mil. Med. 2020, 185, 1472–1480. [Google Scholar] [CrossRef] [PubMed] [Green Version]
- Orr, R.; Sakurai, T.; Scott, J.; Movshovich, J.; Dawes, J.J.; Lockie, R.; Schram, B. The Use of Fitness Testing to Predict Occupational Performance in Tactical Personnel: A Critical Review. Int. J. Environ. Res. Public Health 2021, 18, 7480. [Google Scholar] [CrossRef] [PubMed]
- U.S. Army. Health of the Force; Army Public Health Center: Aberdeen Proving Ground, MD, USA, 2015.
- Baicker, K.; Cutler, D.; Song, Z. Workplace wellness programs can generate savings. Health Aff. 2010, 29, 304–311. [Google Scholar] [CrossRef] [PubMed] [Green Version]
- Gill, D.L.; Hammond, C.C.; Reifsteck, E.J.; Jehu, C.M.; Williams, R.A.; Adams, M.M.; Lange, E.H.; Becofsky, K.; Rodriguez, E.; Shang, Y.-T. Physical Activity and Quality of Life. J. Prev. Med. Public Health 2013, 46, S28–S34. [Google Scholar] [CrossRef]
- Knapik, J.; Darakjy, S.; Jones, B.; Hauret, K.; Piskator, G. A Review of the Literature on Attrition from the Military Services: Risk Factors and Strategies to Reduce Attrition; U.S. Army Center for Health Promotion and Preventive Medicine: Fort Knox, KY, USA, 2004. [Google Scholar]
- Orr, R.; Cohen, B.; Allison, S.; Bulathsinhala, L.; Zambraski, E.; Jaffrey, M. Models to predict injury, physical fitness failure and attrition in recruit training: A retrospective cohort study. Mil. Med. Res. 2020, 7, 26. [Google Scholar] [CrossRef]
- Sih, B.; Negus, C. Physical Training Outcome Predictions with Biomechanics, Part I: Army Physical Fitness Test Modeling. Mil. Med. 2016, 181, 77–84. [Google Scholar] [CrossRef] [Green Version]
- Allison, S.; Knapik, J.; Sharp, M. Preliminary Derivation of Test Item Clusters for Predicting Injuries, Poor Physical Performance, and Overall Attrition in Basic Combat Training; U.S. Army Medical Research and Materiel Command: Fort Detrick, MD, USA, 2006. [Google Scholar]
- Ahn, H.; Kim, Y.; Jeong, J.; So, Y. Physical Fitness Level and Mood State Changes in Basic Military Training. Int. J. Environ. Res. Public Health 2020, 17, 9115. [Google Scholar] [CrossRef]
- Cardenas, D.; Madinabeitia, I.; Alarcon, F.; Perales, J.C. Does Emotion Regulation Predict Gains in Exercise-Induced Fitness? A Prospective Mixed-Effects Study with Elite Helicopter Pilots. Int. J. Environ. Res. Public Health 2020, 17, 4174. [Google Scholar] [CrossRef]
- Vaara, J.P.; Eranen, L.; Ojanen, T.; Pihlainen, K.; Nykanen, T.; Kallinen, K.; Heikkinen, R.; Kryolainen, H. Can Physiological and Psychological Factors Predict Dropout from Intense 10-Day Winter Military Survival Training? Int. J. Environ. Res. Public Health 2020, 17, 9064. [Google Scholar] [CrossRef]
- Swets, J. Measuring the accuracy of diagnostic systems. Science 1988, 240, 1285–1293. [Google Scholar] [CrossRef] [Green Version]
- Wagner, T.; Langhals, B.; Turner, J. Dataset: Biomechanical & Psychological Predictors of Failure in the Air Force Physical Fitness Test. Mendeley Data 2022. [Google Scholar]
- Caffrey, Y.; U.S. Air Force, Washington, DC, USA. Interviewee. Personal communication, 2021.
- Miller, S.; Duncan, B.; Brown, J.; Sparks, J.; Claud, D. The Outcome Rating Scale: A Preliminary Study of the Reliability, Validity, and Feaibility of a Brief Visual Analog Measure. J. Brief Ther. 2003, 2, 91–100. [Google Scholar]
- Wortmann, J.; Jordan, A.; Weathers, F.; Resick, P.; Dondanville, K.; Hall-Clark, B.; Foa, E.; Young-McCaughan, S.; Yarvis, J.; Hembree, E.; et al. Pyschometric analysis of the PTSD Checklist-5 (PCL-5) among treatment-seeking military service members. Pyschol. Assess. 2016, 28, 1392–1403. [Google Scholar] [CrossRef]
- Johns, M. A new method for measuring daytime sleepiness: The Epworth sleepiness scale. Sleep 1991, 14, 540–545. [Google Scholar] [CrossRef] [Green Version]
- Hansen, V.; Pit, S. The Single Item Burnout Measure is a Psychometrically Sound Screening Tool for Occupational Burnout. Health Scope 2016, 5, e32164. [Google Scholar] [CrossRef] [Green Version]
- McLester, B.; Nickerson, K.; McLester, J. Reliability and Agreement of Various InBody Body Composition Analyzers as Compared to Dual-Energy X-Ray Absorptiometry in Healthy Men and Women. J. Clin. Densitom. 2020, 23, 443–450. [Google Scholar] [CrossRef]
- Bock, K.; Orr, R. Use of the Functional Movement Screen in a Tactical Population: A Review. J. Mil. Veteran Health 2015, 23, 33–42. [Google Scholar]
- Kollock, R.; Lyons, M.; Sanders, G.; Hale, D. The effectiveness of the functional movement screen in determining injury risk in tactical occupations. Ind. Health 2019, 57, 406–418. [Google Scholar] [CrossRef] [Green Version]
- IBM Corporation. IBM SPSS Modeler CRISP-DM Guide; IBM Corporation: Armonk, NY, USA, 2011. [Google Scholar]
- Bonazza, N.; Smuin, D.; Onks, C.; Silvis, M.; Dhawan, A. Reliability, Validity, and Injury Predictive Value of the Functional Movement Screen: A Systematic Review and Meta-analysis. Am. J. Sports Med. 2017, 45, 725–732. [Google Scholar] [CrossRef]
- Teyhen, D.; Shaffer, S.; Lorenson, C.; Halfpap, J.; Donofry, D.; Walker, M.; Dugan, J.; Childs, J. The Functional Movement Screen: A reliability study. J. Orthop. Sports Phys. Ther. 2012, 42, 530–540. [Google Scholar] [CrossRef] [Green Version]
- Cuchna, J.; Hoch, M.; Hoch, J. The interrater and intrarater reliability of the functional movement screen: A systematic review with meta-analysis. Phys. Ther. Sport 2016, 19, 57–65. [Google Scholar] [CrossRef]
- U.S. Air Force. Air Force Manual 36-2905 Air Force Physical Fitness Program; Secretary of the Air Force: Washington, DC, USA, 2020.
- Ruder, S. An overview of gradient descent optimization algorithms. arXiv 2016, arXiv:1609.04747. [Google Scholar]
- Li, K.; Malik, J. Learning to Optimize Neural Nets. arXiv 2017, arXiv:1703.00441. [Google Scholar]
- Goodfellow, I.; Bengio, Y.; Courville, A. Deep Learning; The MIT Press: Cambridge, UK, 2017. [Google Scholar]
- Widrow, B. ADALINE and MADALINE. In Proceedings of the 1st International Conference on Neural Networks, San Diego, CA, USA, 21–24 June 1987. [Google Scholar]
- American Council on Exercise. Percent Body Fat Calculator: Skinfold Method. 2021. Available online: https://www.acefitness.org/education-and-resources/lifestyle/tools-calculators/percent-body-fat-calculator/ (accessed on 14 October 2021).
- Knapik, J.; Rieger, W.; Palkoska, F.; van Camp, S.; Darakjy, S. United States Army physical readiness training: Rationale and evaluation of the physical training doctrine. J. Strength Cond. Res. 2009, 23, 1353–1362. [Google Scholar] [CrossRef]
- Molloy, J. Factors influencing running-related musculoskeletal injury risk among U.S. military recruits. Mil. Med. 2016, 181, 512–523. [Google Scholar] [CrossRef] [Green Version]


| Description of Work | Method Used | Performance | Ref |
|---|---|---|---|
| Predict Fitness Assessment Failure in Australian Army | Classification, logistic regression. | AUC = 0.70 | [7] |
| Predict U.S. Army Fitness Assessment 2-mile run time | Regression, phenomenological model. | R2 = 0.55–0.59 | [8] |
| Predict U.S. Army Fitness Assessment Failure | Classification, logistic regression | AUC = 0.61–0.77 (F) AUC = 0.61–0.80 (M) | [9] |
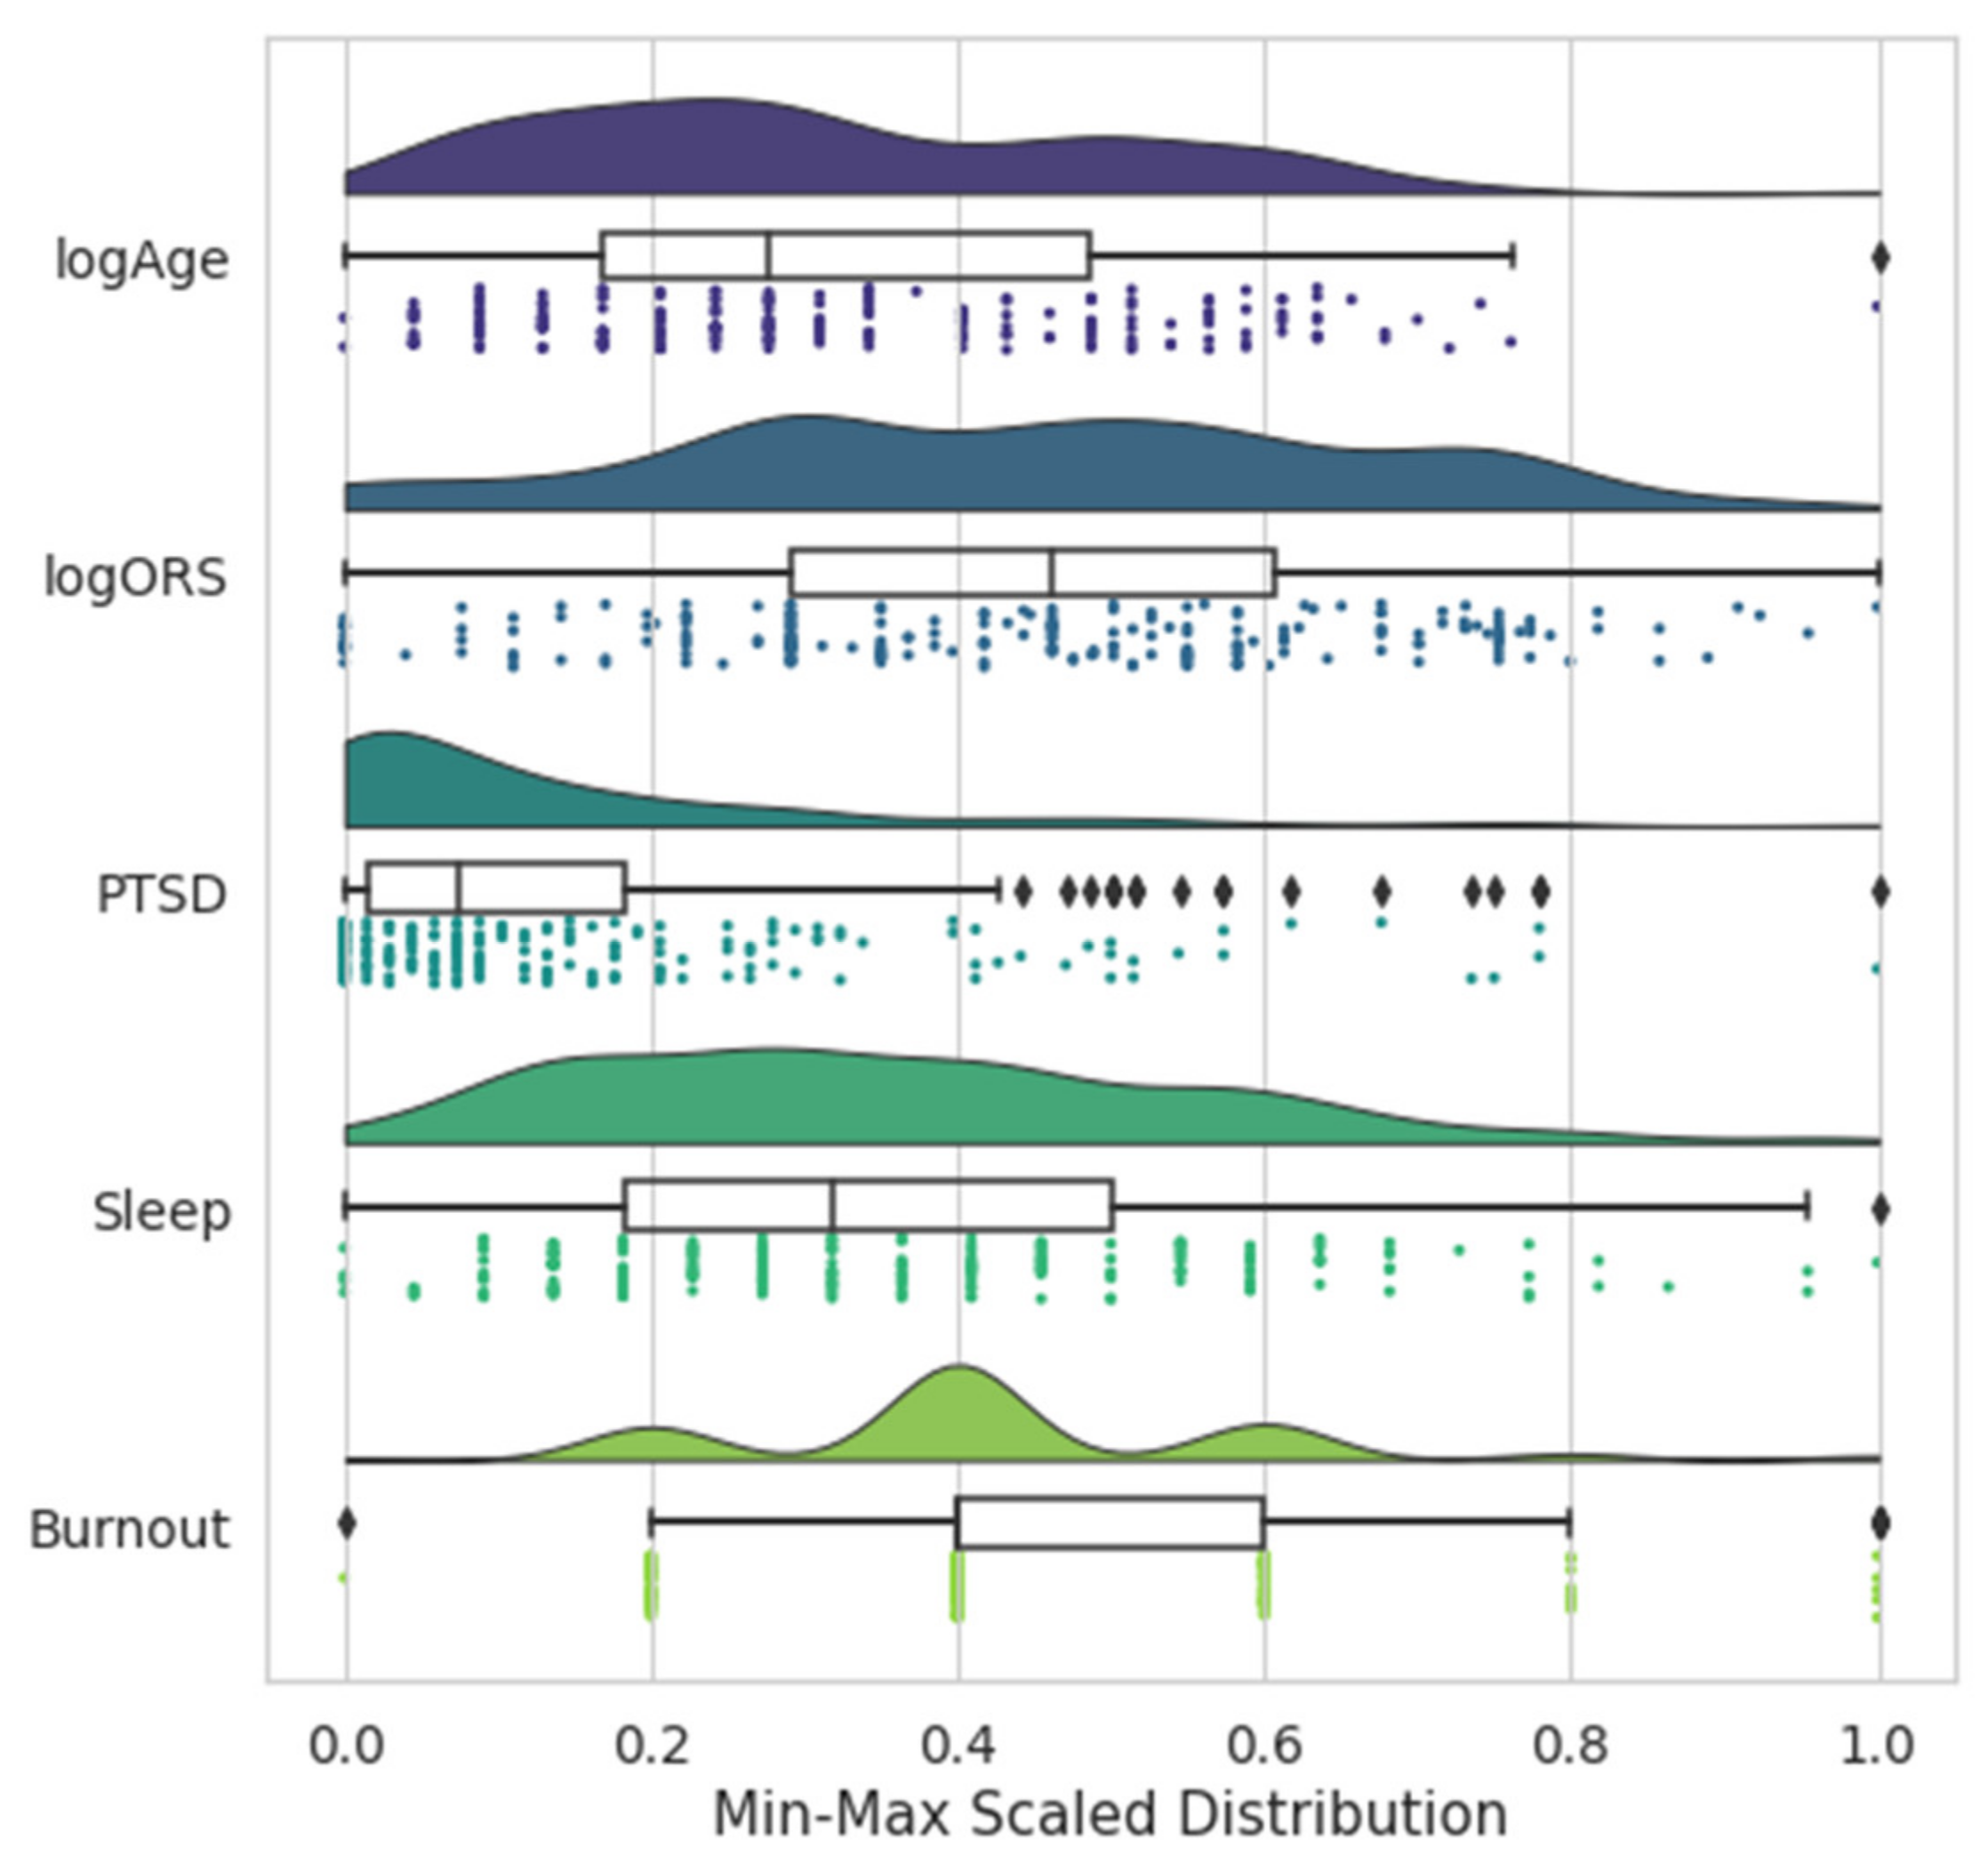
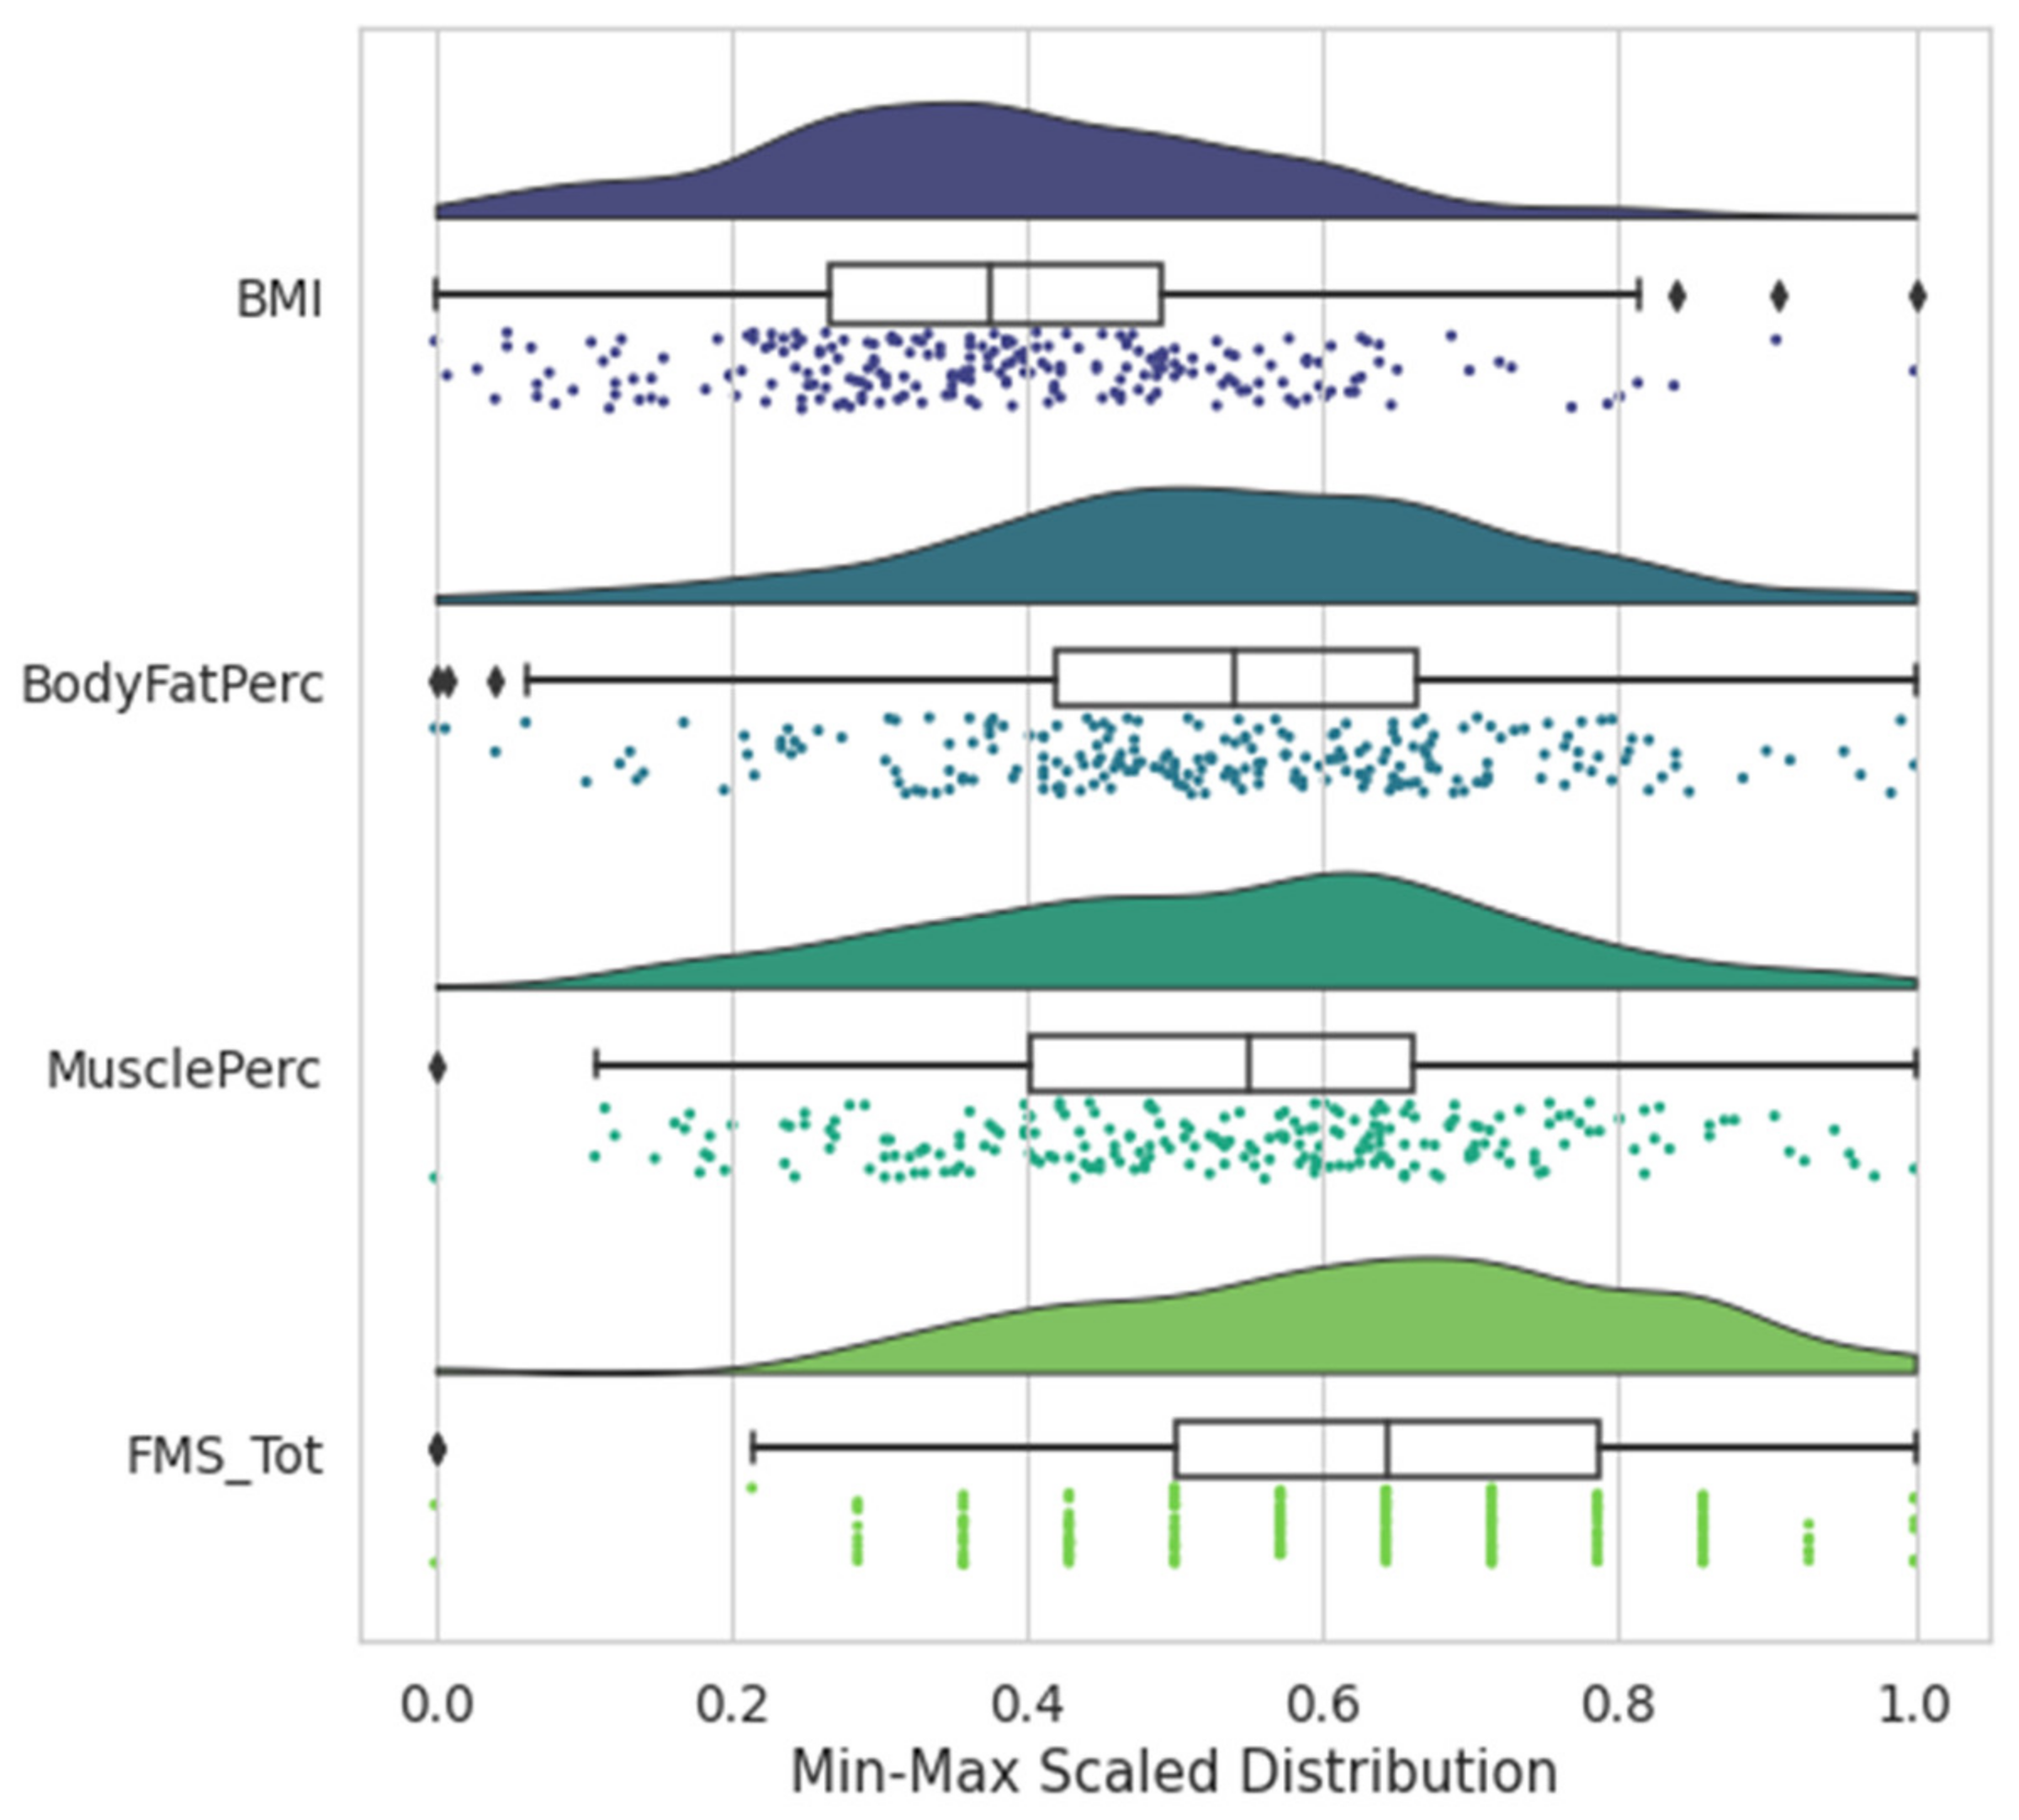
| Variable | Mean | Max | Std Dev | Data Distribution | Notes/Definition |
|---|---|---|---|---|---|
| Age * | 28.15 | 59 | 6.60 | ~Log-Normal | --- |
| Gender | 0.25 | 1 | 0.43 | Binary | 0 = Male (174 members) 1 = Female (49 members) |
| ORS Total * | 7.63 | 10 | 1.95 | ~Log-Normal | Outcome Rating Scale [16] |
| ORS Social | 7.29 | 10 | 2.05 | ~Log-Normal | --- |
| ORS Interpersonal | 7.59 | 10 | 2.08 | ~Log-Normal | --- |
| ORS Individual | 7.35 | 10 | 2.02 | ~Log-Normal | --- |
| PTSD | 9.28 | 68 | 11.75 | Right-skewed | Post-Traumatic Stress Disorder Checklist (PCL-5) [17] |
| Sleep | 7.32 | 22 | 3.92 | ~Normal | --- [18] |
| Burnout | 2.14 | 7 | 0.81 | ~Normal | --- [19] |
| InjuryEval | 0.30 | 1 | 0.46 | Binary | 1 = Recent injury evaluated by provider |
| InjuryNoEval | 0.12 | 1 | 0.33 | Binary | 1 = Recent injury not evaluated by provider |
| DLC | 0.09 | 1 | 0.29 | Binary | 1 = Duty Limiting Condition |
| FitSat | 3.32 | 5 | 0.81 | Categorical | Fitness Satisfaction |
| PhysRestr | 0.27 | 1 | 0.45 | Binary | 1 = Recent injury resulting in physical activity restriction |
| BMI | 27.13 | 42.3 | 4.10 | ~Normal | Body Mass Index [20] |
| BodyFatPerc | 0.29 | 0.49 | 0.82 | ~Normal | Body Fat Percentage [20] |
| MusclePerc | 0.33 | 0.47 | 0.06 | ~Normal | Muscle Mass Percentage [20] |
| FMS_Shldr | 0.12 | 1 | 0.33 | Binary | 1 = Functional Movement Screen (FMS) Shoulder Pain [21,22] |
| FMS_Ext | 0.21 | 1 | 0.41 | Binary | 1 = FMS Low Back Pain [21,22] |
| FMS_Flex | 0.06 | 1 | 0.23 | Binary | 1 = FMS Hip Pain [21,22] |
| FMS Total | 14.28 | 20 | 2.60 | ~Normal | FMS Composite Score [21,22] |
| Model | p-Value | AUC | Precision | Recall | Accuracy |
|---|---|---|---|---|---|
| Full | <0.01 | 0.82 | 0.79 | 0.79 | 0.79 |
| 5-feature p-value 1 | <0.01 | 0.86 | 0.82 | 0.82 | 0.82 |
| 4-feature p-value 2 | <0.01 | 0.89 | 0.83 | 0.84 | 0.84 |
| Recursive feature elimination (RFE) 3 | <0.01 | 0.87 | 0.75 | 0.75 | 0.75 |
| Select K Best 4 | <0.01 | 0.86 | 0.82 | 0.82 | 0.82 |
| Chance | -- | 0.50 | 0.56 | 0.48 | 0.48 |
| Always Predicts Pass | -- | 0.50 | 0.51 | 0.72 | 0.72 |
| Goal | -- | 0.80 | -- | -- | 0.90 |
| Hyperparameter | Full Model Range | Limited Model Range |
|---|---|---|
| Neurons | 2, 3, 4, 5, 10 | 1, 2, 3, 4, 5, 7, 9, 12 |
| Hidden layers | 0, 1, 2 | 0, 1, 2, 3 |
| Batch size | 16, 32 | 16, 32 |
| Epochs | 15, 20, 60, 100, 140 | 15, 20, 60, 100, 140 |
| Learning rate | 0.01, 0.001, 0.0005 | 0.01, 0.001, 0.0005 |
| Dataset | Neurons | Layers | Learn Rate | Batch Size | Epochs | Mean Fold Accuracy (%) | Inter-Fold Variance (%) |
|---|---|---|---|---|---|---|---|
| Full 21 feature NN | 10 | 1 | 0.001 | 16 | 140 | 87.2 | 13 |
| 10 | 1 | 0.01 | 32 | 20 | 85.9 | 15 | |
| 3 | 0 | 0.01 | 16 | 15 | 84.6 | 4 | |
| 3 | 2 | 0.01 | 32 | 140 | 84.6 | 8 | |
| 5 | 2 | 0.01 | 16 | 20 | 84.0 | 2 | |
| Limited 4 feature NN | 5 | 0 | 0.01 | 16 | 40 | 91.7 | 4 |
| 3 | 1 | 0.01 | 16 | 100 | 91.7 | 10 | |
| 3 | 0 | 0.01 | 16 | 60 | 91.0 | 6 | |
| 40 | 1 | 0.001 | 32 | 60 | 91.0 | 10 | |
| 5 | 0 | 0.01 | 32 | 60 | 91.0 | 8 |
| Model | AUC | Precision | Recall | Accuracy |
|---|---|---|---|---|
| Baseline | 0.94 | 0.89 | 0.90 | 0.90 |
| Full 21-input model | 0.97 | 0.92 | 0.93 | 0.93 |
| Limited 4-input model | 0.96 | 0.93 | 0.93 | 0.93 |
| Goal | 0.80 | -- | -- | 0.90 |
Publisher’s Note: MDPI stays neutral with regard to jurisdictional claims in published maps and institutional affiliations. |
© 2022 by the authors. Licensee MDPI, Basel, Switzerland. This article is an open access article distributed under the terms and conditions of the Creative Commons Attribution (CC BY) license (https://creativecommons.org/licenses/by/4.0/).
Share and Cite
Turner, J.; Wagner, T.; Langhals, B. Biomechanical and Psychological Predictors of Failure in the Air Force Physical Fitness Test. Sports 2022, 10, 54. https://doi.org/10.3390/sports10040054
Turner J, Wagner T, Langhals B. Biomechanical and Psychological Predictors of Failure in the Air Force Physical Fitness Test. Sports. 2022; 10(4):54. https://doi.org/10.3390/sports10040054
Chicago/Turabian StyleTurner, Jeffrey, Torrey Wagner, and Brent Langhals. 2022. "Biomechanical and Psychological Predictors of Failure in the Air Force Physical Fitness Test" Sports 10, no. 4: 54. https://doi.org/10.3390/sports10040054