Article

Comparative Analysis of Mitogenomes of Chironomus (Diptera: Chironomidae)

1
Engineering Research Center of Environmental DNA and Ecological Water Health Assessment, Shanghai Ocean University, Shanghai 201306, China
2
Shanghai Universities Key Laboratory of Marine Animal Taxonomy and Evolution, Shanghai Ocean University, Shanghai 201306, China
3
State Key Laboratory of Environmental Criteria and Risk Assessment, Chinese Research Academy of Environmental Sciences, Beijing 100012, China
4
China National Environmental Monitoring Centre, Beijing 100012, China
*
Authors to whom correspondence should be addressed.
These authors contributed equally to this work.
Insects 2022, 13(12), 1164; https://doi.org/10.3390/insects13121164
Submission received: 25 October 2022 / Revised: 18 November 2022 / Accepted: 18 November 2022 / Published: 16 December 2022

Abstract

:

Simple Summary

Mitochondrial genomes (mitogenomes) have been widely used for studying the taxonomy and phylogeny of insects. Chironomids are important bioindicators for monitoring and assessing the health of freshwater ecosystems. However, only a few complete mitogenomes of Chironomus species have been reported till now. In this study, the whole mitogenome sequences of 12 Chironomus species and one Microchironomus species are reported for the first time. Coupled with published mitogenomes, the nucleotide composition, codon usage, PCG selection pressure, and heterogeneity of the mitogenomes of 15 Chironomus species were analyzed. The phylogenetic relationships of Chironomus based on mitogenomes were reconstructed. The result showed that the mitogenomes of Chironomus species were conservative in respect of nucleotide composition and gene order. Our study enriches the library of mitogenomes of chironomids and provides a valuable resource for understanding the evolutionary history of Chironomus.

Abstract

(1) Background: Chironomids are biological indicators, playing an important role in monitoring and assessing the changes in water ecosystems. Mitochondrial genomes have been widely applied as a molecular marker to analyze the taxonomy and phylogeny of insects. However, knowledge of the mitogenomes of Chironomus species is scarce at present, which limits our understanding of the evolutionary relationships among Chironomus. (2) Methods: In our study, the mitogenomes and their basic structure of 12 Chironomus species and one Microchironomus species were newly sequenced. Combined with reported mitogenomes, a total of 15 mitogenomes of Chironomus were selected for a comparative mitogenomic analysis and phylogenetic reconstruction of Chironomus. (3) Results: Each mitogenome of the Chironomus species has the typical 37 genes and a control region. The basic structure of the whole mitogenomes of Chironomus species is relatively conservative, and the genetic arrangements stay the same as the ancestral mitogenome. (4) Conclusions: Our study enriches the library of mitogenomes of chironomids and provides a valuable resource for understanding the evolutionary history of Chironomus.

1. Introduction

The mitochondrial genome (mitogenome) of insects is a 14–20 kb circular molecule, including 13 protein-coding genes (PCGs), two ribosomal RNAs (rRNAs), 22 transfer RNAs (tRNAs), and one non-coding control region (CR) [1]. Mitogenomes are considered as useful molecular markers for phylogenetic and evolutionary analysis in many insect groups [2,3,4,5] due to their small genome size, maternal inheritance, low sequence recombination, and fast evolutionary rates [6,7]. With the wide application of the high-throughput sequencing technology, mitogenomes have proven successful in species delimitation and phylogenetics among aquatic insects [4,5,8,9,10,11,12,13,14,15].
Chironomidae is one of the most abundant and species-diverse groups of freshwater zoobenthos, containing over 6300 described species worldwide (P. Ashe pers comm.). Chironomid larvae can be found in all types of water bodies and are regarded as significant bioindicators for monitoring and assessing the health of freshwater ecosystems. Chironomus is the type genus of Chironomidae and includes over 300 described species distributed over the world except Antarctica [16]. Species delimitation and phylogeny within Chironomus have been conducted by morphology or a few genetic markers in previous studies [17,18]. Hence, phylogenetics among Chironomus has never been tested based on mitogenomes. Prior to this study, the mitogenomes of three Chironomus species have been reported [19,20,21], and the comparative analysis of nucleotide composition and evolutionary rates within the genus have never been carried out.
In this study, we provided new mitogenomes of 12 Chironomus species and one Microchironomus species. Combined with the reported mitogenomes of three Chironomus species, we investigated the basic characteristics of these mitogenomes of Chironomus.

2. Materials and Methods

2.1. Taxon Sampling and Sequencing

The 12 species of Chironomus and one species of Microchironomus were collected from China, Namibia, New Caledonia and Norway, and used for mitogenome sequencing (Table 1). In addition, mitogenomes of Chironomus tepperi, Chironomus flaviplumus, Chironomus kiiensis, and Microchironomus tabarui were retrieved from GenBank for comparative mitogenomic analysis and phylogeny. The vouchers are deposited at College of Fisheries and Life, Shanghai Ocean University, Shanghai, China. The total genomic DNA was extracted from the thorax of an adult or larva using the Qiagen DNA blood and tissue Kit (Qiagen, Hilden, Germany). The genomes of 13 species were sequenced using the Illumina NovaSeq 6000 platform with an insert size of 350 bp and a paired-end 150 bp sequencing strategy at Novogene Co., Ltd. (Beijing, China). The raw reads were trimmed of adapters by Trimmomatic [22], and approximately 3 Gb of clean data in each sample was obtained.

2.2. Genome Assembly and Annotation

The seed sequence COI of each species was obtained on GenBank for verification during assembly. The mitogenome sequences were de novo assembled using NovoPlasty v 4.2 [24] with 39 kmer and IDBA-UD [25] with the minimum and maximum kmer values of 40 and 120 bp, respectively. In order to check the correctness of the mitogenome sequences, we used Geneious [26] to compare the obtained sequences and compile them into a single sequence. Transport RNA (tRNA) genes were detected on MITOS2 web server (http://mitos2.bioinf.uni-leipzig.de/index.py, accessed on 20 May 2022). The rRNAs and PCGs were annotated manually with the Chironomus tepperi as a reference using Clustal Omega in Geneious. Finally, the new mitogenome sequences were deposited in GenBank of NCBI (ON975023–ON975035).

2.3. Sequence Analyses

Nucleotide composition of the mitogenome and each type of gene were calculated using SeqKit [27]. The bias of AT and CG were measured according to the formulas: AT-skew = (A − T)/(A + T) and GC-skew = (G − C)/(G + C). Codon family usage of protein-coding gene and relative synonymous codon usage (RSCU) were assessed in MEGA 11 [28]. Non-synonymous substitution rate (Ka) and synonymous substitution rate (Ks) of 13 PCGs were calculated in DnaSP 6 [29].

2.4. Phylogenetic Analyses

The mitogenome map was depicted with CGview server [30]. In this study, 12 newly sequenced Chironomus species and three Chironomus species retrieved on GenBank were selected as the ingroups of phylogenetic analysis, and two species of Microchironomus (Microchironomus tabarui and Microchironomus tener) were selected as the outgroups. Thirteen PCGs and two rRNAs of each species were individually compared using MAFFT [31], and then trimmed using trimAl [32] to align the sequence. FASconCAT-G_v1.05 [33] was used to concatenate aligned sequences of each gene and generate 4 datasets: (1) PCG123 (all codon positions of the 13 PCGs) contained 11,175 sites; (2) PCG123R (all codon positions of the 13 PCGs and two rRNAs) contained 13,357 sites; (3) PCG12R (the 1st and 2nd codon positions of the 13 PCGs and two rRNAs) contained 9632 sites; (4) AA (amino acid sequences of the 13 PCGs) contained 3725 sites. Transition and transversion rates were evaluated in DAMBE to test the level of base substitution saturation [34]. The substitution of each dataset (PCG123R, PCG12R, and PCG123) was not saturated (Figure S1). The heterogeneity analysis of four datasets was performed with AliGROOVE_1.06 [35]. The best partitioning scheme and the best-fit substitution model inferred for each partition were tested using PartitionFinder 2.0 [36] with the Bayesian Information Criterion. Phylogenetic analyses were carried out with Bayesian inference (BI) and maximum likelihood (ML) reconstruction. BI analysis was conducted using MrBayes 3.2.7 [37] with the best-fit substitution model (Table S1). Markov chain Monte Carlo (MCMC) was run twice for 10,000,000 generations, trees were sampled once every 1000 generations, and the first 25% of trees were discarded as burin-in. The chains were stopped after the two runs had satisfactorily converged. The ML analysis was conducted using IQ-TREE 2 [38] with the best-fit substitution model (Table S1) and 1000 bootstrap replicates.

3. Results and Discussion

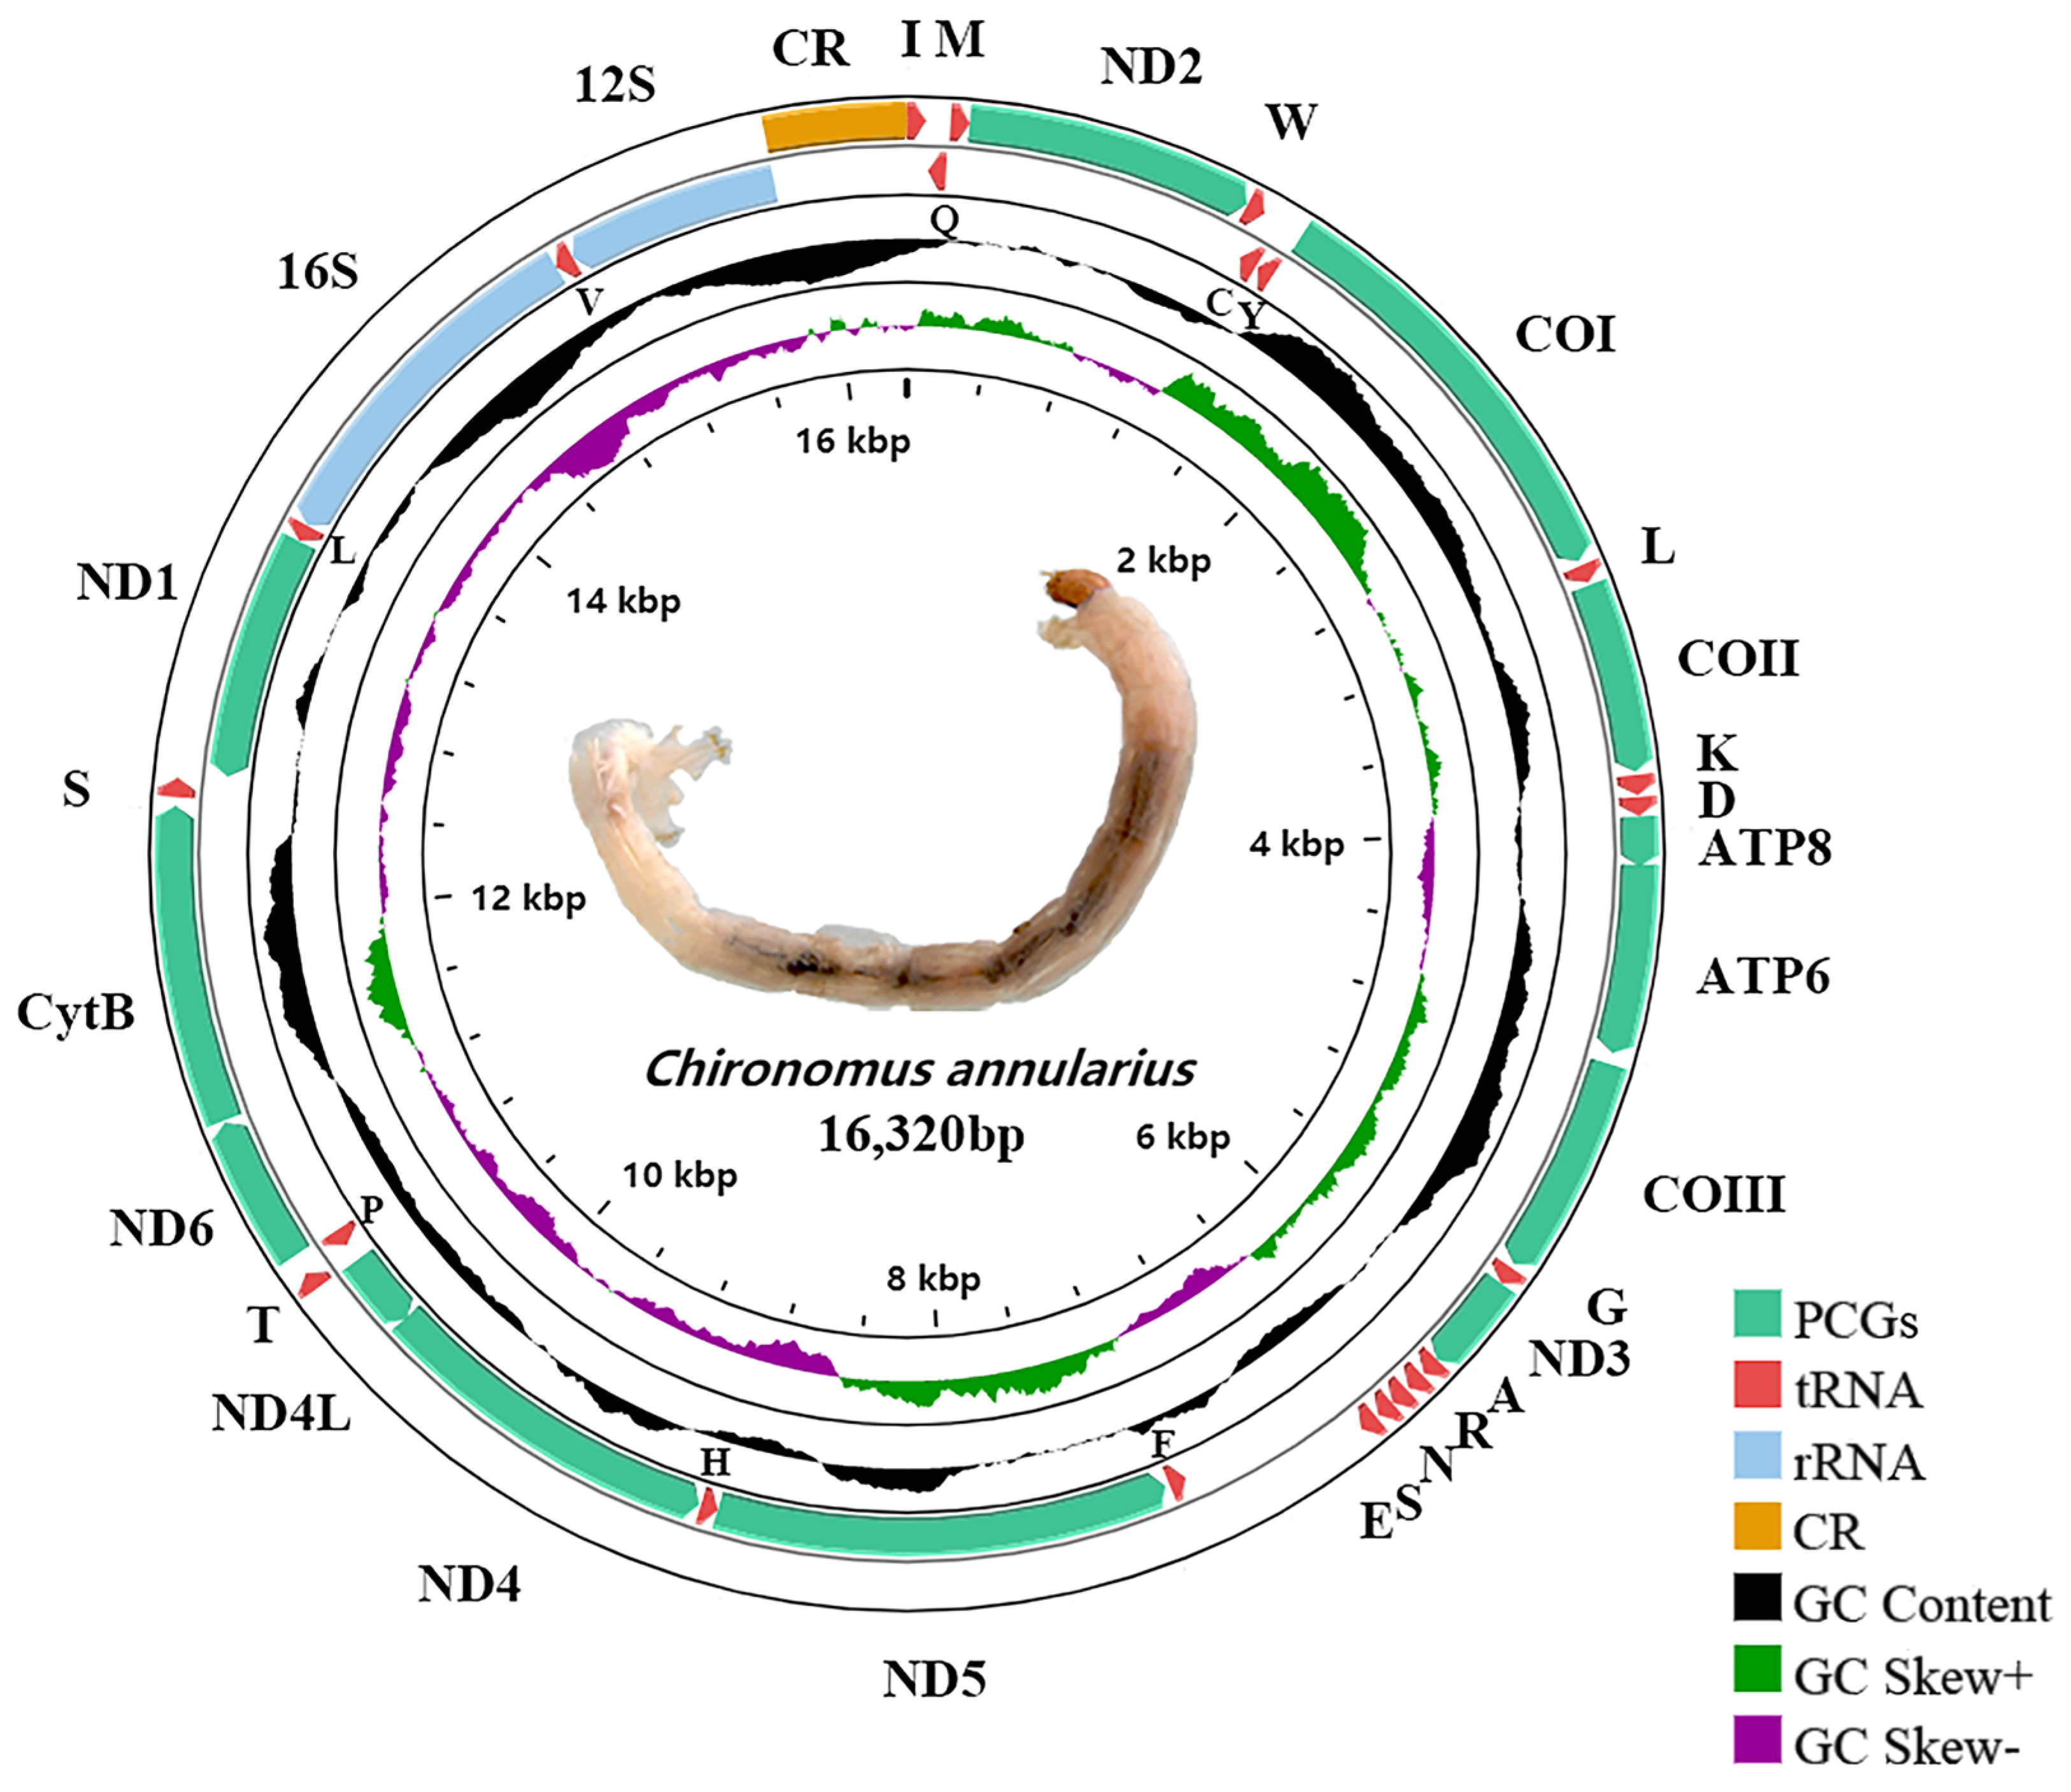
3.1. Basic Structure of Chironomus Mitogenomes

The length of newly sequenced whole mitogenomes of C. anthracinus, C. nipponensis, C. flaviplumus, C. plumosus, C. tentans, C. novosibiricus, C. annularius, C. agilis, C. nippodorsalis, C. transvaalensis, C. circumdatus, and C. javanus were 16,325, 16,185, 15,781, 16,101, 15,678, 16,243, 16,320, 15,825, 15,658, 15,724, 15,781, and 15,698 bp, respectively. The mitogenome map of a representative species of Chironomus (Chironomus annularius) is shown in Figure 1.
The nucleotide composition of the 15 Chironomus species was similar (Table S2). The complete mitogenomes of Chironomus were obviously inclined to A and T with the A+T content ranging from 75.31% (Chironomus anticinus) to 78.54% (Chironomus transvaalensis), a similar A+T content to other chironomids [9,10,39]. In the mitogenomes of the 15 Chironomus species, the A+T content of the PCGs ranged from 71.66% to 76.00%, with negative AT-skew and negative GC-skew, except in Chironomus flaviplumus (0.01), Chironomus transvaalensis (0.01), and Chironomus circumumdatus (0.01). In all 15 Chironomus species, the A+T content of the third codon of the PCGs was significantly higher than that of the first and second codons of the PCGs. Three codon positions of the PCGs all exhibited negative AT-skew. The first codon position of the PCGs exhibited a positive GC-skew while the second and third codon positions of the PCGs exhibited negative GC-skew. The start codon of the 13 PCGs was usually in the form of ATN. However, several PCGs exhibited different forms of start codon. For example, the start codon of the COI gene in 14 Chironomus species was TTG, except Chironomus flaviplumus (Table S3). The start codon of the ND1 gene in 12 Chironomus species was TTG (Table S3). The start codon of ND5 in all Chironomus species was GTG (Table S3). In the 15 Chironomus species, the termination codon of most PCGs was TAA, while a few genes used TAG as the termination codon or ended with an incomplete termination codon (TA-) (Table S3). The total codon length (excluding the termination codon) of the 15 Chironomus species ranged from 3727 to 3729 bp. Leu, Phe, and Ile were the most frequent codon families, and Cys was the least frequent codon family (Figure 2). The RSCUs of the 15 Chironomus species were similar.
The 20 amino acids were identified in all Chironomus species, and the common codon pattern of each amino acid was NNA or NNU. We used the Ka/Ks value (ω) to measure the extent to which species were affected by natural selection. ω of 13 PCGs are shown in Figure 3. The ω value of each PCG was less than 1, showing that the non-synonymous substitution rate was less than the synonymous substitution rate, and indicating that 13 PCGs evolved under purifying selection pressure. ATP8 exhibited the highest ω value, while COI exhibited the lowest ω value, which was similar to other chironomids [8,9,10].
The 22 tRNAs were from the mitogenomes of all Chironomus species. The A+T content of tRNAs ranged from 78.85% to 79.88% (Table S1), exhibiting positive AT-skew and positive GC-skew. The length of 12S rRNA ranged from 813 to 821 bp, and its A+T content ranged from 82.72% to 83.99% (Table S1). The length of 16S rRNA ranged from 1336 to 1383 bp, and its A+T content ranged from 84.30% to 85.57% (Table S1). Among all Chironomus species, both 12S and 16S rRNA genes showed positive AT-skew and positive GC-skew, except for Chironomus anthracinus, Chironomus flaviplumus, and Chironomus claggi (Table S1). The size of the CR of the 15 Chironomus species ranged from 498 to 526 bp. The content of A+T in the CR was obviously higher than that in other regions of the mitogenome, varying from 91.29% to 95.96% and exhibiting negative AT-skew (−0.12 to −0.03) and negative GC-skew (−0.55 to −0.14).

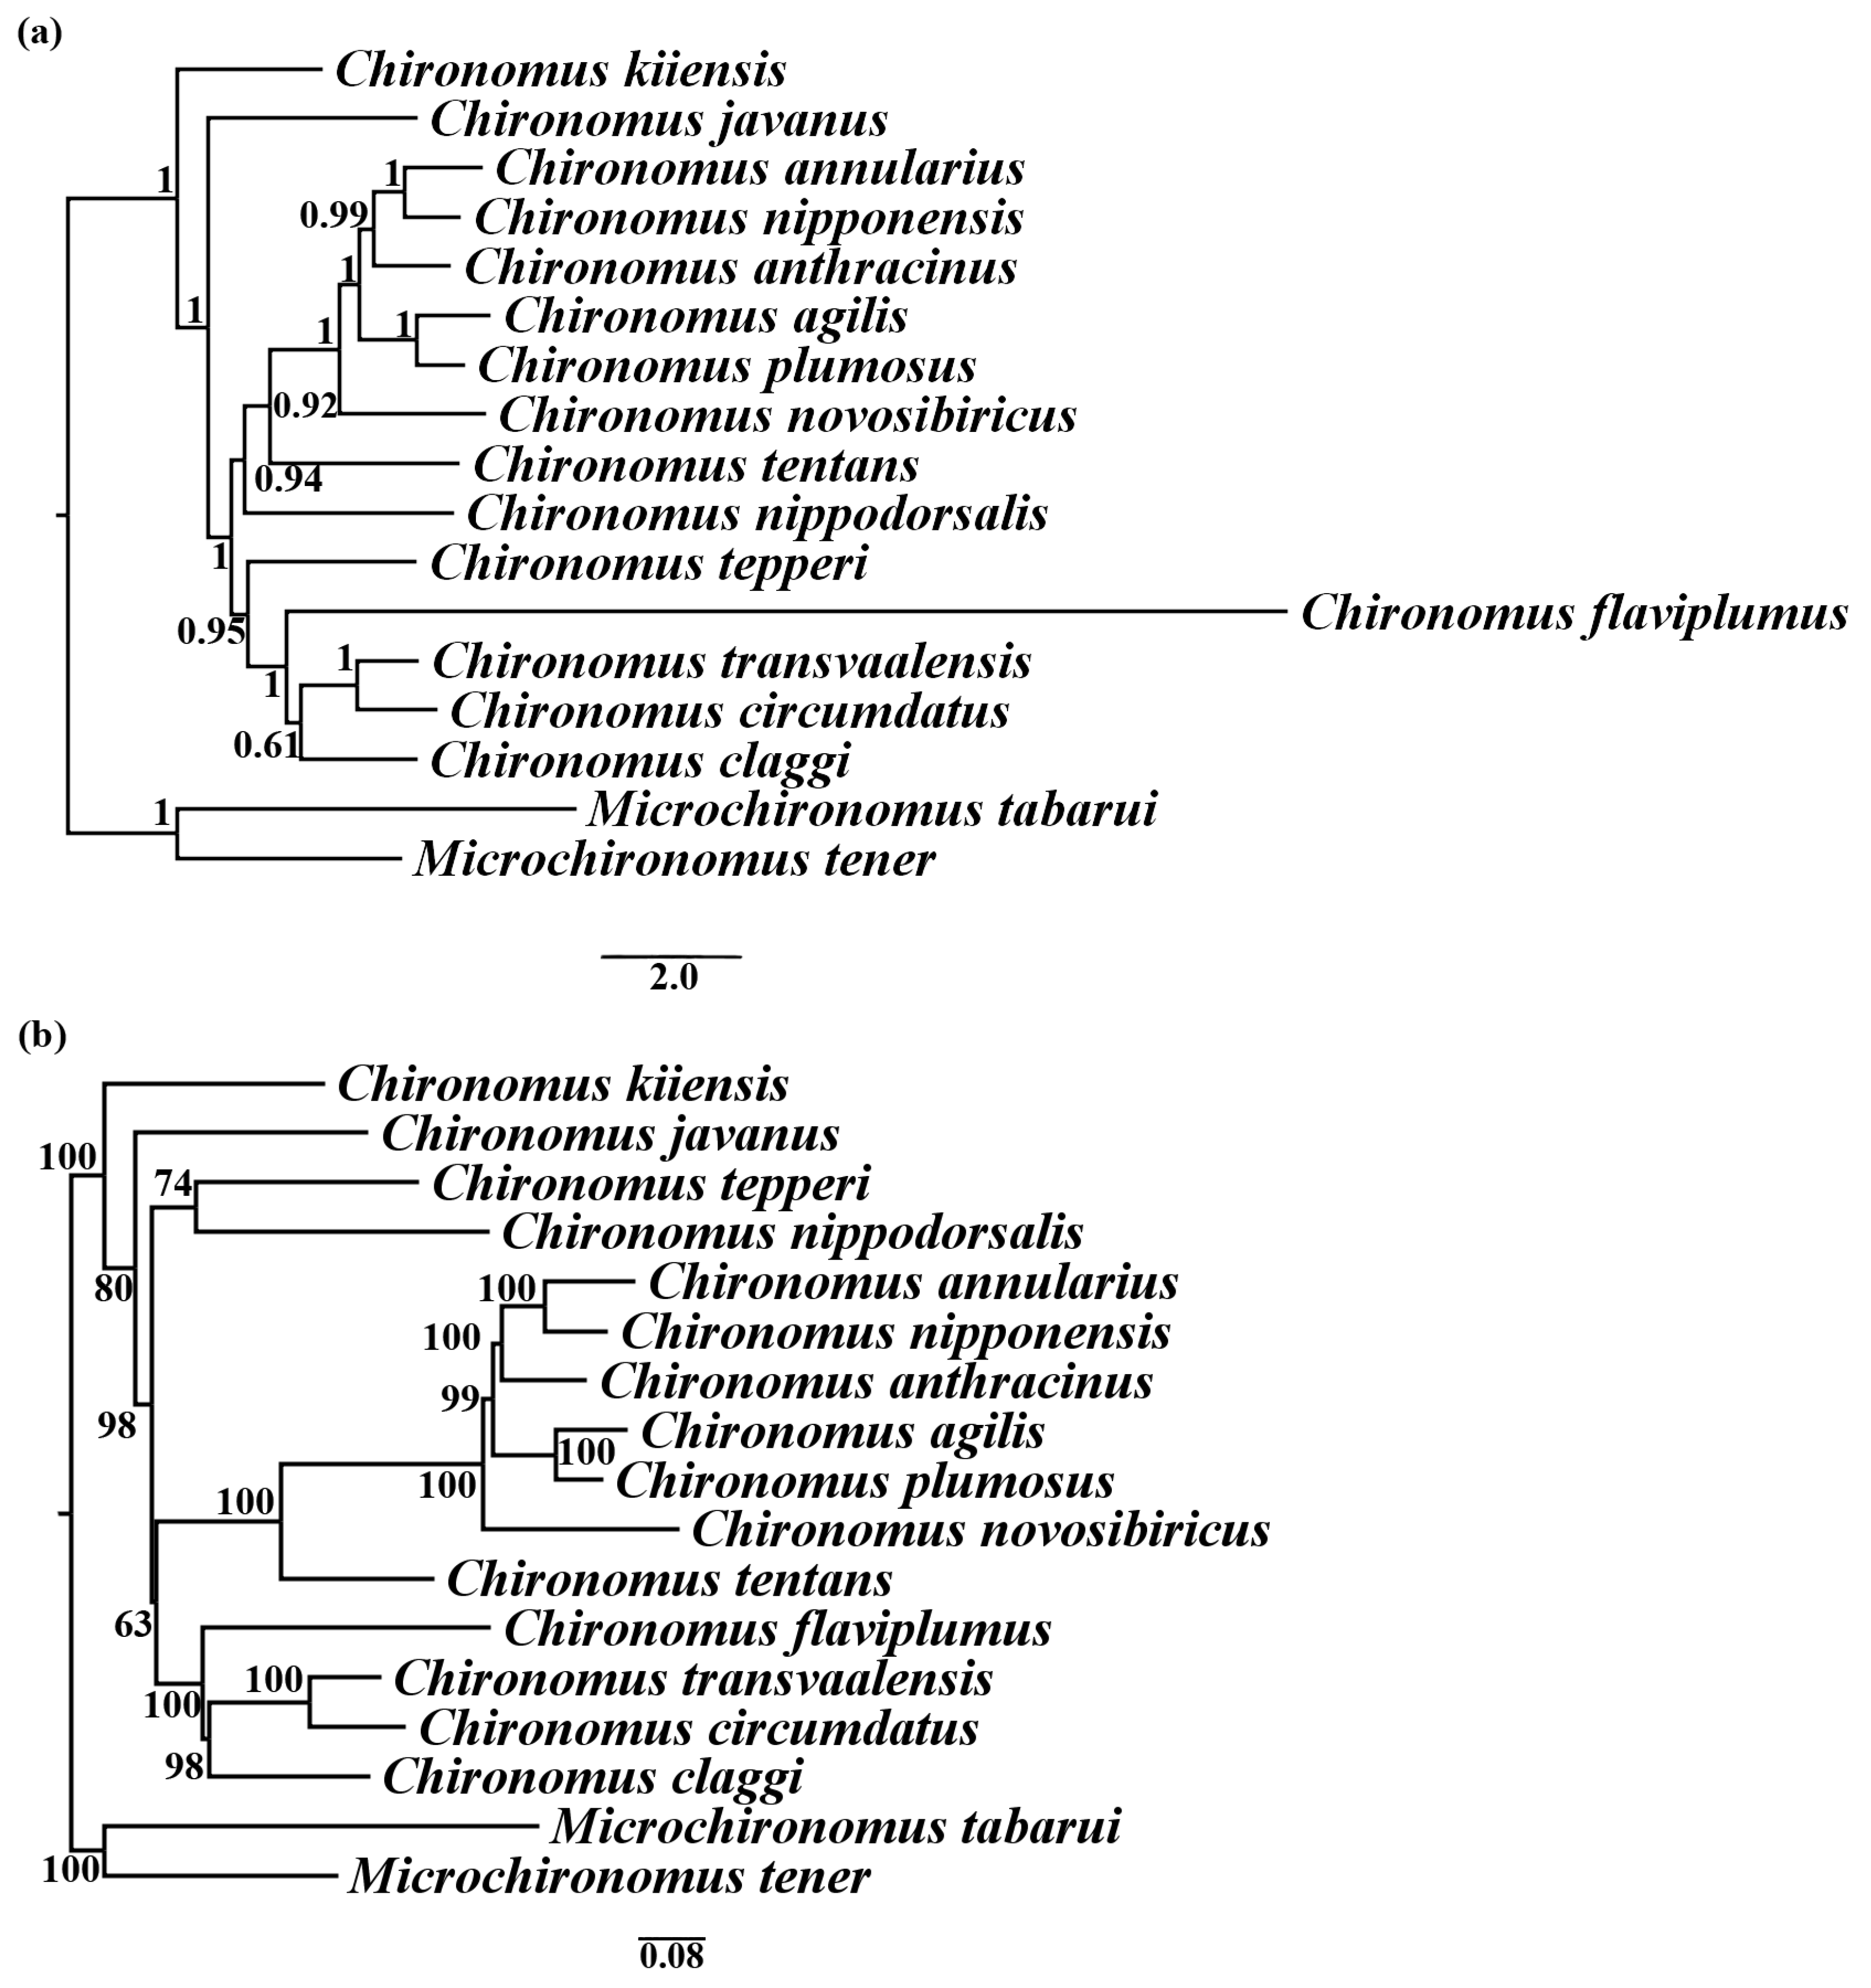
3.2. Phylogenetic Analysis

The results of the heterogeneity test of the four datasets (PCG123R, PCG12R, PCG123, and AA) are shown in Figure 4. The heterogeneity of the PCG12R dataset was lower than that of the PCG123 and PCG123R datasets. It could be inferred that the evolution rate of the third codon position of the PCGs was relatively high. The heterogeneity of the AA dataset was significantly reduced, indicating that even if the third codon of the PCG changed greatly, the codon was likely to be a synonymous codon encoding the same amino acid. In the PCG123R and PCG12R datasets, the heterogeneity of Chironomus flaviplumus was higher than that of other species, while in the PCG dataset, the heterogeneity of Chironomus flaviplumus was close to that of other Chironomus species. The reason for this might be that the rRNA sequences of Chironomus flaviplumus were quite different from the other 14 Chironomus species. The heterogeneity of two Microchironomus species was higher than that of other species in most datasets.
In this study, the phylogenetic relationships of Chironomus and Mircochironomus were reconstructed by four datasets (PCG123R, PCG12R, PCG123, and AA). All phylogenetic trees showed that the 15 Chironomus species grouped in one clade, separating from Microchironomus (Figure 5 and Figures S2–S4). However, phylogenetic relationships among Chironomus were not well supported at the species level. This might be a result of the fast mutation rates in the mitogenomes of most chironomids [40]. For instance, the long branch of C. flaviplumus might be a result of its high mutation rate in rRNA sequences (Figure 4 and Figures S2–S4). In this study, we sampled about 1/20 of the described Chironomus species. Insufficient taxon sampling resulted in a lack of information on other species, and the evolutionary relationships between some species could not be highly resolved. Therefore, our phylogeny results were inconclusive for the monophyly of Chironomus. To explore the evolutionary history of Chironomus, more comprehensive taxon sampling and nuclear markers are needed.

4. Conclusions

This study provided the complete mitogenomes of 12 Chironomus species and one Microchironomus species for the first time and combined the public data to analyze the general features and phylogenic relationships within Chironomus. It showed that the nucleotide composition and gene order of the mitogenome of Chironomus species were conservative. Our study enriches the library of mitogenomes of chironomids and provides a valuable resource for understanding the evolutionary history of Chironomus.

Supplementary Materials

The following supporting information can be downloaded at: https://www.mdpi.com/article/10.3390/insects13121164/s1, Table S1: The best model for each partition of the five datasets. Table S2: Nucleotide composition of mitochondrial genomes of 15 Chironomus species. Table S3: Start and stop codons of 13 PCGs in the mitogenomes of 15 Chironomus species. Figure S1: Substitution patterns of the PCG123R (a), PCG12R (b), and PCG123 (c) datasets. The graphs represent the increase in GTR distance. Figure S2: Phylogenetic trees of Chironomus inferred from the AA dataset. (a) BI tree. Numbers at the nodes are BI posterior probabilities. (b) ML tree. Numbers at the nodes are ML bootstrap values. Figure S3: Phylogenetic trees of Chironomus inferred from the PCG123 dataset. (a) BI tree. Numbers at the nodes are BI posterior probabilities. (b) ML tree based. Numbers at the nodes are ML bootstrap values. Figure S4: Phylogenetic trees of Chironomus inferred from the PCG12R dataset. (a) BI tree. Numbers at the nodes are BI posterior probabilities. (b) ML tree. Numbers at the nodes are ML bootstrap values.

Author Contributions

Data curation, S.-Y.L., B.-X.G., B.-J.S. and X.-L.L.; formal analysis, S.-Y.L., B.-X.G. and X.-L.L.; funding acquisition, B.-J.S.; investigation, X.-L.L.; writing—original draft, S.-Y.L., Y.-M.Z., C.-H.L. and X.-L.L.; writing—review and editing, S.-Y.L., Y.-M.Z., C.-H.L. and X.-L.L. All co-authors contributed to this manuscript and approved it. All authors have read and agreed to the published version of the manuscript.

Funding

This research was funded by the Yangtze River Joint Research Phase II Program (2022-LHYJ-02-0102) and the National Natural Science Foundation of China (31900344).

Institutional Review Board Statement

Not applicable.

Informed Consent Statement

Not applicable.

Data Availability Statement

The following information was supplied regarding the availability of DNA sequences: The new mitogenomes are deposited in GenBank of NCBI under accession numbers ON975023-ON975035.

Acknowledgments

We sincerely thank Yu Peng, Yuan-Yuan Han, Joel Moubayed, Nathalie Mary, and Fan-Qing Kong for their collecting and sending material. We also thank the Namibian National Commission on Research, Science and Technology, and the Ministry of Environment and Tourism for providing permits for collecting and exporting chironomids in Namibia in December, 2018.

Conflicts of Interest

The authors declare no conflict of interest.

References

  1. Brown, W.M. The mitochondrial genome of animals. Mol. Evol. Genet. 1985, 22, 95–130. [Google Scholar]
  2. Zhang, X.; Yang, D.; Kang, Z. New data on the mitochondrial genome of Nematocera (lower Diptera): Features, structures and phylogenetic implications. Zool. J. Linn. Soc. 2022, zlac012. [Google Scholar] [CrossRef]
  3. Wang, Q.; Huang, J.; Wu, H. Mitogenomes provide insights into the phylogeny of Mycetophilidae (Diptera: Sciaroidea). Gene 2021, 783, 145564. [Google Scholar] [CrossRef] [PubMed]
  4. Ge, X.; Zang, H.; Ye, X.; Peng, L.; Wang, B.; Lian, G.; Sun, C. Comparative Mitogenomic Analyses of Hydropsychidae Revealing the Novel Rearrangement of Protein-Coding Gene and tRNA (Trichoptera: Annulipalpia). Insects 2022, 13, 759. [Google Scholar] [CrossRef]
  5. Ma, Z.; Li, R.; Zhu, B.; Zheng, X.; Zhou, C. Comparative Mitogenome Analyses of Subgenera and Species Groups in Epeorus (Ephemeroptera: Heptageniidae). Insects 2022, 13, 599. [Google Scholar] [CrossRef]
  6. Brown, W.M.; George, M.; Wilson, A.C. Rapid evolution of animal mitochondrial DNA. Proc. Natl. Acad. Sci. USA 1979, 76, 1967–1971. [Google Scholar] [CrossRef] [Green Version]
  7. Curole, J.P.; Kocher, T.D. Mitogenomics: Digging deeper with complete mitochondrial genomes. Trends Ecol. Evol. 1999, 14, 394–398. [Google Scholar] [CrossRef]
  8. Zheng, C.-G.; Liu, Z.; Zhao, Y.-M.; Wang, Y.; Bu, W.-J.; Wang, X.-H.; Lin, X.-L. First Report on Mitochondrial Gene Rearrangement in Non-Biting Midges, Revealing a Synapomorphy in Stenochironomus Kieffer (Diptera: Chironomidae). Insects 2022, 13, 115. [Google Scholar] [CrossRef]
  9. Lin, X.L.; Zhao, Y.M.; Yan, L.P.; Liu, W.B.; Bu, W.J.; Wang, X.H.; Zheng, C.G. Mitogenomes provide new insights into the evolutionary history of Prodiamesinae (Diptera: Chironomidae). Zool. Scr. 2022, 51, 119–132. [Google Scholar] [CrossRef]
  10. Zheng, C.-G.; Zhu, X.-X.; Yan, L.-P.; Yao, Y.; Bu, W.-J.; Wang, X.-H.; Lin, X.-L. First complete mitogenomes of Diamesinae, Orthocladiinae, Prodiamesinae, Tanypodinae (Diptera: Chironomidae) and their implication in phylogenetics. PeerJ. 2021, 9, e11294. [Google Scholar] [CrossRef]
  11. Chen, Z.-T.; Du, Y.-Z. Comparison of the complete mitochondrial genome of the stonefly Sweltsa longistyla (Plecoptera: Chloroperlidae) with mitogenomes of three other stoneflies. Gene 2015, 558, 82–87. [Google Scholar] [CrossRef] [PubMed]
  12. Li, R.; Lei, Z.; Li, W.; Zhang, W.; Zhou, C. Comparative mitogenomic analysis of heptageniid mayflies (Insecta: Ephemeroptera): Conserved intergenic spacer and trna gene duplication. Insects 2021, 12, 170. [Google Scholar] [CrossRef] [PubMed]
  13. Zheng, C.; Ye, Z.; Zhu, X.; Zhang, H.; Dong, X.; Chen, P.; Bu, W. Integrative taxonomy uncovers hidden species diversity in the rheophilic genus Potamometra (Hemiptera: Gerridae). Zool. Scr. 2020, 49, 174–186. [Google Scholar] [CrossRef]
  14. Ge, X.; Peng, L.; Vogler, A.P.; Morse, J.C.; Yang, L.; Sun, C.; Wang, B. Massive gene rearrangements of mitochondrial genomes and implications for the phylogeny of Trichoptera (Insecta). Syst. Entomol. 2022, in press. [Google Scholar] [CrossRef]
  15. Gao, Y.; Ge, Y.; Yan, L.; Vikhrev, N.E.; Wang, Q.; Butterworth, N.J.; Zhang, D. Phylogenetic Analyses Support the Monophyly of the Genus Lispe Latreille (Diptera: Muscidae) with Insights into Intrageneric Relationships. Insects 2022, 13, 1015. [Google Scholar] [CrossRef]
  16. Cranston, P.S.; Dillon, M.E.; Pinder, L.C.V.; Reiss, F. The Adult Males of Chironominae (Diptera, Chironomidae) of the Holarctic Region—Keys and Diagnoses. In Chironomidae of the Holarctic Region. Keys and Diagnoses. Part 3—Adult Males; Wiederholm, T., Ed.; Entomologica Scandinavica: Lund, Sweden, 1989; Volume 34, pp. 353–502. [Google Scholar]
  17. Cranston, P.S.; Hardy, N.B.; Morse, G.E. A dated molecular phylogeny for the Chironomidae (Diptera). Syst. Entomol. 2012, 37, 172–188. [Google Scholar] [CrossRef]
  18. Martin, J.; Blinov, A.; Alieva, E.; Hirabayashi, K. A molecular phylogenetic investigation of the genera closely related to Chironomus Meigen (Diptera: Chironomidae). In Contributions to the Systematics and Ecology of Aquatic Diptera. A Tribute to Ole A. Sæther; Andersen, T., Ed.; Caddis Press: Columbus, OH, USA, 2007; pp. 193–203. [Google Scholar]
  19. Beckenbach, A.T. Mitochondrial genome sequences of Nematocera (lower Diptera): Evidence of rearrangement following a complete genome duplication in a winter crane fly. Genome Biol. Evol. 2012, 4, 89–101. [Google Scholar] [CrossRef] [Green Version]
  20. Park, K.; Kim, W.-S.; Park, J.-W.; Kwak, I.-S. Complete mitochondrial genome of Chironomus flaviplumus (Diptera: Chironomidae) collected in Korea. Mitochondrial DNA Part B 2021, 6, 2843–2844. [Google Scholar] [CrossRef]
  21. Liu, C.; Xu, G.; Lei, T.; Qi, X. The complete mitochondrial genome of a tropical midge Chironomus kiiensis Tokunaga, 1936 (Diptera: Chironomidae). Mitochondrial DNA Part B 2022, 7, 211–212. [Google Scholar] [CrossRef]
  22. Bolger, A.M.; Lohse, M.; Usadel, B. Trimmomatic: A flexible trimmer for Illumina sequence data. Bioinformatics 2014, 30, 2114–2120. [Google Scholar] [CrossRef] [Green Version]
  23. Kong, F.-Q.; Zhao, Y.-C.; Chen, J.-L.; Lin, X.-L. First report of the complete mitogenome of Microchironomus tabarui Sasa, 1987 (Diptera, Chironomidae) from Hebei Province, China. Mitochondrial DNA Part B 2021, 6, 2845–2846. [Google Scholar] [CrossRef]
  24. Dierckxsens, N.; Mardulyn, P.; Smits, G. NOVOPlasty: De novo assembly of organelle genomes from whole genome data. Nucleic Acids Res. 2017, 45, e18. [Google Scholar] [CrossRef] [PubMed] [Green Version]
  25. Peng, Y.; Leung, H.C.; Yiu, S.-M.; Chin, F.Y. IDBA-UD: A de novo assembler for single-cell and metagenomic sequencing data with highly uneven depth. Bioinformatics 2012, 28, 1420–1428. [Google Scholar] [CrossRef] [Green Version]
  26. Kearse, M.; Moir, R.; Wilson, A.; Stones-Havas, S.; Cheung, M.; Sturrock, S.; Buxton, S.; Cooper, A.; Markowitz, S.; Duran, C. Geneious Basic: An integrated and extendable desktop software platform for the organization and analysis of sequence data. Bioinformatics 2012, 28, 1647–1649. [Google Scholar] [CrossRef] [PubMed] [Green Version]
  27. Shen, W.; Le, S.; Li, Y.; Hu, F. SeqKit: A cross-platform and ultrafast toolkit for FASTA/Q file manipulation. PLoS ONE 2016, 11, e0163962. [Google Scholar] [CrossRef] [PubMed] [Green Version]
  28. Tamura, K.; Stecher, G.; Kumar, S. MEGA11: Molecular evolutionary genetics analysis version 11. Mol. Biol. Evol. 2021, 38, 3022–3027. [Google Scholar] [CrossRef] [PubMed]
  29. Rozas, J.; Ferrer-Mata, A.; Sánchez-DelBarrio, J.C.; Guirao-Rico, S.; Librado, P.; Ramos-Onsins, S.E.; Sánchez-Gracia, A. DnaSP 6: DNA sequence polymorphism analysis of large data sets. Mol. Biol. Evol. 2017, 34, 3299–3302. [Google Scholar] [CrossRef]
  30. Grant, J.R.; Stothard, P. The CGView Server: A comparative genomics tool for circular genomes. Nucleic Acids Res. 2008, 36, 181–184. [Google Scholar] [CrossRef]
  31. Katoh, K.; Rozewicki, J.; Yamada, K.D. MAFFT online service: Multiple sequence alignment, interactive sequence choice and visualization. Brief. Bioinform. 2019, 20, 1160–1166. [Google Scholar] [CrossRef] [Green Version]
  32. Capella-Gutiérrez, S.; Silla-Martínez, J.M.; Gabaldón, T. trimAl: A tool for automated alignment trimming in large-scale phylogenetic analyses. Bioinformatics 2009, 25, 1972–1973. [Google Scholar] [CrossRef] [Green Version]
  33. Kück, P.; Longo, G.C. FASconCAT-G: Extensive functions for multiple sequence alignment preparations concerning phylogenetic studies. Front. Zool. 2014, 11, 81. [Google Scholar] [CrossRef] [PubMed]
  34. Xia, X.H. DAMBE5: A comprehensive software package for data analysis in molecular biology and evolution. Mol. Biol. Evol. 2013, 30, 1720–1728. [Google Scholar] [CrossRef] [PubMed] [Green Version]
  35. Kück, P.; Meid, S.A.; Groß, C.; Wägele, J.W.; Misof, B. AliGROOVE–visualization of heterogeneous sequence divergence within multiple sequence alignments and detection of inflated branch support. BMC Bioinform. 2014, 15, 294. [Google Scholar] [CrossRef] [PubMed] [Green Version]
  36. Lanfear, R.; Frandsen, P.B.; Wright, A.M.; Senfeld, T.; Calcott, B. PartitionFinder 2: New methods for selecting partitioned models of evolution for molecular and morphological phylogenetic analyses. Mol. Biol. Evol. 2017, 34, 772–773. [Google Scholar] [CrossRef] [Green Version]
  37. Ronquist, F.; Teslenko, M.; van der Mark, P.; Ayres, D.L.; Darling, A.; Höhna, S.; Larget, B.; Liu, L.; Suchard, M.A.; Huelsenbeck, J.P. MrBayes 3.2: Efficient Bayesian phylogenetic inference and model choice across a large model space. Syst. Biol. 2012, 61, 539–542. [Google Scholar] [CrossRef] [Green Version]
  38. Minh, B.Q.; Schmidt, H.A.; Chernomor, O.; Schrempf, D.; Woodhams, M.D.; Von Haeseler, A.; Lanfear, R. IQ-TREE 2: New models and efficient methods for phylogenetic inference in the genomic era. Mol. Biol. Evol. 2020, 37, 1530–1534. [Google Scholar] [CrossRef] [Green Version]
  39. Lin, X.L.; Liu, Z.; Yan, L.P.; Duan, X.; Bu, W.J.; Wang, X.H.; Zheng, C.G. Mitogenomes provide new insights of evolutionary history of Boreheptagyiini and Diamesini (Diptera: Chironomidae: Diamesinae). Ecol. Evol. 2022, 12, e8957. [Google Scholar] [CrossRef]
  40. Ekrem, T.; Willassen, E. Exploring Tanytarsini relationships (Diptera: Chironomidae) using mitochondrial COII gene sequences. Insect Syst. Evol. 2004, 35, 263–276. [Google Scholar] [CrossRef]
Figure 1. Mitogenome map of representative species of Chironomus (Chironomus annularius). The arrow indicates the direction of gene transcription. PCGs and rRNAs are represented by normative abbreviations, while tRNAs are represented by single-letter abbreviations. In the notes at the bottom right, green, red, blue, and yellow respectively corresponded to PCGs, tRNAs, rRNAs, and CR. The second circle shows the G+C content of the complete mitogenome. The third circle exhibits the GC-skew of the whole mitogenome. The innermost circle shows the morphology of the larvae of Chironomus annularius and the length of the mitogenome.
Insects 13 01164 g001
Figure 2. Amino acid distribution of mitogenomes of 15 Chironomus species. The x axis represents the codon families, and the y axis represents the total codon.
Insects 13 01164 g002
Figure 3. Evolution rate of 13 PCGs of mitogenomes of 15 Chironomus species. Ka refers to non-synonymous nucleotide substitutions, Ks refers to synonymous nucleotide substitutions, Ka/Ks refers to the selection pressure of each PCG. The x axis represents 13 PCGs, and the y axis represents the value.
Insects 13 01164 g003
Figure 4. Heterogeneity analysis based on 13 PCGs and two rRNA sequences. Analysis based on AliGROOVE scores ranging from −1 (strong heterogeneity between datasets; the color is red) to +1 (weak heterogeneity between datasets; the color is blue); the lighter the color of the color block of each dataset, the stronger the heterogeneity, and the darker the color, the weaker the heterogeneity.
Insects 13 01164 g004
Figure 5. Phylogenetic trees of Chironomus inferred from the PCG123R dataset. (a) BI tree. Numbers at the nodes were BI posterior probabilities. (b) ML tree. Numbers at the nodes were ML bootstrap values.
Insects 13 01164 g005
Table 1. Detailed information of 15 Chironomus and two Microchironomus species used in the study.
SpeciesSample IDLife StageSampling MetadataGenBank AccessionReference
Microchironomus tabaruiXL3993Adult maleHengshui, Hebei, China, 37.651626°N, 115.650831°E, 1 September 2020, leg. X.-Y. LiuMZ261913[23]
Microchironomus tenerXL1462Adult maleChangjiang, Hainan, China, 19.11463°N, 109.08419°E, 13 March 2016, leg. B.-J. SunON975027this study
Chironomus tepperiJN861749NANAJN861749[19]
Chironomus flaviplumusCNUISI-020005203LarvaYeondeung stream, Yeosu, South Korea 34°45′26.0″ N, 127°42′51.2″ E, May 2020MW770891[20]
Chironomus kiiensisBSZ21LarvaLishui, Zhejiang, China, 28°39′30′′ N, 120°5′29′′ E, August 2019, leg. X. QiMZ150770[21]
Chironomus transvaalensisNAM96LarvaGoreangab Dam, Khomas, Windhoek, Namibia, 22.5267°S, 17.0153°E, 3 December 2018, leg. X.-L. LinON975023this study
Chironomus circumdatusNEC119LarvaKouembélia, Tontouta, New Caledonia, 22.0083056°S, 166.2062775°E, 11 May 2020, leg. N. MaryON975024this study
Chironomus javanusNLCH300Adult maleYizhang, Chenzhou, Hunan, China, 24.9854183°N, 112.914357°E, 30 August 2020, leg. X.-L. LinON975025this study
Chironomus anthracinusXL575Adult maleLian lake, Trondheim, Norway, 63.39989°N, 10.31761°E, 17 June 2016, leg. X.-L. LinON975026this study
Chironomus nipponensisX2896LarvaLaotuding, Huanren, Benxi, Liaoning, China, 41.2894°N, 124.8980°E, 3 September 2014, leg. C. SongON975028this study
Chironomus claggiXL2930LarvaMaoyangzhen, Wuzhishan Hainan, China, 18.93696°N, 109.50804°E, 6 December 2010, leg. F.-Q. KongON975029this study
Chironomus plumosusXL3435LarvaYuqiao Reservoir, Jizhou, Tianjin, China, 40.01974°N, 117.6389°E, 21 November 2019, leg. H.-J. YuON975030this study
Chironomus tentansXL3813LarvaNaqu, Xizang, China, 31.621813°N, 91.739874°E, 3 September 2020, leg. Y. PengON975031this study
Chironomus novosibiricusXL3834LarvaZegucuo, Shannan, Xizang, China, 28.754153°N, 91.676359°E, 30 August 2020, leg. Y. PengON975032this study
Chironomus annulariusXL3838LarvaZegucuo, Shannan, Xizang, China, 28.754153°N, 91.676359°E, 30 August 2020, leg. Y. PengON975033this study
Chironomus agilisXL4188Adult maleChun′an, Hangzhou, Zhejiang, China, 29.567168°N, 118.86825°E, 8 May 2021, leg. Y.-Y. HanON975034this study
Chironomus nippodorsalisXL4371Adult femaleHefeng, Hubei, China, 29.89269645°N, 110.0287267°E, 12-July-15, leg. Q. WangON975035this study
Publisher’s Note: MDPI stays neutral with regard to jurisdictional claims in published maps and institutional affiliations.

