
Karyotype Diversity, Mode, and Tempo of the Chromosomal Evolution of Attina (Formicidae: Myrmicinae: Attini): Is There an Upper Limit to Chromosome Number?


Abstract
:Simple Summary
Abstract
1. Introduction
2. Materials and Methods
2.1. Colony Sampling
2.2. Chromosome Preparation and Karyomorphometry
2.3. Cytogenetic Data Compilation and Phylogenetic Analysis
3. Results
4. Discussion
4.1. Chromosome Number, Mode, and Tempo of Karyotype Change
4.2. Is There an Upper Limit to the Chromosome Number of Fungus-Farming Ants?
4.3. Chromosome Counts: How Far We Get and What Is Still Needed
5. Conclusions
Supplementary Materials
Author Contributions
Funding
Institutional Review Board Statement
Data Availability Statement
Acknowledgments
Conflicts of Interest
References
- King, M. Species Evolution: The Role of Chromosome Change; Cambridge University Press: Cambridge, UK, 1993. [Google Scholar]
- Lorite, P.; Palomeque, T. Karyotype evolution in ants (Hymenoptera: Formicidae), with a review of the known ant chromosome numbers. Myrmecol. News 2010, 13, 89–102. [Google Scholar]
- Cardoso, D.C.; Santos, H.G.; Cristiano, M.P. The Ant Chromosome database-(ACdb): An online resource for ant (Hymenoptera: Formicidae) chromosome researchers. Myrmecol. News 2018, 27, 87–91. [Google Scholar]
- Imai, H.T.; Taylor, R.W.; Crozier, R.H. Modes of spontaneous chromosomal mutation and karyotype evolution in ants with reference to the minimum interaction hypothesis. Jpn. J. Genet. 1988, 63, 159–185. [Google Scholar] [CrossRef] [PubMed] [Green Version]
- Imai, H.T.; Taylor, R.W.; Crozier, R.H. Experimental bases for the minimum interaction theory. I. Chromosome evolution in ants of the Myrmecia pilosula species complex (Hymenoptera: Formicidae: Myrmeciinae). Jpn. J. Genet. 1994, 69, 137–182. [Google Scholar] [CrossRef] [Green Version]
- Speicher, M.R.; Carter, N.P. The new cytogenetics: Blurring the boundaries with molecular biology. Nat. Rev. Genet. 2005, 6, 782–792. [Google Scholar] [CrossRef]
- Cardoso, D.C.; Heinze, J.; Moura, M.N.; Cristiano, M.P. Chromosomal variation among populations of a fungus-farming ant: Implications for karyotype evolution and potential restriction to gene flow. BMC Evol. Biol. 2018, 18, 146. [Google Scholar] [CrossRef]
- Micolino, R.; Cristiano, M.P.; Cardoso, D.C. Population-Based Cytogenetic Banding Analysis and Phylogenetic Relationships of the Neotropical Fungus-Farming Ant Trachymyrmex holmgreni Wheeler, 1925. Cytogenet. Genome Res. 2019, 159, 151–161. [Google Scholar] [CrossRef]
- Guerra, M. Cytotaxonomy: The end of childhood. Plant Biosyst. 2012, 146, 703–710. [Google Scholar]
- Cardoso, D.C.; Pompolo, S.G.; Cristiano, M.P.; Tavares, M.G. The role of fusion in ant chromosome evolution: Insights from cytogenetic analysis using a molecular phylogenetic approach in the genus Mycetophylax. PLoS ONE 2014, 9, e87473. [Google Scholar]
- Cristiano, M.P.; Cardoso, D.C.; Fernandes-Salomão, T.M. Cytogenetic and molecular analyses reveal a divergence between Acromyrmex striatus (Roger, 1863) and other congeneric species: Taxonomic implications. PLoS ONE 2013, 8, e59784. [Google Scholar] [CrossRef] [Green Version]
- Schultz, T.R.; Brady, S.G. Major evolutionary transitions in ant agriculture. Proc. Natl. Acad. Sci. USA 2008, 105, 5435–5440. [Google Scholar] [CrossRef] [Green Version]
- Branstetter, M.G.; Ješovnik, A.; Sosa-Calvo, J.; Lloyd, M.W.; Faircloth, B.C.; Brady, S.G.; Schultz, T.R. Dry habitats were crucibles of domestication in the evolution of agriculture in ants. Proc. Biol. Sci. 2017, 284, 20170095. [Google Scholar] [CrossRef] [Green Version]
- Solomon, S.E.; Rabeling, C.; Sosa-Calvo, J.; Lopes, C.T.; Rodrigues, A.; Vasconcelos, H.L.; Bacci, M.; Mueller, U.G.; Schultz, T.R. The molecular phylogenetics of Trachymyrmex Forel ants and their fungal cultivars provide insights into the origin and coevolutionary history of ‘higher-attine’ ant agriculture. Syst. Entomol. 2019, 44, 939–956. [Google Scholar] [CrossRef] [Green Version]
- Cristiano, M.P.; Cardoso, D.C.; Sandoval-Gómez, V.E.; Simões-Gomes, F.C. Amoimyrmex Cristiano, Cardoso & Sandoval, gen. nov. (Hymenoptera: Formicidae): A new genus of leaf-cutting ants revealed by multilocus molecular phylogenetic and morphological analyses. Austral Entomol. 2020, 59, 643–676. [Google Scholar]
- Moura, M.N.; Cardoso, D.C.; Cristiano, M.P. The tight genome size of ants: Diversity and evolution under ancestral state reconstruction and base composition. Zool. J. Linn. Soc. 2021, 193, 124–144. [Google Scholar] [CrossRef]
- Micolino, R.; Cristiano, M.P.; Travenzoli, N.M.; Lopes, D.M.; Cardoso, D.C. Chromosomal dynamics in space and time: Evolutionary history of Mycetophylax ants across past climatic changes in the Brazilian Atlantic coast. Sci. Rep. 2019, 9, 18800. [Google Scholar] [CrossRef]
- Cardoso, D.C.; Cristiano, M.P.; Tavares, M.G. Methodological remarks on rearing basal Attini ants in the laboratory for biological and evolutionary studies: Overview of the genus Mycetophylax. Insectes Sociaux 2011, 58, 427–430. [Google Scholar] [CrossRef]
- Cardoso, D.C.; Pereira, T.T.P.; Cordeiro, A.L.; Cristiano, M.P. Cytogenetic data on the agro-predatory ant Megalomyrmex incisus Smith, 1947 and its host, Mycetophylax conformis (Mayr, 1884) (Hymenoptera, Formicidae). Comp. Cytogenet. 2017, 11, 45–53. [Google Scholar] [CrossRef] [Green Version]
- Levan, A.; Fredga, K.; Sandberg, A. Nomenclature for centromeric position on chromosomes. Hereditas 1964, 52, 201–220. [Google Scholar] [CrossRef]
- Cristiano, M.P.; Pereira, T.T.P.; Simões, L.P.; Sandoval-Gómez, V.E.; Cardoso, D.C. Reassessing the Chromosome Number and Morphology of the Turtle Ant Cephalotes pusillus (Klug, 1824) Using Karyomorphometrical Analysis and Observations of New Nesting Behavior. Insects 2017, 8, 114. [Google Scholar] [CrossRef] [Green Version]
- Sumner, A.T. A simple technique for demonstrating centromeric heterochromatin. Exp. Cell Res. 1972, 75, 304–306. [Google Scholar] [CrossRef]
- Bouckaert, R.; Vaughan, T.G.; Barido-Sottani, J.; Duchêne, S.; Fourment, M.; Gavryushkina, A.; Heled, J.; Jones, G.; Kühnert, D.; De Maio, N.; et al. BEAST 2.5: An advanced software platform for Bayesian evolutionary analysis. PLoS Comput. Biol. 2018, 15, e1006650. [Google Scholar] [CrossRef] [PubMed] [Green Version]
- Heath, T.A.; Huelsenbeck, J.P.; Stadler, T. The fossilized birth-death process for coherent calibration of divergence-time estimates. Proc. Natl. Acad. Sci. USA 2014, 111, 2957–2966. [Google Scholar] [CrossRef] [PubMed] [Green Version]
- Lanfear, R.; Frandsen, P.; Wright, A.; Senfeld, T.; Calcott, B. PartitionFinder 2: New methods for selecting partitioned models of evolution for molecular and morphological phylogenetic analyses. Mol. Biol. Evol. 2016, 34, 772–773. [Google Scholar] [CrossRef] [Green Version]
- Rambaut, A. FigTree v1.4.3. 2009. Available online: http://tree.bio.ed.ac.uk/software/figtree (accessed on 10 January 2020).
- Rambaut, A.; Drummond, A.; Xie, D.; Baele, G.; Suchard, M. Posterior summarization in Bayesian phylogenetics using Tracer 1.7. Syst. Biol. 2018, 67, 901–904. [Google Scholar] [CrossRef] [Green Version]
- Goñi, B.; De Zolessi, L.C.; Imai, H.T. Karyotypes of thirteen ant species from Uruguay (Hymenoptera, Formicidae). Caryologia 1983, 36, 363–371. [Google Scholar] [CrossRef] [Green Version]
- Castro, C.P.M.; Cardoso, D.C.; Micolino, R.; Cristiano, M.P. Comparative FISH-mapping of TTAGG telomeric sequences to the chromosomes of leafcutter ants (Formicidae, Myrmicinae): Is the insect canonical sequence conserved? Comp. Cytogenet. 2020, 14, 369–385. [Google Scholar] [CrossRef]
- Barros, L.A.C.; Aguiar, H.J.A.C.; Teixeira, G.C.; Souza, D.J.; Delabie, J.H.C.; Mariano, C.S.F. Cytogenetic studies on the social parasite Acromyrmex ameliae (Formicidae: Myrmicinae: Attini) and its hosts reveal chromosome fusion in Acromyrmex. Zool. Anz. 2021, 293, 273–281. [Google Scholar] [CrossRef]
- Teixeira, G.A.; Barros, L.A.C.; Aguiar, H.J.A.C.; Pompolo, S.G. Comparative physical mapping of 18S rDNA in the karyotypes of six leafcutter ant species of the genera Atta and Acromyrmex (Formicidae: Myrmicinae). Genetica 2017, 145, 351–357. [Google Scholar] [CrossRef]
- Barros, L.A.C.; de Aguiar, H.; Mariano, C.D.F.; Andrade-Souza, V.; Costa, M.A.; Delabie, J.H.C.; Pompolo, S.D. Cytogenetic data on six leafcutter ants of the genus Acromyrmex Mayr, 1865 (Hymenoptera, Formicidae, Myrmicinae): Insights into chromosome evolution and taxonomic implications. Comp. Cytogenet. 2016, 10, 229–243. [Google Scholar] [CrossRef] [Green Version]
- Aguiar, H.J.A.C.; Barros, L.A.C.; Silveira, L.I.; Petitclerc, F.; Etienne, S.; Orivel, J. Cytogenetic data for sixteen ant species from North-eastern Amazonia with phylogenetic insights into three subfamilies. Comp. Cytogenet. 2020, 14, 43–60. [Google Scholar] [CrossRef]
- Fadini, M.A.M.; Pompolo, S.G. Cytogenetics of some ant species of the tribe Attini (Hymenoptera, Formicidae) from the region of Viçosa, MG. Rev. Bras. Genet. 1996, 19, 53–55. [Google Scholar]
- Santos-Colares, M.C.; Viégas, J.; Roth, M.G.M.; Loeck, A.E. Preparation of mitotic chromosomes of leaf-cutting ants from the genera Atta and Acromyrmex. Braz. J. Genet. 1997, 20, 25–27. [Google Scholar] [CrossRef]
- Micolino, R.; Baldez, B.C.L.; Sánchez-Restrepo, A.F.; Calcaterra, L.; Cristiano, M.P.; Cardoso, D.C. Karyotype structure and cytogenetic markers of Amoimyrmex bruchi and Amoimyrmex silvestrii: Contribution to understanding leaf-cutting ant relationships. Genome 2021, in press. [Google Scholar] [CrossRef]
- Barros, L.A.C.; Mariano, C.S.F.; Pompolo, S.G. Cytogenetic studies of five taxa of the tribe Attini (Formicidae: Myrmicinae). Caryologia 2013, 66, 59–64. [Google Scholar] [CrossRef]
- Murakami, T.; Fujiwara, A.; Yoshida, M.C. Cytogenetics of ten ant species of the tribe Attini (Hymenoptera, Formicidae) in Barro Colorado Island, Panama. Chromosome Sci. 1998, 2, 135–139. [Google Scholar]
- Mariano, C.S.F.; Santos, I.D.; Groc, S.; Leroy, C.; Malé, P.J.; Ruiz-González, M.X.; Cerdan, P.; Dejean, A.; Delabie, J.H.C. The karyotypes of Gigantiops destructor (Fabricius) and other ants from French Guiana (Formicidae). Ann. Société Entomol. Fr. 2011, 47, 140–146. [Google Scholar] [CrossRef] [Green Version]
- Barros, L.A.C.; Teixeira, G.A.; Aguiar, H.J.A.C.; Mariano, C.S.F.; Delabie, J.H.C.; Pompolo, S.G. Banding Patterns of Three Leafcutter Ant Species of the Genus Atta (Formicidae: Myrmicinae) and Chromosomal Inferences. Fla. Entomol. 2014, 97, 1694–1701. [Google Scholar] [CrossRef]
- Barros, L.A.; Aguiar, H.J.; Teixeira, G.A.; Mariano, C.S.; Teixeira, M.C.; Delabie, J.H.; Pompolo, S.d. Cytogenetic data on the threatened leafcutter ant Atta robusta Borgmeier, 1939 (Formicidae: Myrmicinae: Attini). Comptes Rendus Biol. 2015, 338, 660–665. [Google Scholar] [CrossRef]
- Barros, L.A.C.; Mariano, C.S.F.; Pompolo, S.G.; Delabie, J.H.C. Citogenética de Attini. In Formigas-Cortadeiras: Da Bioecologia ao Manejo; Della-Lucia, T.M.C., Ed.; UFV: Viçosa, Brazil, 2011. [Google Scholar]
- Barros, L.A.C.; Aguiar, H.J.A.C.; Mariano, C.S.F.; Delabie, J.H.C.; Pompolo, S.G. Cytogenetic characterization of the ant Trachymyrmex fuscus Emery, 1934 (Formicidae: Myrmicinae: Attini) with the description of a chromosomal polymorphism. Ann. Société Entomol. Fr. 2013, 49, 367–373. [Google Scholar] [CrossRef]
- Micolino, R.; Cristiano, M.P.; Cardoso, D.C. Karyotype and putative chromosomal inversion suggested by integration of cytogenetic and molecular data of the fungus-farming ant Mycetomoellerius iheringi Emery, 1888. Comp. Cytogenet. 2020, 14, 197–210. [Google Scholar] [CrossRef] [PubMed]
- Barros, L.A.C.; Aguiar, H.J.A.C.; Mariano, C.S.F.; Delabie, J.H.C.; Pompolo, S.G. Cytogenetic characterization of the lower-Attini Mycocepurus goeldii (Formicidae: Myrmicinae: Attini). Sociobiology 2010, 56, 57–66. [Google Scholar]
- Travenzoli, N.M.; Cardoso, D.C.; Werneck, H.d.A.; Fernandes-Salomão, T.M.; Tavares, M.G.; Lopes, D.M. The evolution of haploid chromosome numbers in Meliponini. PLoS ONE 2019, 14, e0224463. [Google Scholar] [CrossRef] [PubMed]
- Gokhman, V.E.; Kuhn, K.L.; Woolley, J.B.; Hopper, K.R. Variation in genome size and karyotype among closely related aphid parasitoids (Hymenoptera, Aphelinidae). Comp. Cytogenet. 2017, 11, 97–117. [Google Scholar] [CrossRef] [PubMed] [Green Version]
- Imai, H.T.; Satta, Y.; Takahata, N. Integrative study on chromosome evolution of mammals, ants and wasps based on the minimum interaction theory. J. Theor. Biol. 2001, 210, 475–497. [Google Scholar] [CrossRef] [PubMed]
- Rieseberg, L.H. Chromosomal rearrangements and speciation. Trends Ecol. Evol. 2001, 16, 351–358. [Google Scholar] [CrossRef]
- Lukhtanov, V.A.; Dincă, V.; Talavera, G.; Vila, R. Unprecedented within-species chromosome number cline in the Wood White butterfly Leptidea sinapis and its significance for karyotype evolution and speciation. BMC Evol. Biol. 2011, 11, 109. [Google Scholar] [CrossRef] [PubMed] [Green Version]
- Grewal, S.I.; Jia, S. Heterochromatin revisited. Na.t Rev. Genet. 2007, 8, 35–46. [Google Scholar] [CrossRef]
- Hughes, S.E.; Hawley, R.S. Heterochromatin: A Rapidly Evolving Species Barrier. PLoS Biol. 2009, 7, e1000233. [Google Scholar] [CrossRef] [Green Version]
- Navarro, A.; Barton, N.H. Chromosomal speciation and molecular divergence-accelerated evolution in rearranged chromosomes. Science 2003, 11, 321–324. [Google Scholar] [CrossRef] [Green Version]
- Tsutsui, N.D.; Suarez, A.V.; Spagna, J.C.; Johnston, J.S. The evolution of genome size in ants. BMC Evol. Biol. 2008, 8, 64–72. [Google Scholar] [CrossRef] [Green Version]
- Crosland, M.W.; Crozier, R.H. Myrmecia pilosula, an ant with only one pair of chromosomes. Science 1986, 231, 1278. [Google Scholar] [CrossRef]
- Mariano, C.D.S.F.; Pompolo, S.D.G.; Barros, L.A.C.; Mariano-Neto, E.; Campiolo, S.; Delabie, J.H.C.A. A biogeographical study of the threatened ant Dinoponera lucida Emery (Hymenoptera: Formicidae: Ponerinae) using a cytogenetic approach. Insect Conserv. Divers. 2008, 1, 161–168. [Google Scholar] [CrossRef] [Green Version]
- Schubert, I. Alteration of chromosome numbers by generation of minichromosomes—Is there a lower limit of chromosome size for stable segregation? Cytogenet. Cell Genet. 2001, 93, 175–181. [Google Scholar] [CrossRef]
- Ardila-Garcia, A.M.; Umphrey, G.J.; Gregory, T.R. An expansion of the genome size dataset for the insect order Hymenoptera, with a first test of parasitism and eusociality as possible constraints. Insect Mol. Biol. 2010, 19, 337–346. [Google Scholar] [CrossRef]
- Gregory, T.R. Genome size evolution in animals. In The Evolution of the Genome; Gregory, T.R., Ed.; Elsevier: San Diego, CA, USA, 2005; pp. 3–87. [Google Scholar]
- Kraaijeveld, K. Genome Size and Species Diversification. Evol. Biol. 2010, 37, 227–233. [Google Scholar] [CrossRef] [Green Version]
- Hessen, D.O.; Jeyasingh, P.D.; Neiman, M.; Weider, L.J. Genome streamlining and the elemental costs of growth. Trends Ecol. Evol. 2010, 25, 75–80. [Google Scholar] [CrossRef]
- Lukhtanov, V.A. The blue butterfly Polyommatus (Plebicula) atlanticus (Lepidoptera, Lycaenidae) holds the record of the highest number of chromosomes in the non-polyploid eukaryotic organisms. Comp. Cytogenet. 2015, 9, 683–690. [Google Scholar] [CrossRef] [Green Version]
- Lukhtanov, V.A.; Pashenkova, Y. Linking karyotypes with DNA barcodes: Proposal for a new standard in chromosomal analysis with an example based on the study of Neotropical Nymphalidae (Lepidoptera). Comp. Cytogenet. 2019, 13, 435–449. [Google Scholar] [CrossRef]
- Gartler, S.M. The chromosome number in humans: A brief history. Nat. Rev. Genet. 2006, 7, 655–660. [Google Scholar] [CrossRef]


| Chromosome (Homologue) | TL (±SD) | L (±SD) | S (±SD) | RL (±SD) | r (±SD) | Classification |
|---|---|---|---|---|---|---|
| 1 | 8.79 ± 3.04 | 4.78 ± 1.71 | 4.01 ± 1.37 | 15.70 ± 0.35 | 1.19 ± 0.13 | Metacentric |
| (1) | 8.37 ± 3.03 | 4.48 ± 1.6 | 3.89 ± 1.46 | 14.89 ± 0.64 | 1.16 ± 0.13 | Metacentric |
| 2 | 4.82 ± 1.57 | 2.82 ± 1.00 | 1.99 ± 0.57 | 08.66 ± 0.37 | 1.40 ± 0.13 | Metacentric |
| (2) | 4.64 ± 1.52 | 2.64 ± 0.89 | 2.00 ± 0.64 | 08.34 ± 0.35 | 1.32 ± 0.12 | Metacentric |
| 3 | 8.02 ± 3.03 | 4.97 ± 1.73 | 3.05 ± 1.38 | 14.19 ± 0.87 | 1.70 ± 0.28 | Submetacentric |
| (3) | 7.76 ± 2.98 | 4.87 ± 1.97 | 2.99 ± 1.03 | 13.70 ± 0.91 | 1.61 ± 0.23 | Submetacentric |
| 4 | 6.90 ± 2.16 | 4.90 ± 1.62 | 2.00 ± 0.58 | 12.47 ± 1.04 | 2.45 ± 0.36 | Submetacentric |
| (4) | 6.67 ± 2.14 | 4.65 ± 1.50 | 2.03 ± 0.66 | 12.05 ± 0.90 | 2.29 ± 0.20 | Submetacentric |
| KL | 55.97 |
| Chromosome (Homologue) | TL (±SD) | L(±SD) | S(±SD) | RL(±SD) | r(±SD) | Classification |
|---|---|---|---|---|---|---|
| 1 | 4.27 ± 0.88 | 2.37 ± 0.44 | 1.89 ± 0.46 | 5.20 ± 0.18 | 1.28 ± 0.15 | Metacentric |
| (1) | 4.14 ± 0.89 | 2.27 ± 0.44 | 1.87 ± 0.46 | 5.03 ± 0.15 | 1.23 ± 0.13 | Metacentric |
| 2 | 3.96 ± 0.83 | 2.24 ± 0.49 | 1.72 ± 0.38 | 4.82 ± 0.18 | 1.32 ± 0.16 | Metacentric |
| (2) | 3.89 ± 0.81 | 2.12 ± 0.46 | 1.77 ± 0.37 | 4.73 ± 0.17 | 1.21 ± 0.10 | Metacentric |
| 3 | 3.76 ± 0.89 | 2.07 ± 0.57 | 1.69 ± 0.38 | 4.54 ± 0.20 | 1.23 ± 0.22 | Metacentric |
| (3) | 3.68 ± 0.89 | 1.99 ± 0.49 | 1.69 ± 0.43 | 4.44 ± 0.18 | 1.19 ± 0.14 | Metacentric |
| 4 | 3.44 ± 0.79 | 1.95 ± 0.50 | 1.49 ± 0.31 | 4.16 ± 0.14 | 1.30 ± 0.13 | Metacentric |
| (4) | 3.30 ± 0.75 | 1.83 ± 0.39 | 1.47 ± 0.37 | 4.00 ± 0.12 | 1.26 ± 0.10 | Metacentric |
| 5 | 3.22 ± 0.71 | 1.79 ± 0.38 | 1.43 ± 0.34 | 3.91 ± 0.11 | 1.26 ± 0.11 | Metacentric |
| (5) | 3.14 ± 0.71 | 1.70 ± 0.34 | 1.43 ± 0.37 | 3.80 ± 0.09 | 1.21 ± 0.11 | Metacentric |
| 6 | 3.06 ± 0.69 | 1.69 ± 0.37 | 1.37 ± 0.34 | 3.70 ± 0.10 | 1.25 ± 0.15 | Metacentric |
| (6) | 2.99 ± 0.65 | 1.68 ± 0.37 | 1.31 ± 0.31 | 3.63 ± 0.06 | 1.29 ± 0.13 | Metacentric |
| 7 | 2.90 ± 0.63 | 1.62 ± 0.35 | 1.28 ± 0.31 | 3.51 ± 0.08 | 1.28 ± 0.14 | Metacentric |
| (7) | 2.86 ± 0.64 | 1.57 ± 0.31 | 1.29 ± 0.33 | 3.46 ± 0.07 | 1.24 ± 0.12 | Metacentric |
| 8 | 2.80 ± 0.64 | 1.57 ± 0.35 | 1.24 ± 0.31 | 3.39 ± 0.06 | 1.29 ± 0.14 | Metacentric |
| (8) | 2.73 ± 0.62 | 1.54 ± 0.34 | 1.20 ± 0.29 | 3.31 ± 0.10 | 1.30 ± 0.14 | Metacentric |
| 9 | 2.65 ± 0.63 | 1.47 ± 0.31 | 1.17 ± 0.32 | 3.20 ± 0.14 | 1.28 ± 0.16 | Metacentric |
| (9) | 2.56 ± 0.63 | 1.41 ± 0.33 | 1.15 ± 0.31 | 3.09 ± 0.16 | 1.25 ± 0.17 | Metacentric |
| 10 | 2.41 ± 0.57 | 1.39 ± 0.29 | 1.01 ± 0.30 | 2.91 ± 0.17 | 1.42 ± 0.20 | Metacentric |
| (10) | 2.20 ± 0.55 | 1.22 ± 0.31 | 0.97 ± 0.30 | 2.65 ± 0.20 | 1.37 ± 0.16 | Metacentric |
| 11 | 1.94 ± 0.48 | 1.11 ± 0.27 | 0.82 ± 0.25 | 2.33 ± 0.11 | 1.43 ± 0.17 | Metacentric |
| (11) | 1.84 ± 0.44 | 1.06 ± 0.26 | 0.79 ± 0.20 | 2.22 ± 0.10 | 1.36 ± 0.17 | Metacentric |
| 12 | 1.70 ± 0.39 | 0.98 ± 0.22 | 0.72 ± 0.18 | 2.06 ± 0.11 | 1.38 ± 0.13 | Metacentric |
| (12) | 1.62 ± 0.38 | 0.93 ± 0.21 | 0.69 ± 0.17 | 1.95 ± 0.09 | 1.35 ± 0.13 | Metacentric |
| 13 | 3.57 ± 0.82 | 2.39 ± 0.53 | 1.17 ± 0.31 | 4.34 ± 0.46 | 2.07 ± 0.26 | Submetacentric |
| (13) | 3.26 ± 0.85 | 2.19 ± 0.53 | 1.07 ± 0.31 | 3.99 ± 0.63 | 2.08 ± 0.11 | Submetacentric |
| 14 | 2.36 ± 0.50 | 1.67 ± 0.39 | 0.70 ± 0.12 | 2.88 ± 0.20 | 2.38 ± 0.30 | Submetacentric |
| (14) | 2.22 ± 0.43 | 1.52 ± 0.31 | 0.70 ± 0.15 | 2.72 ± 0.22 | 2.18 ± 0.30 | Submetacentric |
| KL | 82.47 |
| Chromosome (Homologue) | TL (±SD) | L(±SD) | S(±SD) | RL(±SD) | r(±SD) | Classification |
|---|---|---|---|---|---|---|
| 1 | 3.19 ± 1.40 | 1.76 ± 0.73 | 1.43 ± 0.68 | 3.84 ± 0.2 | 1.27 ± 0.14 | Metacentric |
| (1) | 2.91 ± 1.29 | 1.71 ± 0.76 | 1.20 ± 0.55 | 3.50 ± 0.22 | 1.45 ± 0.22 | Metacentric |
| 2 | 2.62 ± 1.06 | 1.40 ± 0.62 | 1.22 ± 0.47 | 3.18 ± 0.18 | 1.18 ± 0.12 | Metacentric |
| (2) | 2.48 ± 1.09 | 1.31 ± 0.62 | 1.17 ± 0.50 | 2.98 ± 0.23 | 1.28 ± 0.16 | Metacentric |
| 3 | 2.39 ± 1.04 | 1.28 ± 0.53 | 1.10 ± 0.52 | 2.87 ± 0.24 | 1.22 ± 0.17 | Metacentric |
| (3) | 2.23 ± 0.94 | 1.31 ± 0.53 | 0.92 ± 0.43 | 2.69 ± 0.21 | 1.44 ± 0.22 | Metacentric |
| 4 | 2.13 ± 0.92 | 1.26 ± 0.59 | 0.86 ± 0.33 | 2.56 ± 0.14 | 1.44 ± 0.20 | Metacentric |
| (4) | 2.08 ± 0.89 | 1.18 ± 0.5 | 0.90 ± 0.40 | 2.51 ± 0.10 | 1.36 ± 0.19 | Metacentric |
| 5 | 2.00 ± 0.84 | 1.13 ± 0.43 | 0.88 ± 0.43 | 2.42 ± 0.09 | 1.34 ± 0.26 | Metacentric |
| (5) | 1.89 ± 0.71 | 1.10 ± 0.42 | 0.79 ± 0.30 | 2.32 ± 0.14 | 1.40 ± 0.13 | Metacentric |
| 6 | 1.83 ± 0.67 | 1.03 ± 0.37 | 0.80 ± 0.33 | 2.24 ± 0.12 | 1.32 ± 0.23 | Metacentric |
| (6) | 1.80 ± 0.65 | 0.97 ± 0.31 | 0.82 ± 0.36 | 2.20 ± 0.11 | 1.26 ± 0.13 | Metacentric |
| 7 | 1.75 ± 0.65 | 0.97 ± 0.37 | 0.79 ± 0.28 | 2.15 ± 0.10 | 1.25 ± 0.16 | Metacentric |
| (7) | 1.72 ± 0.63 | 0.95 ± 0.35 | 0.77 ± 0.30 | 2.11 ± 0.08 | 1.34 ± 0.12 | Metacentric |
| 8 | 1.68 ± 0.63 | 0.98 ± 0.33 | 0.72 ± 0.29 | 2.05 ± 0.11 | 1.39 ± 0.14 | Metacentric |
| (8) | 1.66 ± 0.62 | 0.94 ± 0.37 | 0.72 ± 0.27 | 2.03 ± 0.11 | 1.36 ± 0.18 | Metacentric |
| 9 | 1.62 ± 0.60 | 0.95 ± 0.38 | 0.68 ± 0.26 | 1.99 ± 0.08 | 1.42 ± 0.22 | Metacentric |
| (9) | 1.59 ± 0.60 | 0.91 ± 0.37 | 0.68 ± 0.26 | 1.95 ± 0.10 | 1.42 ± 0.18 | Metacentric |
| 10 | 1.55 ± 0.60 | 0.89 ± 0.36 | 0.66 ± 0.25 | 1.89 ± 0.08 | 1.33 ± 0.13 | Metacentric |
| (10) | 1.54 ± 0.60 | 0.85 ± 0.30 | 0.69 ± 0.29 | 1.88 ± 0.07 | 1.27 ± 0.13 | Metacentric |
| 11 | 1.52 ± 0.56 | 0.82 ± 0.28 | 0.70 ± 0.28 | 1.86 ± 0.08 | 1.21 ± 0.15 | Metacentric |
| (11) | 1.48 ± 0.55 | 0.83 ± 0.30 | 0.66 ± 0.25 | 1.82 ± 0.07 | 1.26 ± 0.08 | Metacentric |
| 12 | 1.45 ± 0.50 | 0.85 ± 0.31 | 0.60 ± 0.20 | 1.79 ± 0.10 | 1.43 ± 0.16 | Metacentric |
| (12) | 1.41 ± 0.50 | 0.81 ± 0.28 | 0.60 ± 0.22 | 1.74 ± 0.10 | 1.38 ± 0.14 | Metacentric |
| 13 | 1.38 ± 0.49 | 0.78 ± 0.26 | 0.59 ± 0.24 | 1.69 ± 0.08 | 1.37 ± 0.21 | Metacentric |
| (13) | 1.37 ± 0.49 | 0.77 ± 0.25 | 0.59 ± 0.24 | 1.68 ± 0.08 | 1.34 ± 0.15 | Metacentric |
| 14 | 1.34 ± 0.49 | 0.75 ± 0.28 | 0.59 ± 0.21 | 1.64 ± 0.09 | 1.28 ± 0.10 | Metacentric |
| (14) | 1.27 ± 0.44 | 0.76 ± 0.29 | 0.51 ± 0.16 | 1.56 ± 0.11 | 1.46 ± 0.14 | Metacentric |
| 15 | 2.72 ± 1.32 | 1.90 ± 0.95 | 0.82 ± 0.38 | 3.29 ± 0.73 | 2.28 ± 0.19 | Submetacentric |
| (15) | 2.58 ± 1.20 | 1.80 ± 0.84 | 0.78 ± 0.37 | 3.14 ± 0.71 | 2.33 ± 0.28 | Submetacentric |
| 16 | 2.60 ± 1.00 | 1.80 ± 0.67 | 0.80 ± 0.33 | 3.18 ± 0.15 | 2.27 ± 0.17 | Submetacentric |
| (16) | 2.49 ± 0.93 | 1.75 ± 0.69 | 0.74 ± 0.25 | 3.06 ± 0.14 | 2.32 ± 0.21 | Submetacentric |
| 17 | 2.43 ± 0.94 | 1.69 ± 0.64 | 0.75 ± 0.31 | 2.97 ± 0.07 | 2.27 ± 0.18 | Submetacentric |
| (17) | 2.34 ± 0.98 | 1.62 ± 0.65 | 0.72 ± 0.33 | 2.84 ± 0.09 | 2.29 ± 0.15 | Submetacentric |
| 18 | 2.18 ± 0.95 | 1.48 ± 0.62 | 0.71 ± 0.33 | 2.64 ± 0.16 | 2.11 ± 0.16 | Submetacentric |
| (18) | 2.13 ± 0.94 | 1.47 ± 0.68 | 0.66 ± 0.26 | 2.56 ± 0.15 | 2.21 ± 0.25 | Submetacentric |
| 19 | 2.04 ± 0.93 | 1.39 ± 0.59 | 0.65 ± 0.35 | 2.45 ± 0.17 | 2.19 ± 0.21 | Submetacentric |
| (19) | 2.00 ± 0.90 | 1.35 ± 0.61 | 0.66 ± 0.30 | 2.41 ± 0.18 | 2.07 ± 0.21 | Submetacentric |
| 20 | 1.91 ± 0.78 | 1.27 ± 0.50 | 0.64 ± 0.29 | 2.32 ± 0.11 | 2.01 ± 0.16 | Submetacentric |
| (20) | 1.82 ± 0.76 | 1.24 ± 0.54 | 0.59 ± 0.23 | 2.21 ± 0.17 | 2.08 ± 0.26 | Submetacentric |
| 21 | 1.64 ± 0.75 | 1.10 ± 0.52 | 0.54 ± 0.23 | 1.99 ± 0.25 | 2.02 ± 0.17 | Submetacentric |
| (21) | 1.52 ± 0.75 | 1.03 ± 0.55 | 0.50 ± 0.20 | 1.83 ± 0.22 | 2.00 ± 0.21 | Submetacentric |
| KL | 82.28 |
| Chromosome (Homologue) | TL (±SD) | L(±SD) | S(±SD) | RL(±SD) | r(±SD) | Classification |
|---|---|---|---|---|---|---|
| 1 | 6.95 ± 1.32 | 3.73 ± 0.81 | 3.22 ± 0.52 | 6.74 ± 0.25 | 1.17 ± 0.09 | Metacentric |
| (1) | 6.58 ± 1.21 | 3.54 ± 0.69 | 3.06 ± 0.57 | 6.39 ± 0.24 | 1.17 ± 0.07 | Metacentric |
| 2 | 5.75 ± 1.12 | 3.13 ± 0.63 | 2.62 ± 0.46 | 5.58 ± 0.23 | 1.19 ± 0.07 | Metacentric |
| (2) | 5.39 ± 1.05 | 2.92 ± 0.54 | 2.45 ± 0.52 | 5.22 ± 0.18 | 1.20 ± 0.13 | Metacentric |
| 3 | 5.01 ± 0.89 | 2.77 ± 0.44 | 2.24 ± 0.48 | 4.87 ± 0.15 | 1.26 ± 0.18 | Metacentric |
| (3) | 4.82 ± 0.86 | 2.79 ± 0.49 | 2.03 ± 0.39 | 4.68 ± 0.13 | 1.38 ± 0.18 | Metacentric |
| 4 | 4.71 ± 0.82 | 2.61 ± 0.43 | 2.09 ± 0.53 | 4.58 ± 0.12 | 1.36 ± 0.16 | Metacentric |
| (4) | 4.60 ± 0.79 | 2.63 ± 0.41 | 1.97 ± 0.56 | 4.47 ± 0.09 | 1.48 ± 0.15 | Metacentric |
| 5 | 4.50 ± 0.74 | 2.54 ± 0.32 | 1.94 ± 0.44 | 4.38 ± 0.08 | 1.35 ± 0.19 | Metacentric |
| (5) | 4.38 ± 0.72 | 2.54 ± 0.35 | 1.83 ± 0.41 | 4.26 ± 0.07 | 1.42 ± 0.21 | Metacentric |
| 6 | 4.31 ± 0.73 | 2.56 ± 0.40 | 1.73 ± 0.36 | 4.19 ± 0.07 | 1.50 ± 0.17 | Metacentric |
| (6) | 4.25 ± 0.71 | 2.36 ± 0.47 | 1.86 ± 0.47 | 4.14 ± 0.07 | 1.43 ± 0.25 | Metacentric |
| 7 | 4.20 ± 0.71 | 2.47 ± 0.32 | 1.75 ± 0.42 | 4.09 ± 0.07 | 1.45 ± 0.22 | Metacentric |
| (7) | 4.12 ± 0.72 | 2.36 ± 0.38 | 1.77 ± 0.38 | 4.01 ± 0.10 | 1.35 ± 0.20 | Metacentric |
| 8 | 4.02 ± 0.69 | 2.29 ± 0.40 | 1.72 ± 0.35 | 3.91 ± 0.08 | 1.35 ± 0.21 | Metacentric |
| (8) | 3.84 ± 0.62 | 2.09 ± 0.50 | 1.75 ± 0.22 | 3.74 ± 0.12 | 1.31 ± 0.19 | Metacentric |
| 9 | 3.64 ± 0.61 | 2.06 ± 0.34 | 1.57 ± 0.29 | 3.54 ± 0.17 | 1.33 ± 0.15 | Metacentric |
| (9) | 3.48 ± 0.54 | 1.96 ± 0.31 | 1.53 ± 0.27 | 3.40 ± 0.14 | 1.30 ± 0.19 | Metacentric |
| 10 | 3.35 ± 0.52 | 1.94 ± 0.33 | 1.42 ± 0.24 | 3.27 ± 0.10 | 1.38 ± 0.19 | Metacentric |
| (10) | 3.22 ± 0.46 | 1.83 ± 0.30 | 1.40 ± 0.23 | 3.15 ± 0.13 | 1.32 ± 0.23 | Metacentric |
| 11 | 3.12 ± 0.46 | 1.81 ± 0.21 | 1.31 ± 0.27 | 3.05 ± 0.12 | 1.41 ± 0.18 | Metacentric |
| (11) | 3.06 ± 0.47 | 1.83 ± 0.28 | 1.23 ± 0.20 | 2.98 ± 0.11 | 1.50 ± 0.12 | Metacentric |
| 12 | 2.82 ± 0.48 | 1.63 ± 0.31 | 1.20 ± 0.19 | 2.76 ± 0.22 | 1.36 ± 0.18 | Metacentric |
| (12) | 2.64 ± 0.33 | 1.53 ± 0.20 | 1.12 ± 0.14 | 2.59 ± 0.19 | 1.36 ± 0.13 | Metacentric |
| KL | 102.76 |
| Species Studied | 2n (n) | Genome Size 1C (pg) | Local/State | Country | Karyotype | Heterochromatic Pattern (C-Bands) | References | ||||
|---|---|---|---|---|---|---|---|---|---|---|---|
| C | PC | IN | SA | LA | |||||||
| Acromyrmex ambiguus | 38 | 0.33 | SP | Uruguay | 14 m + 12 sm + 8 st + 4 a (2 m + 6 sm + 16 st + 14 a) | + | + | – | + | – | [28,29] |
| Acromyrmex ameliae | 36 | - | MG | Brazil | 10 m +16 sm + 8 st + 2 a | + | – | – | + | – | [30] |
| Acromyrmex aspersus | 38 | - | MG | Brazil | 8 m + 10 sm + 16 st + 4 a | [31] | |||||
| Acromyrmex balzani | 38 | 0.37 | MG | Brazil, French Guiana | 12 m + 10 sm + 14 st + 2 a | + | + | – | + | – | [32,33] |
| Acromyrmex coronatus | 38 (19) | 0.34 | MG | Brazil | 12 m + 8 sm + 16 st + 2 a | + | + | – | + | – | [32] |
| Acromyrmex crassispinus | 38 | 0.34 | MG | Brazil | 12 m + 20 sm + 4 st + 2 a | [29,34] | |||||
| Acromyrmex disciger | 38 | 0.33 | MG | Brazil | 10 m + 12 sm + 14 st + 2 a | + | + | – | + | – | [32] |
| Acromyrmex echinatior | 38 | 0.36 | Panama | 8 m + 6 sm + 14 st + 10 a | – | – | + | + | – | [32] | |
| Acromyrmex heyeri | 38 | - | RS | Uruguay, Brazil | 2 m + 6 sm + 16 st + 14 a | [28,35] | |||||
| Acromyrmex hispidus | 38 | - | Uruguay | 2 m + 6 sm + 16 st + 14 a | [28] | ||||||
| Acromyrmex lundi | 38 (19) | - | RS | Brazil | 10 m + 14 sm + 10 st + 4 a | [29] | |||||
| Acromyrmex niger | 38 | 0.36 | MG | Brazil | 12 m + 14 sm + 10 st + 2 a | – | + | – | + | – | [32] |
| Acromyrmex nigrosetosus | 38(19) | 0.35 | MG | Brazil | 12 m + 14 sm + 10 st + 2 a | [29] | |||||
| Acromyrmex rugosus | 38 | 0.35 | MG | Brazil | 16 m + 12 sm + 8 st + 2 a | + | + | – | + | – | [32] |
| Acromyrmex subterraneus molestans | 38 | 0.34 | MG | Brazil | 10 m + 10 sm + 16 st + 2 a | [31,34] | |||||
| Acromyrmex subterraneus subterraneus | 38 | 0.35 | MG | Brazil | 14 m + 18 sm + 4 st + 2 a | + | + | – | + | – | [29,34] |
| Acromyrmex subterraneus brunneus | 38 | 0.34 | MG | Brazil | 10 m + 14 sm + 12 st + 2 a | + | – | – | + | – | [30] |
| Amoimyrmex striatus | 22 | 0.35 | SC | Brazil | 20 m + 2 sm | + | + | – | + | – | [11] |
| Amoimyrmex silvestrii | 22 | Argentine | 20 m + 2 sm | [36] | |||||||
| Amoimyrmex bruchi | 22 | Argentine | 20 m + 2 sm | [36] | |||||||
| Apterostigma madidiense | (23) | - | Brazil | 14 m + 20 sm + 10 st + 2 a | [37] | ||||||
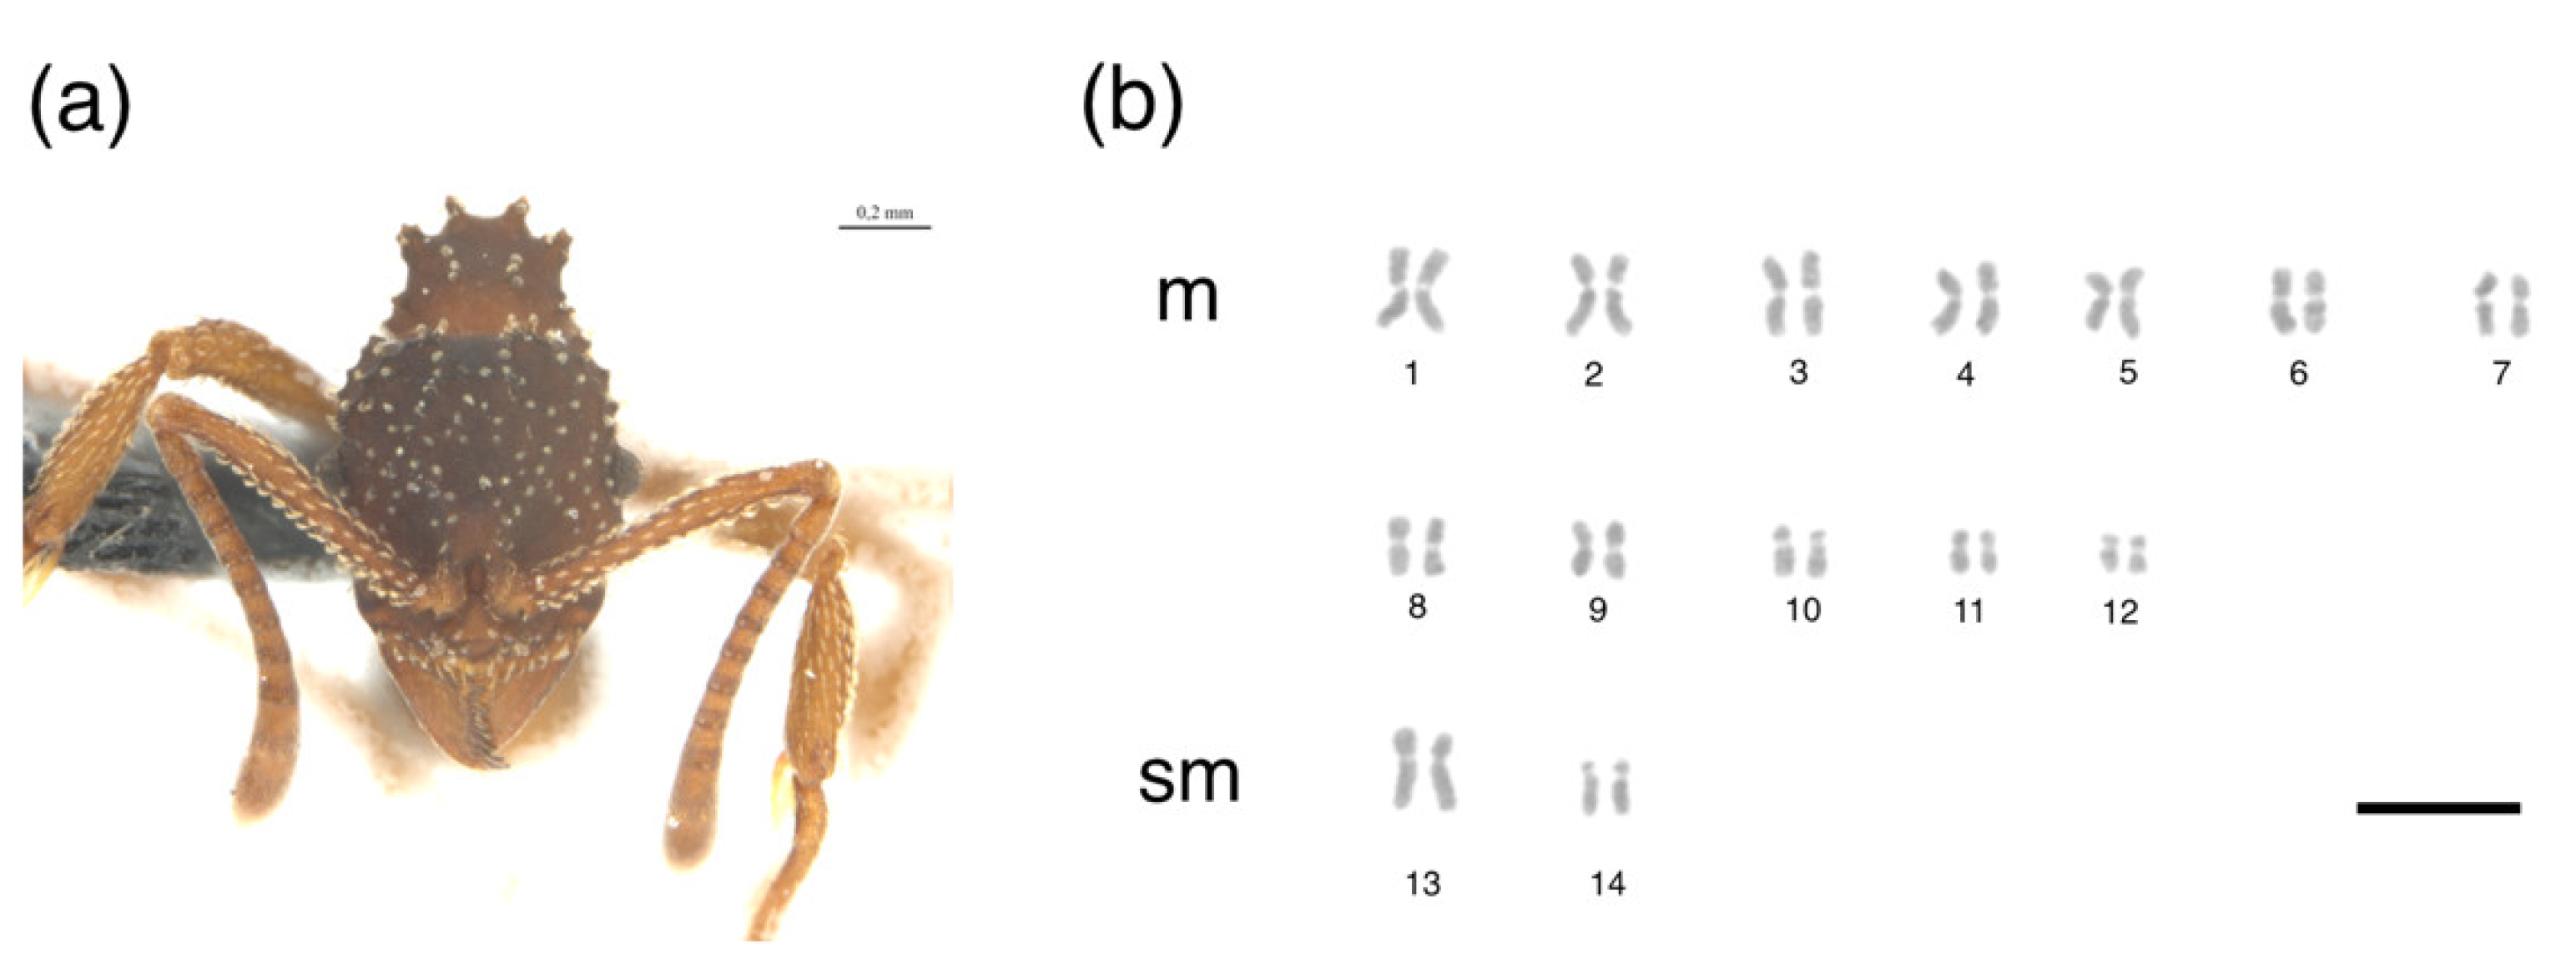
| Apterostigma madidiense | 24 | 0.74 | MG | Brazil | 24 m | + | + | – | – | – | This study |
| Apterostigma mayri | 24 | - | Panama | 24 m | + | – | – | – | – | [38] | |
| Apterostigma sp. | 20 | - | Brazil | 6 m + 12 sm + 2 a | [34] | ||||||
| Apterostigma sp. | 24 | - | Panama | 24 m | [38] | ||||||
| Apterostigma sp. | 32 | - | French Guiana | 14 m + 6 sm + 10 st + 2 t | [39] | ||||||
| Apterostigma steigeri | 22 | - | Brazil | 20 m + 2 sm | [37] | ||||||
| Atta bisphaerica | 22 | - | MG | Brazil | 12 m + 6 sm + 4 a | + | + | – | – | – | [34,40] |
| Atta colombica | 22 (11) | 0.31 | Panama | 12 m + 6 sm + 4 a | + | – | + | – | – | [38] | |
| Atta laevigata | 22 | 0.33 | MG | Brazil | 12 m + 6 sm + 4 a | + | + | – | – | – | [34,40] |
| Atta robusta | 22 | 0.34 | ES | Brazil | 18 m + 2 sm + 2 st | + | + | – | – | – | [41] |
| Atta sexdens | 22 | 0.33 | MG, RS | Brazil | 12 m + 6 sm + 4 a | + | + | – | – | – | [34,35,40] |
| Atta sexdens | 22 | - | French Guiana | 18 m + 2 sm + 2 st | + | + | – | – | – | [33] | |
| Cyphomyrmex cornutus | 22 | - | French Guiana | 10 m + 12 sm | [39] | ||||||
| Cyphomyrmex costatus | 20 | - | Panama | 20 m | + | – | – | – | – | [38] | |
| Cyphomyrmex rimosus | 32 | - | Panama | 28 m + 4 a | [38] | ||||||
| Cyphomyrmex transversus | 24 (12) | - | French Guiana | 14 m + 6 sm + 4 a | [33] | ||||||
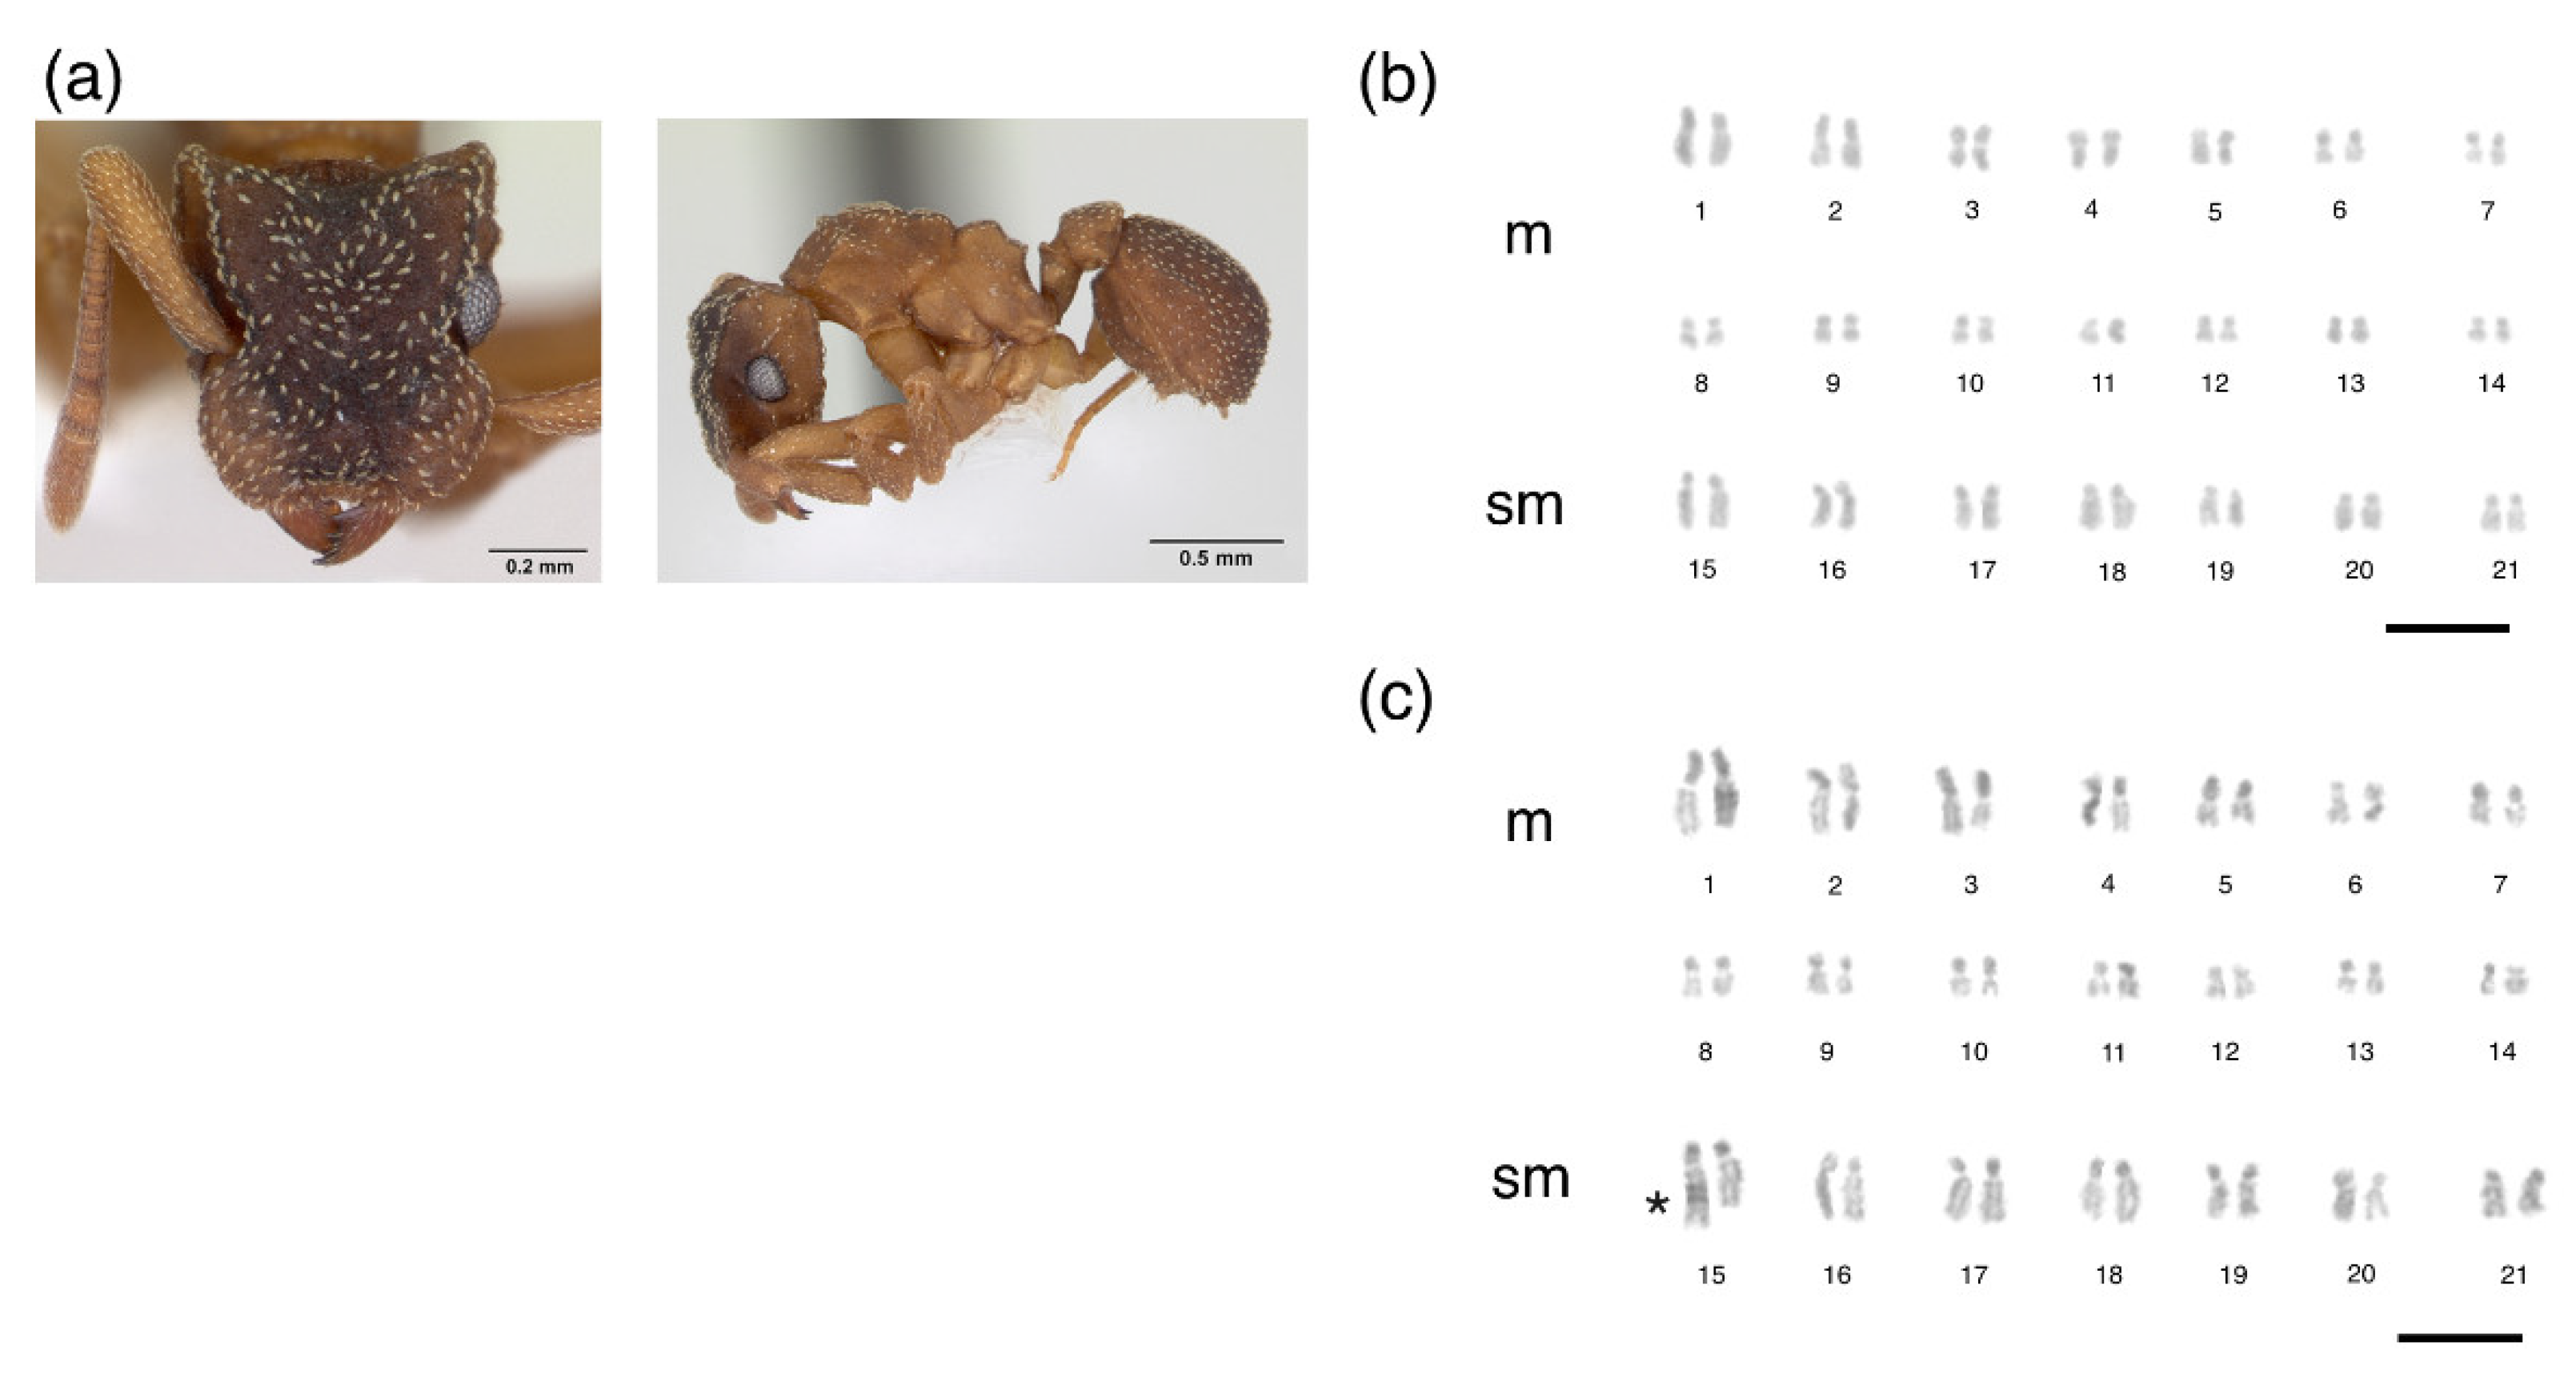
| Cyphomyrmex transversus | 42 (21) | 0.50 | RJ | Brazil | 28 m + 14 sm | + | – | – | – | – | This study |
| Mycetarotes carinatus | 14 | - | MG | Brazil | 8 m + 6 sm | + | + | – | – | – | [42] |
| Mycetarotes parallelus | 54 | 0.38 | MG | Brazil | 26 m + 16 sm + 6 a | + | + | – | + | – | [42] |
| Mycetomoellerius fuscus | 18 (9) | 0.47 | MG | Brazil | 16 m + 2 sm | + | + | – | – | – | [43] |
| Mycetomoellerius holmgreni | 20 (10) | 0.33 | MG, SC, RS | Brazil | 20 m | + | + | – | – | – | [7] |
| Mycetomoellerius iheringi | 20 (10) | 0.40 | SC | Brazil | 18 m + 2 sm | + | + | – | – | – | [44] |
| Mycetomoellerius relictus | 20 (10) | - | MG | Brazil | 20 m | + | + | – | – | – | [37] |
| Mycetomoellerius sp. | 22 | - | MG | Brazil | 18 m + 4 sm | [37] | |||||
| Mycetophylax conformis | 30 (15) | 0.31 | RJ, SP | Brazil | 22 m + 8 sm | + | + | – | + | – | [10] |
| Mycetophylax morschi | 30 (15) | 0.34 | RJ, RS, SC | Brazil | 18 m + 6 sm + 2 a | + | – | – | – | – | [10] |
| Mycetophylax morschi | 26 (13) | 0.31 | SC | Brazil | 18 m + 10 sm + 2 a | + | – | – | – | – | [10] |
| Mycetophylax morschi | 28 (14) | - | BA | Brazil | 18 m + 10 sm | + | – | – | – | – | [17] |
| Mycetophylax simplex | 36 (18) | 0.41 | SC, PR, SP | Brazil | 20 m + 16 sm | + | + | – | + | – | [10] |
| Mycocepurus goeldii | 8 | - | MG | Brazil | 8 m | + | + | – | – | – | [45] |
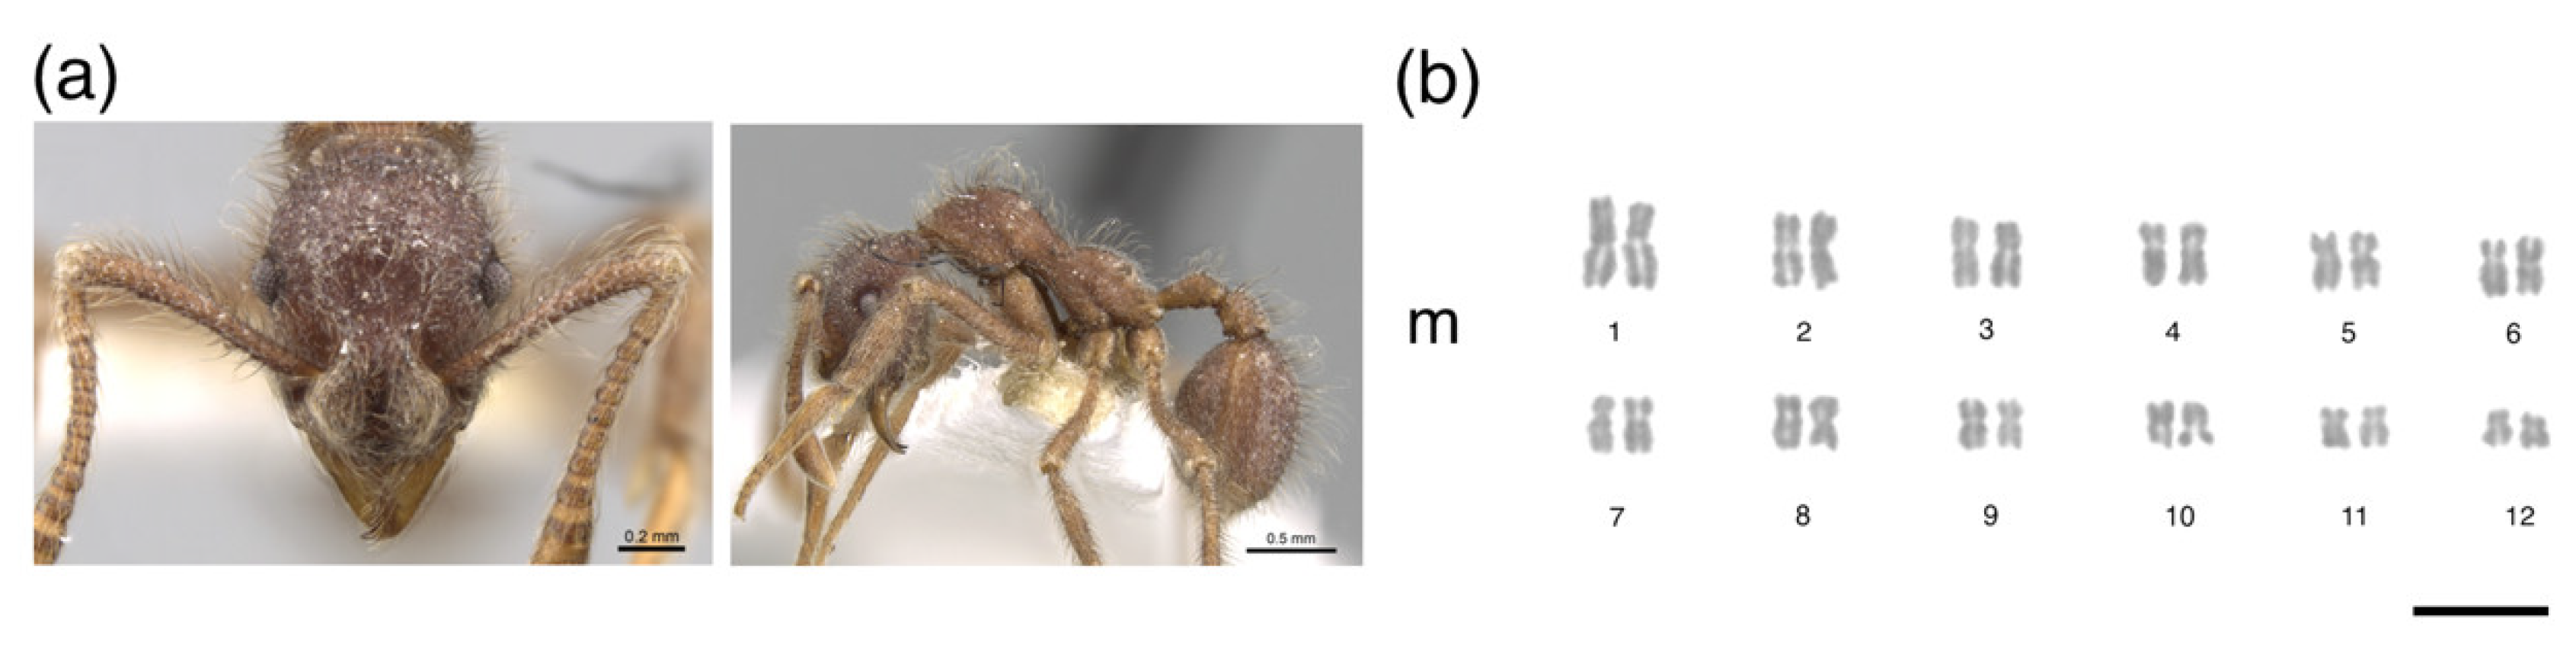
| Mycocepurus goeldii | 8 (4) | 0.42 | SC | Brazil | 4 m + 4 sm | This study | |||||
| Mycocepurus sp. | 8 | - | Panama | 4 m | [38] | ||||||
| Myrmicocrypta sp. | 30 | - | French Guiana | 22 m + 2 sm + 6 a | [33] | ||||||
| Myrmicocrypta sp. | 28 (14) | 0.48 | RJ | Brazil | 24 m + 4 sm | + | + | – | – | – | This study |
| Sericomyrmex amabilis | 50 | 0.45 | Panama | 50 m | + | + | – | – | – | [38] | |
| Sericomyrmex sp. | 50 (25) | - | MG | Brazil | 44 m + 6 sm | [37] | |||||
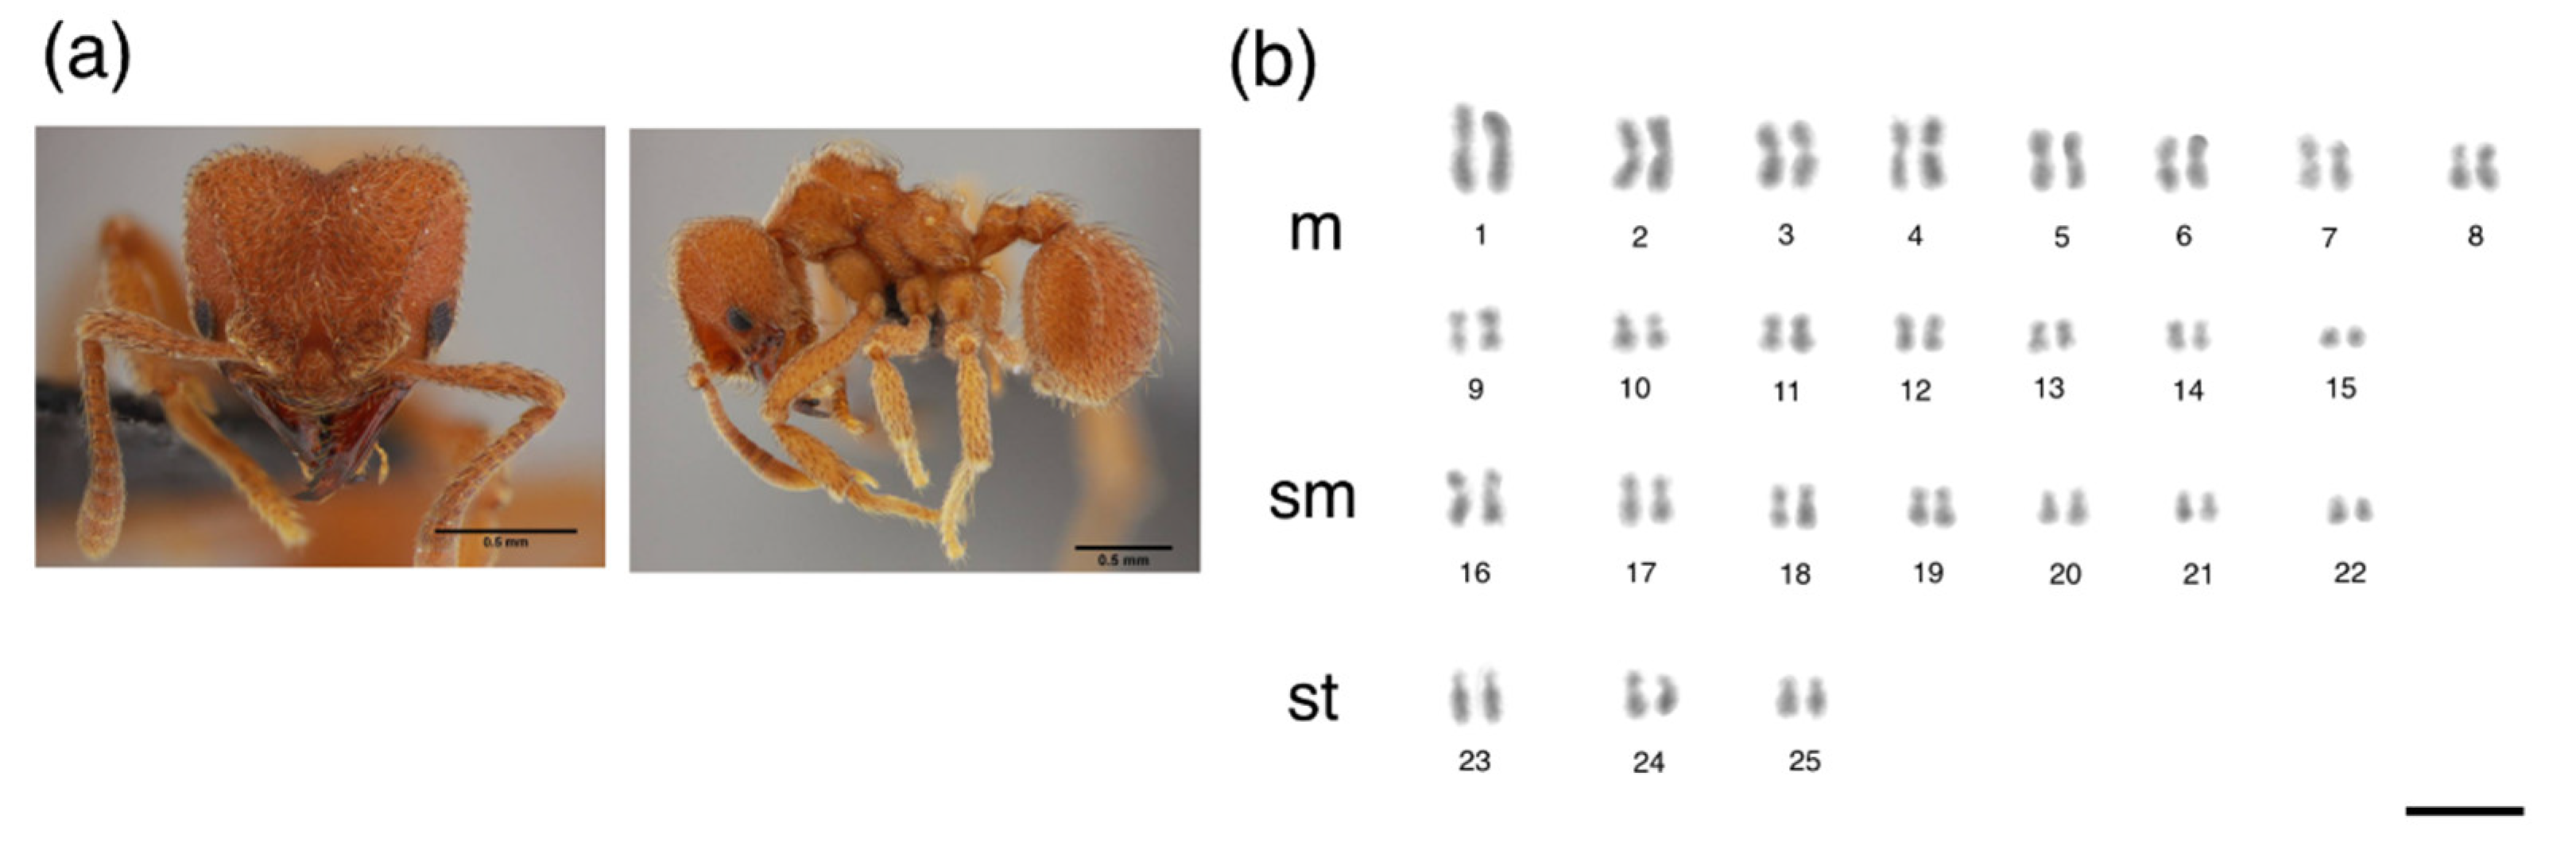
| Serycomyrmex parvulus | 50 (25) | 0.42 | MG | Brazil | 30 m + 14 sm + 6 st | + | + | – | – | – | This study |
| Trachymyrmex septentrionalis | 20 (10) | 0.25 | Panama | 20 m | [38] | ||||||
| Trachymyrmex sp.1 | 12 (6) | - | Panama | 12 m | + | – | + | – | – | [38] | |
| Trachymyrmex sp.2 | 18 | - | Panama | 18 m | [38] | ||||||
Publisher’s Note: MDPI stays neutral with regard to jurisdictional claims in published maps and institutional affiliations. |
© 2021 by the authors. Licensee MDPI, Basel, Switzerland. This article is an open access article distributed under the terms and conditions of the Creative Commons Attribution (CC BY) license (https://creativecommons.org/licenses/by/4.0/).
Share and Cite
Cardoso, D.C.; Cristiano, M.P. Karyotype Diversity, Mode, and Tempo of the Chromosomal Evolution of Attina (Formicidae: Myrmicinae: Attini): Is There an Upper Limit to Chromosome Number? Insects 2021, 12, 1084. https://doi.org/10.3390/insects12121084
Cardoso DC, Cristiano MP. Karyotype Diversity, Mode, and Tempo of the Chromosomal Evolution of Attina (Formicidae: Myrmicinae: Attini): Is There an Upper Limit to Chromosome Number? Insects. 2021; 12(12):1084. https://doi.org/10.3390/insects12121084
Chicago/Turabian StyleCardoso, Danon Clemes, and Maykon Passos Cristiano. 2021. "Karyotype Diversity, Mode, and Tempo of the Chromosomal Evolution of Attina (Formicidae: Myrmicinae: Attini): Is There an Upper Limit to Chromosome Number?" Insects 12, no. 12: 1084. https://doi.org/10.3390/insects12121084