Effects on Some Therapeutical, Biochemical, and Immunological Parameters of Honey Bee (Apis mellifera) Exposed to Probiotic Treatments, in Field and Laboratory Conditions

 , and
, and 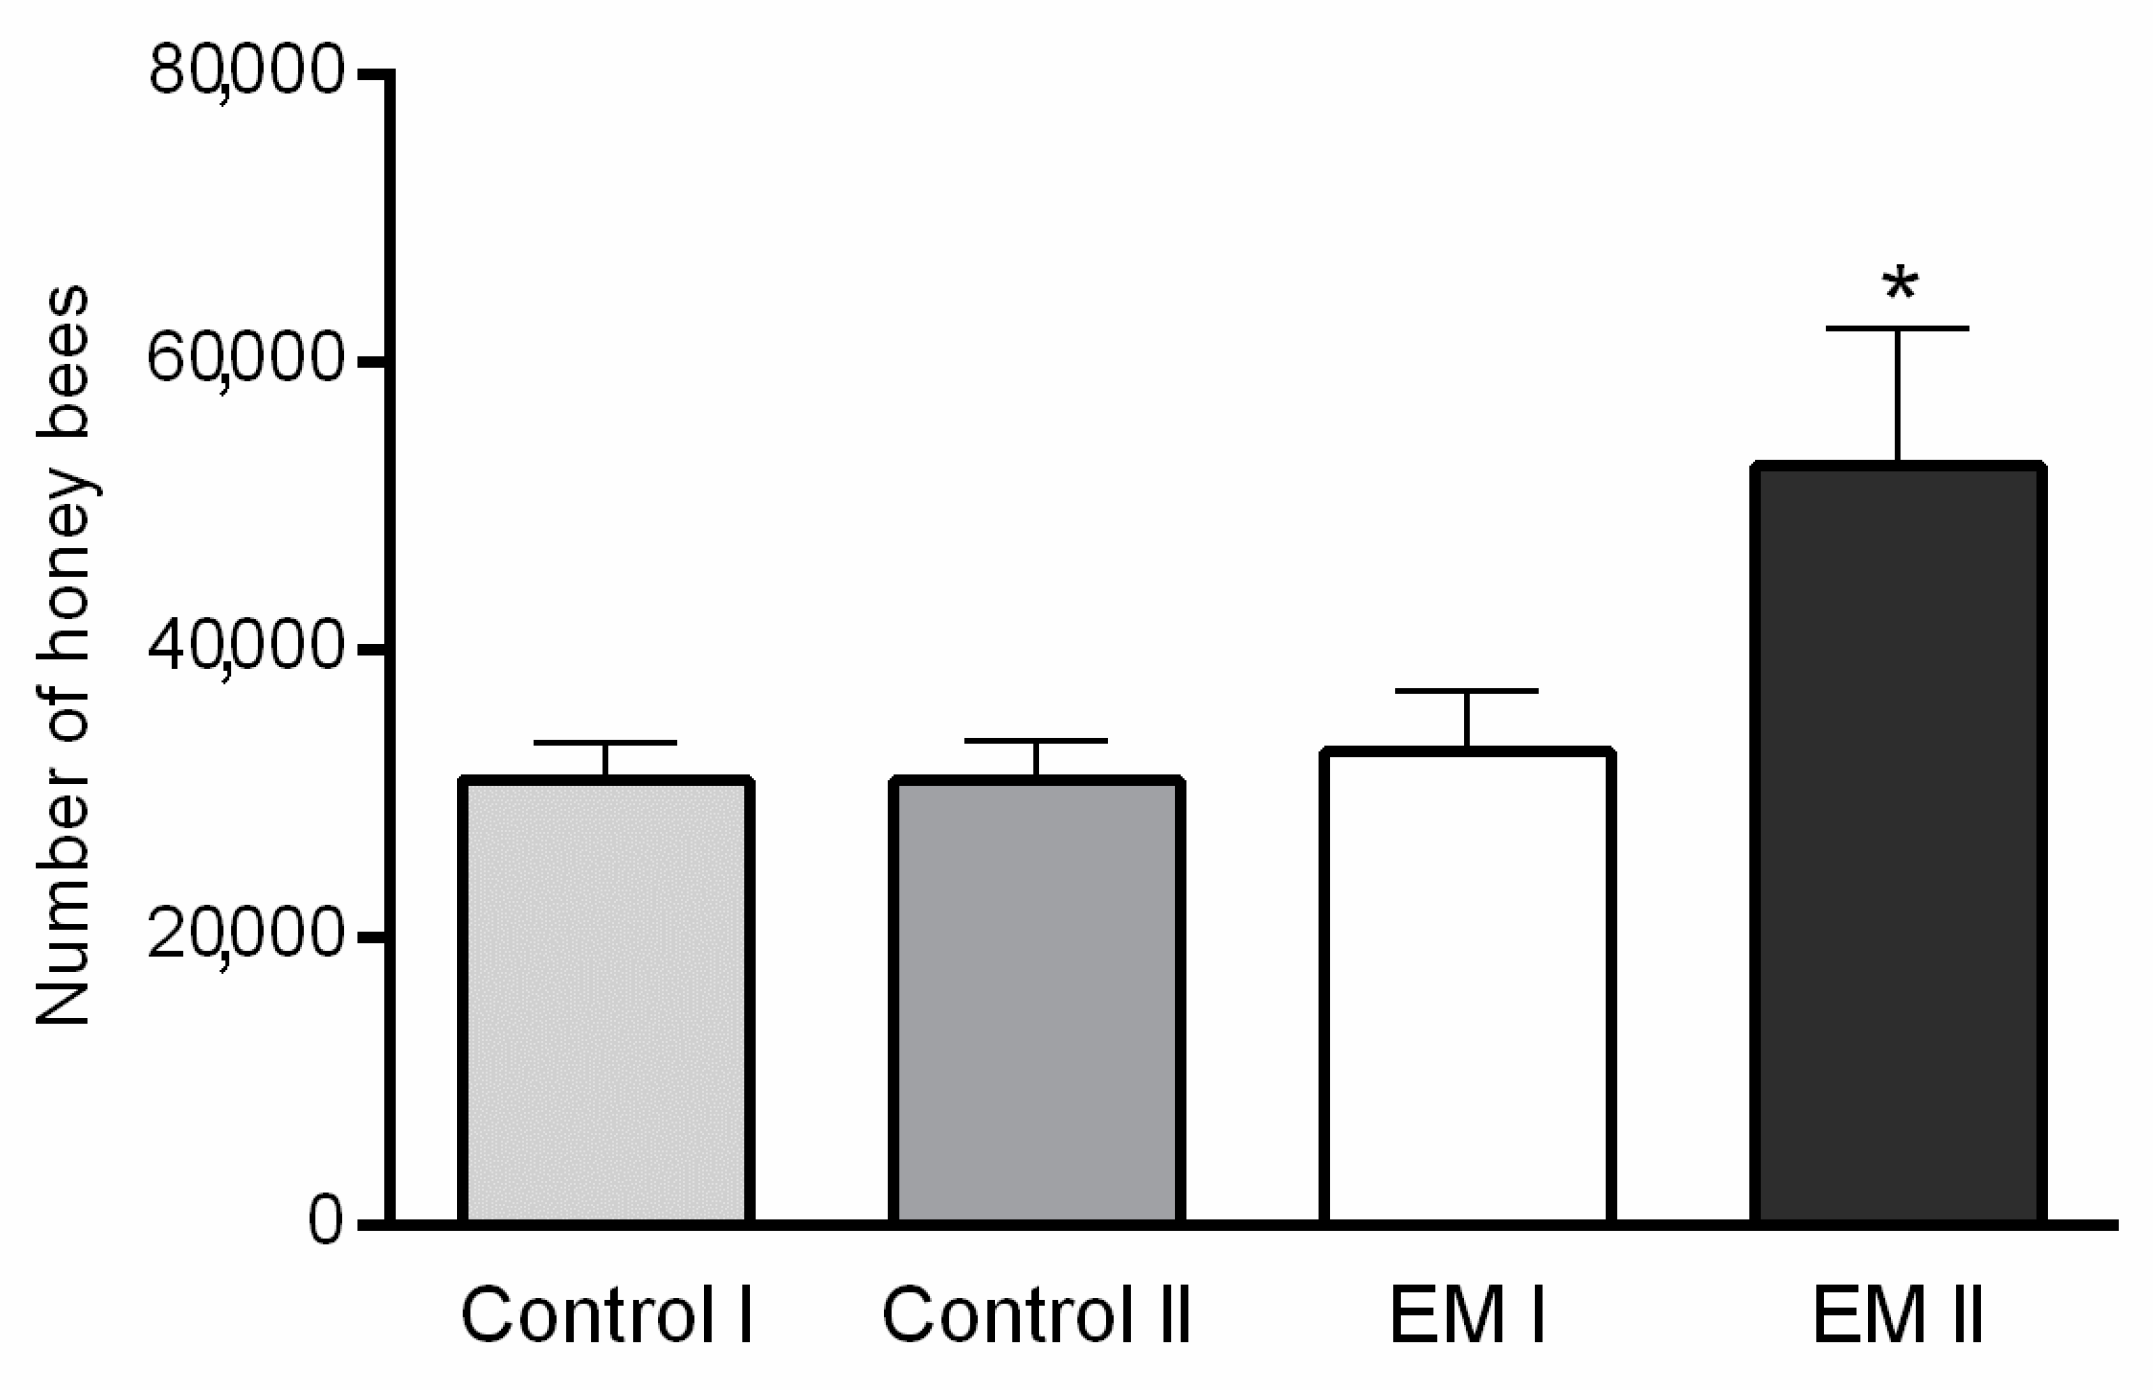
Abstract
:Simple Summary
Abstract
1. Introduction
2. Materials and Methods
2.1. Field Test
2.1.1. Locations of Experimental Apiaries and Field Trail Design
2.1.2. Supplemental Feed Treatments and Adult Honey Bees Sampling
2.1.3. Examinations and Estimating the Strength of Honey Bee Colonies
2.1.4. Determination of Nosema spp. Infection Levels
2.2. Trials in Laboratory-Controlled Conditions
2.2.1. Trial Design in Incubators and Sampling of Adult Bees
2.2.2. Hemolymph Collection
2.2.3. Biochemical Parameters
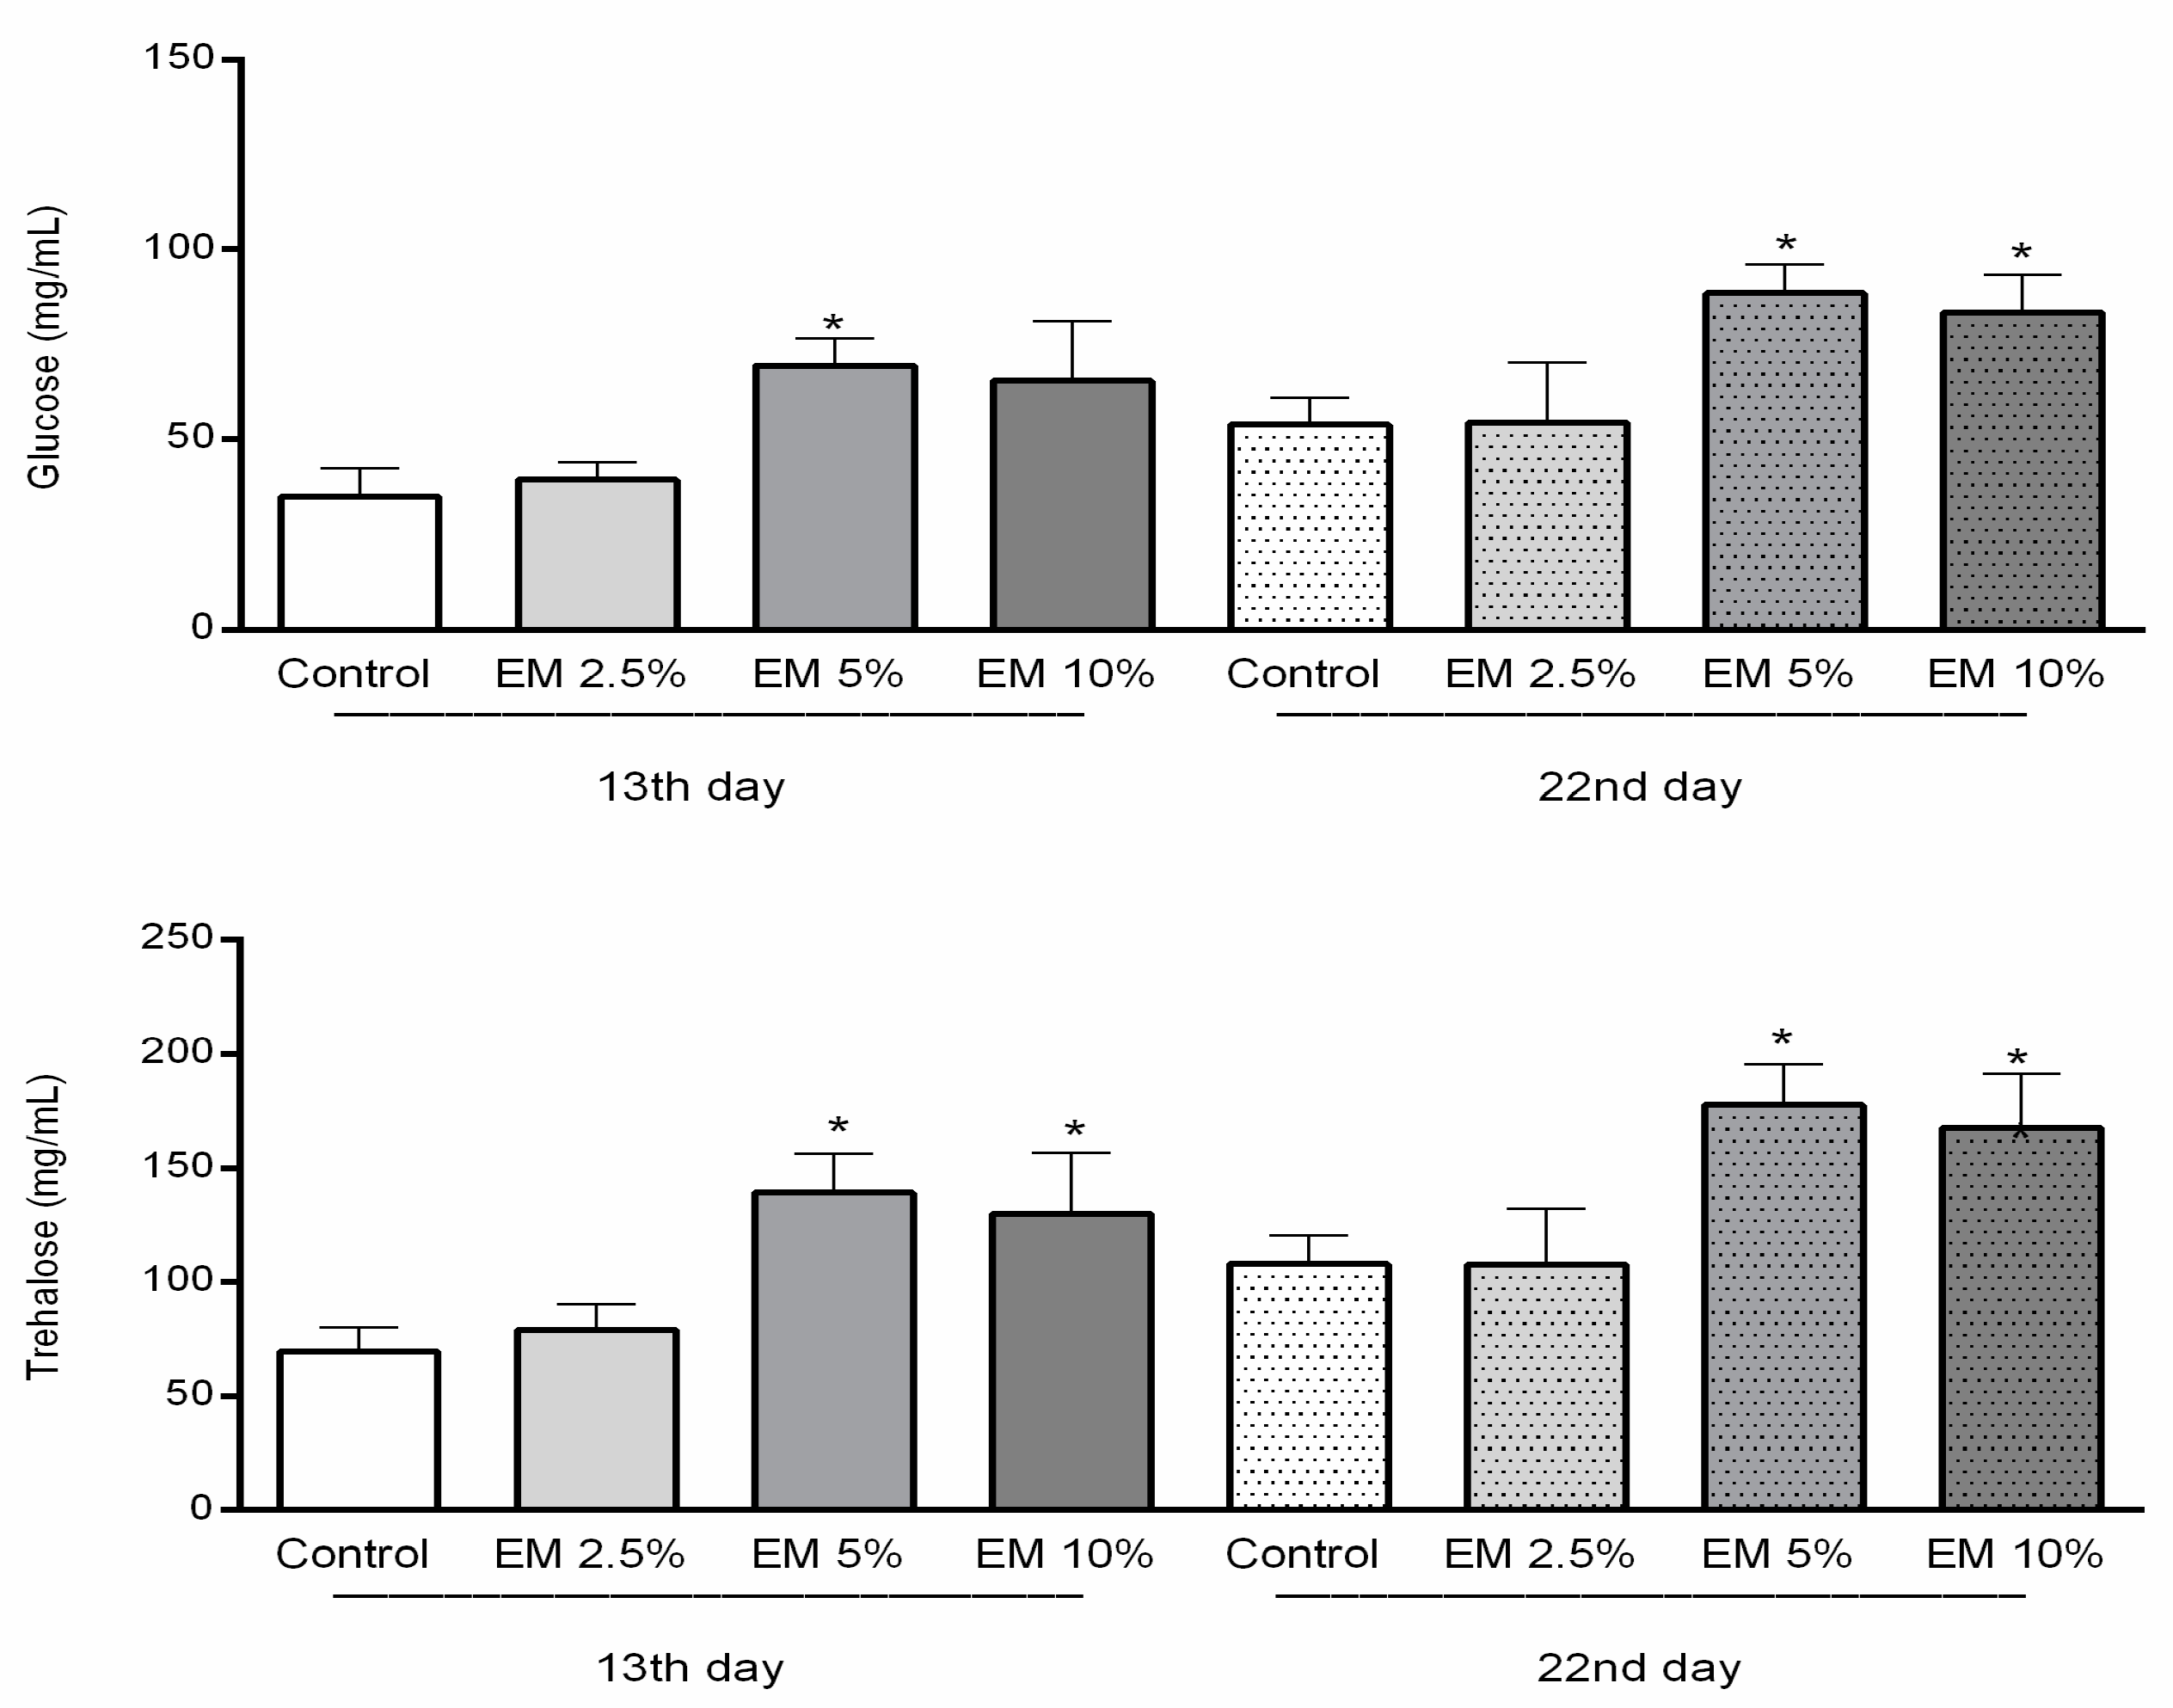
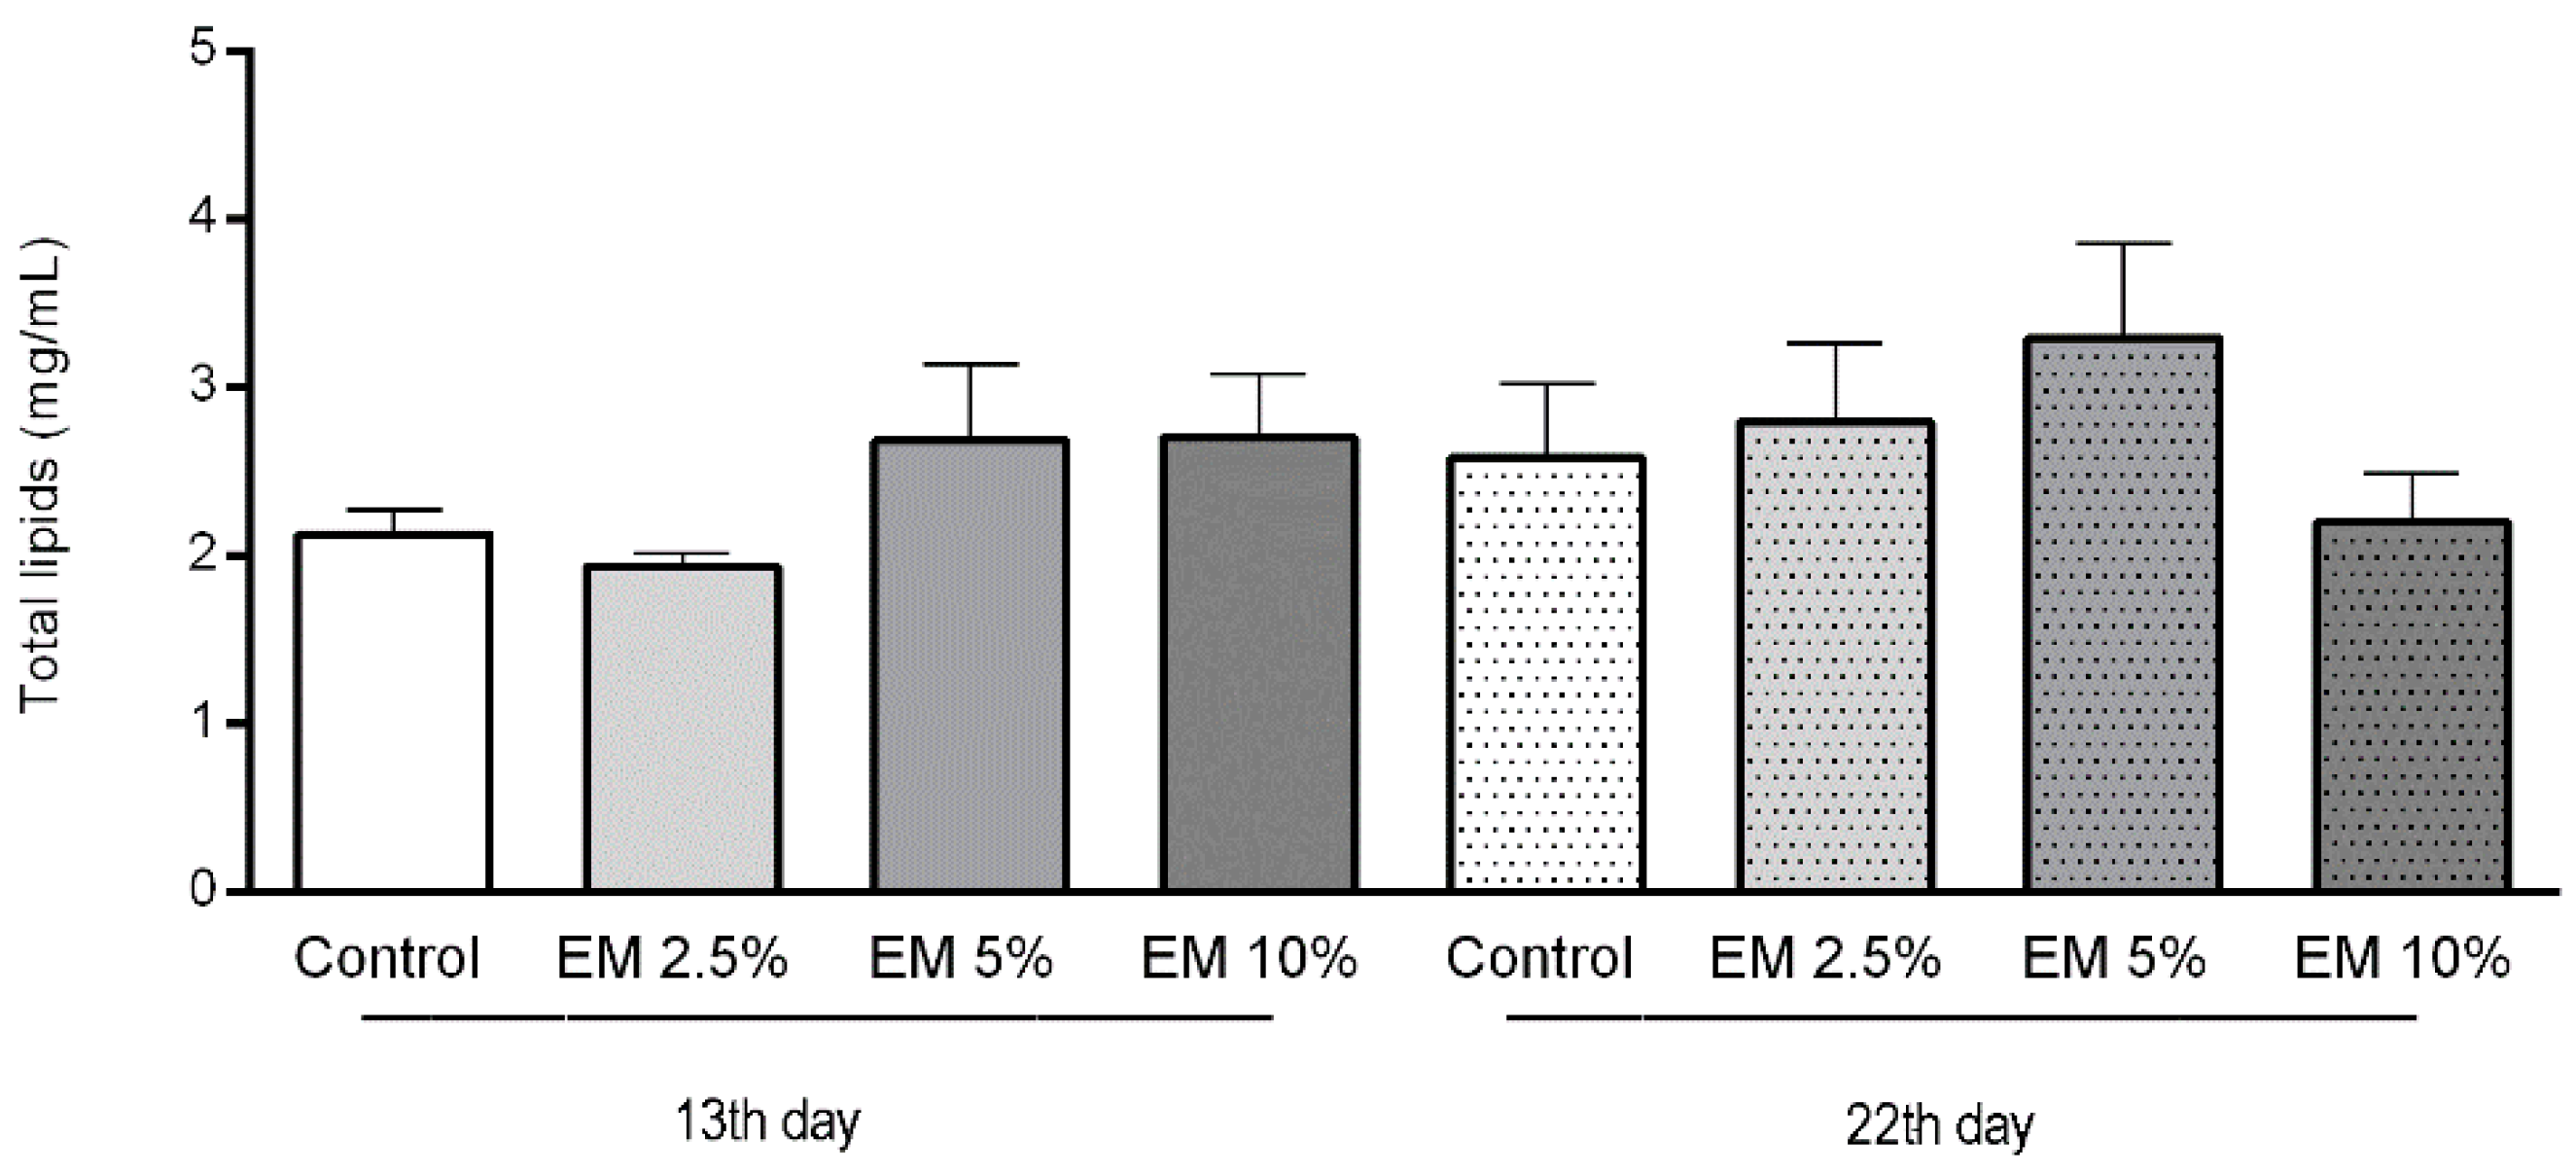
Glucose, Trehalose, and Lipid Concentrations
2.2.4. Immunological Parameters
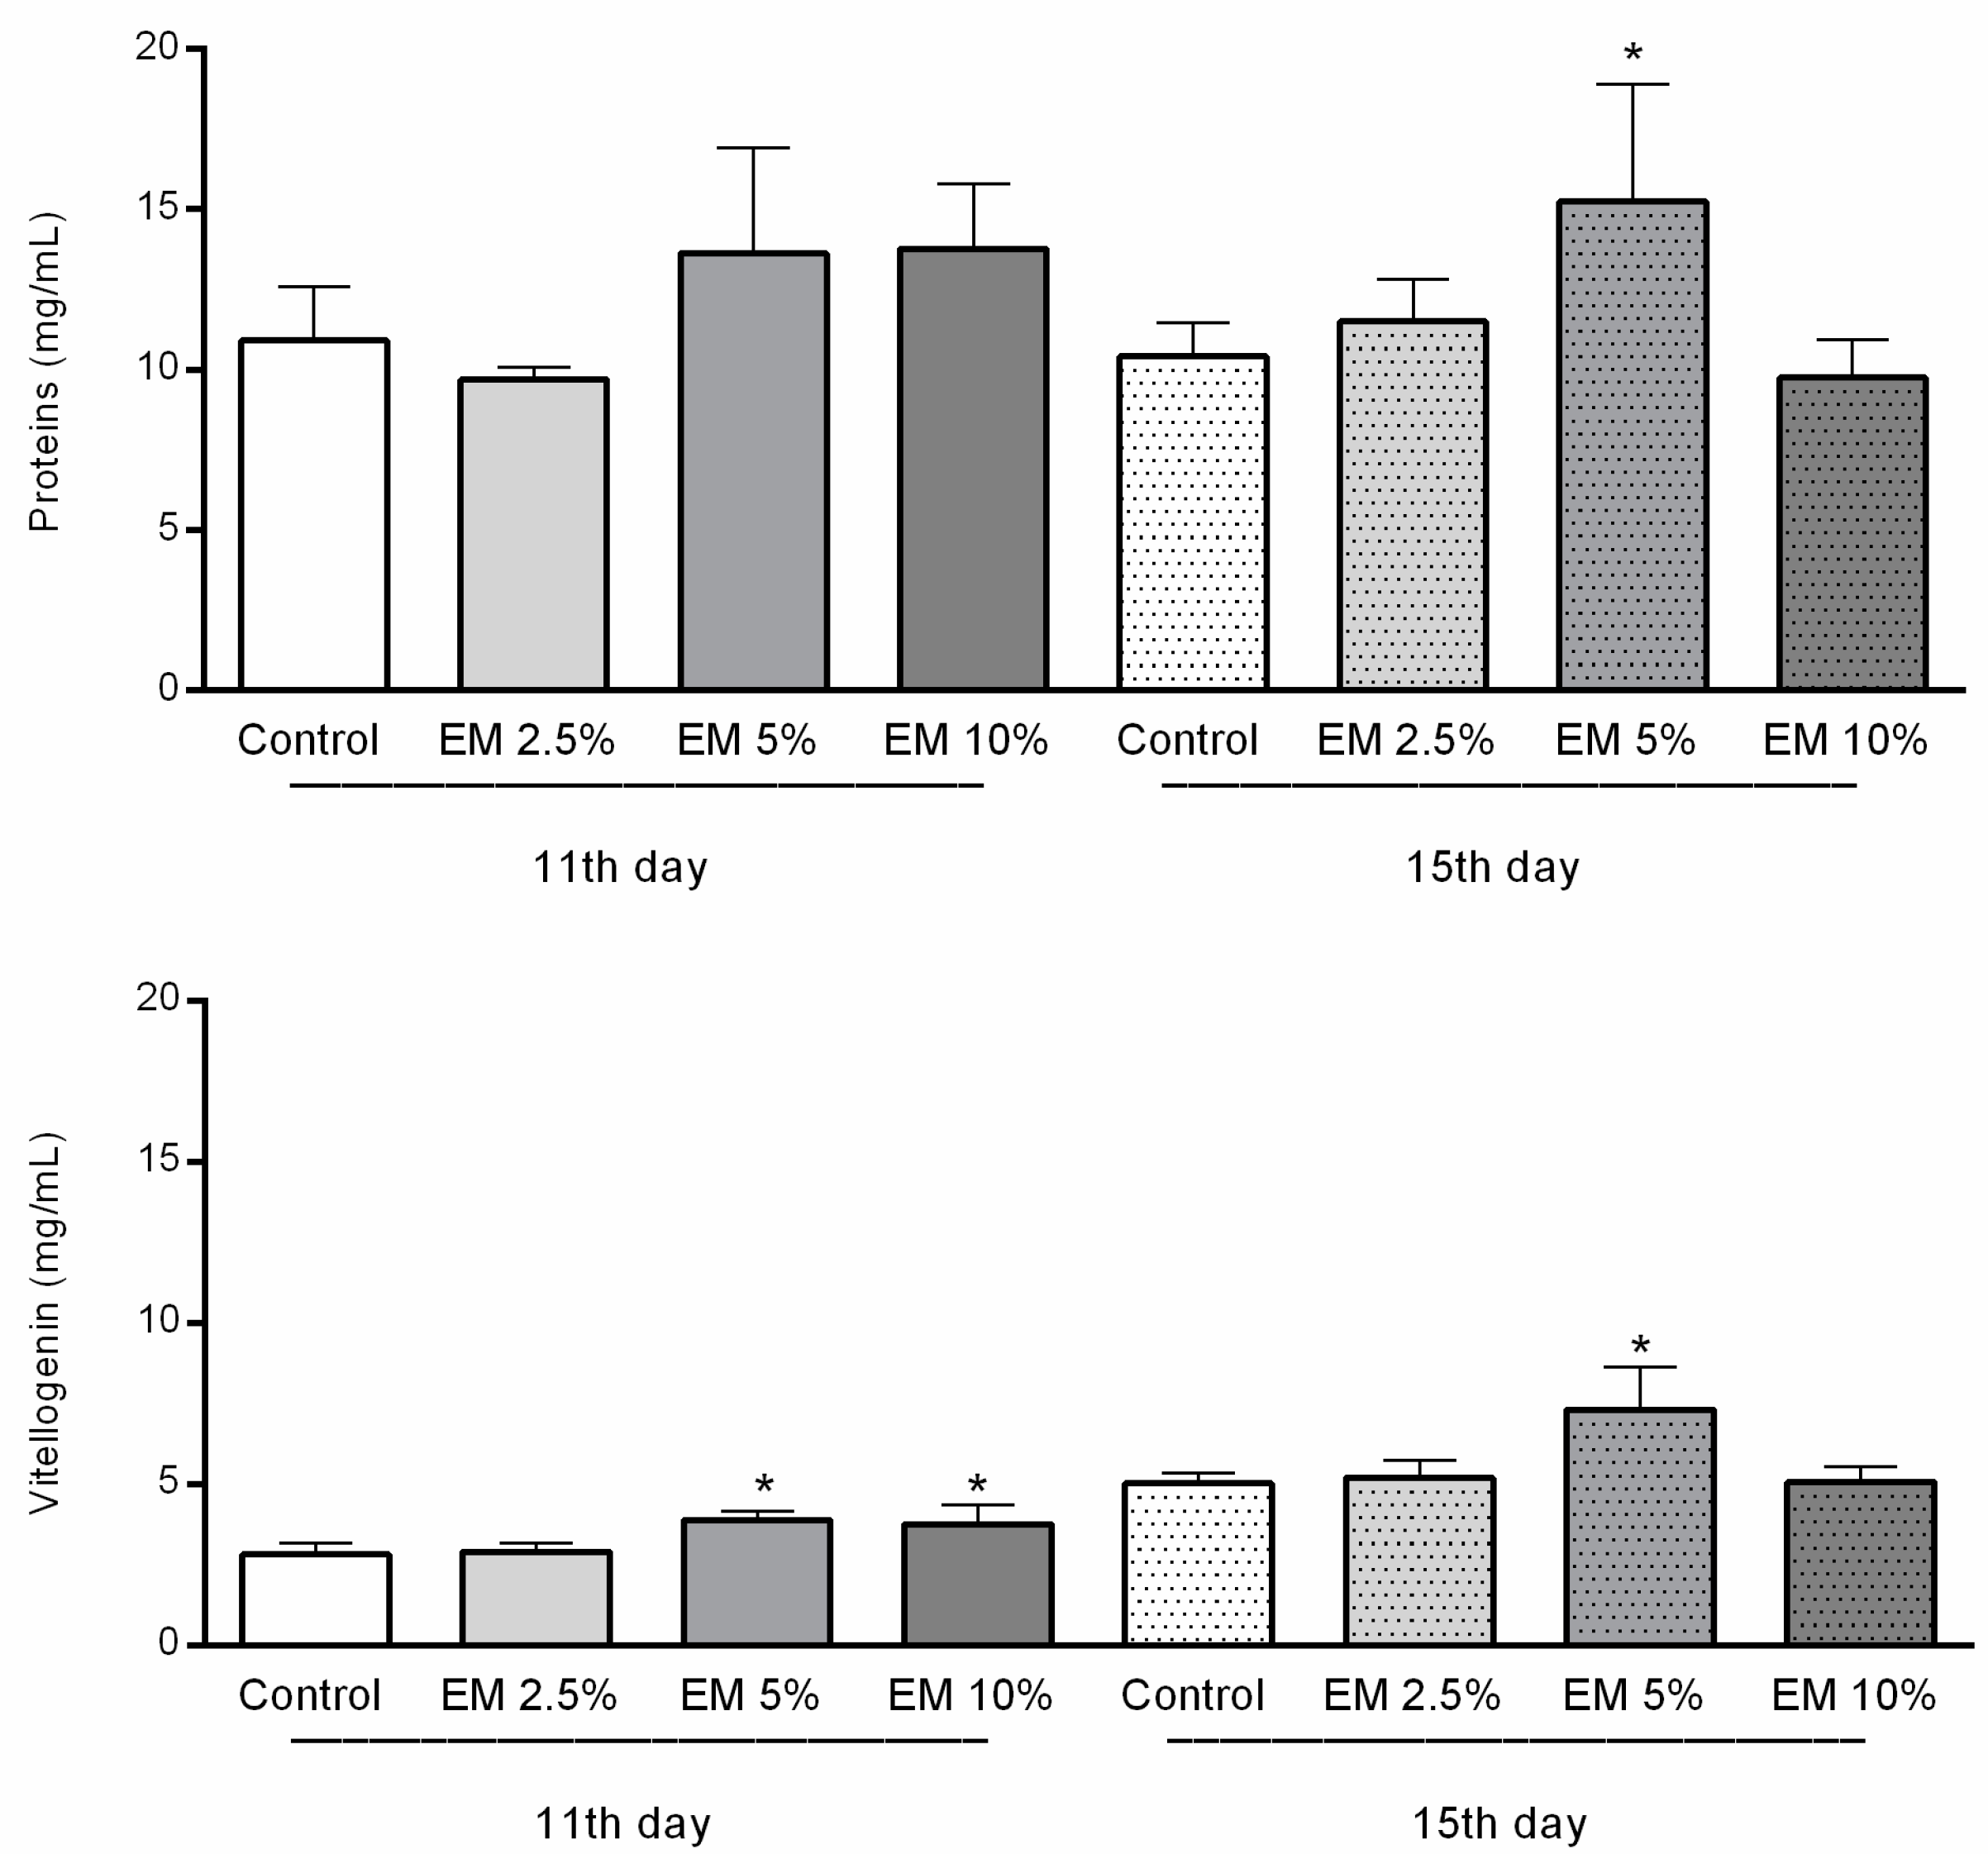
Concentrations of Total Proteins and Vitellogenin in Hemolymph
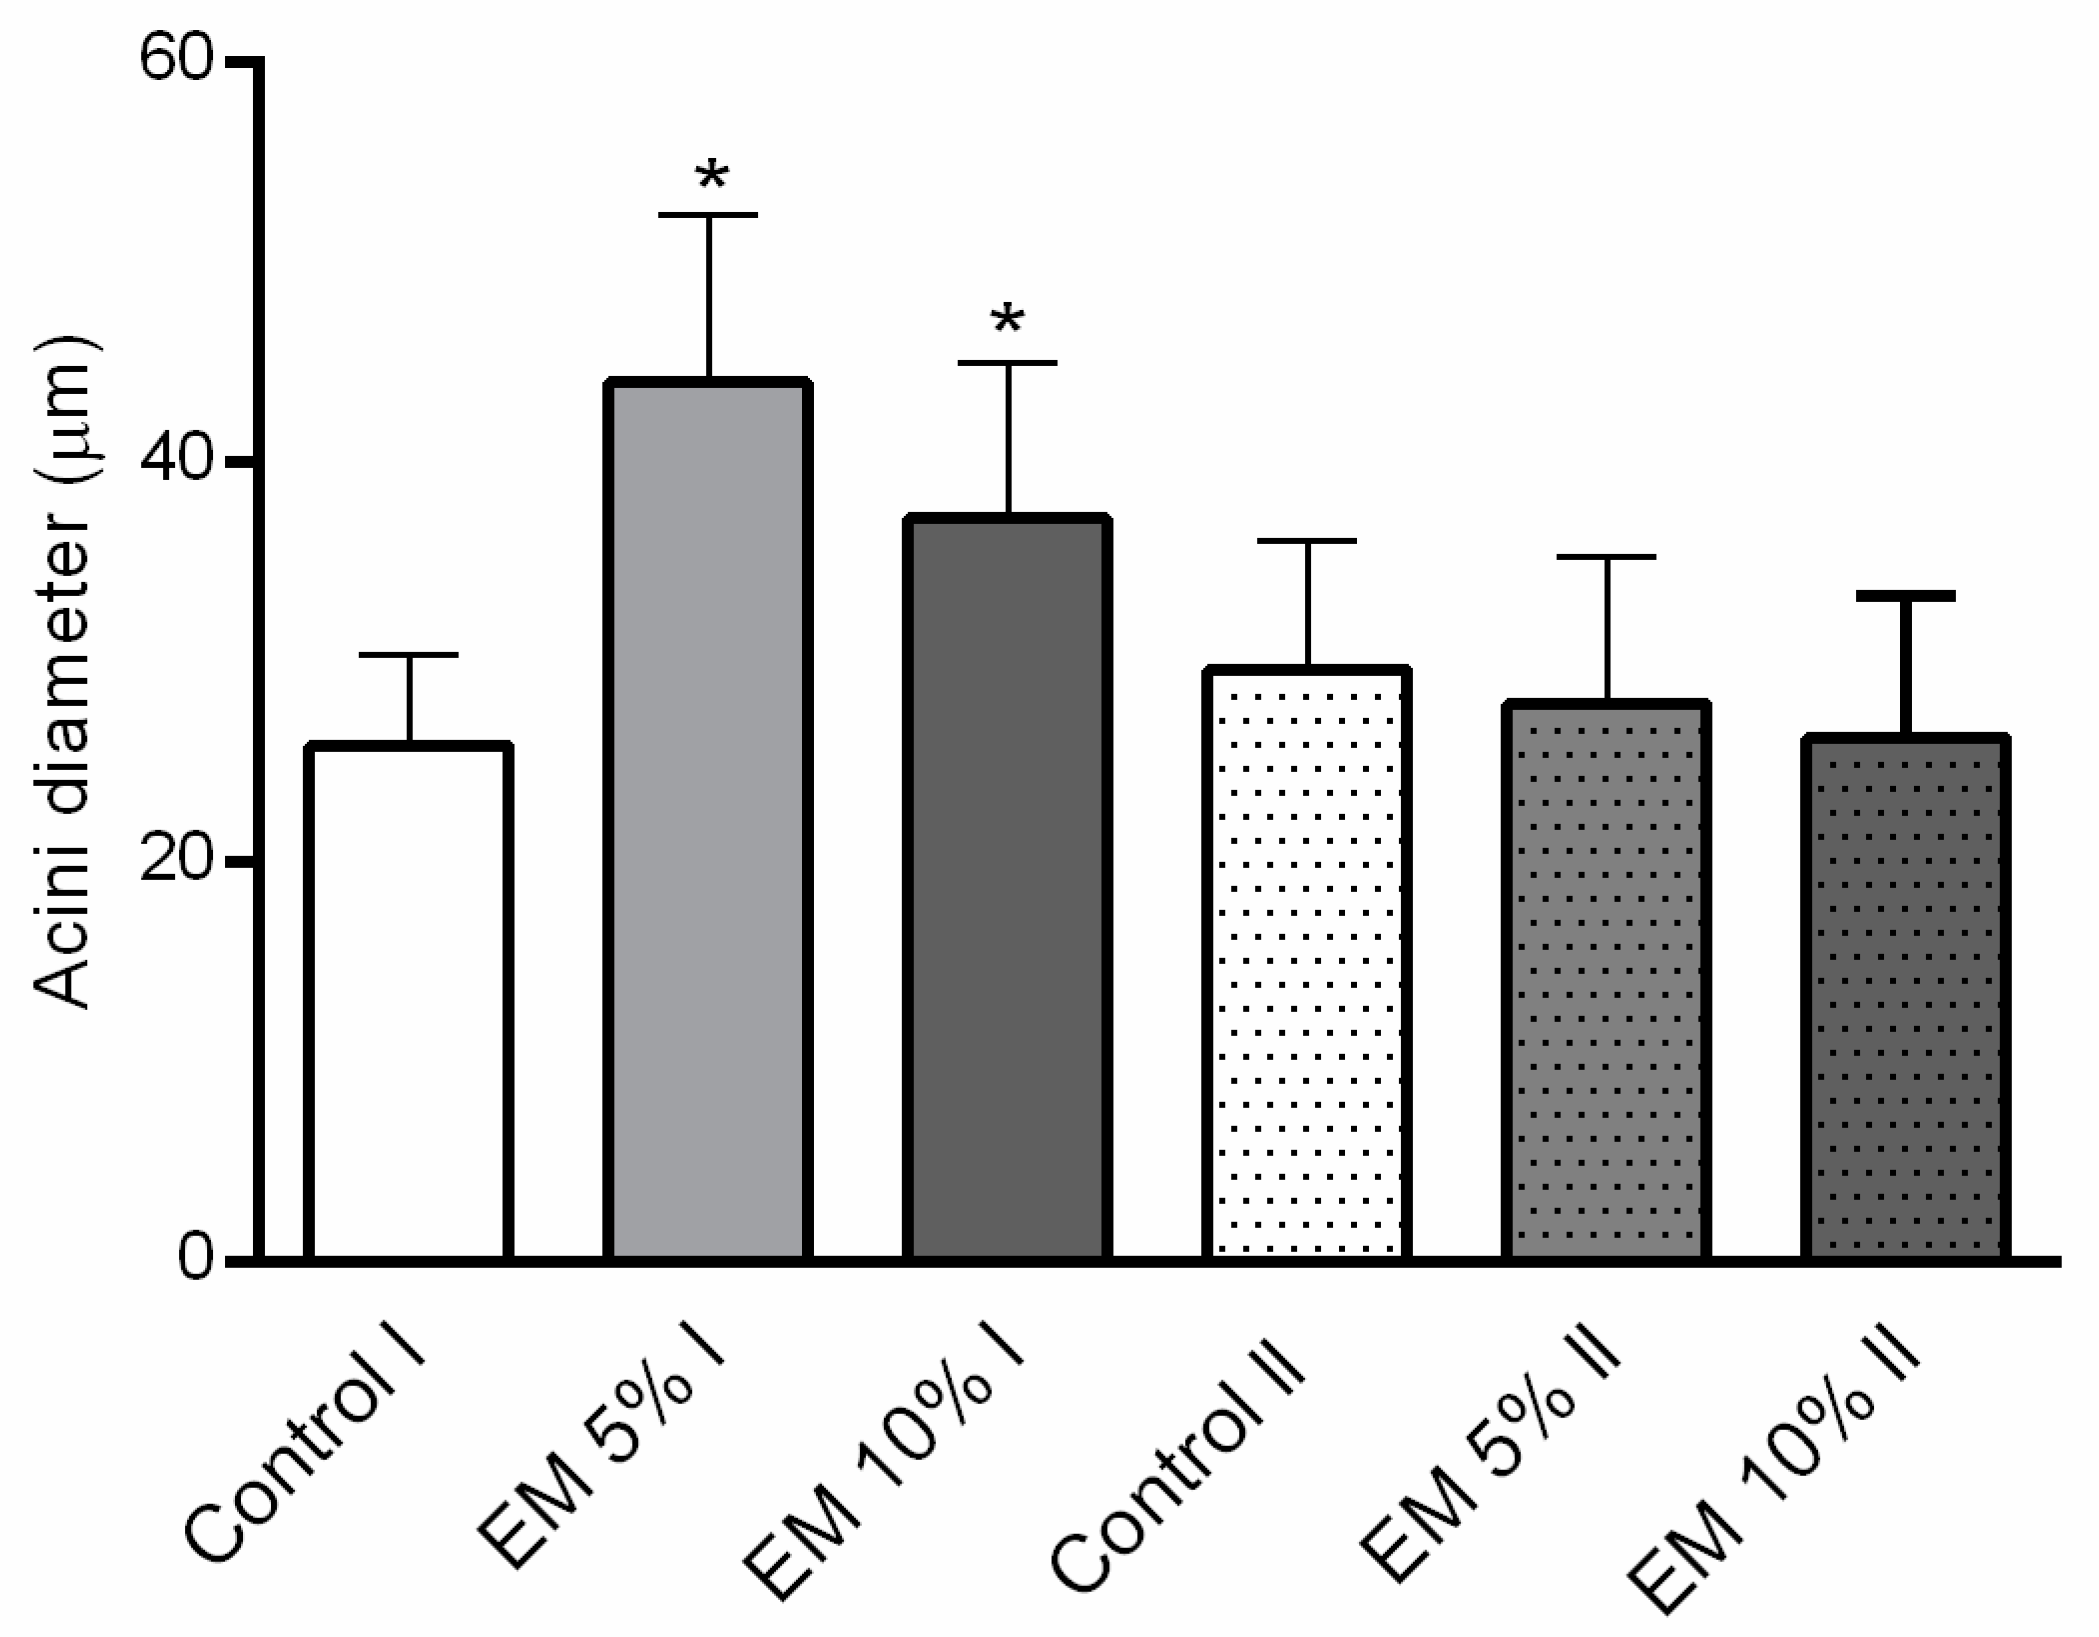
Hypopharyngeal Gland Size
2.3. Statistical Analyses
3. Results
3.1. Strength of Honey Bee Colonies
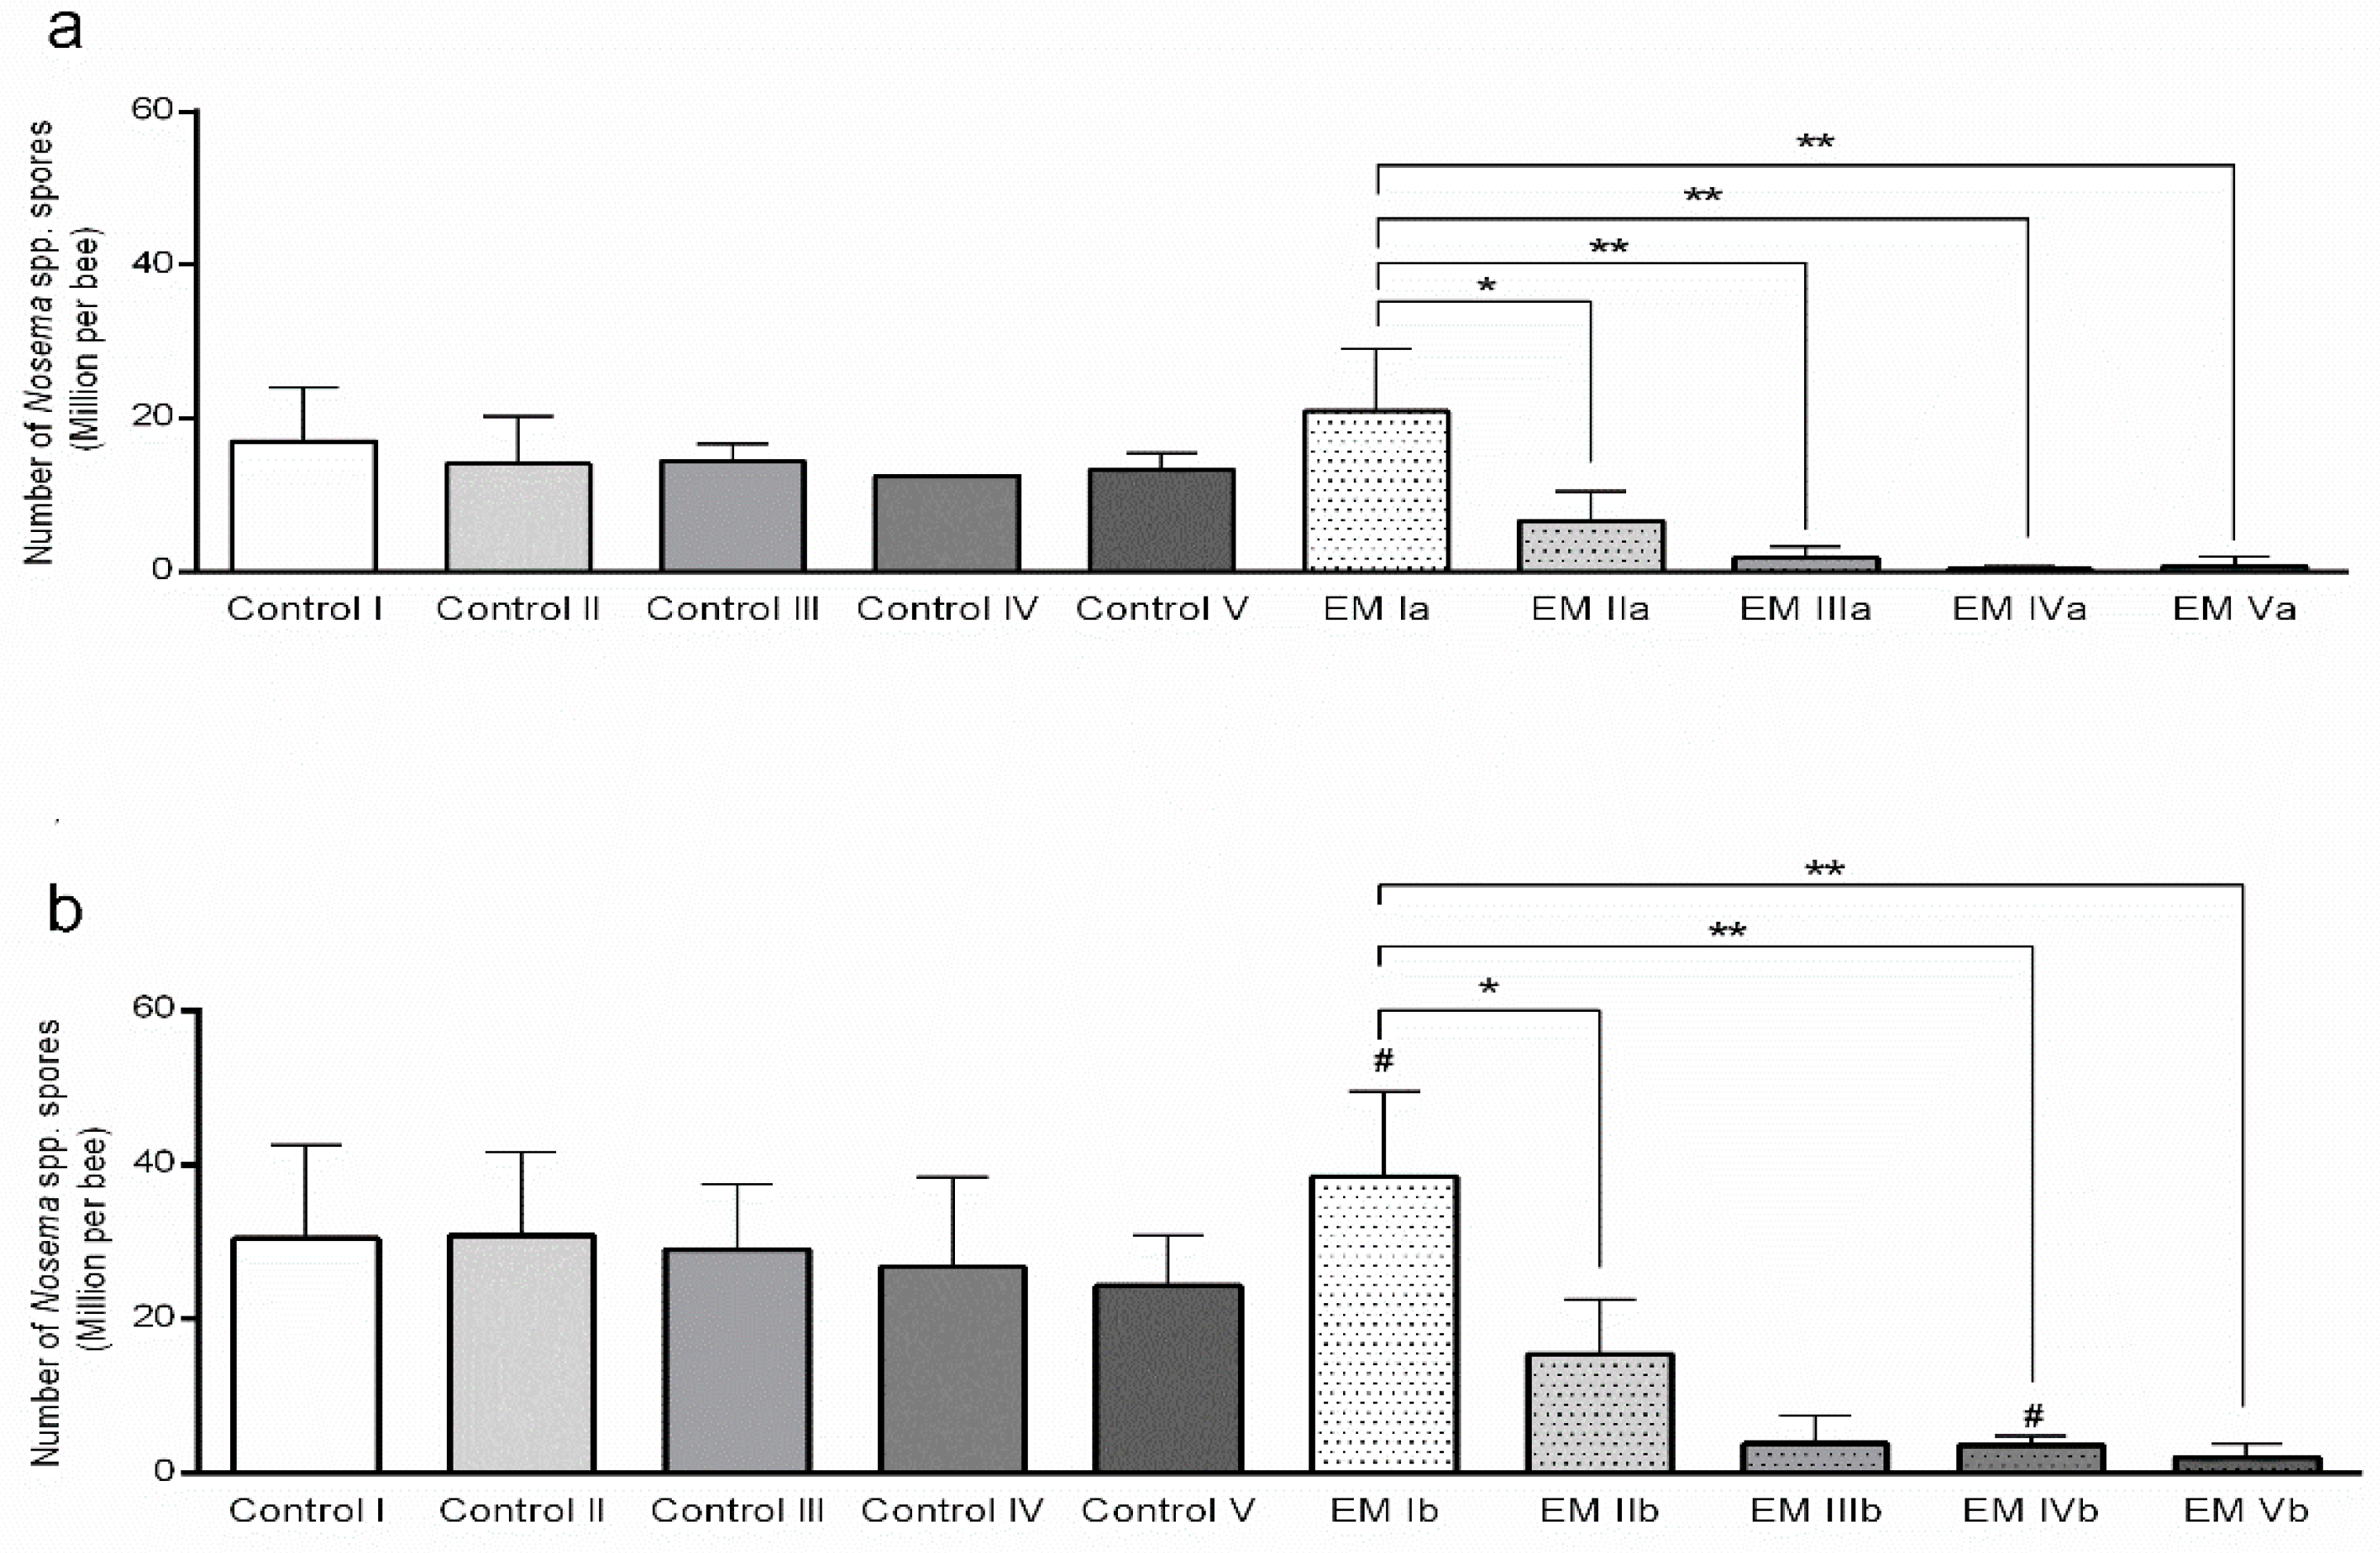
3.2. Estimation of Nosema spp. Infection Levels
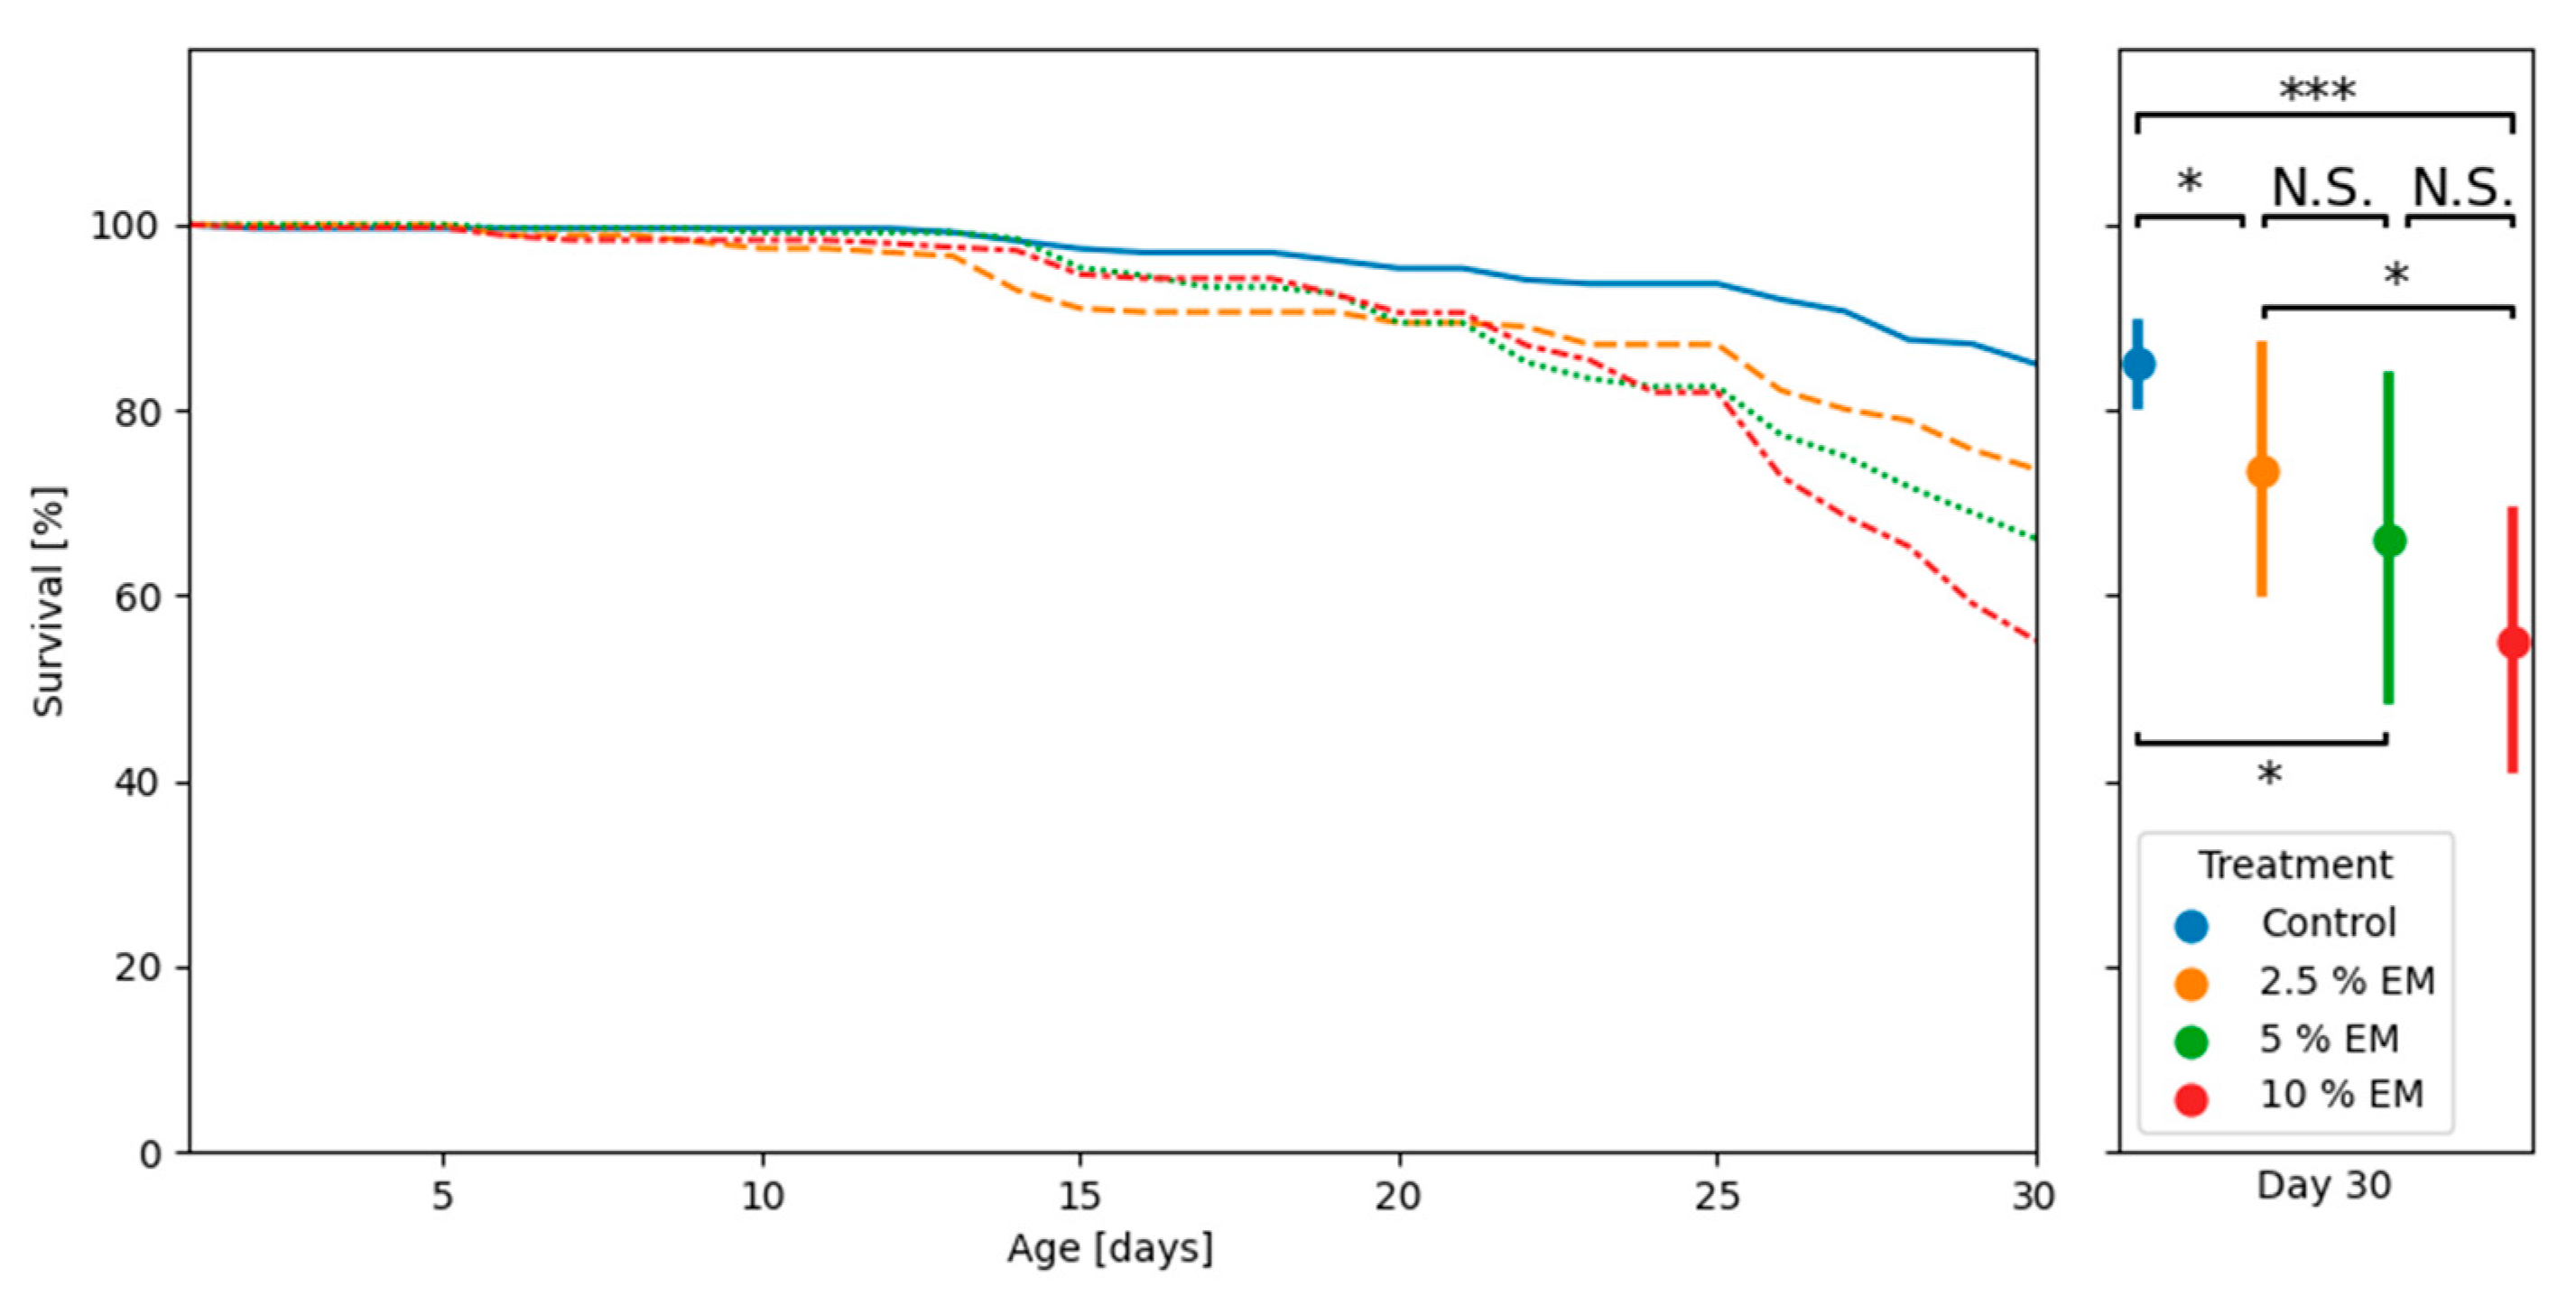
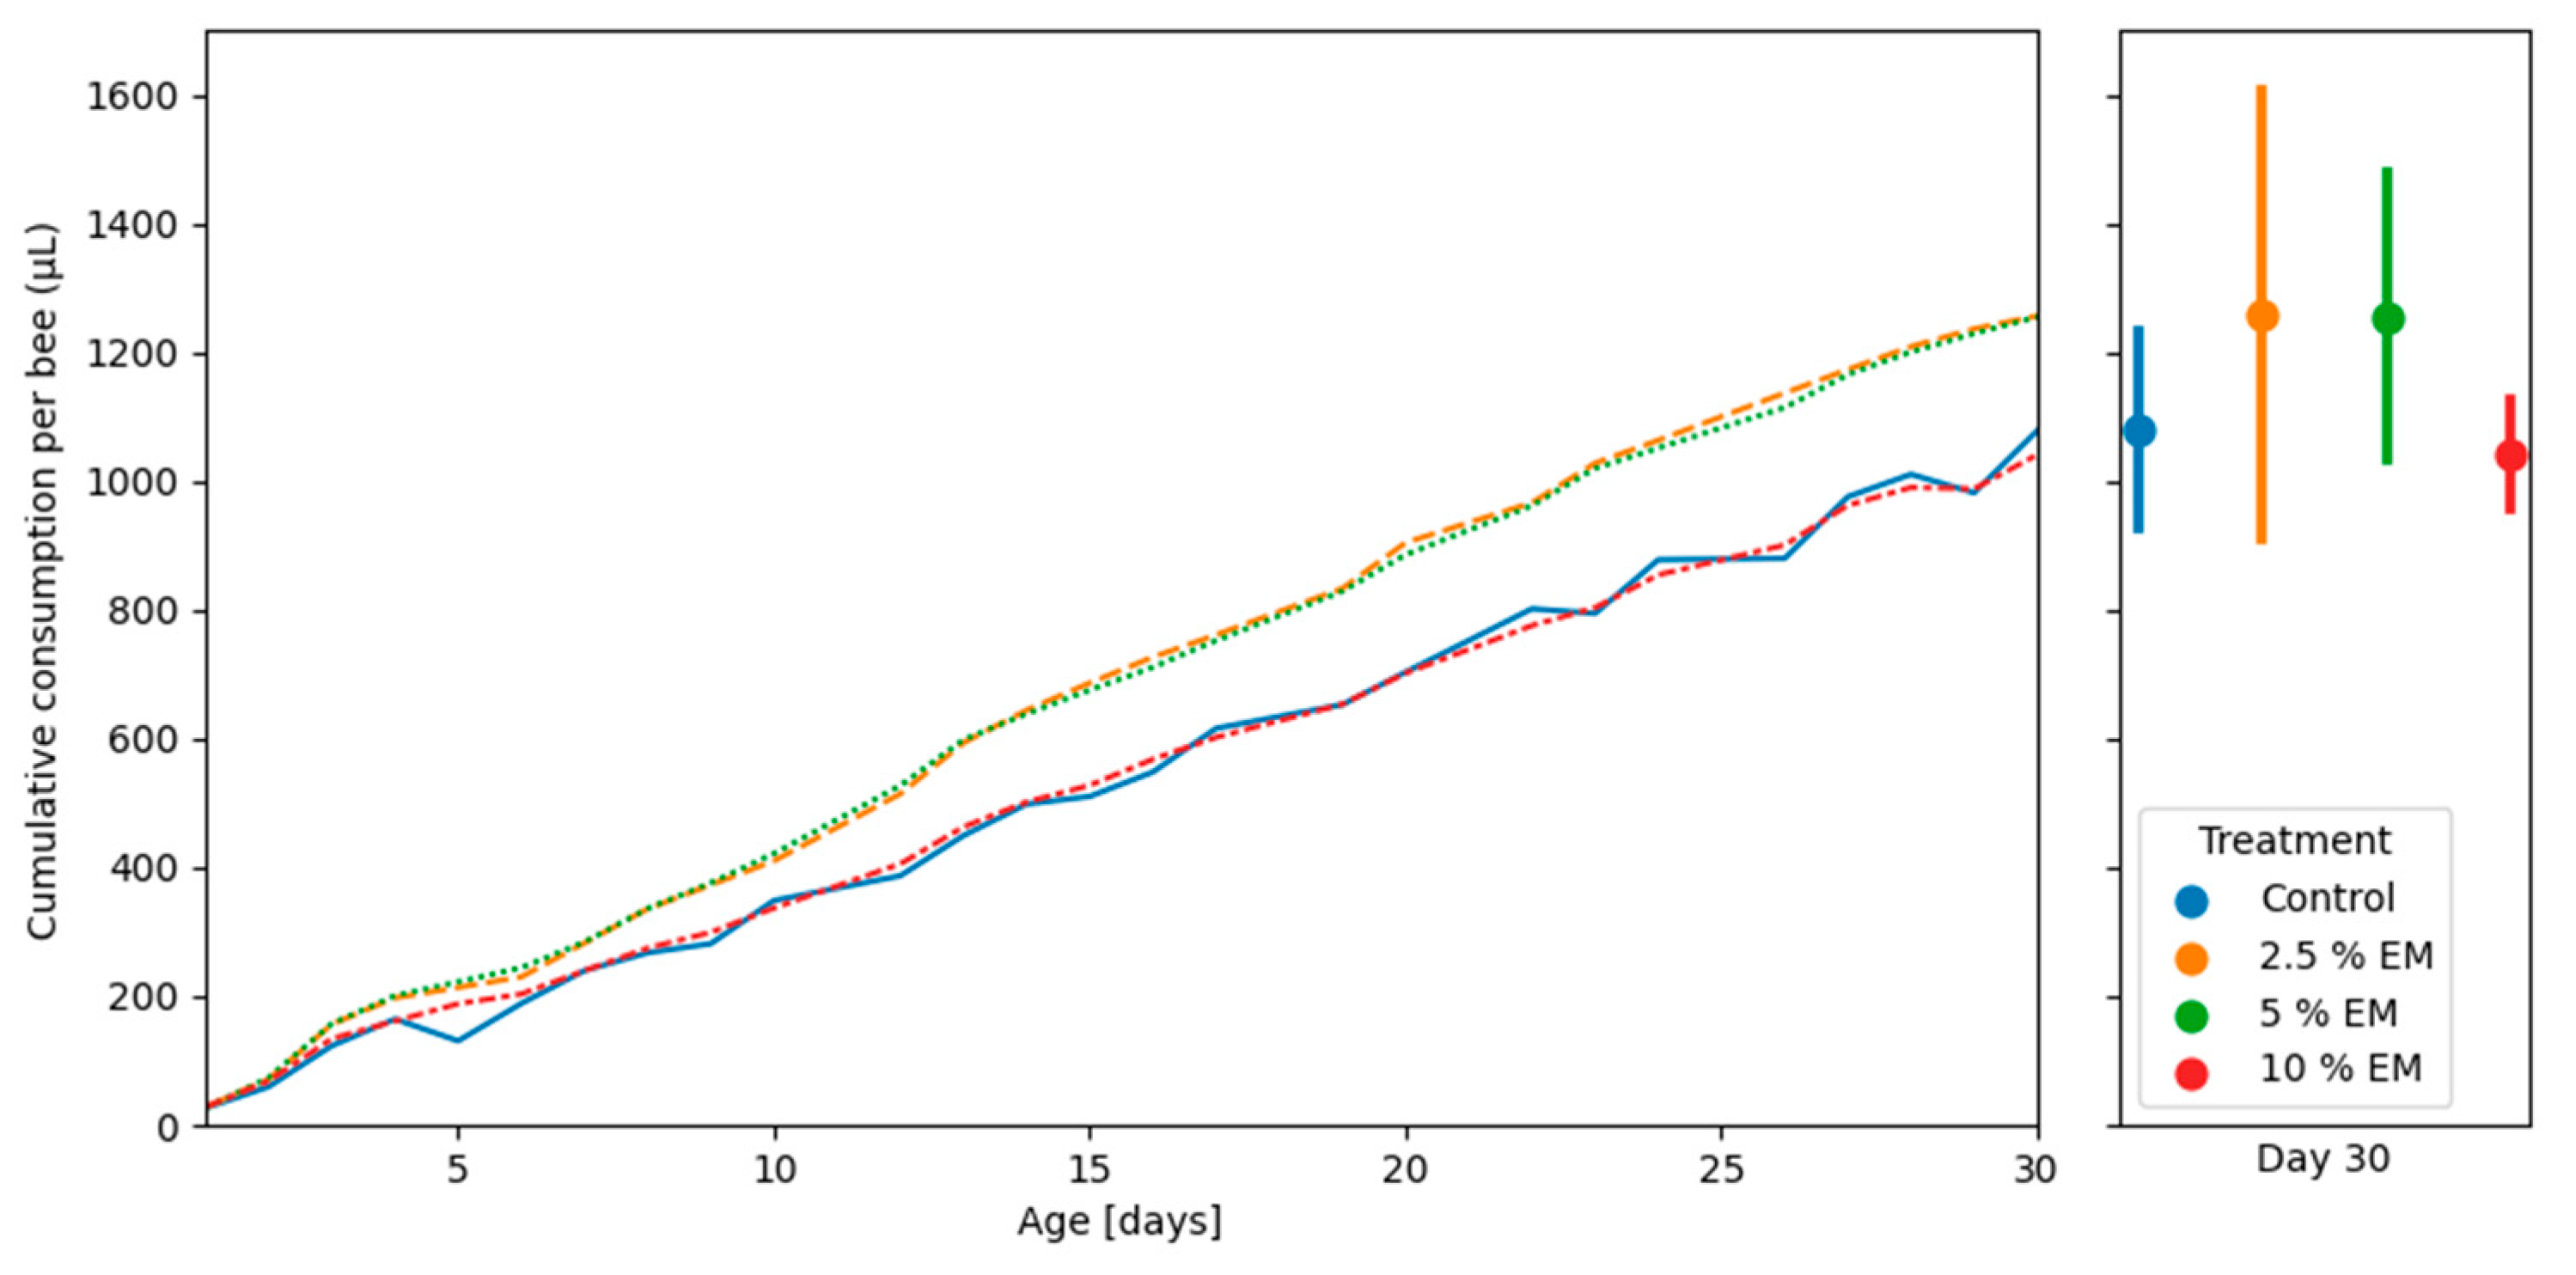
3.3. Adult Bees’ Mortality and Consumption of Diets
3.4. Biochemical Parameters
3.5. Immunological Parameters
3.6. Effect of EM Supplementary Nutrition Regime on Hypopharyngeal Gland Size
4. Discussion
5. Conclusions
Author Contributions
Funding
Acknowledgments
Conflicts of Interest
References
- Cameron, S.A.; Lozier, J.D.; Strange, J.P.; Koch, J.B.; Cordes, N.; Solter, L.F.; Griswold, T.L. Patterns of widespread decline in North American bumble bees. Proc. Natl. Acad. Sci. USA 2011, 108, 662–667. [Google Scholar] [CrossRef] [PubMed] [Green Version]
- Potts, S.G.; Biesmeijer, J.C.; Kremen, C.; Neumann, P.; Schweiger, O.; Kunin, W.E. Global pollinator declines: Trends, impacts and drivers. Trends Ecol. Evol. 2010, 25, 345–353. [Google Scholar] [CrossRef] [PubMed]
- Smith, K.M.; Loh, E.H.; Rostal, M.K.; Zambrana-Torrelio, C.M.; Mendiola, L.; Daszak, P. Pathogens, Pests, and Economics: Drivers of Honey Bee Colony Declines and Losses. EcoHealth 2013, 10, 434–445. [Google Scholar] [CrossRef] [PubMed]
- Klein, A.M.; Vaissiere, B.E.; Cane, J.H.; Steffan-Dewenter, I.; Cunningham, S.A.; Kremen, C.; Tscharntke, T. Importance of pollinators in changing landscapes for world crops. Proc. R. Soc. B Biol. Sci. 2007, 274, 303–313. [Google Scholar] [CrossRef] [Green Version]
- Fontaine, C.; Dajoz, I.; Meriguet, J.; Loreau, M. Functional Diversity of Plant–Pollinator Interaction Webs Enhances the Persistence of Plant Communities. PLoS Biol. 2006, 4, e1. [Google Scholar] [CrossRef]
- Rollin, O.; Benelli, G.; Benvenuti, S.; Decourtye, A.; Wratten, S.D.; Canale, A.; Desneux, N. Weed-insect pollinator networks as bioindicators of ecological sustainability in agriculture. A review. Agron. Sustain. Dev. 2016, 36, 8. [Google Scholar] [CrossRef] [Green Version]
- Genersch, E. Honey bee pathology: Current threats to honey bees and beekeeping. Appl. Microbiol. BioTechnol. 2010, 87, 87–97. [Google Scholar] [CrossRef]
- Sandrock, C.; Tanadini, M.; Tanadini, L.G.; Fauser-Misslin, A.; Potts, S.G.; Neumann, P. Impact of chronic neonicotinoid exposure on honeybee colony performance and queen supersedure. PLoS ONE 2014, 9, e103592. [Google Scholar] [CrossRef] [Green Version]
- Godfray, H.C.; Blacquiere, T.; Field, L.M.; Hails, R.S.; Petrokofsky, G.; Potts, S.G.; Raine, N.E.; Vanbergen, A.J.; McLean, A.R. A restatement of the natural science evidence base concerning neonicotinoid insecticides and insect pollinators. Proc. R. Soc. B 2014, 281, 20140558. [Google Scholar] [CrossRef] [Green Version]
- Goulson, D.; Nicholls, E.; Botías, C.; Rotheray, E.L. Bee declines driven by combined stress from parasites, pesticides, and lack of flowers. Science 2015, 347, 6229. [Google Scholar] [CrossRef]
- Tlak Gajger, I.; Sakač, M.; Gregorc, A. Impact of Thiamethoxam on Honey Bee Queen (Apis mellifera carnica) Reproductive Morphology and Physiology. Bull. Environ. Contam. Toxicol. 2017, 99, 297–302. [Google Scholar] [CrossRef] [PubMed]
- Alaux, C.; Brunet, J.L.; Dussaubat, C.; Mondet, F.; Tchamitchan, S.; Cousin, M.; Brillard, J.; Baldy, A.; Belzunces, L.P.; Le Conte, Y. Interactions between Nosema microspores and a neonicotinoid weaken honeybees (Apis mellifera). Environ. Microbiol. 2010, 12, 774–782. [Google Scholar] [CrossRef] [PubMed] [Green Version]
- Di Pasquale, G.; Salignon, M.; Le Conte, Y.; Belzunces, L.P.; Decourtye, A.; Kretzschmar, A.; Suchail, S.; Brunet, J.-L.; Alaux, C. Influence of Pollen Nutrition on Honey Bee Health: Do Pollen Quality and Diversity Matter? PLoS ONE 2013, 8, e72016. [Google Scholar] [CrossRef] [PubMed] [Green Version]
- Gilioli, G.; Sperandio, G.; Hatjina, F.; Simonetto, A. Towards the development of an index for the holistic assessment of the health status of a honey bee colony. Ecol. Indic. 2019, 101, 341–347. [Google Scholar] [CrossRef]
- Sperandio, G.; Simonetto, A.; Carnesecchi, E.; Costa, C.; Hatjina, F.; Tosi, S.; Gilioli, G. Beekeeping and honey bee colony health: A review and conceptualization of beekeeping management practices implemented in Europe. Sci. Total Environ. 2019, 696, 133795. [Google Scholar] [CrossRef]
- Becher, M.A.; Osborne, J.L.; Thorbeck, P.; Kennedy, P.J.; Grimm, V. Towards a systems approach for understanding honeybee decline: A stocktaking and synthesis of existing models. J. Appl. Ecol. 2013, 50, 868–880. [Google Scholar] [CrossRef] [Green Version]
- Hroncova, Z.; Havlik, J.; Killer, J.; Doskocil, I.; Tyl, J.; Kamler, M.; Titera, D.; Hakl, J.; Mrazek, J.; Bunesova, V.; et al. Variation in Honey Bee Gut Microbial Diversity Affected by Ontogenetic Stage, Age and Geographic Location. PLoS ONE 2015, 10, e0118707. [Google Scholar] [CrossRef] [Green Version]
- Raymann, K.; Moran, N.A. The role of the gut microbiome in health and disease of adult honey bee workers. Curr. Opin. Insect. Sci. 2018, 26, 97–104. [Google Scholar] [CrossRef]
- Maes, P.W.; Rodrigues, P.A.P.; Oliver, R.; Mott, B.M.; Anderson, K.E. Diet-related gut bacterial dysbiosis correlates with impaired development, increased mortality and Nosema disease in the honeybee (Apis mellifera). Mol. Ecol. 2016, 25, 5439–5450. [Google Scholar] [CrossRef]
- Anderson, K.E.; Ricigliano, V.A. Honey bee gut dysbiosis: A novel context of disease ecology. Curr. Opin. Insect Sci. 2017, 22, 125–132. [Google Scholar] [CrossRef]
- Morimoto, T.; Kojima, Y.; Toki, T.; Komeda, Y.; Yoshiyama, M.; Kimura, K.; Nirasawa, K.; Kadowaki, T. The habitat disruption induces immune-suppression and oxidative stress in honey bees. Ecol. Evol. 2011, 1, 201–217. [Google Scholar] [CrossRef] [PubMed]
- Powell, J.E.; Martinson, V.G.; Urban-Mead, K.; Moran, N.A. Routes of Acquisition of the Gut Microbiota of the Honey Bee Apis mellifera. Appl. Environ. Microbiol. 2014, 80, 7378–7387. [Google Scholar] [CrossRef] [PubMed] [Green Version]
- Engel, P.; Bartlett, K.D.; Moran, N.A. The bacterium Frischella perrara causes scab formation in the gut of its honeybee host. MBio 2015, 6, e00193-15. [Google Scholar] [CrossRef] [PubMed] [Green Version]
- Kwong, W.K.; Medina, L.A.; Koch, H.; Sing, K.-W.; Soh, E.J.Y.; Ascher, J.S. Dynamic microbiome evolution in social bees. Sci. Adv. 2017, 3, e1600513. [Google Scholar] [CrossRef] [PubMed] [Green Version]
- Palmer-Young, E.C.; Raffel, T.R.; McFrederick, Q.S. pH-mediated inhibition of a bumble bee parasite by an intestinal symbiont. Parasitology 2019, 146, 380–388. [Google Scholar] [CrossRef]
- Emery, O.; Schmidt, K.; Engel, P. Immune system stimulation by the gut symbiont Frischella perrara in the honey bee (Apis mellifera). Mol. Ecol. 2017, 26, 2576–2590. [Google Scholar] [CrossRef]
- Lee, F.J.; Rusch, D.B.; Stewart, F.J.; Mattila, H.R.; Newton, I.L.G. Saccharide breakdown and fermentation by the honey bee gut microbiome. Environ. Microbiol. 2015, 17, 796–815. [Google Scholar] [CrossRef]
- Zheng, H.; Powell, J.E.; Steele, M.I.; Dietrich, C.; Moran, N.A. Honeybee gut microbiota promotes host weight gain via bacterial metabolism and hormonal signaling. Proc. Natl. Acad. Sci. USA 2017, 114, 4775–4780. [Google Scholar] [CrossRef] [Green Version]
- Corby-Harris, V.; Maes, P.; Anderson, K.E. The bacterial communities associated with honey bee (Apis mellifera) foragers. PLoS ONE 2014, 9, e95056. [Google Scholar] [CrossRef] [Green Version]
- Pătruică, S.; Mot, D. The effect of using prebiotic and probiotic products on intestinal micro-flora of the honeybee (Apis mellifera carpatica). Bull. Entomol. Res. 2012, 102, 619–623. [Google Scholar] [CrossRef]
- Pătruică, S.; Dumitrescu, G.; Stancu, A.; Bura, M.; Dunea, I.B. The Effect of Prebiotic and Probiotic Feed Supplementation on the Wax Glands of Worker Bees (Apis Mellifera). Anim. Sci. Biotechnol. 2012, 45, 268–271. [Google Scholar]
- Pătruică, S.; Hutu, I. Economic benefits of using prebiotic and probiotic products as supplements in stimulation feeds administered to bee colonies. Turk. J. Vet. Anim. Sci. 2013, 37, 259–263. [Google Scholar]
- Andrearczyk, S.; Kadhim, M.J.; Knaga, S. Influence of a probiotic on mortality, sugar syrup ingestion and infection of honeybees with Nosema spp. under laboratory assessment. Med. Weter. 2014, 70, 762–765. [Google Scholar]
- Arredondo, D.; Castelli, L.; Porrini, M.P.; Garrido, P.M.; Eguaras, M.J.; Zunino, P.; Antunez, K. Lactobacillus kunkeei strains decreased the infection by honey bee pathogens Paenibacillus larvae and Nosema ceranae. Benef. Microbes 2018, 9, 279–290. [Google Scholar] [CrossRef]
- Ptaszyńska, A.A.; Borsuk, G.; Mułenko, W.; Wilk, J. Impact of vertebrate probiotics on honeybee yeast microbiota and on the course of nosemosis. Med. Weter. 2016, 72, 430–434. [Google Scholar] [CrossRef]
- Daisley, B.A.; Pitek, A.P.; Chmiel, J.A.; Al, K.F.; Chernyshova, A.M.; Faragalla, K.M.; Burton, J.P.; Thompson, G.J.; Reid, J. Novel probiotic approach to counter Paenibacillus larvae infection in honey bees. ISME J. 2020, 14, 476–491. [Google Scholar] [CrossRef] [Green Version]
- Stephan, J.G.; Lamei, S.; Pettis, J.S.; Riesbeck, K.; De Miranda, J.R.; Forsgren, E. Honeybee-specific lactic acid bacterium supplements have no effect on American Foulbrood-infected honeybee colonies. Appl. Environ. Microbiol. 2019, 85, e00606-19. [Google Scholar] [CrossRef] [Green Version]
- Baffoni, L.; Gaggìa, F.; Alberoni, D.; Cabbri, R.; Nanetti, A.; Biavati, B.; Di Gioia, D. Effect of dietary supplementation of Bifidobacterium and Lactobacillus strains in Apis mellifera L. against Nosema ceranae. Benef. Microbes 2016, 7, 45–51. [Google Scholar] [CrossRef]
- Paxton, R.J. Does infection by Nosema ceranae cause “Colony Collapse Disorder” in honeybees (Apis mellifera). J. Apic. Res. 2010, 49, 80–84. [Google Scholar] [CrossRef]
- Higes, M.; Meana, A.; Bartolome, C.; Botias, C.; Martin-Hernandez, R. Nosema ceranae (Microsporidia), a controversial 21st century honeybee pathogen. Environ. Microbiol. Rep. 2013, 5, 17–29. [Google Scholar] [CrossRef]
- Mayack, C.; Naug, D. Energetic stress in the honey bee Apis mellifera from Nosema ceranae infection. J. Invertebrat. Pathol. 2009, 100, 185–188. [Google Scholar] [CrossRef] [PubMed]
- Botías, C.; Martin-Hernandez, R.; Meana, A.; Higes, M. Screening alternative therapies to control Nosemosis type C in honey bee (Apis mellifera iberiensis) colonies. Res. Vet. Sci. 2013, 95, 1041–1045. [Google Scholar] [CrossRef] [PubMed]
- Dussaubat, C.; Brunet, J.-L.; Higes, M.; Colbourne, J.K.; López, J.; Choi, J.-H.; Martin-Hernandez, R.; Botías, C.; Cousin, M.; Mcdonnell, C.; et al. Gut pathology and responses to the microsporidium Nosema ceranae in the honey bee Apis mellifera. PLoS ONE 2012, 7, e37017. [Google Scholar] [CrossRef] [Green Version]
- Holt, H.L.; Aronstein, K.A.; Grozinger, C.M. Chronic parasitization by Nosema microsporidian causes global expression changes in core nutritional, metabolic and behavioral pathways in honey bee workers (Apis mellifera). BMC Genom. 2013, 14, 799. [Google Scholar] [CrossRef] [PubMed] [Green Version]
- Higes, M.; Nozal, M.J.; Alvaro, A.; Barrios, L.; Meana, A.; Martín-Hernández, R.; Bernal, J.L.; Bernal, J. The stability and effectiveness of fumagillin in controlling Nosema ceranae (Microsporidia) infection in honey bees (Apis mellifera) under laboratory and field conditions. Apidologie 2011, 42, 364–377. [Google Scholar] [CrossRef] [Green Version]
- Huang, W.-F.; Solter, L.F.; Yau, P.M.; Imai, B.S. Nosema ceranae escapes fumagillin control in honey bees. PLoS Pathog. 2013, 9, e1003185. [Google Scholar] [CrossRef] [Green Version]
- Delaplane, K.S.; Van Der Steen, J.; Guzman-Novoa, E. Standard methods for estimating strength parameters of Apis mellifera colonies. J. Apic. Res. 2013, 52, 1–12. [Google Scholar] [CrossRef]
- OIE—Office International des Epizooties. Chapter 2.2.4., Nosemosis of Honey Bees. In Manual of Diagnostic Tests and Vaccines for Terrestrial Animals; OIE: Pairs, France, 2013; Available online: http://www.oie.int/international-standard-setting/terrestrial-manual/access-online (accessed on 20 February 2020).
- Hartfelder, K.; Bitondi, M.M.G.; Brent, C.S.; Guidugli Lazzarini, K.R.; Simões, Z.L.P.; Stabentheiner, A.; Tanaka, E.D.; Wang, Y. Standard methods for physiology and biochemistry research in Apis mellifera. J. Apic. Res. 2013, 52, 1–48. [Google Scholar] [CrossRef] [Green Version]
- Zollner, E.; Kirs, I.K. Uber die quantitative Bestimmung yon Lipoiden (Mikromethode) mittels der vielen natiirliehen Lipoiden (allen bekannten Plasmalipoiden) gemeinsamen Sulfophosphovanillin-Reaktion. Z. Gesamte Exp. Med. 1962, 135, 545–561. [Google Scholar] [CrossRef]
- Romeis, B. Mikroskopische Technik; Oldenbourg Verlag: München-Wien, Germany, 1968; pp. 174–185. [Google Scholar]
- Pajuelo, A.G.; Torres, C.; Bermejo, F.J.O. Colony losses: A double-blind trial on the influence of supplementary protein nutrition and preventative treatment with fumagillin against Nosema ceranae. J. Apic. Res. 2008, 47, 84–86. [Google Scholar] [CrossRef]
- Saffari, A.; Keva, P.G.; Atkinson, J.L. Palatability and consumption of patty-formulated pollen and pollen substitutes and their effects on honeybee colony performance. J. Apic. Sci. 2010, 54, 63–71. [Google Scholar]
- Glavinic, U.; Stankovic, B.; Draskovic, V.; Stevanovic, J.; Petrovic, T.; Lakic, N.; Stanimirovic, Z. Dietary amino acid and vitamin complex protects honey bee from immunosuppression caused by Nosema ceranae. PLoS ONE 2017, 12, e0187726. [Google Scholar] [CrossRef]
- Ptaszyńska, A.A.; Borsuk, G.; Zdybicka-Barabas, A.; Cytryńska, M.; Malek, W. Are commercial probiotics and prebiotics effective in the treatment and prevention of honeybee nosemosis C? Parasitol. Res. 2016, 115, 397–406. [Google Scholar] [CrossRef] [PubMed] [Green Version]
- Tlak Gajger, I.; Vugrek, O.; Pinter, L.; Petrinec, Z. “Nozevit patties” treatment of honeybees (Apis mellifera) for the control of Nosema ceranae disease. Am. Bee J. 2009, 149, 1053–1056. [Google Scholar]
- Tlak Gajger, I.; Kozaric, Z.; Berta, D.; Nejedli, S.; Petrinec, Z. Effect of the herbal preparation Nozevit on the mid-gut structure of honeybees (Apis mellifera) infected with Nosema spp. spores. Vet. Med. 2011, 56, 343–350. [Google Scholar] [CrossRef] [Green Version]
- Audisio, M.C.; Benítez-Ahrendts, M.R. Lactobacillus johnsonii CRL1647, isolated from Apis mellifera L. bee-gut, exhibited a beneficial effect on honeybee colonies. Benef. Microbes 2011, 2, 29–34. [Google Scholar] [CrossRef]
- Sabate, D.C.; Cruz, M.S.; Benitez-Ahrendts, M.R.; Audisio, M.C. Beneficial effects of Bacillus subtilis subsp. subtilis Mori2, a honey-associated strain, on honeybee colony performance. Probiotics Antimicrob. Proteins. 2012, 4, 39–46. [Google Scholar] [CrossRef]
- Audisio, M.C.; Sabate, D.C.; Benitez-Ahrendts, M.R. Effect of Lactibacillus johansonii CRL1647 on different parameters of honeybee colonies and bacterial populations of the bee gut. Benef. Microbes 2015, 25, 1–10. [Google Scholar]
- Alberoni, D.; Baffoni, L.; Gaggìa, F.; Ryan, P.M.; Murphy, K.; Ross, P.R.; Stanton, C.; Di Gioia, D. Impact of beneficial bacteria supplementation on the gut microbiota, colony development and productivity of Apis mellifera L. Benef. Microbes 2018, 9269–9278. [Google Scholar] [CrossRef] [PubMed]
- Huang, S.K.; Ye, K.T.; Huang, W.F.; Ying, B.H.; Li, X.S.; Lin, H.; Li, J.H.; Chen, Y.P.; Li, J.L.; Bao, X.L.; et al. Influence of Feeding Type and Nosema ceranae Infection on the Gut Microbiota of Apis cerana Workers. mSystems 2018, 3, e00177-18. [Google Scholar] [CrossRef] [Green Version]
- Tlak Gajger, I. Nozevit aerosol application for Nosema ceranae disease treatment. Am. Bee J. 2011, 151, 1087–1090. [Google Scholar]
- Corby-Harris, V.; Snyder, L.; Meador, C.; Naldo, R.; Mott, B.; Andersom, K. Parasaccharibacter apium, gen. Nov., sp. Nov., improves honey bee (Hymenoptera: Apidae) resistance to Nosema. J. Econ. Entomol. 2016, 109, 537–543. [Google Scholar] [CrossRef] [Green Version]
- Audisio, M.C. Gram-positive bacteria with probiotic potential for the Apis mellifera L. honey bee: The experiance in the northwest of Argentina. Probiotics Antimicrob. Proteins. 2017, 9, 22–31. [Google Scholar] [CrossRef] [PubMed]
- Fanciotti, M.N.; Tejerina, M.; Benítez Ahrendts, M.; Audisio, M.C. Honey yield of different commercial apiaries treated with Lactobacillus salivarius A3iob, a new bee-probiotic strain. Benef. Microbes 2018, 9, 291–298. [Google Scholar] [CrossRef]
- Yoshiyama, M.; Wu, M.; Sugimura, Y.; Takaya, N.; Kimoto-Nira, H.; Suzuki, C. Inhibition of Paenibacillus larvae by lactic acid bacteria isolated from fermented materials. J. Invertebr. Pathol. 2013, 112, 62–67. [Google Scholar] [CrossRef]
- Goblirsch, M.; Huang, Z.Y.; Spivak, M. Physiological and Behavioral Changes in Honey Bees (Apis mellifera) Induced by Nosema ceranae Infection. PLoS ONE 2013, 8, e58165. [Google Scholar] [CrossRef]
- Laskowska, E.; Jarosz, L.; Grądzki, Z. Effect of Multi-Microbial Probiotic Formulation Bokashion Pro- and Anti-Inflammatory Cytokines Profilein the Serum, Colostrum and Milk of Sows, and in a Culture of Polymorphonuclear Cells Isolated from Colostrum. Probiotics Antimicrob. Proteins. 2019, 11, 220–232. [Google Scholar] [CrossRef] [Green Version]
- Pinoargote, G.; Flores, G.; Cooper, K.; Ravishankar, S. Effects on survival and bacterial community composition of the aquaculture water and gastrointestinal tract of shrimp (Litopenaeus vannamei) exposed to probiotic treatments after an induced infection of acute hepatopancreatic necrosis disease. Aquac. Res. 2018, 49, 1–19. [Google Scholar] [CrossRef] [Green Version]
- Rozaik, E.; Safwat, S. Growth Inhibition of Various Pathogenic Microorganisms Using Effective Microorganisms (EM). Int. J. Appl. Eng. Res. 2018, 4, 283–286. [Google Scholar] [CrossRef] [Green Version]
- Zaman, A.; Ahmed, M.; Gogoi, P. Effect of bokashi on plant growth, yield and essential oil quantity and quality in patchouli (Pogostemon Cablin Benth.). Biosci. Biotech. Res. Asia 2010, 7, 383–387. [Google Scholar]
- Olle, M.; Williams, I. The Influence of Effective Microorganisms on the Growth and Nitrate Content of Vegetable Transplants. J. Adv. Agric. Technol. 2015, 2, 1. [Google Scholar] [CrossRef]
- Maistrello, L.; Lodesani, M.; Costa, C.; Leonardi, F.; Marani, G.; Caldon, M.; Mutinelli, F.; Granato, A. Screening of natural compounds for the control of nosema disease in honeybees (Apis mellifera). Apidologie 2008, 39, 436–445. [Google Scholar] [CrossRef] [Green Version]
- Chakrabarti, P.; Lucas, H.M.; Sagili, R.R. Evaluating effects of a critical micronutritient (24-methylenecholesterol) on honeybee physiology. Ann. Entomol. Soc. Am. 2020, 113, 176–182. [Google Scholar] [CrossRef] [Green Version]
- Kunc, M.; Dobeš, P.; Hurychová, J.; Vojtek, L.; Poiani, S.B.; Danihlík, J.; Havlík, J.; Titěra, D.; Hyršl, P. The Year of the Honey Bee (Apis mellifera L.) with Respect to Its Physiology and Immunity: A Search for Biochemical Markers of Longevity. Insects 2019, 10, 244. [Google Scholar] [CrossRef] [Green Version]
- Cariveau, D.P.; Powell, J.E.; Koch, H.; Winfree, R.; Moran, N.A. Variation in gut microbial communities and its association with pathogen infection in wild bumble bees (Bombus). ISME J. 2014, 8, 2369–2379. [Google Scholar] [CrossRef]
- Engels, W.; Kaatz, H.; Zillikens, A.; Simões, Z.L.P.; Truve, A.; Engels, W.; Zillikens, M.C.; Truve, K. Honey bee reproduction: Vitellogenin and caste-specific regulation of fertility. In Advances in Invertebrate Reproduction; Hoshi, M., Yamashita, O., Eds.; Elsiever: Amsterdam, The Netherlands, 1990; pp. 495–502. [Google Scholar]
- Dainat, B.; Evans, J.D.; Chen, Y.P.; Gauthier, L.; Neumann, P. Predictive Markers of Honey Bee Colony Collapse. PLoS ONE 2012, 7, e32151. [Google Scholar] [CrossRef]
- Li, Z.; Zhang, S.; Liu, Q. Vitellogenin Functions as a Multivalent Pattern Recognition Receptor with an Opsonic Activity. PLoS ONE 2008, 3, e1940. [Google Scholar] [CrossRef] [PubMed] [Green Version]
- Evans, J.D.; Lopez, D.L. Bacterial Probiotics Induce an Immune Response in the Honey Bee (Hymenoptera: Apidae). J. Econ. Entomol. 2004, 97, 752–756. [Google Scholar] [CrossRef]
- Antúnez, K.; Martín-Hernández, R.; Prieto, L.; Meana, A.; Zunino, P.; Higes, M. Immune suppression in the honey bee (Apis mellifera) following infection by Nosema ceranae (Microsporidia). Environ. Microbiol. 2009, 11, 2284–2290. [Google Scholar] [CrossRef]
- Kešnerová, L.; Emery, O.; Troilo, M.; Liberti, J.; Erkosar, B.; Engel, P. Gut microbiota structure differs between honeybees in winter and summer. ISME J. 2020, 14, 801–814. [Google Scholar] [CrossRef] [Green Version]


© 2020 by the authors. Licensee MDPI, Basel, Switzerland. This article is an open access article distributed under the terms and conditions of the Creative Commons Attribution (CC BY) license (http://creativecommons.org/licenses/by/4.0/).
Share and Cite
Tlak Gajger, I.; Vlainić, J.; Šoštarić, P.; Prešern, J.; Bubnič, J.; Smodiš Škerl, M.I. Effects on Some Therapeutical, Biochemical, and Immunological Parameters of Honey Bee (Apis mellifera) Exposed to Probiotic Treatments, in Field and Laboratory Conditions. Insects 2020, 11, 638. https://doi.org/10.3390/insects11090638
Tlak Gajger I, Vlainić J, Šoštarić P, Prešern J, Bubnič J, Smodiš Škerl MI. Effects on Some Therapeutical, Biochemical, and Immunological Parameters of Honey Bee (Apis mellifera) Exposed to Probiotic Treatments, in Field and Laboratory Conditions. Insects. 2020; 11(9):638. https://doi.org/10.3390/insects11090638
Chicago/Turabian StyleTlak Gajger, Ivana, Josipa Vlainić, Petra Šoštarić, Janez Prešern, Jernej Bubnič, and Maja Ivana Smodiš Škerl. 2020. "Effects on Some Therapeutical, Biochemical, and Immunological Parameters of Honey Bee (Apis mellifera) Exposed to Probiotic Treatments, in Field and Laboratory Conditions" Insects 11, no. 9: 638. https://doi.org/10.3390/insects11090638