Article

Multi-Objective Optimization Design of Micro-Texture Parameters of Tool for Cutting GH4169 during Spray Cooling

Key Laboratory of Advanced Manufacturing Intelligent Technology, Ministry of Education, Harbin University of Science and Technology, Harbin 150080, China
*
Author to whom correspondence should be addressed.
Lubricants 2023, 11(6), 249; https://doi.org/10.3390/lubricants11060249
Submission received: 13 May 2023 / Revised: 27 May 2023 / Accepted: 28 May 2023 / Published: 6 June 2023
(This article belongs to the Special Issue Friction and Wear of Cutting Tools and Cutting Tool Materials)

Abstract

:
This study explores the performance of micro-textured tools when cutting GH4169 during spray cooling. First, the morphologies of the micro-textures were selected according to the simulation and experiments. Secondly, cutting experiments were carried out during spray cooling. As appropriate for each experiment, regression models of cutting force, cutting temperature, or tool wear area were established, and variance analysis was conducted. The cutting force, cutting temperature, and tool wear area functions were obtained from the respective regression models. Based on these functions, the micro-texture parameters were optimized using the response surface method with the cutting force, cutting temperature, and rake face wear area as the objectives. Finally, a full factor experiment on the micro-texture parameters was designed using Minitab, and cutting experiments were conducted using micro-textured tools with these parameters. Taking a relatively low cutting force, cutting temperature, and tool wear as the objectives, a genetic algorithm multi-objective optimization model for the micro-texture parameters of the tools was established, and the model was solved using the NSGA-II algorithm to obtain a Pareto solution set and micro-texture parameters with a good, comprehensive cutting performance. The micro-texture morphology and parameters obtained in this study can also be used for cutting other high-temperature alloy materials with similar properties to GH4169. This research method can also be used to optimize micro-textured tools for cutting other materials.

Graphical Abstract

1. Introduction

The nickel-based superalloy GH4169 has very stable physical and chemical properties, high creep resistance, and thermal stability [1,2]; however, due to its excellent performance, GH4169 is a material that is difficult to machine. In order to solve the problem of the difficult machining of GH4169, some scholars have started their research from the perspective of the cutting environment and applied different cooling and lubrication technologies, such as spray cooling [3], high-pressure cooling [4], liquid nitrogen cooling [5], and low-temperature cold [6], in the process of machining to obtain good machinability.
In recent years, with the continuous development of science and bionics technology, the method of machining micro-textures on the surface of tools to improve their cutting performance has been favored by most scholars. Additionally, these types of tools with micro-textures are collectively called “micro-textured tools”. The existence of micro-textures can effectively reduce the contact area between the tool and the chip being cut, thereby improving the cutting performance of the tool [7,8,9,10]. Moreover, when the tool is cutting in certain lubrication conditions, the advantages of the micro-texture will be more obvious.
Scholars at home and abroad have conducted extensive research on the morphologies, size parameters, and arrangements of the micro-textures of micro-textured tools.
Some scholars have studied micro-texture morphologies that are suitable for different workpiece materials. For instance, Ali, Shafahat et al. designed micro-textured tools with rectangular and triangular microgrooves for cutting stainless steel (AISI60), simulated and analyzed the performance of the two types of micro-texture shapes, and found that the rectangular microgroove-textured tools had a better performance [11]. Tu et al. used laser technology to machine micropits and microgrooves on the rake face of Al2O3/TiC ceramic tools. They studied the cutting performances of two types of micro-textured self-lubricating tools on hardened steel and compared them with traditional non-textured ceramic tools. The results indicated that the reduction in the cutting force of the micropit-textured tools was greater than that of the microgroove-textured tools [12]. Rajurkar, Avadhoot et al. analyzed the performance of two types of micro-textured tools for cutting chromium nickel iron alloy 718 in different cutting conditions. The results indicated that the microchannel-textured tools showed a notable improvement in tool life up to 60% over micro dimple-textured tools at lower cutting speeds; however, almost the same tool life was found with both tools at higher cutting speeds [13]. Sagar Dhage et al. designed micro-textures in different directions on an insert and used these micro-textured inserts to cut AISI 1045 in dry cutting conditions. From the measured cutting force, it was found that the cutting force of the insert with a micro-texture parallel to the cutting edge was significantly lower than that of the insert with a micro-texture perpendicular to the cutting edge [14].
Moreover, some scholars have also explored the influence of micro-texture parameters on the cutting performance of tools. Li Kun et al. used hard alloy micro-textured tools to conduct a simulation analysis of the cutting of Al7075-T6 aluminum alloy. The results showed that the parameters of the micro-texture greatly reduced the tool wear. The optimized micro-texture parameters with the best cutting performance were as follows: width, 40 μm; pitch, 80 μm; depth, 20 μm; spacing, 70 μm [15]. Liu Yayun et al. designed carbide micro-textured tools with different texture parameters and conducted cutting experiments on Al2O3. From their analysis, the optimal micro-texture parameters that could achieve the optimal wear resistance and workpiece surface quality were as follows: the width of the micro-texture was 75 μm, the spacing was 100 μm, and the pitch was 75 μm [16]. V. Sharma et al. designed micro-textured tools and analyzed the influence of the micro-texture parameters on the cutting force when cutting 4340 hardened steels, finally obtaining the optimal parameters of the micro-textured tools [17]. Through an experiment, Guo et al. analyzed the influence of microgroove parameters, such as the width, depth, and spacing, on the cutting force when cutting TC4 [18].
The above analysis indicates that, at present, the research on the micro-texture parameters of inserts mainly focuses on cutting aluminum alloy and titanium alloy and that the micro-texture parameters of inserts for nickel-based superalloy have not yet been studied. This paper studied the micro-texture parameters of micro-textured tools for cutting the GH4169 superalloy.
Research on the arrangement of micro-textures has also been reported in some studies. Tong Xin et al. studied the influence of variable-density micro-textured ball-end milling cutters on cutting titanium alloy and used a fuzzy algorithm to optimize the distribution of the ball-end milling cutters, obtaining variable spacings of 200 μm, 150 μm, and 175 μm for the studied micro-textures [19]. D. Arulkirubakaran et al. simulated the cutting process of Ti-6AL-4V using WC/Co micro-textured tools while using DEFORM with SAE 40 as a semi-solid lubricant. Combined with turning experiments, it was found that the cutting temperature of the micro-textured tool decreased to varying degrees during the cutting process, and this effect was more pronounced when cutting with vertical micro-textured tools [20]. Wang et al. conducted a simulation cutting of AISI 1045 carbon steel by using micro-textured tools and concluded that compared with non-textured and micro-textured tools, the cooling effect of the lateral micro-texture was more significant, and it exhibited a good chip-breaking performance during the cutting process [21].
From the above analysis, it can be seen that the current research on the arrangement of micro-textures uses a linear arrangement parallel or perpendicular to the cutting edge, and there is no research on arc-shaped arrangements. The research on these arrangement methods also targets aluminum alloy and titanium alloy workpieces. Research on the micro-texture arrangement of tools for GH4169 has not been conducted yet.
The optimization of micro-texture parameters has also been studied. Based on Oxely’s analysis model, Kishawy and Hossam A. optimized the microstructure parameters and obtained the microstructure parameters when cutting an AISI 1045 steel pipe with ceramic microgroove-textured tools, focusing on the cutting force. In addition, the examination showed no evidence of derivative cutting when using the optimized micro-textured insert, which also proved the efficacy of the proposed model [22]. Cheng Yaotian et al. simulated and experimentally analyzed the cutting force and depth of the damage under the surface of the workpiece when cutting carbon-fiber-reinforced plastic with microgroove-textured tools. The surface response method was used to optimize the groove parameters, and the microgroove parameters with the lowest cutting force and depth of damage under the surface were obtained [23]. Li Binbin et al. simulated and analyzed the cutting force of Inconel718 with sinusoidal-groove-textured tools and optimized the micro-texture parameters with the minimum cutting force by combining range analysis and effect analysis [24]. Yu Yinghua et al. studied the influence of elliptical-opening offset parabolic micro-texture feature parameters on the cutting performance of a tool for cutting Ti6Al4V based on the response surface methodology. Through neural networks and genetic algorithms, the micro-texture parameters were optimized with the main cutting force and cutting temperature as the targets, obtaining a set of optimal parameters, resulting in a reduction of 11.24% and 15.28% in the cutting force and temperature, respectively [25].
The results of different optimization methods may not necessarily be the same, and current research has mostly focused on single-objective optimization of micro-texture parameters using a single method. This paper considered the comprehensive performance of the studied tools—that is, taking the cutting force, cutting temperature, and tool wear as the targets, and considering the applicability and calculation efficiency of the optimization algorithm—and used two methods to carry out multi-objective optimization of micro-textured tools for cutting GH4169.
Based on the research of micro-textured tools mentioned above, the existing research achievements and further research on micro-textured cutting tools can be summarized as follows:
(1)
Micro-textures with reasonable morphologies and size parameters on the rake/flank surfaces of the tool can reduce the contact between the tool and the chip in the cutting process. The existence of micro-textures reduces the total contact area between the tool and chip and improves the cutting performance.
(2)
For the cutting performance of micro-textured tools, combinations of different morphologies and size parameters will have a positive or negative impact on the cutting performance. Generally speaking, reasonable morphologies and parameters of micro-textures can significantly improve the cutting performance of the tool; conversely, they may lead to a decrease in the cutting performance of the tool due to secondary cutting.
(3)
For different workpiece materials, various micro-texture morphologies and size parameters can be used to achieve a good performance. At present, there is a lot of research on micro-textured tools for titanium, but there is relatively little research on micro-textured tools for nickel-based superalloys. The morphology that is suitable for titanium alloys is not necessarily suitable for aluminum alloys or nickel-based superalloys. For different variations of a single workpiece material, even if they have the same micro-texture morphology but different size parameters, their cutting performance will not be the same. The size parameters of a micro-texture that provide the most significant reduction in the cutting force may not necessarily have the best effect on the cutting temperature reduction or produce a good surface quality of the workpiece.
(4)
Most scholars have only studied a single morphology of micro-textures or the impact of a single parameter of micro-textures on the cutting performance, rarely mentioning the study on the effect of the interaction effect of the micro-texture parameters on the cutting performance.
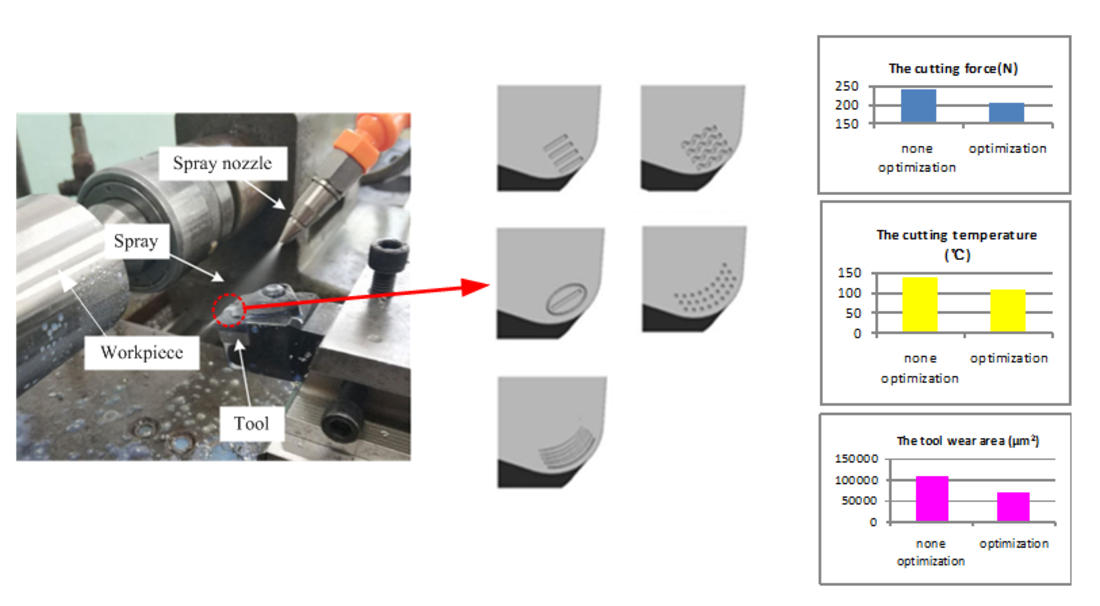
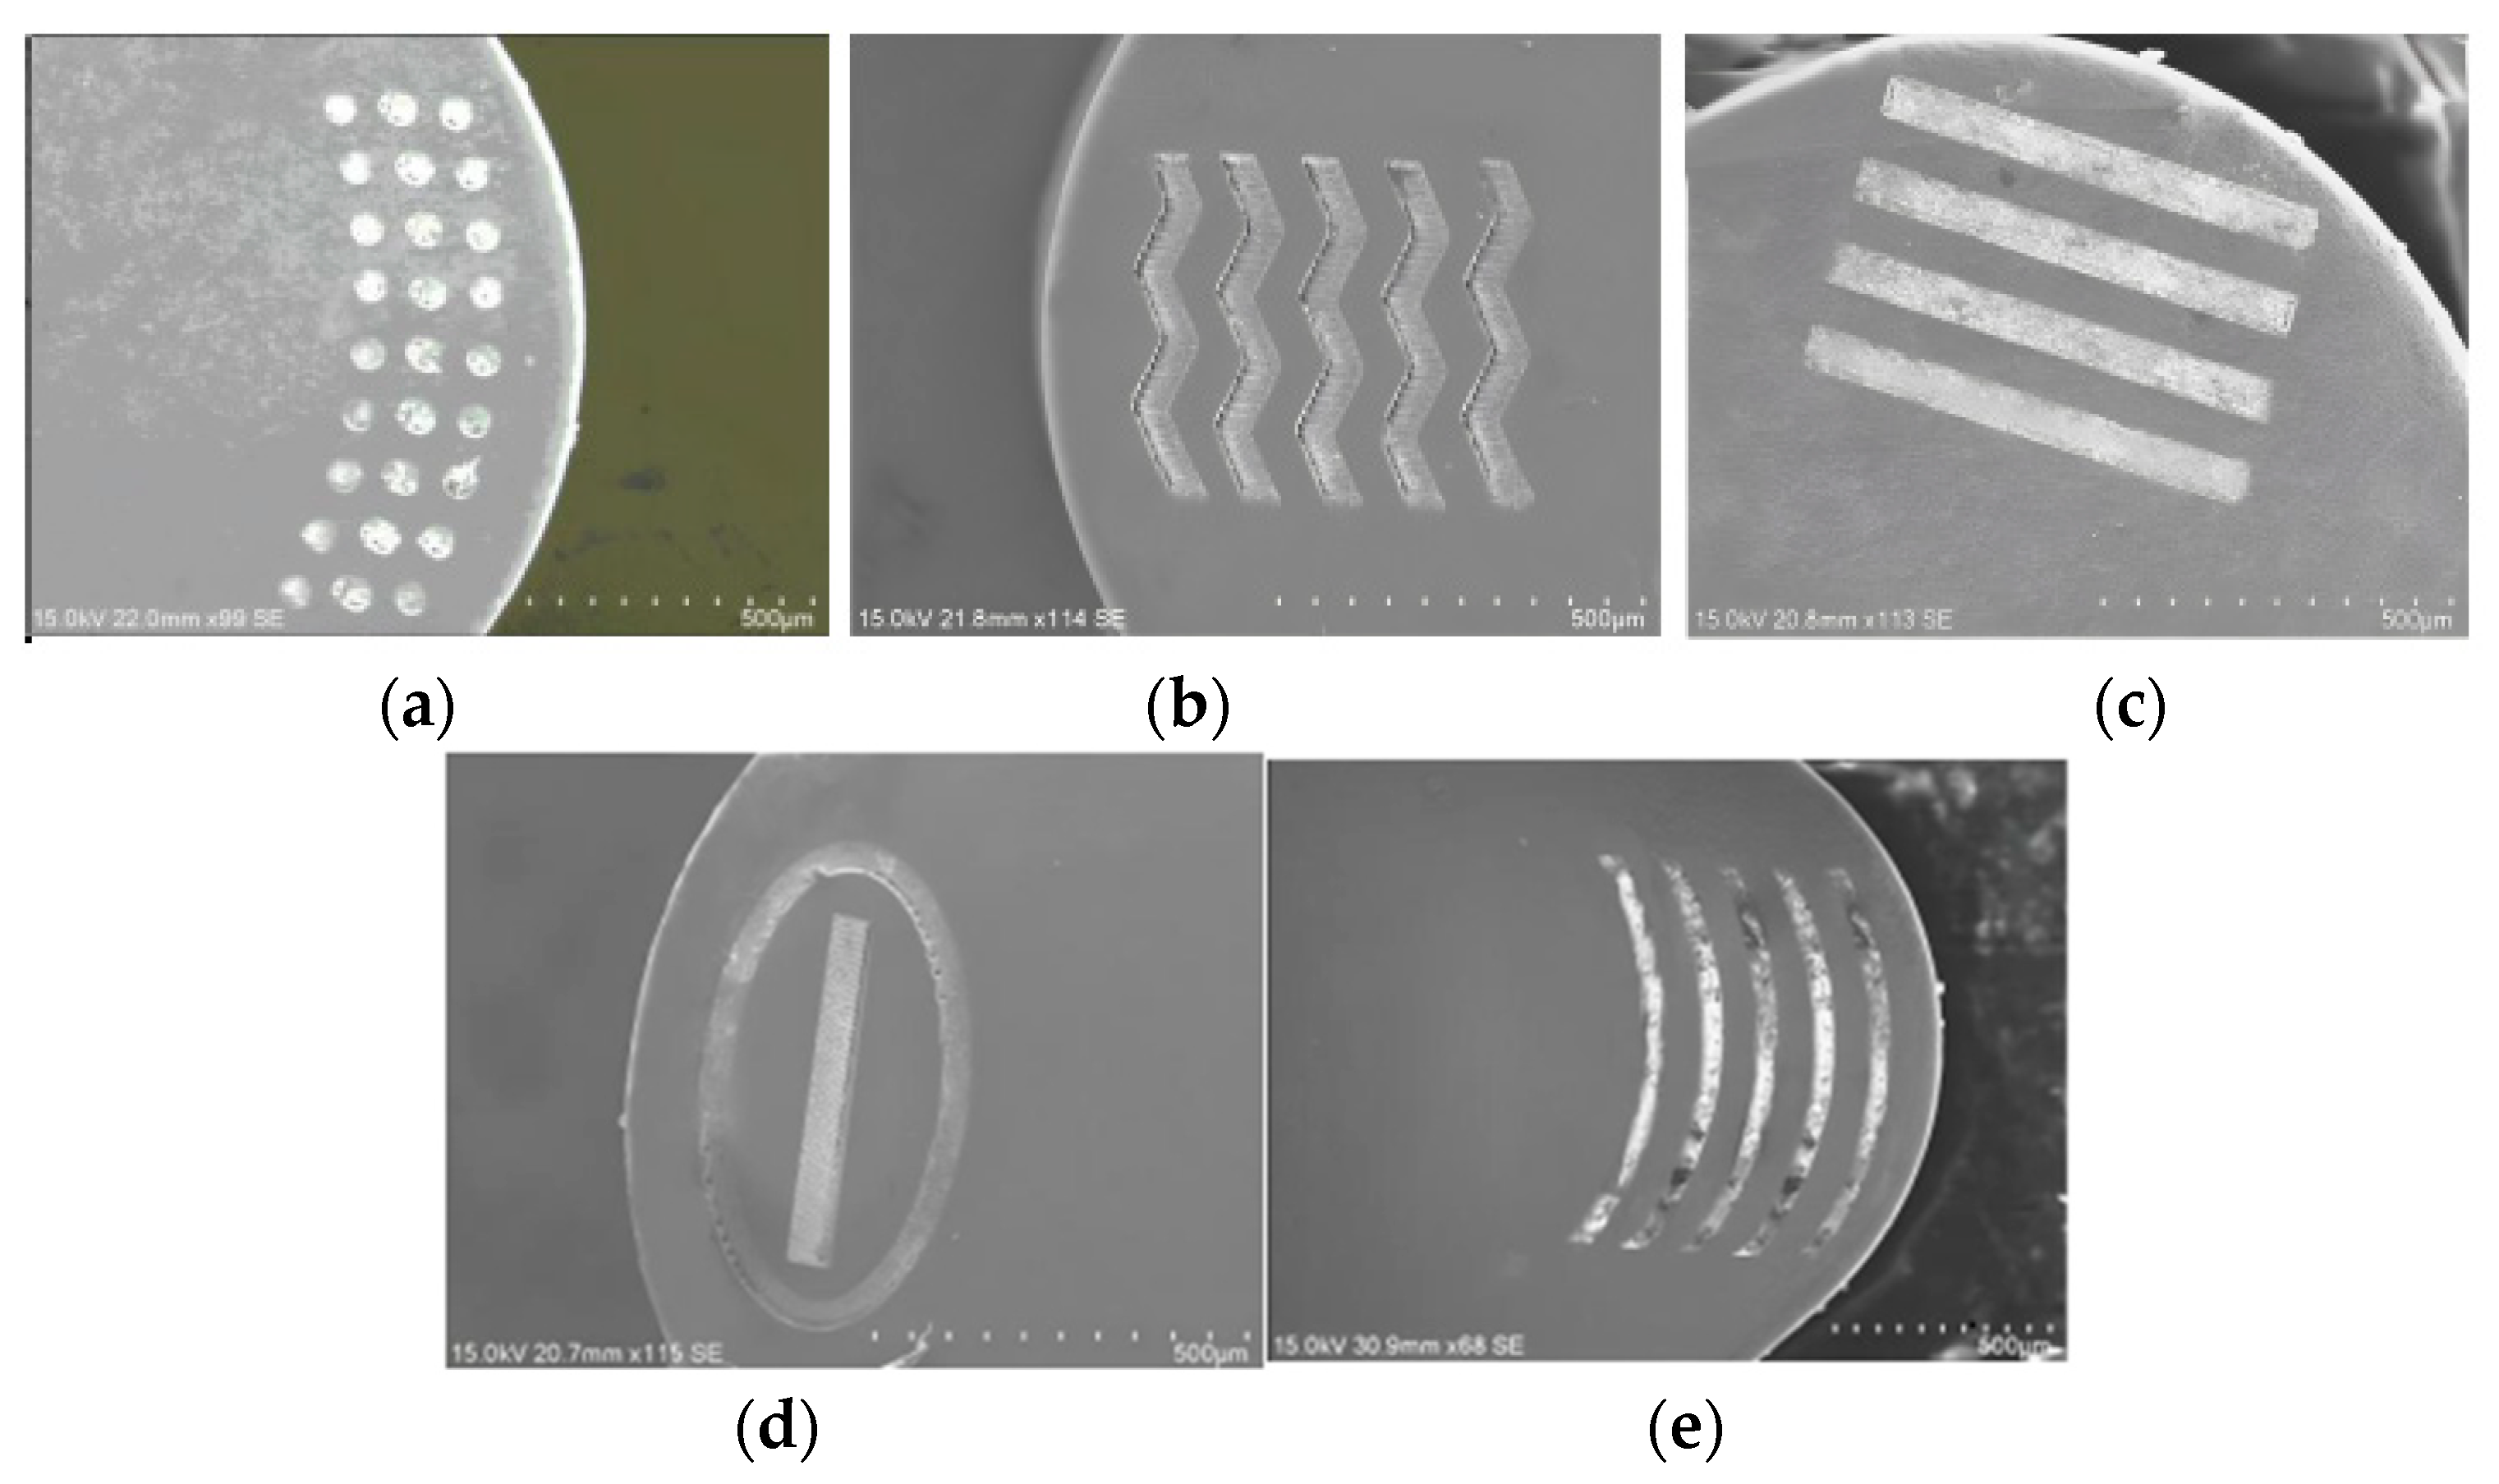
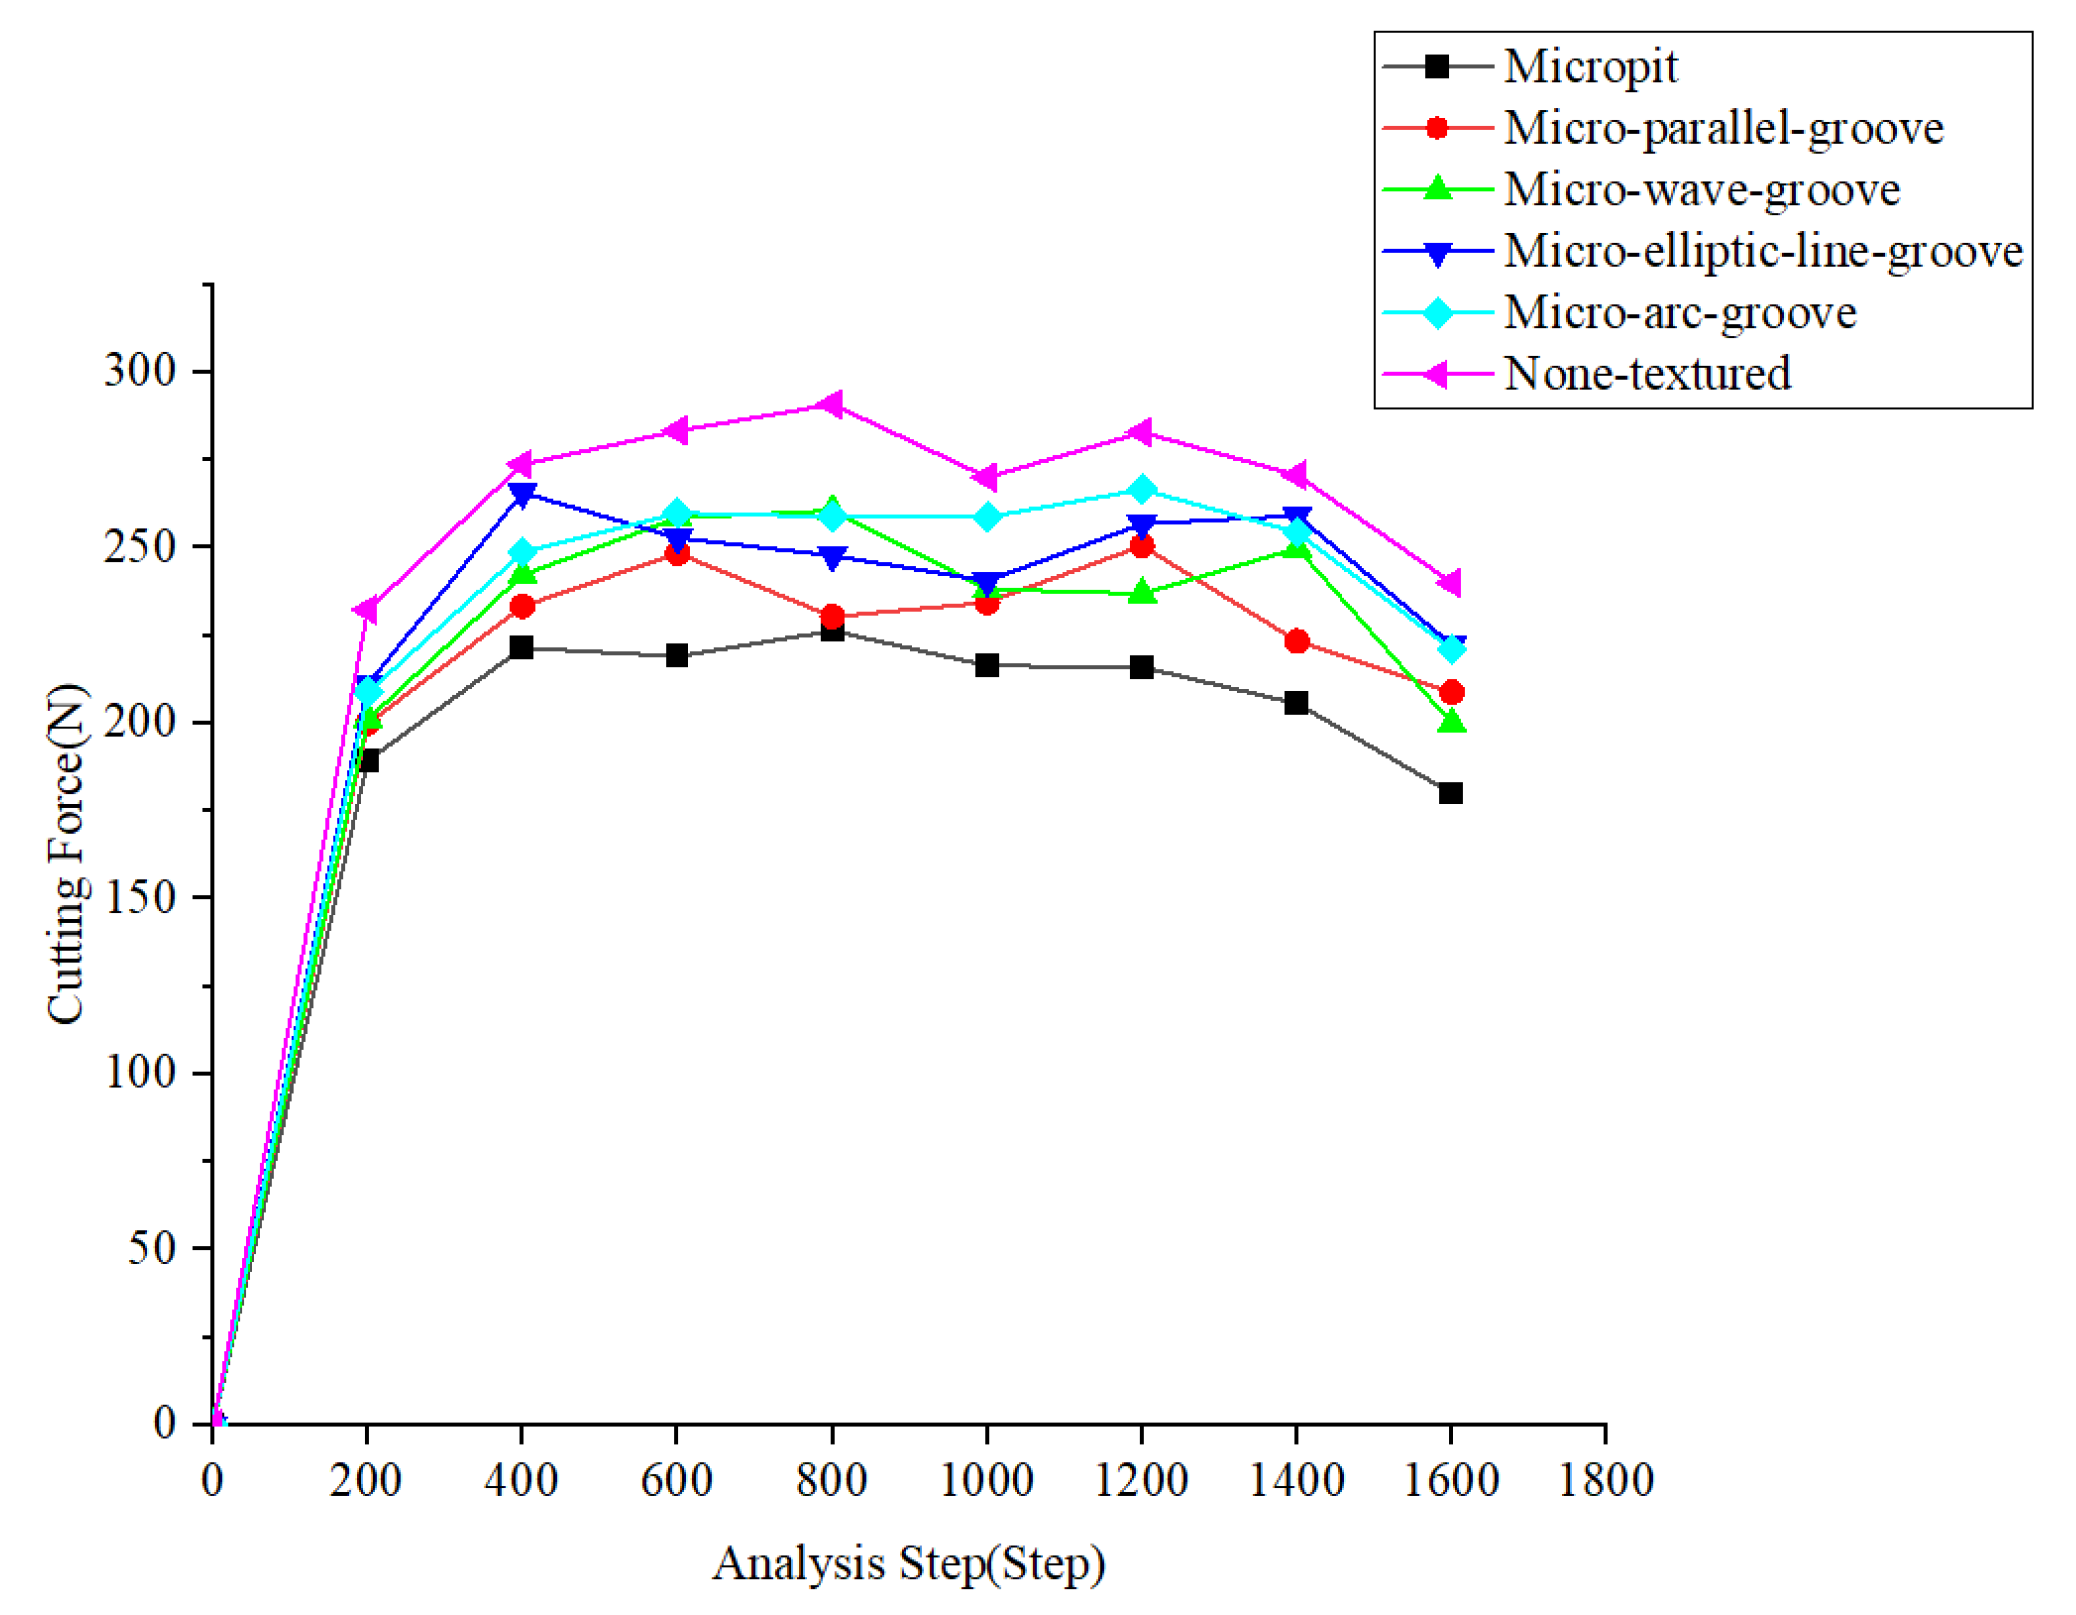
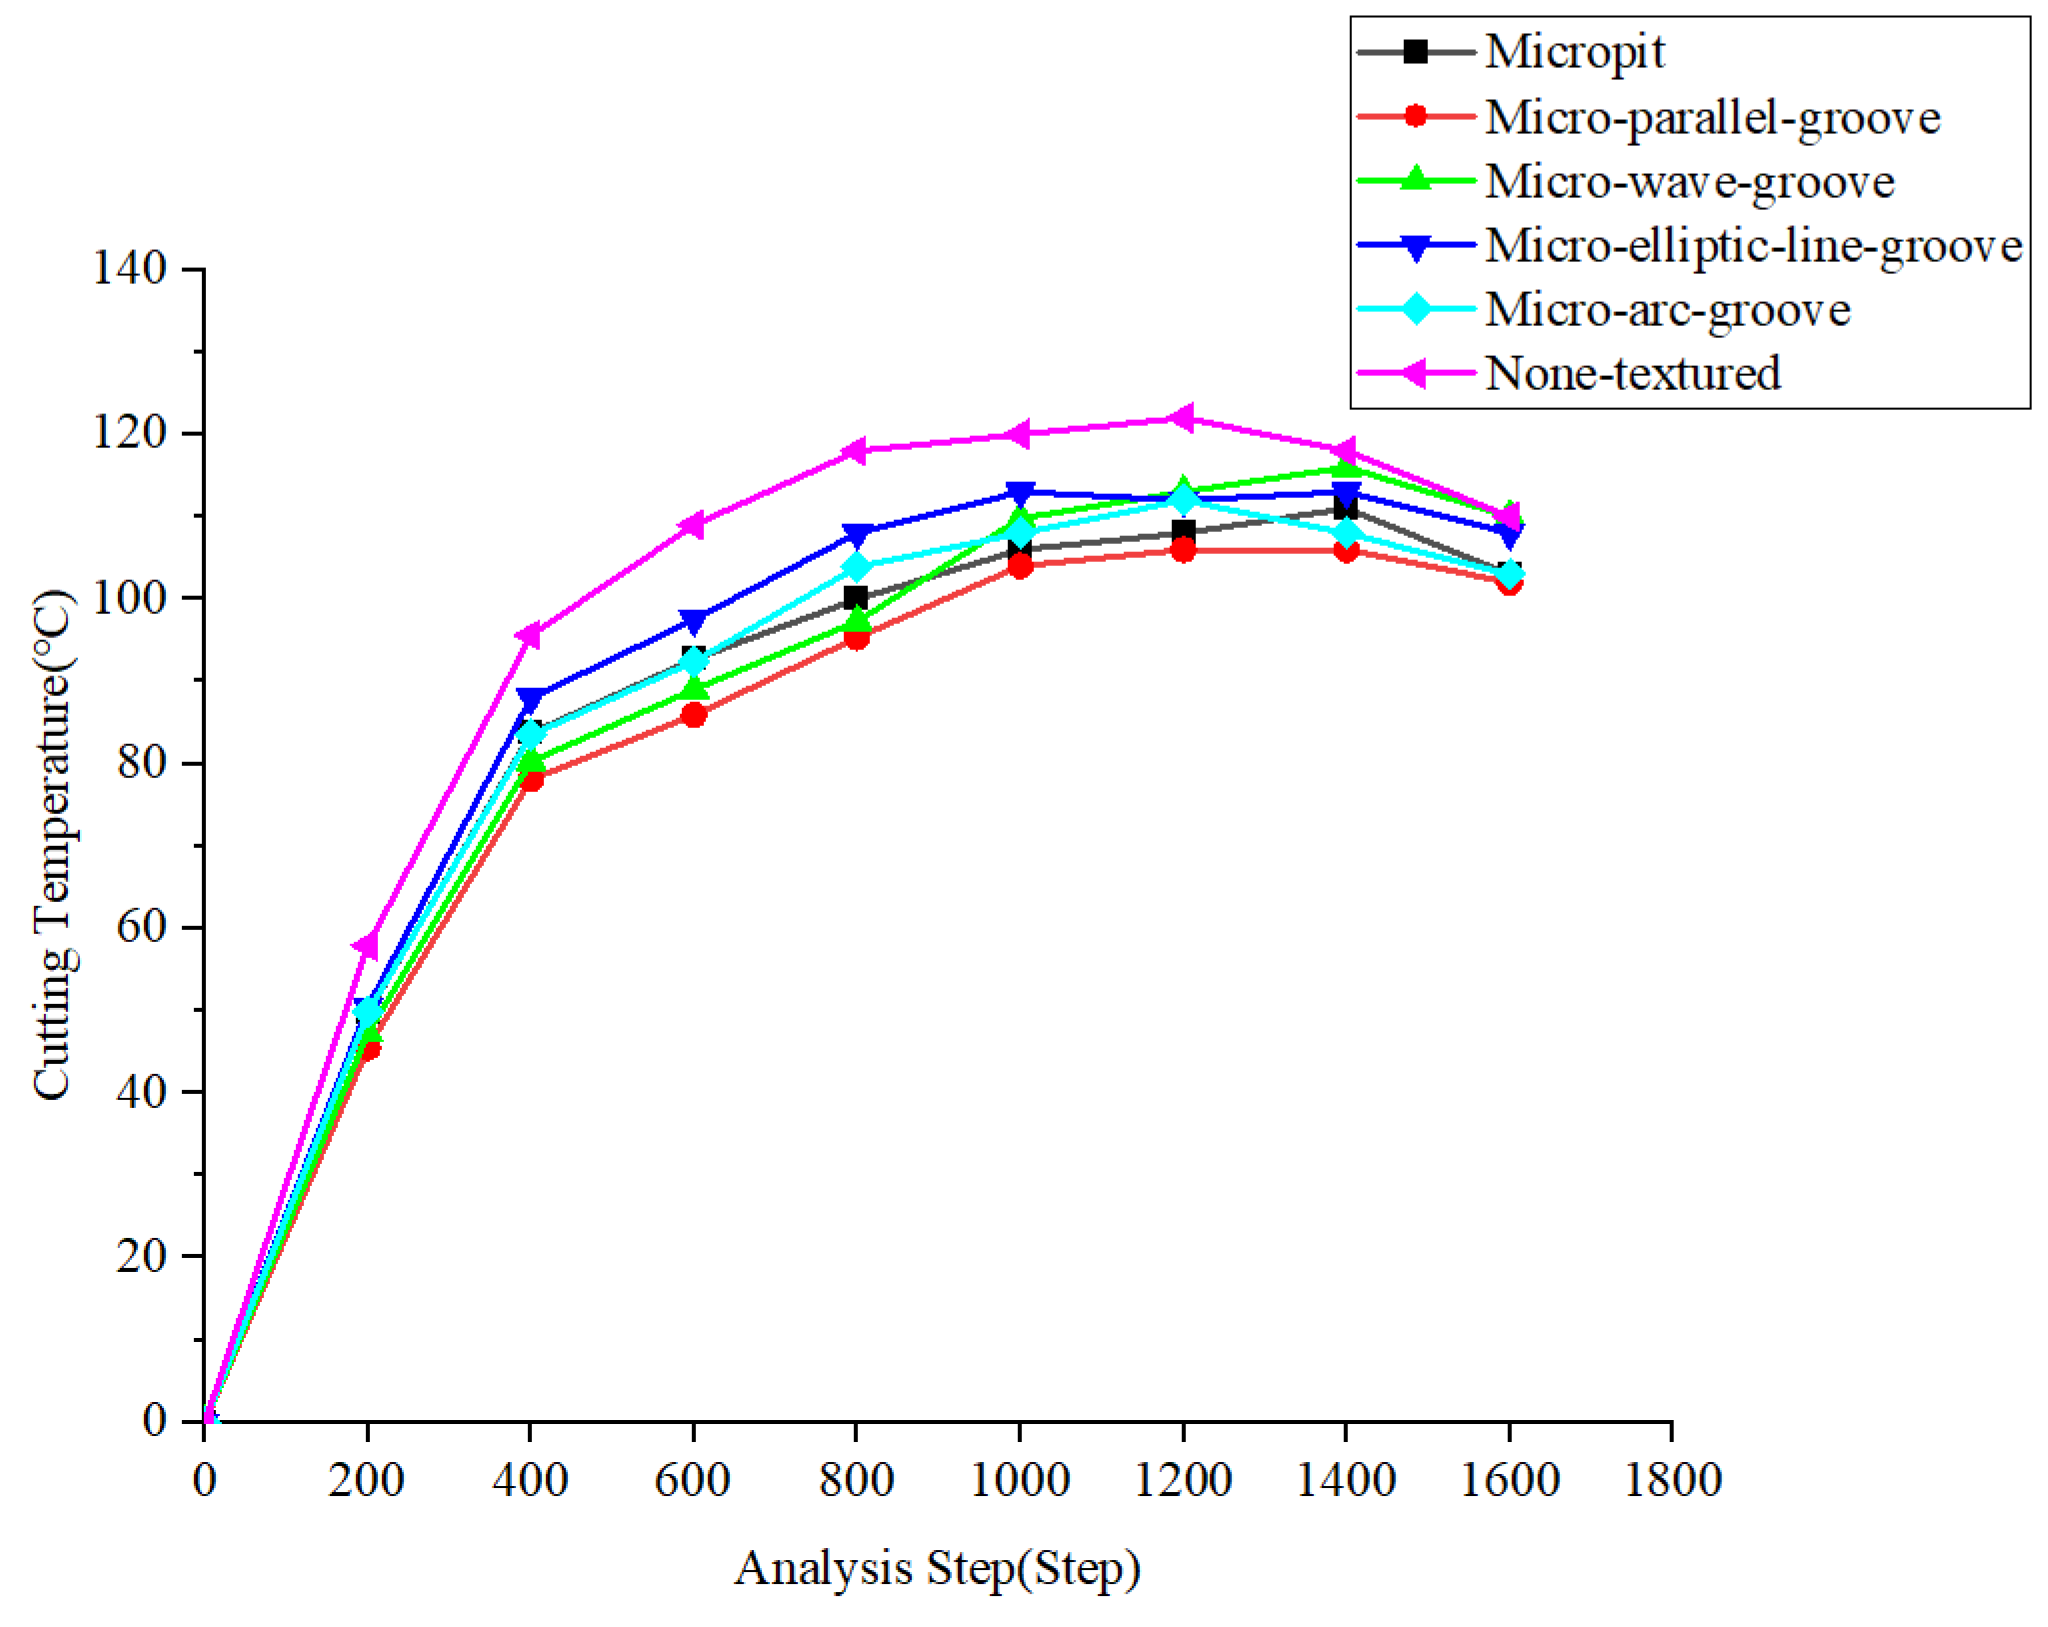
Based on the above analysis, in order to improve the process ability and tool life when cutting the nickel-based superalloy GH4169, micro-textured tools were designed to cut GH4169 during spray cooling. This paper explored the cutting performance of micro-textured tools with different morphologies and parameter combinations through experimental and simulation analyses during spray cooling. The response surface method and genetic algorithm were used in the multi-objective optimization of the micro-texture parameters to obtain suitable micro-texture morphologies and size parameters for cutting GH4169, providing the tools with a good, comprehensive performance.

2. Experiment of Micro-Textured Tools for Cutting GH4169

2.1. Design and Processing of Micro-Textured Tools

Five types of micro-textured tools with different morphologies were designed and processed for the cutting experiments. Partial larger views of the five micro-textured tools with different morphologies are shown in Figure 1. T1 is a micropit-textured tool that has three rows of lattice-shaped micropits parallel to the tool nose arc on the rake face; T2, a micro-wave-groove-textured tool that has five rows of corrugated grooves parallel to the arc of the tool nose on the rake face; T3, a micro-parallel-groove-textured tool that has four rows of straight grooves that are approximately parallel to the arc of the tool nose on the rake face; T4, a micro-elliptic-line-groove-textured tool that has mixed microgrooves with a combination of circular and straight grooves on the rake face; and T5, a micro-arc-groove-textured tool that has five rows of arc grooves parallel to the tool nose arc on the rake face.
In order to analyze the performance of the five morphologies, a simulation model of the micro-textured tools when cutting GH4169 was established using the same cutting micro-textured tools when cutting GH4169. The cutting force, cutting temperature, and wear depth of the rake face of the tools were obtained. The cutting force is shown in Figure 2, the cutting temperature is shown in Figure 3, and the cloud map of the wear depth of the tool rake face is shown in Figure 4. The simulated average cutting force, average cutting temperature, and tool wear depth are shown in Table 1.
From Figure 2, it can be seen that compared with the non-textured tool, the micropit-textured tool had the lowest cutting force, followed by the micro-parallel-groove-textured tool. From Figure 3, it can be seen that, compared with the non-textured tool, the micro-parallel-groove-textured tool had the lowest cutting temperature, followed by the micropit-textured tool. From Figure 3, it can be seen that, compared with the non-textured tool, the micropit-textured tool had the lowest wear depth, with a maximum value of 0.182 mm, followed by the micro-parallel-groove-textured tool.
From Table 1, it can be seen that among the five types of micro-textured tools, the cutting force and wear depth of the micropit-textured tool were lower than those of the other micro-textured tools. This result can be explained as follows: Among the five micro-textured tools with different morphologies, the micropits in the micropit-textured tool are distributed in a lattice. Compared with the other micro-textured tools, the contact area of the tool chips is smaller. It is believed that the friction force is proportional to the contact area of the tool chips; therefore, the friction force of the micropit-textured tool is lower, which results in a lower wear and cutting force compared with those of the other micro-textured tools with different morphologies. From Table 1, it can also be seen that the cutting temperature of the micro-parallel-groove-textured tool was lower compared with that of the other micro-textured tools.
Based on the above results, it was ultimately determined that the cutting performance of the micropit-textured tool was better than that of the other micro-textured and non-textured tools. Therefore, micropit-textured tools were used as the research object for the multi-objective optimization. Different parameters of the micropit-textured tools were processed, and cutting experiments were carried out. Through multi-objective optimization methods, the micro-texture parameters were optimized to obtain a good, comprehensive performance of the tools.

2.2. Experiment of Micro-Textured Tool for Cutting GH4169

Before the multi-objective optimization, cutting experiments were conducted on the micro-textured tools when cutting GH4169. The machine tools and equipment used in the experiment were as follows: CKA6140 CNC lathe; CNMA120408-cemented carbide inserts with a micropit texture on their rake face; DCLNR 2525 M12 tool shank; GH4169 bars with a diameter of 120 mm and a length of 300 mm; three-axis dynamic piezoelectric force measuring instrument (Kistler 9139AA) to measure the force; WPNK-191-armored thermocouple to measure the cutting temperature; KQ2200DE CNC ultrasonic cleaner (to clean the inserts); and model OoW129S composite spray cooling system (to spray atomized cutting fluid into the cutting area for cooling). The setup of the experiment is shown in Figure 5.

3. Response Surface Method for Multi-Objective Optimization of Micro-Texture Parameters of Tools

3.1. Cutting Experiment and Result Analysis

Before conducting the multi-objective optimization, the first step was to determine the experimental method. In order to minimize the optimal costs and improve the optimal efficiency, this paper used the Box–Behnken design (BBD) method to design the micro-texture parameters [26].
Before conducting the experimental design, it was necessary to determine the size range of the micro-texture parameters. In this paper, the size ranges of the micropit texture parameters were as follows: the edge distance (parameter A) was 60–100 μm, the diameter (parameter B) was 40–60 μm, and the spacing (parameter C) was 100–140 μm. The division of the three parameter levels of the micro-texture is shown in Table 2. The meaning of the parameters is shown in Figure 6. The parameters of the micropit texture are shown in Table 3.
Based on different combinations of the micropit parameters presented in the previous text, a femtosecond laser was used to process the micropit texture on the rake of the tools. Through preliminary experiments and simulations by the research group, it was found that the relatively reasonable depth of the micro-texture was between 20 and 30 μm; thus, the micro-texture depths processed in this article were all 30 μm. Images of the micropit-textured tools collected during scanning electron microscopy are shown in Figure 7.
The cutting experiments were conducted at a cutting speed of 80 m/min, a feed rate of 0.2 mm/r, and a cutting depth of 0.2 mm. Moreover, the time intervals were 10–20 s, and the average cutting force and temperature of the tools under different combinations of micro-texture parameters were obtained, as shown in Table 4. In order to analyze the influence of the micro-texture parameters on the tool wear area, the micropit-textured tools were observed under a scanning electron microscope after the experiment, and it was found that the wear patterns of the tool rake faces were different and irregular. This paper used the rectangular equivalent method (micro-element method) to calculate the wear areas of the different shapes of each tool’s rake face; an irregular wear area is equivalent to a regular rectangular shape. In this method, the length and width of the rectangle are measured, and the area of the rectangle equivalent to the wear area of the rake face of the tool is calculated. The calculated wear areas of the tools’ rake faces are shown in Table 4, and enlarged views of the partial tool wear after the cutting experiments are shown in Figure 8.
From Table 4, it can be seen that the cutting force of tool No. 12 in the experiment was the lowest; that is, when the edge distance A was 100 μm, the diameter B was 60 μm, the spacing C was 120 μm, and the cutting force of the micropit-textured tool reached its minimum value of 201.42 N. It can also be seen that the cutting temperature of tool No. 14 in the experiment was the lowest; that is, when the edge distance A was 100 μm, the diameter B was 50 μm, the spacing C was 140 μm, and the cutting temperature of the micropit-textured tool reached its minimum value of 102 °C. The wear area of tool No. 12 was the lowest; that is, when the edge distance A was 100 μm, the diameter B was 60 μm, the spacing C was 120 μm, and the wear area of the micropit-textured tool reached its minimum value of 70,709 μm2.

3.2. Multi-Objective Optimization of Tool Micro-Texture Parameters Using Response Surface Method

3.2.1. Regression Model Analysis

In this paper, the response surface method (RSM) was used to establish the regression equation between the three optimization variables, namely A, B, and C, and the three response indicators, namely the tool cutting force, cutting temperature, and tool wear area.
Significance analyses of the regression models of the cutting force, cutting temperature, and tool wear area of the rake faces of the tools are shown in Table 5, Table 6, and Table 7, respectively.
From Table 5, it can be seen that the interaction of the micro-texture parameter BC had a significant impact on the cutting force. From Table 6, it can be seen that the interaction of AC had a significant impact on the cutting temperature. From Table 7, it can be seen that the interaction of the micro-texture parameter BC had a very significant impact on the tool wear area.
The analysis results showed that the p values of the regression models of the cutting force, cutting temperature, and wear area of the rake face were 0.0106, 0.0065, and p < 0.0001, respectively, indicating that the regression models established were significant, and the determination coefficients R2 of these regression models were 0.8944, 0.9094, and 0.9803, which were all close to 1; in other words, the accuracy of all experimental data explained by these models reached 89.44%, 90.94%, and 98.03%, respectively. In addition, the signal-to-noise ratio, Adeq Precision values of the models were equal to 8.9817, 5.7686, and 19.6011, all of which were greater than 4.
Obviously, the above contents sufficiently reflect the accuracy and reliability of the established regression model of the cutting force. The regression models of the cutting force, cutting temperature, and tool wear area of the micropit-textured tools were finally established as follows:
R1 = 676 + 2.81 × A − 3.23 × B − 8.01 × C − 0.0325 × A × B − 0.0007 × A × C + 0.0510 × B × C − 0.0085 × A2 − 0.0109 × B2 + 0.0510 × C2
R2 = 122 − 3.05 × A + 7.85 × B − 1.34 × C + 0.0088 × A × B + 0.0238 × A × C − 0.0163 × B × C − 0.0035 × A2 − 0.0665 × B2 + 0.0028 × C2
R3 = 345,571 − 555 × A − 6446 × B − 898C3 + 5.91 × A × B + 0.79 × A × C + 12.86 × B × C + 0.02 × A2 + 33.78 × B2 + 1.20 × C2
Residual positive probability graphs (referred to as residual) were used to test whether the data follow certain rules and judge whether the established regression models of the micro-textured tools’ cutting force, cutting temperature, and tool wear area are reasonable. As shown in Figure 9, the residual graphs of the cutting force, cutting temperature, and tool wear area show linear aggregation, and they also have the characteristics of a uniform distribution without overflow points, indicating that the data are relatively reasonable. The contour maps of the 3D response surface of the influence of the interaction between two pairs on the cutting force, cutting temperature, and tool wear area are shown in Figure 10, where the small red dots indicate the position and response values of the experimental data or optimization points in the response surface model, which is helpful for analyzing and optimizing multivariate functions.
From Table 5, it can be seen that the interaction of the micro-texture parameter BC had a significant impact on the cutting force. Figure 10a shows the contour map of the response surface of the diameter and spacing (BC). As the diameter B and spacing C decreased, the overall response surface showed a trend of an initial decrease followed by an increase. The gray area below shows an increase in the contour curvature; therefore, the interaction between the diameter and spacing (BC) had a significant impact on the cutting force of the tool. It can be seen from Table 6 that the interaction of AC had a significant impact on the cutting temperature. Figure 10b shows the contour map of the response surface of the edge distance and spacing (AC). As can be seen from the graph, with the decrease in the edge distance A and spacing C, the cutting temperature increased, and the response surface showed an overall upward trend. The curve in the gray plane below represents the contour line: the larger the curvature, the more significant the interaction between the edge distance and spacing (AC) on the cutting temperature of the tool.
It can be seen from Table 7 that the interaction of the micro-texture parameter BC had a very significant impact on the tool wear area. Figure 10c shows the contour map of the response surface of the diameter and spacing (BC). It can be seen from the figure that as the diameter B and spacing C decreased, the response surface showed an overall upward trend. The curve in the lower gray plane represents the contour. As its curvature increased, the interaction between the diameter and spacing (BC) had a more significant impact on the tool wear area.

3.2.2. Multi-Objective Optimization of Tools’ Micro-Texture Parameters

On the basis of the above analysis, the response surface method was used to optimize the combination of micro-texture parameters. Firstly, Design-Expert was used to analyze the second-order surface model of the micro-texture parameters; optimize the extreme points of the three response variables of the micro-textured tools, namely the cutting force, cutting temperature, and tool wear area; and find a group of parameters in the process of optimization, so as to obtain the optimal cutting performance of the micro-textured tools. In the process of optimization, the three response variables of the micro-textured tools were set as follows: the cutting force ranged from 201.42 N to 280.35 N, the cutting temperature ranged from 102 °C to 130 °C, and the tool wear area ranged from 70,709 μm2 to 101,138 μm2.
After setting the corresponding variables of the micro-texture, the optimal combination from the multi-objective optimization was obtained as follows: the edge distance A of the micro-texture was 81.3505 μm, the diameter B was 56.786 μm, and the spacing C was 102.377 μm. Correspondingly, the cutting force was 216.795 N, the cutting temperature was 117 °C, and the tool wear area was 72,697.4 μm2.
After debugging the relevant equipment, a micropit-textured tool with the optimal parameters was processed, and a cutting experiment was carried out. The tool’s cutting force was 202.5 N, the cutting temperature was 113 °C, and the wear area was 71,994 μm2. The results show that the relative errors between the optimized results of the response surface method and the experimental results were as follows: cutting force, 6.59%; cutting temperature, 3.42%; and tool wear area, 0.94%. Under the same conditions, the cutting force of the non-textured tool was 240.98 N, the cutting temperature was 138 °C, and the wear area was 109,942 μm2. Compared with non-textured tool, for the optimized micro-textured tool, the cutting force, cutting temperature, and tool wear area were reduced by 15.97%, 18.12%, and 34.52%, respectively.

4. Multi-Objective Optimization of Tools’ Micro-Texture Parameters Using Genetic Algorithm

In order to explore the influence of the micro-texture parameters more accurately under different combinations on the cutting performance of the micro-textured tools, the NSGA-II algorithm based on approximate models was used for the multi-objective optimization of the micro-texture parameters and to intelligently solve the Pareto solution set. Firstly, 27 full-factor experiments on the micro-texture parameters were designed using Minitab, and trained and predicted using the RBF and BP approximate models in MATLAB (the analysis models; the calculation results of these models are similar to those of the analysis model from the simulation process). The two approximate models were optimized based on the predicted results. Then, the NSGA-II algorithm was used to optimize the three response target approximate models and obtain the Pareto solution set.

4.1. Experimental Design of Neural Network Optimization for Micro-Texture Parameters

When using RBF neural networks for parameter optimization, in order to achieve ideal results, it is usually necessary to use a large amount of data; therefore, this paper used Minitab to design full factor experiments on the micro-texture parameters to achieve more accurate results after training. Table 8 shows the results of the 27 full-factor experiments designed using Minitab [27,28].
According to the full factor experiments shown in Table 8, the cutting experiments were conducted at a cutting speed of 80 m/min, a feed rate of 0.2 mm/r, and a cutting depth of 0.2 mm. Based on the collected experimental data (cutting force, cutting temperature, and wear area), a multi-objective approximate model for the micro-texture parameters was established using RBF and BP neural networks.

4.2. Comparison of RBF and BP Neural Network Approximate Models

By using MATLAB to program the RBF neural network, the response targets of different combinations of the micro-texture parameters were predicted using the obtained approximate model, and the predicted results of this approximate model were compared with the data obtained from the experiment. Table 9 shows the cutting force comparison between the approximate models obtained using the two neural networks and the actual simulation data. Table 10 shows the comparison of the cutting temperature, and Table 11 shows the comparison of the tool wear of the rake face. It can be seen that the error between the predicted results of the approximate model obtained using the RBF neural network and the actual simulation data were kept within a relatively small range, which indicates that the accuracy and reliability of this approximate model’s prediction are relatively high. As shown in Figure 11, the line chart of the comparison between the predicted values of the last 10 groups of the RBF neural network approximate model and the simulation data intuitively show that the predicted values and the simulation data basically illustrated a consistent trend, which again proves the accuracy and reliability of the RBF neural network approximate model.

4.3. RBF Approximate Model and NSGA-II Algorithm for Multi-Objective Optimization of Micro-Texture Parameters

By comparing the predicted and experimental values of the two neural network approximate models, it was found that the RBF neural network was more reliable and accurate than the BP neural network in predicting the cutting force, cutting temperature, and tool wear area when cutting using the micro-textured tools; therefore, the RBF neural network was selected to establish a multi-objective optimization model for the micro-texture parameters, and then combined with the NSGA-II multi-objective genetic algorithm for optimization processing.
After multiple iterations of the NSGA-II optimization algorithm, the Pareto front diagrams for the three objectives were obtained, as shown in Figure 12.
The nonlinear relationship between each objective function can be directly seen in the Pareto diagrams. The curves in the Pareto diagrams are relatively smooth and all gather together, indicating the accuracy and reliability of this optimization algorithm. In addition, the diagrams prove that the NSGA-II optimization algorithm has good convergence. From Figure 12, it can also be seen that an increase in one variable led to a decrease in another variable, indicating the interaction and influence between various variables and verifying the convergence, reliability, and accuracy of the NSGA-II optimization algorithm.
From the Pareto solution set obtained above, several sets of optimal feasible solution sets were selected, as shown in Table 12. Through comparison, it was found that the first group of three optimal solutions was more suitable for the optimization of the micro-texture parameters in this paper compared with the other solution sets; therefore, the first group of data was used as the final result of the micropit texture optimization, where the edge distance A was 100 μm, the diameter B was 60 μm, and the spacing C was 100 μm.
From Table 12, it can be seen that when the edge distance A was 100 μm, the diameter B was 60 μm, and the spacing C was 100 μm, that the corresponding cutting force was 210.64 N, the cutting temperature was 105.24 °C, and that the tool wear area was 69,138 μm2. In order to verify the accuracy and reliability of the NSGA-II genetic optimization algorithm based on the RBF neural network, relevant cutting experiments were carried out to verify the optimization results, setting the same conditions as in the above experiments and cutting GH4169 with the micropit-textured tool with the optimal micro-texture parameters. The cutting force of the experiment was 204.67 N, the cutting temperature was 108 °C, and the tool wear area was 70,724 μm2. Compared with the optimal solution set, the relative errors of the cutting force, cutting temperature, and tool wear area of the micropit-textured tool were 2.83%, 2.62%, and 0.29%, respectively. The errors were within the acceptable ranges, which verifies the accuracy and reliability of the optimization results using the RBF neural network and NSGA-II genetic optimization algorithm. Compared with the non-textured tool, of which the cutting force, cutting temperature, and tool wear area were 240.99 N, 138 °C, and 109,938 μm2, respectively, the cutting force, cutting temperature, and tool wear area of the optimized micro-textured tool were reduced by 15.07%, 21.74%, and 35.67%, respectively.
Based on the comparison between the optimization results obtained by combining the RBF neural network with the NSGA-II genetic optimization algorithm and those obtained using the response surface method, it was found that the optimization algorithm combining the RBF neural network with the NSGA-II genetic optimization algorithm was more suitable for optimizing the micro-texture parameters. Table 13 shows the comparison results of the two optimization algorithms. In the table, the cutting performance of the tool after using the two optimization algorithms can be intuitively seen. The cutting force, cutting temperature, and tool wear area of the micro-textured tool optimized using the RBF neural network and NSGA-II genetic algorithm were lower than those of the RSM, and the relative error of RBF-NSGA-II was relatively low as well.

5. Conclusions

This paper explored the influence of micro-texture morphologies and size parameters on the cutting performance when cutting the nickel-based superalloy GH4169 with micro-textured tools. Moreover, the optimal combination of micro-texture parameters was analyzed using a multi-objective optimization algorithm. The conclusions are as follows:
  • Simulation and cutting experiments were carried out on five types of micro-textured tools with different shapes, and the average cutting force, average cutting temperature, and tool wear depth of the tools were extracted. After comparison, it was found that the cutting temperature and tool wear depth of the micropit-textured tool were relatively low, and the cutting temperature of the micro-parallel-groove-textured tool was relatively low.
  • The traditional response surface method and Box–Behnken design method were used to optimize the micro-texture parameters of the micropits, and the optimized combination of micro-texture parameters was obtained as follows: the edge distance A was 81.3505 μm, the diameter B was 56.786 μm, and the spacing C was 102.377 μm. Compared with the non-textured tool, the cutting force, cutting temperature, and tool wear area of the optimized micro-textured tool were reduced by 15.97%, 18.12%, and 34.52%, respectively.
  • An optimization algorithm combining the RBF approximate model and NSGA-II algorithm was used to optimize the micro-texture parameters of the micropits. The optimized combination of micro-texture parameters of the micropits was as follows: the edge distance A was 100 μm, the diameter B was 60 μm, and the spacing C was 100 μm. The experimental results show that the cutting force of the tool was 204.67 N, the cutting temperature was 108 °C, and the tool wear area was 70,724 μm2. Compared with the non-textured tool, the cutting force of the optimized tool was reduced by 15.07%, the cutting temperature was reduced by 21.74%, and the tool wear area was reduced by 35.67%.
  • By comparing the optimization results of the response surface method and genetic algorithm with the experimental values, the results show that the RBF-NSGA-II optimization algorithm was more suitable for the multi-objective optimization of the micro-texture parameters.

Author Contributions

Methodology, X.F. (Xinmin Feng); software, X.F. (Xiwen Fan); validation, J.H.; writing—original draft preparation, X.F. (Xinmin Feng); writing—review and editing, J.W. All authors have read and agreed to the published version of the manuscript.

Funding

This study was supported by the National Natural Science Foundation of China (No. 51675144).

Data Availability Statement

Not applicable.

Conflicts of Interest

The authors declare no conflict of interest.

References

  1. Hao, Z.; Yang, S.; Fan, Y.; Lu, M. Machining characteristics of cutting Inconel718 with carbide tool. Int. J. Mater. Prod. Technol. 2019, 58, 275–287. [Google Scholar] [CrossRef]
  2. Huang, J.; He, Z.Z.; Yang, X.G.; Shi, D.Q.; Sun, Y.T. Improved method for creep life prediction of nickel-based directionally solidified superalloys. J. Mech. Eng. 2022, 58, 258–268. [Google Scholar]
  3. Feng, X.M.; Dong, Q.S.; Hu, J.S. Simulation and experimental analysis of cutting temperature in cutting GH4169 under spray cooling. Mech. Sci. Technol. Aerosp. Eng. 2022, 41, 985–991. [Google Scholar]
  4. Shi, L.M.; Zhang, C. Experimental research on turning of superalloy GH4169 under high pressure cooling condition. Integr. Ferroelectr. 2020, 207, 75–85. [Google Scholar] [CrossRef]
  5. Zhao, W.; Ren, F.; Iqbal, A.; Gong, L.; He, N.; Xu, Q. Effect of liquid nitrogen cooling on surface integrity in cryogenic milling of Ti-6Al-4V titanium alloy. Int. J. Adv. Manuf. Technol. 2020, 106, 1497–1508. [Google Scholar] [CrossRef]
  6. Lin, Z.; Danni, L. Simulation and experimental research of nickel base heat resisting alloy in low temperature cold air and micro lubrication cutting. Mach. Hydraul. 2018, 46, 24–26. [Google Scholar]
  7. Song, W.; Wang, S.; Lu, Y.; Xia, Z. Tribological performance of microhole-textured carbide tool filled with CaF2. Materials 2018, 11, 1643. [Google Scholar] [CrossRef] [Green Version]
  8. Patel, K.; Liu, G.; Shah, S.R.; Özel, T. Effect of micro-textured tool parameters on forces, stresses, wear rate, and variable friction in titanium alloy machining. J. Manuf. Sci. Eng. 2020, 142, 021007. [Google Scholar] [CrossRef]
  9. Cui, X.; Sun, N.; Guo, J.; Ma, J.; Ming, P. Performance of multi-bionic hierarchical texture in green intermittent cutting. Int. J. Mech. Sci. 2023, 247, 108203. [Google Scholar] [CrossRef]
  10. Zhou, X.R.; He, L.; Yuan, S.; Zhou, T.; Tian, P.F.; Zou, Z.C. Advanced research progress of surface micro-texture in cutting process. Surf. Technol. 2022, 51, 100–127. [Google Scholar]
  11. Ali, S.; Abdallah, S.; Pervaiz, S. Predicting cutting force and primary shear behavior in micro-textured tools assisted machining of AISI 630: Numerical modeling and taguchi analysis. Micromachines 2022, 13, 91. [Google Scholar] [CrossRef] [PubMed]
  12. Tu, C.J.; Guo, X.H.; Guo, D.L. Comparisong of machineability of self-lubrication ceramic tools with different morphological micro-texture. Mater. Mech. Eng. 2018, 42, 47–51+57. [Google Scholar]
  13. Rajurkar, A.; Chinchanikar, S. Experimental investigation on laser-processed micro-dimple and micro-channel textured tools during turning of inconel 718 alloy. J. Mater. Eng. Perform. 2022, 31, 4068–4083. [Google Scholar] [CrossRef]
  14. Dhage, S.; Jayal, A.D.; Sarkar, P. Effects of surface texture parameters of cutting tools on friction conditions at tool-chip interface during dry machining of AISI 1045 steel. Procedia Manuf. 2019, 33, 794–801. [Google Scholar] [CrossRef]
  15. Li, K.; Du, J.X.; Liu, L.L.; Shen, F.H.; Ma, L.J.; Pang, M.H. Effect of texture parameters on main cutting force and temperature of cutting tools. Tool Eng. 2019, 53, 42–46. [Google Scholar]
  16. Liu, Y.; Deng, J.; Wang, W.; Duan, R.; Meng, R.; Ge, D.; Li, X. Effect of texture parameters on cutting performance of flank-faced textured carbide tools in dry cutting of green Al2O3 ceramics. Ceram. Int. 2018, 44, 13205–13217. [Google Scholar] [CrossRef]
  17. Sharma, V.; Pandey, P.M. Geometrical design optimization of hybrid textured self-lubricating cutting inserts for turning 4340 hardened steel. Int. J. Adv. Manuf. Technol. 2017, 89, 1575–1589. [Google Scholar] [CrossRef]
  18. Guo, S.B.; Duan, X.Y.; Yi, Z.Y. Optimization of surface micro-texture parameters of Al2O3 /La2O3/ (W, Mo) C Cemented Carbide tool. Lub RIcation Eng. 2020, 45, 60–71. [Google Scholar]
  19. Tong, X.; Yang, S.C.; He, C.S.; Zheng, M.L. Multi-objective optimization of cutting performance of variable density micro-texture ball-end mlilling tool. J. Mech. Eng. 2019, 55, 221–232. [Google Scholar]
  20. Arulkirubakaran, D.; Senthilkumar, V.; Kumawat, V. Effect of micro-textured tools on machining of Ti–6Al–4V alloy: An experimental and numerical approach. Int. J. Refract. Met. Hard Mat. 2016, 54, 165–177. [Google Scholar] [CrossRef]
  21. Wang, B.; Zhang, J.Y.; Wu, C.L.; Deng, W.J. A numeric investigation of rectangular groove cutting with different lateral micro textured tools. KeyEng. Mat. 2016, 4283, 693. [Google Scholar] [CrossRef]
  22. Kishawy, H.A.; Salem, A.; Hegab, H.; Hosseini, A.; Elbestawi, M. An analytical model for the optimized design of micro-textured cutting tools. CIRP Annals. 2022, 71, 49–52. [Google Scholar] [CrossRef]
  23. Cheng, Y.T.; Zhang, X.; Xie, C.Y. Research on texture parameters optimization of Micro-Textured cutting tool for cutting CFRP. Mech. Sci. Technol. Aerosp. Eng. 2022, 6, 1–9. [Google Scholar]
  24. Li, B.B.; Chen, L.; Zhao, W.; Yu, M.; Zhang, K. Simulation study on texture parameter optimization of micro-textured tool. Mod. Manuf. Eng. 2020, 481, 91–96. [Google Scholar]
  25. Yu, Y.H.; Yang, S.B.; Ruan, W.X.; Xu, P.; Shen, J.X. Parameter optimization of offset parabolic micro texture. J. Ordnance Equip. Eng. 2023, 44, 225–233. [Google Scholar]
  26. Li, Y.B.; Wang, H.X.; Zhuang, K.J. Study on multi-objective optimization and high efficiency plunge milling experiment of titanium alloy for aviation. Mech. Sci. Technol. Aerosp. Eng. 2022, 41, 1921–1927. [Google Scholar]
  27. Xu, X.D.; Gong, Y.L.; Xia, T.F. Response surface experiment and multiobjective optimization of processing parameters based on deep hole. Manuf. Autom. 2022, 44, 1–4+37. [Google Scholar]
  28. Luan, X.N.; Zhang, Q.; Zhang, S.; Li, J.F. Power analysis and multi objective cutting parameter optimization in milling based on energy saving. Tool Eng. 2022, 56, 81–87. [Google Scholar]
Figure 1. Partial larger views of the nose of the micro-textured tools: (a) micropit; (b) micro-wave-groove; (c) micro-parallel-groove; (d) micro-elliptic-line-groove; (e) micro-arc-groove.
Lubricants 11 00249 g001
Figure 2. Cutting forces of the five micro-textured tools and a non-textured tool.
Lubricants 11 00249 g002
Figure 3. Cutting temperatures of the five micro-textured tools and a non-textured tool.
Lubricants 11 00249 g003
Figure 4. Wear depths of the tools: (a) micropit-textured tool; (b) micro-parallel-groove-textured tool; (c) micro-wave-groove-textured tool; (d) micro-elliptic-line-groove-textured tool; (e) micro-arc-groove-textured tool; (f) non-textured tool.
Lubricants 11 00249 g004
Figure 5. Machine tools and testing equipment used in the experiments.
Lubricants 11 00249 g005
Figure 6. Schematic diagram of the micro-texture parameters.
Lubricants 11 00249 g006
Figure 7. Partial larger views of micropit-textured tools with deferent parameters (A-B-C) processed using a femtosecond laser: (a) 60-50-120; (b) 80-60-120; (c) 80-50-100; (d) 100-40-140.
Lubricants 11 00249 g007
Figure 8. Wear of the rake faces of tools with different micro-texture parameters (the number in the upper right corner of the figure represents the value of parameters A, B, and C of the micro-texture).
Lubricants 11 00249 g008
Figure 9. Residual diagrams of the cutting force, cutting temperature, and wear area: (a) residual diagram of the cutting force; (b) residual diagram of the cutting temperature; (c) residual diagram of the tool wear area.
Lubricants 11 00249 g009
Figure 10. Three-dimensional response surface contour maps of the influence of the interaction of the micro-texture parameters on the cutting force, temperature, and wear area: (a) interaction of the diameter and spacing (BC) on the cutting force; (b) interaction of the edge distance and spacing (AC) on the cutting temperature; (c) interaction of the diameter and spacing (BC) on the tool wear area.
Lubricants 11 00249 g010
Figure 11. Real and predicted values: (a) cutting force; (b) cutting temperature; (c) tool wear area.
Lubricants 11 00249 g011
Figure 12. Pareto front diagrams: (a) cutting force–cutting temperature; (b) cutting force–wear area; (c) cutting temperature–wear area; (d) cutting temperature–wear area–cutting force.
Lubricants 11 00249 g012
Table 1. Simulation results of the micro-textured tools with different morphologies.
Micro-Texture
Morphology
Average Cutting Temperature (°C)Average Cutting Force (N)Wear Depth
(mm)
Micropit115205.230.00182
Micro-parallel-groove105232.820.00218
Micro-wave-groove108247.480.00202
Micro-elliptic-line-groove109259.150.00262
Micro-arc-groove115256.410.00346
Non-textured141272.80.00417
Table 2. Micro-texture parameter levels.
Level/Factor A   ( μ m ) B   ( μ m ) C   ( μ m )
−16040100
08050120
110060140
Table 3. Combination scheme of micropit texture parameters.
NO. A   ( μ m ) B   ( μ m ) C   ( μ m )
18050120
26050100
38050120
410050100
58050120
68050120
76040120
88040140
98060140
1010060120
116050140
1210040120
136060120
148050120
158060100
1610050140
178040100
Table 4. Cutting force, temperature, and wear area of the cutting tools under different micro-texture parameters.
No.A
( μ m )
B
( μ m )
C
( μ m )
Cutting   F o r c e (N) Cutting
Temperature (°C)
Wear   Area   ( μ m 2 )
0---240.99138109,938
18050120233.0312381,730
210040120238.3512392,069
36040120240.31112101,138
46050140249.3311687,024
58040140250.3513093,261
66050100233.3810882,891
78060140262.8912880,070
88050120230.4712581,730
98050120228.0912881,730
108060100211.0810972,021
118050120236.212581,730
1210060120201.4210870,709
138040100239.3811895,499
1410050140243.3210281,427
156060120229.412475,050
168050120231.4712681,730
1710050100228.4911476,024
Table 5. Variance analysis of the cutting force.
Source of VarianceSum of SquaresFreedomMean Square ValueF Statisticsp
Model2866.599318.516.590.0106
A208.491208.494.310.0765
B505.621505.6210.460.0144
C1094.1811094.1822.630.0021
AB169.261169.263.500.1035
AC0.3110.310.010.9381
BC416.981416.988.620.0218
A248.34148.341.000.3506
B25.0315.030.100.7564
C2435.191435.199.000.0199
Residual338.46748.35
Misfitting term301.963100.6511.030.0210
Pure error36.5049.13--
Total dispersion3205.0416---
Table 6. Variance analysis of the cutting temperature.
Source of VarianceSum of SquaresFreedomMean Square ValueF Statisticsp
Model1471.699163.527.810.0065
A325.131325.1315.530.0056
B2.0012.000.100.7663
C528.131528.1325.230.0015
AB12.25112.250.590.4693
AC361.001361.0017.240.0043
BC42.25142.252.020.1984
A28.2518.250.390.5500
B2186.201186.208.890.0204
C25.0915.090.240.6369
Residual146.55720.94
Misfitting term145.75348.58242.920.0001
Pure error0.840.20--
Total dispersion1618.2416---
Table 7. Variance analysis of the tool wear area.
Source of VarianceSum of SquaresFreedomMean Square ValueF Statisticsp
Model0.407690.045338.82<0.0001
A0.106710.106727.070.0013
B0.079410.0794286.11<0.0001
C0.000310.00039.520.01766
AB0.027210.02721.810.2207
AC0.002510.00250.130.7286
BC0.075610.07568.560.0222
A20.160110.16010.000.9935
B20.000710.000715.550.0056
C20.042110.04210.310.5940
Residual0.008270.0012
Misfitting term0.005030.00174.140.2465
Pure error0.003240.0008--
Total dispersion0.415816---
Table 8. Results of 27 full-factor experiments.
NO.A
( μ m )
B
( μ m )
C
( μ m )
Cutting Force
(N)
Cutting Temperature (°C) Wear   Area   ( μ m 2 )
18040120263.3813090,107
28040140280.3513493,261
36060140249.4912185,264
48050120221.4712881,730
510040140270.4313289,657
66060100246.4311371,294
710060140244.7912871,863
86040140282.6612999,963
98060120217.4611877,565
1010060120201.4210870,709
118050100258.8312479,852
128060100219.0811172,021
1310050100257.0311480,364
146040100268.6812491,526
1510040120262.3512392,069
166050140269.3312687,024
176050120267.3912582,664
1810040100287.6112790,659
1910050140258.8212183,693
206050100263.3811682,891
2110060100211.9510669,654
228060140240.8912380,070
236040120259.31128101,138
246060120234.4311979,519
2510050120243.3911682,687
268040100273.3512187,696
278050140260.3312585,542
Table 9. The cutting force predicted using the RBF and BP neural networks.
NO.Real Value (N)RBFBP
Predicted Value (N)Relative ErrorPredicted Value (N)Relative Error
18287.61276.853.74%284.001.26%
19258.82260.030.47%256.740.80%
20263.38264.030.25%258.861.72%
21211.95219.813.71%225.476.38%
22240.89242.100.50%248.263.06%
23259.31263.051.44%261.500.85%
24234.43231.241.36%233.300.48%
25243.39238.691.93%236.051.23%
26273.35274.550.44%279.332.19%
27260.33263.451.20%266.532.38%
Table 10. The cutting temperature predicted using the RBF and BP neural networks.
NO.Real Value (°C)RBFBP
Predicted Value (°C)Relative ErrorPredicted Value (°C)Relative Error
18127127.450.35%125.461.21%
19121124.262.69%119.271.43%
20116119.432.96%121.544.78%
21106108.412.27%108.892.73%
22123121.890.90%119.592.77%
23128128.470.37%127.460.42%
24119119.480.40%121.201.85%
25116117.010.87%114.601.21%
26121121.790.65%124.843.17%
27125128.652.92%142.934.34%
Table 11. The wear area predicted using the RBF and BP neural networks.
NO.Real Value (μm2)RBFBP
Predicted Value (μm2)Relative ErrorPredicted Value (μm2)Relative Error
1890,65986,380.913.72%88,426.992.46%
1983,69383,131.800.67%83,727.810.04%
2082,89182,918.220.03%80,317.383.10%
2169,65469,338.830.45%71,533.492.70%
2280,07077,311.253.44%78,919.891.44%
23101,13894,246.546.81%94,658.556.41%
2479,51977,204.462.91%82,610.453.89%
2582,68779,981.913.27%81,471.141.47%
2687,69688,738.771.19%87,830.360.15%
2785,54285,489.670.61%87,749.012.58%
Table 12. Pareto optimal solution set.
NO.A
( μ m )
B
( μ m )
C
( μ m )
Cutting Force
(N)
Cutting Temperature (°C)Wear Area
( μ m 2 )
110060100210.64105.2469,138.00
210060107.85208.94108.1370,213.15
398.9859.99100.26210.83105.3369,175.35
Table 13. Comparison of results between the two optimization algorithms.
AlgorithmCutting Force (N)Relative Error of Cutting ForceCutting Temperature (°C)Relative Error of Cutting TemperatureWear Area (μm2)Relative Error of Wear Area
RSM216.7956.59%1173.42%72,697.40.94%
RBF-NSGA-II 210.642.83%105.242.62%69,1380.29%
Disclaimer/Publisher’s Note: The statements, opinions and data contained in all publications are solely those of the individual author(s) and contributor(s) and not of MDPI and/or the editor(s). MDPI and/or the editor(s) disclaim responsibility for any injury to people or property resulting from any ideas, methods, instructions or products referred to in the content.

