Article

Analysis of Tool Wear in GH4169 Material Milling Process

College of Mechanical and Electrical Engineering, Changchun University of Science and Technology, Changchun 130022, China
*
Author to whom correspondence should be addressed.
Lubricants 2023, 11(6), 245; https://doi.org/10.3390/lubricants11060245
Submission received: 18 May 2023 / Revised: 27 May 2023 / Accepted: 30 May 2023 / Published: 1 June 2023
(This article belongs to the Special Issue Friction and Wear of Cutting Tools and Cutting Tool Materials)

Abstract

:
Nickel-based superalloy GH4169 is a material with strong mechanical properties and is difficult to process. In order to reduce tool wear during material processing and improve the workpiece surface processing quality, based on the finite element simulation software DEFORM, the influence of n, ap, and fz parameters on tool wear during carbide tool milling GH4169 was studied, and a simulation of an orthogonal experimental model was established. The prediction model of tool wear was obtained. The ultrasonic vibration milling was compared with ordinary milling, and the improvement degree of different coating materials on carbide tool wear was explored. The results showed that the ultrasonic vibration signal is helpful to reduce tool wear, improve the surface quality of the workpiece, and improve the stability of the milling process. TiAlN/TiN (WC)-composite-coated tools have good cutting performance, help to reduce tool temperature, reduce tool wear, and improve tool life.

1. Introduction

Nickel-based high-temperature alloys have high yield strength, tensile strength, and endurance strength below 700 °C, as well as good oxidation and corrosion resistance, and forming and welding performance. Therefore, they are widely used in industries such as aerospace, petroleum, chemical, and shipbuilding. Inconel 718 is one of the important nickel-based alloys, accounting for 35% of the total nickel-based alloy output [1]. It has a wide range of applications, from rotating and stationary parts of aerospace engines to high-strength bolts and fasteners, acid gas wells and pipeline petrochemical equipment, nuclear power plant components for nuclear reactors and spacecraft, marine shafting and extrusion dies, and gas turbine engines, steam turbines, and missile parts [2,3]. While nickel-based superalloy has many advantages, it also has many disadvantages in the machining process: large plastic deformation, high cutting temperature, serious tool wear, chip bending, and serious hardening of the machined surface. [4,5] At present, the demand for GH4169 superalloy in the manufacturing market is growing, and the processing requirements are also increasing, which makes the processing technology of nickel-based superalloy need to keep pace with the times. In recent years, domestic and foreign experts and scholars have studied the processing methods, cutting parameters, and tool materials in the milling process of high-temperature nickel-based alloy. Combining simulation and experiment, they continue to optimize the material processing performance, reduce tool wear, and reduce processing costs. We have achieved fruitful results.
The accurate prediction of tool wear profile plays an important role in guiding industrial production. An accurate prediction model helps the machining process to be carried out under reasonable cutting conditions, and more accurately grasp the tool change time and strategy.
On the basis of reducing processing time and cost, the requirements for the surface quality and functionality of components need to be met. The prediction formula of tool wear mainly includes an empirical formula, a formula based on the wear mechanism, the finite element method, and the artificial intelligence method [6,7,8]. The earliest and most commonly used method relies on empirical formulas to predict tool life and determine tool change timing, with the most famous being the Taylor tool life formula and tool life formula [9]. Considering the complexity of the machining process, which involves numerous physical quantities, these empirical formulas often have a relatively simple form and contain fewer parameters. They mainly describe the relationship between tool life and machining parameters. For machining processes where machining conditions vary within a certain range, these empirical formulas usually perform well and are widely used for predicting tool life under long-term stable cutting conditions in industrial production. In addition to the effective prediction of tool wear, experts and scholars have changed the processing methods and tool materials to reduce tool wear.
Ultrasonic-vibration-assisted milling is a machining method that applies ultrasonic vibration to the milling cutter or workpiece, and controls its vibration frequency, amplitude, and direction to achieve periodic high-frequency separation of the tool and workpiece. Compared with traditional milling, ultrasonic-vibration-assisted milling can reduce the cutting force and cutting temperature, reduce tool wear, facilitate chip breaking, and improve surface quality [10,11,12,13,14,15]. Milling is a machining method in which multiple cutting edges alternate and participate in cutting. After applying vibration, the cutting performance improves more significantly. Therefore, ultrasonic-vibration-assisted milling is widely studied and applied [15,16,17,18,19,20].
In order to achieve high-speed and efficient cutting of nickel-based high-temperature alloys, many scholars at home and abroad have begun to study cutting tools suitable for machining nickel-based alloys, that is, to explore the machinability and tool failure mechanism of different tool materials when machining Inconel 718 alloy [21,22,23].
In this paper, the empirical formula of tool wear prediction is established by means of multiple linear regression, and the accuracy of the prediction model is verified by range analysis. The mechanism of tool wear in the milling process of Inconel 718 nickel-based superalloy is studied. The chip shape, milling area temperature, equivalent stress of the workpiece surface, tool temperature, and tool wear in the process of vibration milling and ordinary milling are compared and analyzed, and the advantages of ultrasonic vibration milling are obtained. The influence of coating materials, TIALN, TIN, and their composite coating materials on tool wear is explored, which provides a theoretical basis for predicting tool wear and reducing tool wear.

2. Establishment of GH4169 Simulation Model for Hard Alloy Milling

In the actual machining process of nickel-based superalloy, the machining surface precision of the workpiece is low, the tool is easy to collapse, and there is serious tool wear. In the process of machining, the tool needs to be changed many times, the machining efficiency is low, and the capital cost is large. With the rapid development of computer-aided technology, the finite element simulation technology is widely used in the field of metal cutting. Through the finite element simulation technology, not only can the test cost be reduced, but also the test cycle can be shortened, Revealing the essence of the actual cutting process and predicting potential problems that may arise during the actual cutting process, the application of finite element simulation technology has good guiding significance for actual production and processing. In this paper, the finite element software DEFORM is used to establish the simulation model of the carbide tool milling of GH4169, and to analyze the influence of three cutting elements on carbide tool wear.

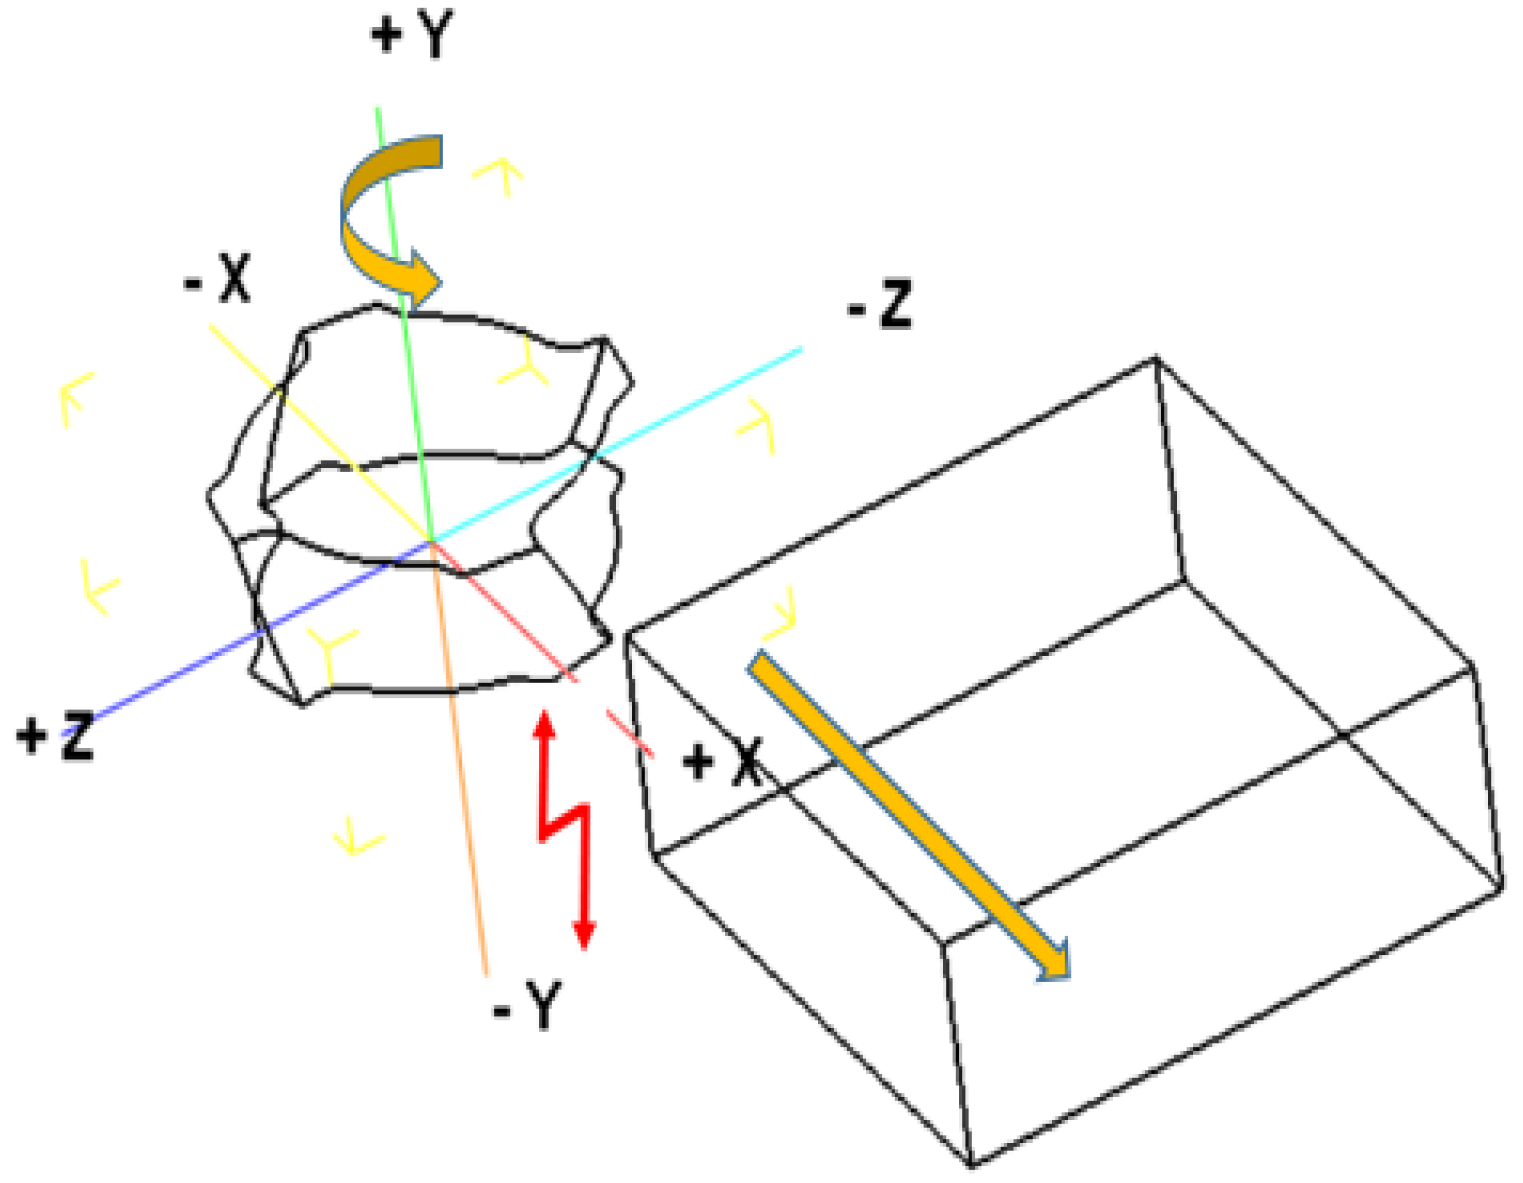
2.1. Establishment of Geometric Modeling of Tool and Workpiece

In order to be closer to actual machining, this simulation will make the model of the end milling cutter as close as possible to the actual situation. The specific parameters are shown in Table 1. The workpiece size is 14 mm × 14 mm × 5 mm, and the milling model is shown in Figure 1.

2.2. Setting Up Workpiece and Tool Materials and Grid Division

The tool is set as a rigid body and the workpiece as a plastic body. The material of the tool selected in the experimental section of this article is WC, and nickel-based high-temperature alloy GH4169 (Inconel 718) is used as the material of the workpiece. In this model, the tool set grid is 32,000, the workpiece set grid is 30,000, the minimum grid size of the tool is 0.131 mm, and the minimum grid size of the workpiece is 0.121 mm. The parts in the contact area between the tool and the workpiece are divided into local grids, with refinement ratios of 0.1 and 0.0001, as shown in Figure 1.

2.3. Tool and Workpiece Simulation of Working Condition Settings

The milling width is set to 3 mm, the ambient temperature is set to 20 °C, the convective heat transfer coefficient is set to 0.02 N/sec/mm/C, the friction coefficient is set to 0.6, and the thermal conductivity coefficient is set to 45 N/sec/mm/C. This article uses the Usui wear model in DEFORM, which is more suitable for continuous machining processes, such as metal cutting, and its main form of wear is adhesive wear.
The following shows Usui’s tool wear model:
w = ap v e b / T d t
This formula is generally used for continuous processes such as metal cutting (adhesive wear), where p—contact surface pressure; v—sliding speed; T—contact surface temperature; dt—time increment. The classic values for cutting are a = 0.00001 and b = 855, where a and b are characteristic constants (mainly determined by cutting parameters and materials).

2.4. Establishment of Tool Wear Prediction Model for Ordinary Milling

In the book Metal Cutting Principles [24], the process of the multiple linear regression method to solve the cutting force and tool temperature prediction model is mentioned. Based on this method, the tool wear prediction model is obtained.
First, the orthogonal experiment was established to study the influence of spindle speed, feed per tooth, and cutting depth on tool wear. Compared with multi-tooth continuous cutting, the tool wear of this intermittent cutting simulation is smaller, and the wear difference between teeth is larger.
The selection of orthogonal experimental factors and levels needs to follow certain principles. There are different orthogonal experimental tables for different factors and levels. Choosing a suitable orthogonal experimental plan can generally be divided into the following steps:
(1)
Determine the number of columns, which is the number of influencing factors.
(2)
Determine the number of levels, which means that each factor has several different values.
(3)
Select an orthogonal table, mainly based on the number of columns and levels determined in the first two steps.
(4)
After consulting the process manual related to nickel based high-temperature alloys [25] and the recommended cutting amount for hard alloy cutting tools, 16 sets of orthogonal experiments were designed with 3 factors, 4 levels, and the experimental factors were axial cutting depth ap, spindle speed n, and feed rate fz per tooth. From the actual situation, the values of each factor level are within the operating range of the machine tool, and the experimental parameter range is as follows:
(1)
Spindle speed n: 3000–4500 r/min;
(2)
Axial cutting depth ap: 0.2–0.5 mm;
(3)
The feed rate per tooth fz: 0.1–0.4 mm/z.
The orthogonal experiment and simulation data are shown in Table 2:
The logarithm of the milling parameters H, n, ap, and fz in the table are taken and converted into a multiple linear regression matrix in the form of:
Y H = 0.2541 0.3019 0.4647 0.4547 0.4123 0.1090 0.4572 0.3526 0.6819 0.4908 0.0043 0.1904 0.5100 0.4401 0.1439 0.0467   X = 1 3.4771 0.6990 1.0000 1 3.4771 0.5229 0.6990 1 3.4771 0.3979 0.5229 1 3.4771 0.3010 0.3979 1 3.5441 0.6990 0.6990 1 3.5441 0.5229 1.0000 1 3.5441 0.3979 0.3979 1 3.5441 0.3010 0.5229 1 3.6021 0.6990 0.5229 1 3.6021 0.5229 0.3979 1 3.6021 0.3979 1.0000 1 3.6021 0.3010 0.6990 1 3.6532 0.6990 0.3979 1 3.6532 0.5229 0.5229 1 3.6532 0.3979 0.6990 1 3.6532 0.3010 1.0000
The M file is established through MATLAB software, and the tool wear value and milling parameters in the formula are input into the program for multiple linear regression [26,27] calculation and then input in MATLAB:
y = [−0.2541, −0.3019, −0.4647, −0.4547, −0.4123, −0.1090, −0.4572, −0.3526, −0.6819, −0.4908, 0.0043, −0.1904, −0.5100, −0.4401, −0.1439, −0.0467];
x1 = [3.4771, 3.4771, 3.4771, 3.4771, 3.5441, 3.5441, 3.5441, 3.5441, 3.6021, 3.6021, 3.6021, 3.6021, 3.6532, 3.6532, 3.6532, 3.6532];
x2 = [−0.6990, −0.5229, −0.3979, −0.3010, −0.6990, −0.5229, −0.3979, −0.3010, −0.6990, −0.5229, −0.3979, −0.3010, −0.6990, −0.5229, −0.3979, −0.3010];
x3 = [−1.0000, −0.6990, −0.5229, −0.3979, −0.6990, −1.0000, −0.3979, −0.5229, −0.5229, −0.3979, −1.0000, −0.6990, −0.3979, −0.5229, −0.6990, −1.0000];
X = [ones (length (y), 1), x1’, x2’ x3’];
Y = y’;
[b, bint, r, rint, stats] = regress (Y, X);
b, bint, stats
According to the results obtained from MATLAB, a0 = −1.9922, a1 = 0.4112, a2 = 0.5345, and a3 = −0.6866. Therefore, the multiple regression model is: y = −1.9922 + 0.4112x1 + 0.5345x2 − 0.6866x3.
The empirical formula for predicting the maximum wear of cutting tools can be obtained from the above: H = 0.01∙n0.4112∙ap0.5345∙fz−0.6866.

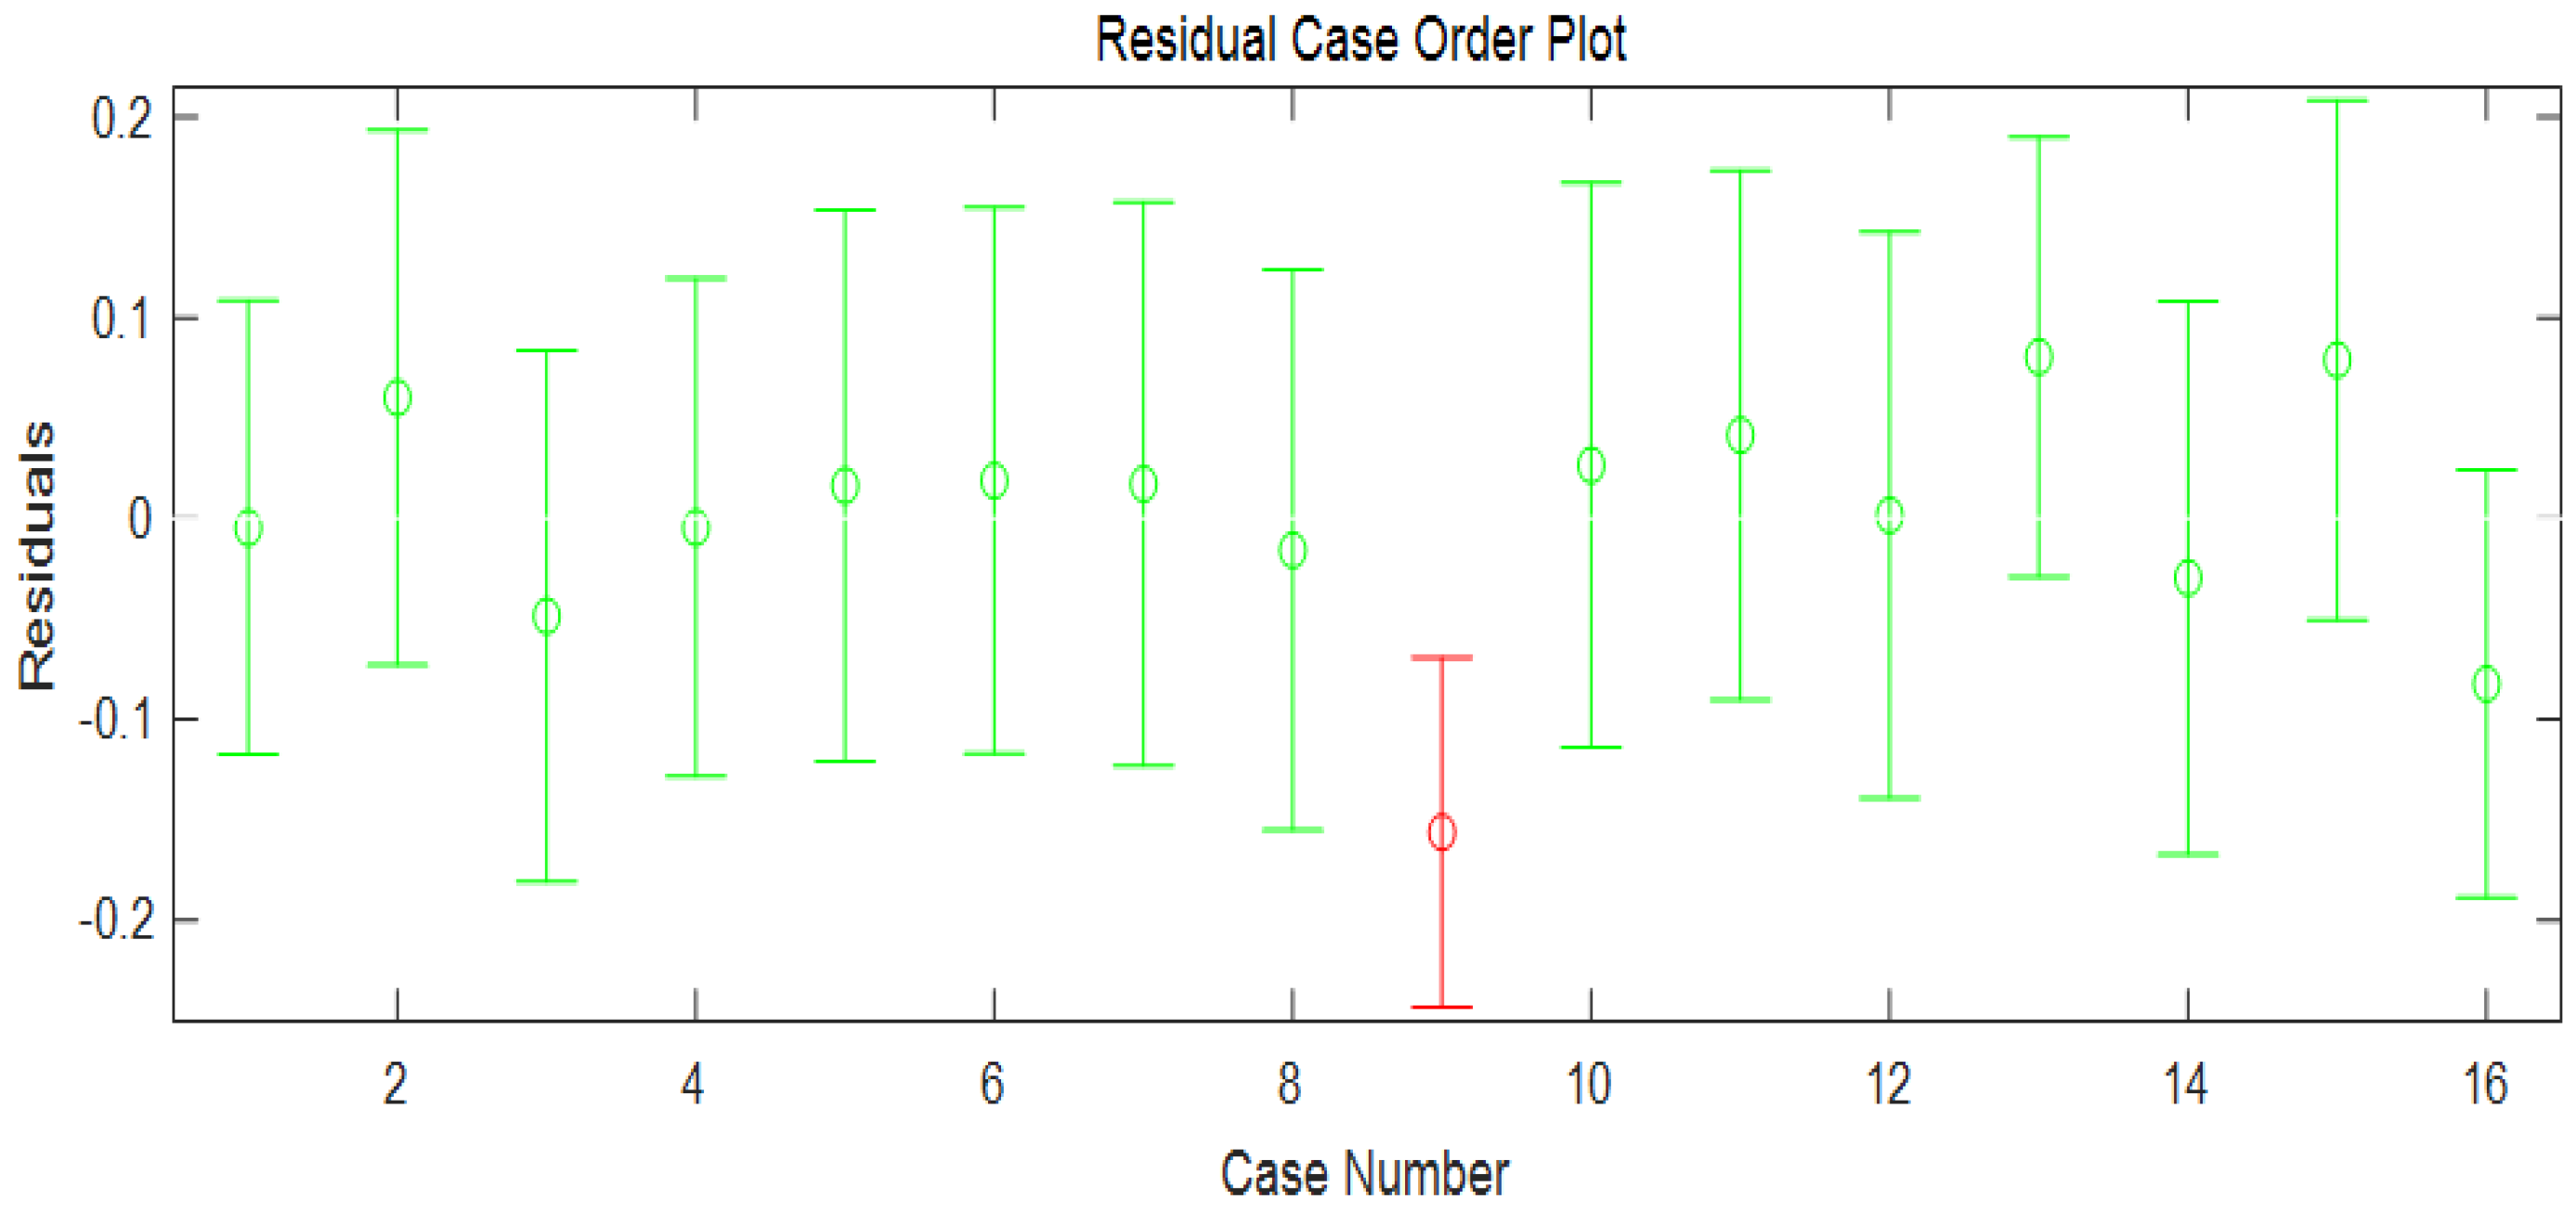
2.5. Linear Regression Significance Test

According to the results obtained from MATLAB, it can be concluded that:
(1)
Tool wear regression system array:
In order to test the fitting degree of tool wear regression model, the significance analysis is carried out below. Use MATLAB to obtain the regression coefficients and confidence intervals, as shown in Table 3:
Obtain the statistical variable parameter stats as: R2 = 0.9016, F = 36.6678, and p = 0.0000. They indicate a significant difference in p < α = 0.05.
Residual analysis is performed on this coefficient and rcoplot (r, rint) is input in the MATLAB window to obtain the residual plot as shown in Figure 2:
From the residual analysis chart, it can be seen that except for the ninth data point, the residuals of all other data are close to zero, and the confidence intervals of the residuals all include zero, indicating that the regression model can better match the original data. The ninth data point can be regarded as an outlier, and it is believed that the regression model is reliable [28].
From the above, it can be concluded that the regression model y = −1.9922 + 0.4112x1 + 0.5345x2 − 0.6866x3 is valid. Therefore, the empirical formula for maximum tool wear H = 0.01∙n0.4112∙ap0.5345∙fz−0.6866 has high significance.

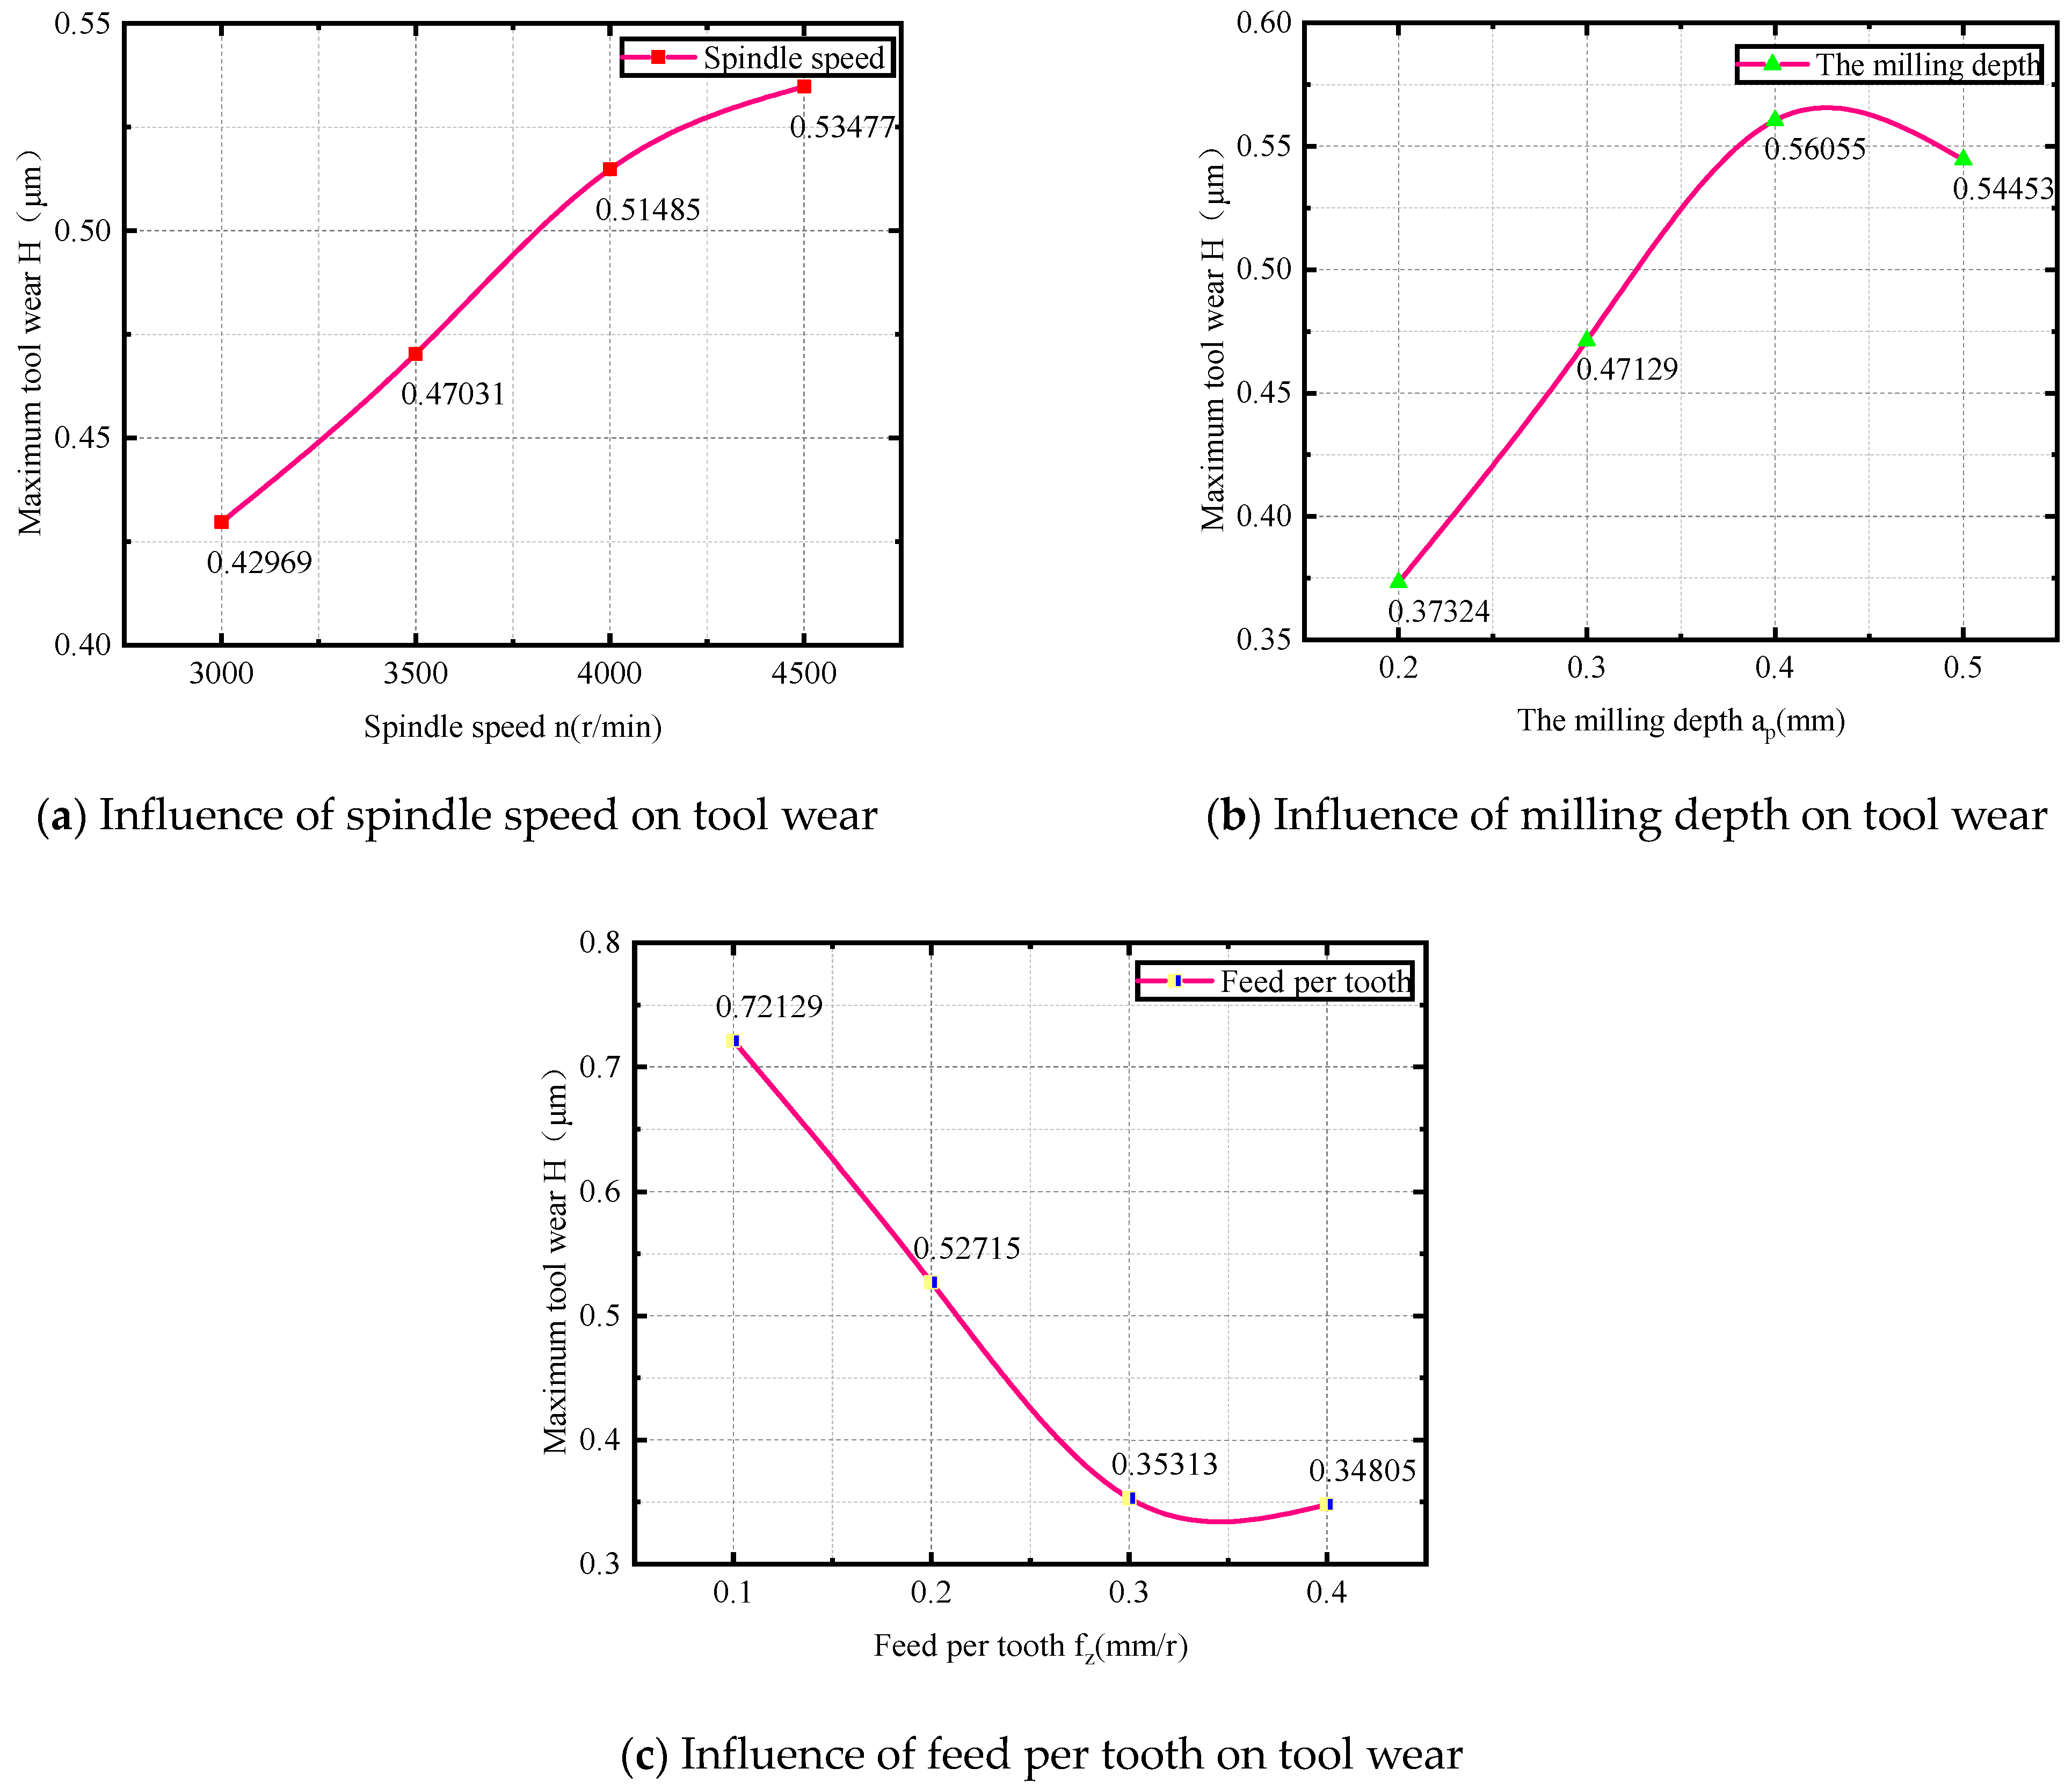
2.6. Analysis of Impact Patterns

The range analysis method can be used in the analysis of orthogonal experimental results to obtain the primary and secondary order of the influence of various factors on the target parameters, the optimal combination scheme, and the influence law of the influencing factors on the target parameters [29]. Therefore, it has a wide range of applications. The formula for calculating the range is as follows:
k i j = K i j j R j = max ( k i j ) min ( k i j )
where k i j , K i j —range and sum of ranges at the level of factor i in column j, respectively; i, j—the level and factors of the experiment, respectively; Rj—the maximum range value of the factor.
k1~k4 are the average values of the test results for factors such as spindle speed n, milling depth ap, and feed rate fz per tooth at levels 1–4, respectively. RF is the maximum value of the range of different influencing factors, which reflects the degree of change in the simulation test results when the factor changes. The larger the value of RF, the greater the impact of this influencing factor on the simulation results. According to the simulation experimental data, the range of maximum tool wear (H) is shown in Table 4:
Figure 3 shows the trend of the influence of spindle speed n, axial cutting depth ap, and feed rate fz per tooth on the maximum wear of the tool. Based on this graph, the variation in the maximum wear of the tool when each parameter changes can be intuitively seen. By analyzing the range table and indicator factor trend chart, it can be concluded that:
(1) The range analysis method is used to determine the degree of influence of different parameters (fz, ap, n) on the research object (H). The RF value of fz is the largest through calculation, so the feed rate per tooth has the largest impact on tool wear, followed by ap, and finally the speed n. Therefore, the order of influence on tool wear is: fz > ap > n. From the perspective of reducing tool wear, the optimal combination of milling parameters is n = 3000 r/min, ap = 0.2 mm, and fz = 0.4 mm/z.
(2) It can be seen from Figure 3a that the tool wear increases with the increase in the spindle speed. When the speed is between 3000 and 4000 r/min, the increment in the maximum tool wear is relatively large. When the speed is between 4000 and 5000 r/min, the increment in tool wear decreases. As the rotational speed increases, the thickness of the workpiece material in contact with the tool per unit time also increases, and the impact force received is relatively large. The cutting force also increases, resulting in a sharp increase in tool wear. As the spindle speed increases to a certain extent, the chip is generated faster, which will take away most of the heat, the tool temperature decreases, and the tool wear speed is eased.
(3) It can be seen from Figure 3b that with the increase in axial cutting depth, the tool wear is gradually increasing. When the axial cutting depth increases from 0.2 mm to 0.4 mm, the removal of material by the tool increases, resulting in an increase in work done and an increase in cutting force and temperature in the milling area, leading to an increase in tool wear. It should be noted that when the cutting depth is small or microscopic, it can cause scraping or only cut to the hardened layer on the surface of the workpiece, resulting in significant wear of the tool and a decrease in tool life. Especially when rough-machining the workpiece, the cutting depth should be increased as much as possible within the allowable range of machine power and technology. When the axial cutting depth is 0.4–0.5 mm, the tool wear is relatively reduced. In the cutting process, more heat is taken away due to the chip falling, and the tool temperature is also reduced, which alleviates the tool wear. In general, the tool wear increases with the increase in the axial cutting depth.
(4) The quantitative analysis of Figure 3c shows that when the feed per tooth increases, the tool wear gradually decreases, and when fz = 0.4 mm/z, the tool wear reaches the minimum of 0.34805 μm.

3. Comparative Analysis of Ultrasonic Vibration Milling and Ordinary Milling

At present, ultrasonic-vibration-assisted machining is more and more widely used in the field of difficult-to-machine materials. Ultrasonic vibration milling is conducive to chip fracture, greatly reducing the temperature of the tool and workpiece area, reducing the vibration of sudden contact between the tool and workpiece, reducing tool wear, reducing the milling force, and improving system stability, and it is conducive to obtaining high-precision surface quality and lower surface roughness. In this paper, the GH4169 model of carbide tool vibration milling is established, and the ultrasonic vibration is compared with ordinary milling in order to reduce tool wear and improve the workpiece surface processing quality.

3.1. Establishment of GH4169 Model for Cemented Carbide Vibration Milling

According to the principle of axial ultrasonic vibration, a low-frequency and periodic vibration is added to the milling cutter along the axial direction of the tool, as shown in Figure 4. The tool movement path is planned. The motion of the tool relative to the workpiece consists of three parts, as shown in the figure: (1) the milling cutter rotates along its own axis; (2) the milling cutter moves uniformly along the feed direction of the workpiece in a straight line; and (3) the milling cutter oscillates at a low frequency along its own axis.
The motion equation of the milling cutter center is [30]:
X 1 = V f t Z 1 = 0 y 1 = A s i n 2 π f t + φ 0
The parameters used in this simulation are: f = 20 Hz, A = 10 μm, N = 6000 rad/min, fz = 0.1 mm/z, ap = 0.2 mm, and φ0 = 0.
Then, the above formula is transformed into:
X 1 = 40 t Z 1 = 0 y 1 = 0.01 s i n 40 π t
MATLAB is used to generate a vibration displacement map in the y-direction, then the data are exported and imported into the DEFORM path chart. The generated tool path is shown in Figure 5.

3.2. Comparison of Results between Axial Ultrasonic Vibration Milling and Ordinary Milling

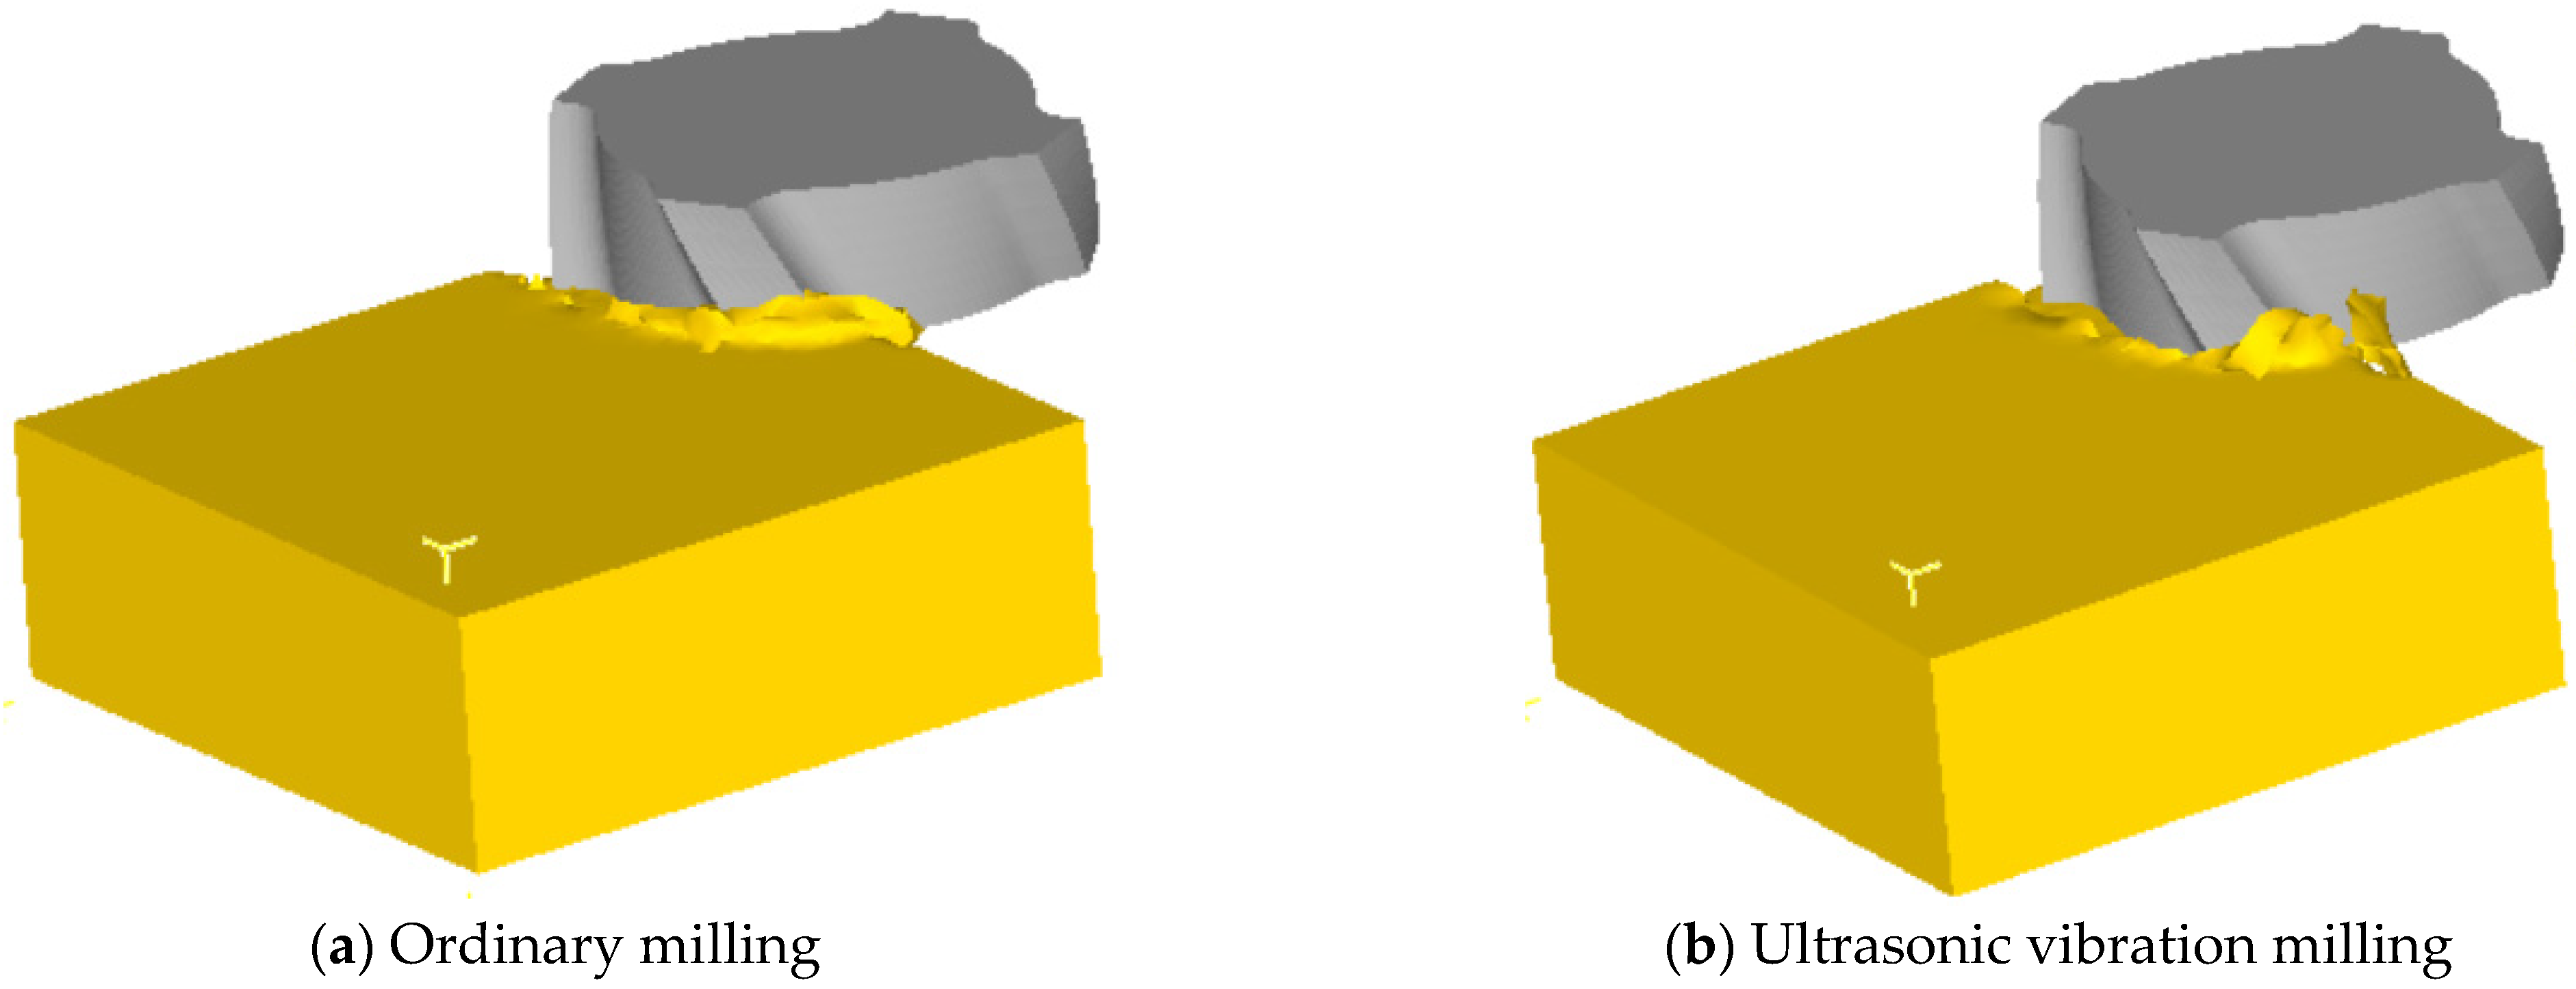
3.2.1. Comparison of Chip Shapes

When cutting GH4169 stably with hard alloy, a tool stroke of 8.5 mm is selected, as shown in Figure 6. The chips from ordinary milling appear as ribbons, while the chips from vibration milling have already broken. Under low-frequency vibration, the difference in chip shape is not significant, and the chips from vibration milling are more prone to fracture. In terms of chip breakage, ordinary milling is a physical chip, and the chips are squeezed by the tool and the workpiece. Chip fracture depends on the material’s inherent performance, and uncontrollable chip length and chip breakage. Vibration milling belongs to geometric chip breaking, and low-frequency vibration will accelerate chip fracture, with controllable chip length and chip breaking. The fracture of chips not only helps to release heat but also helps to transmit stress, prevent stress concentration, and avoid chips sticking to the tool, replacing the tool for cutting, thereby affecting the quality and roughness of the machining surface. At the same time, it also reduces the adhesive wear caused by the detachment of chips bonded to the tool.

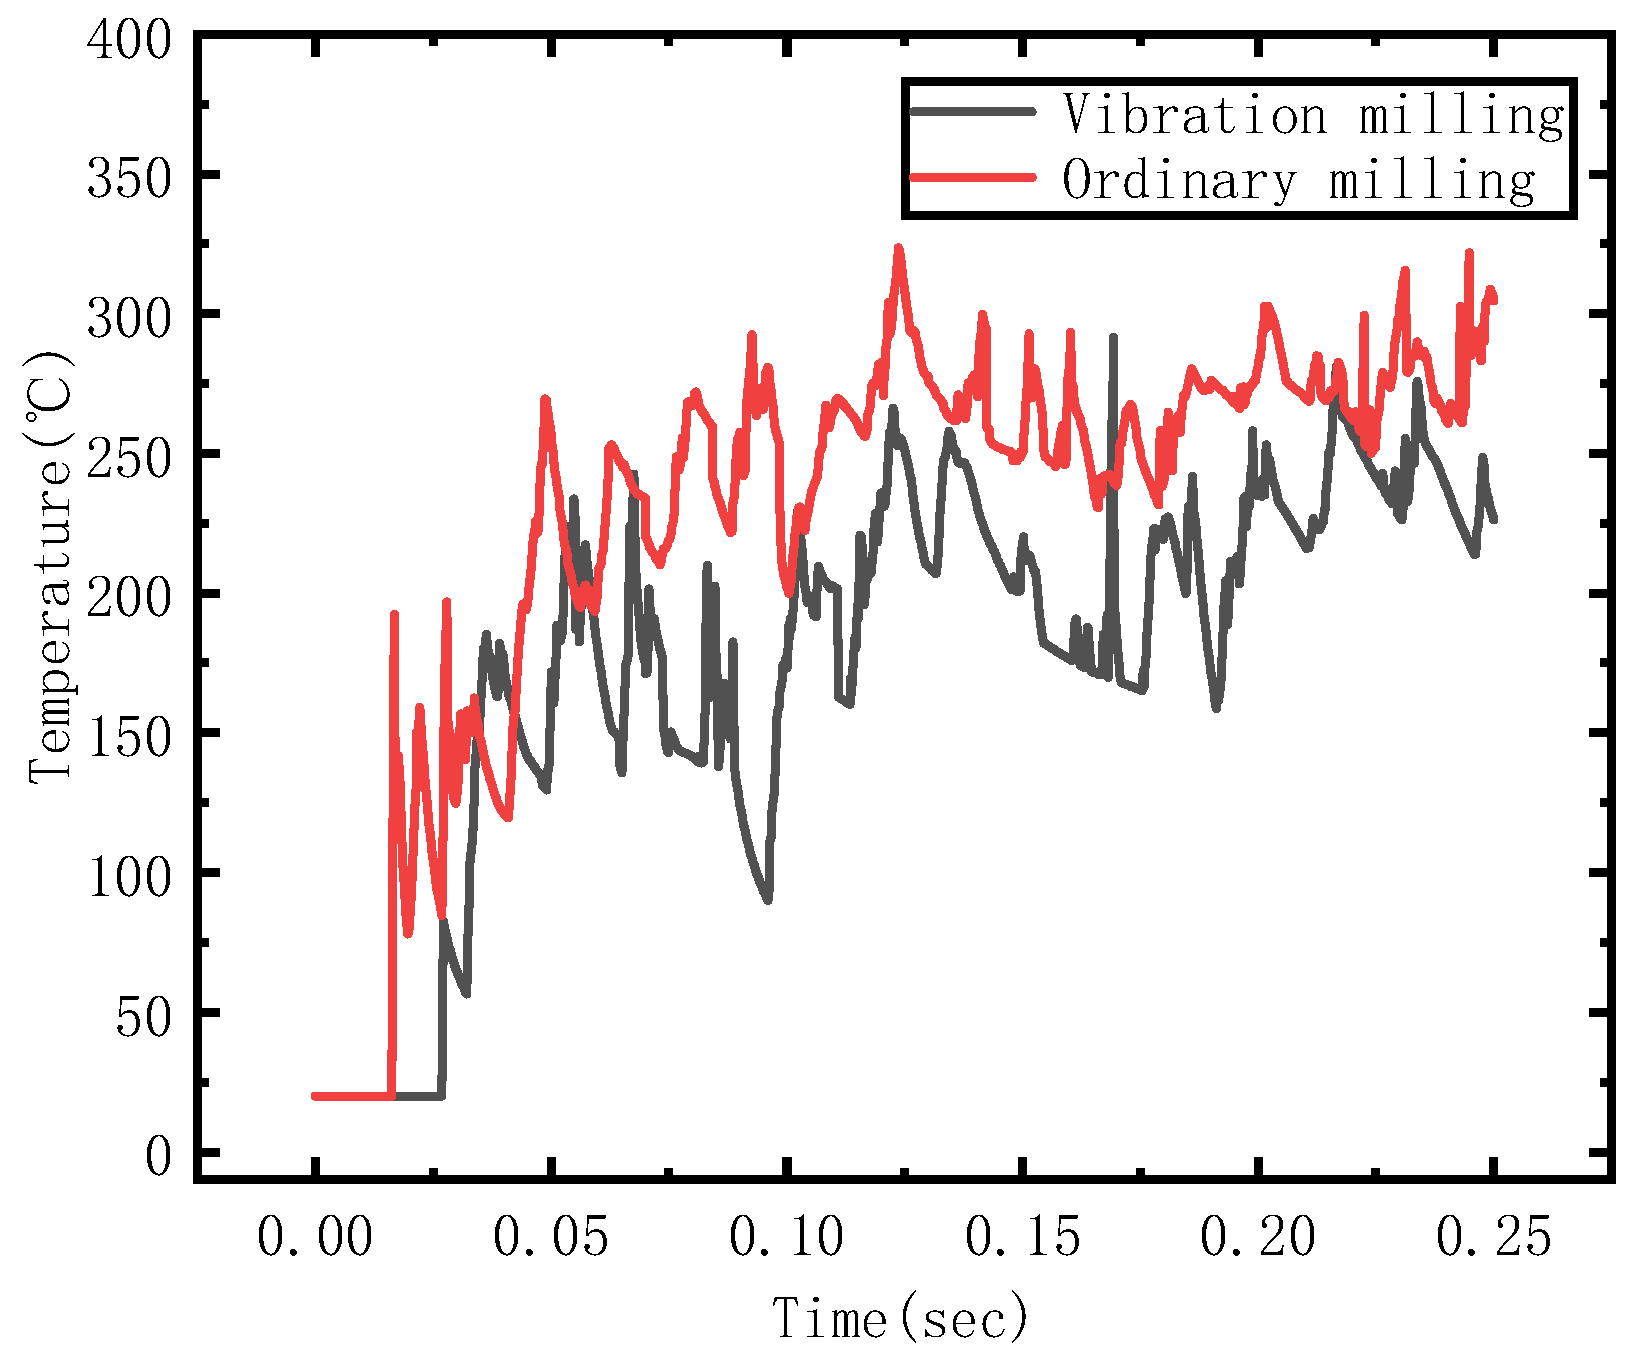
3.2.2. Temperature Comparison in Milling Area

According to Figure 7, it can be clearly seen that when the tool first comes into contact with the workpiece, there is a significant sudden change in the temperature of ordinary milling, while the temperature of vibration milling increases relatively slowly. The range of temperature changes in the ordinary milling area is large, indicating that vibration milling alleviates the impact force of the tool on the workpiece, reduces the cutting force, and decreases the temperature of the cutting area. When the cemented carbide is stably milling GH4169, the temperature of the ordinary milling area is between 200 and 300 °C, and the temperature of vibration milling is lower than that of ordinary milling. This is because in the process of vibration milling, the chip is more likely to break, and the chip takes away a lot of heat. At the same time, the contact process between the tool and the workpiece is in a state of fluctuation, making the heat easier to transfer out.

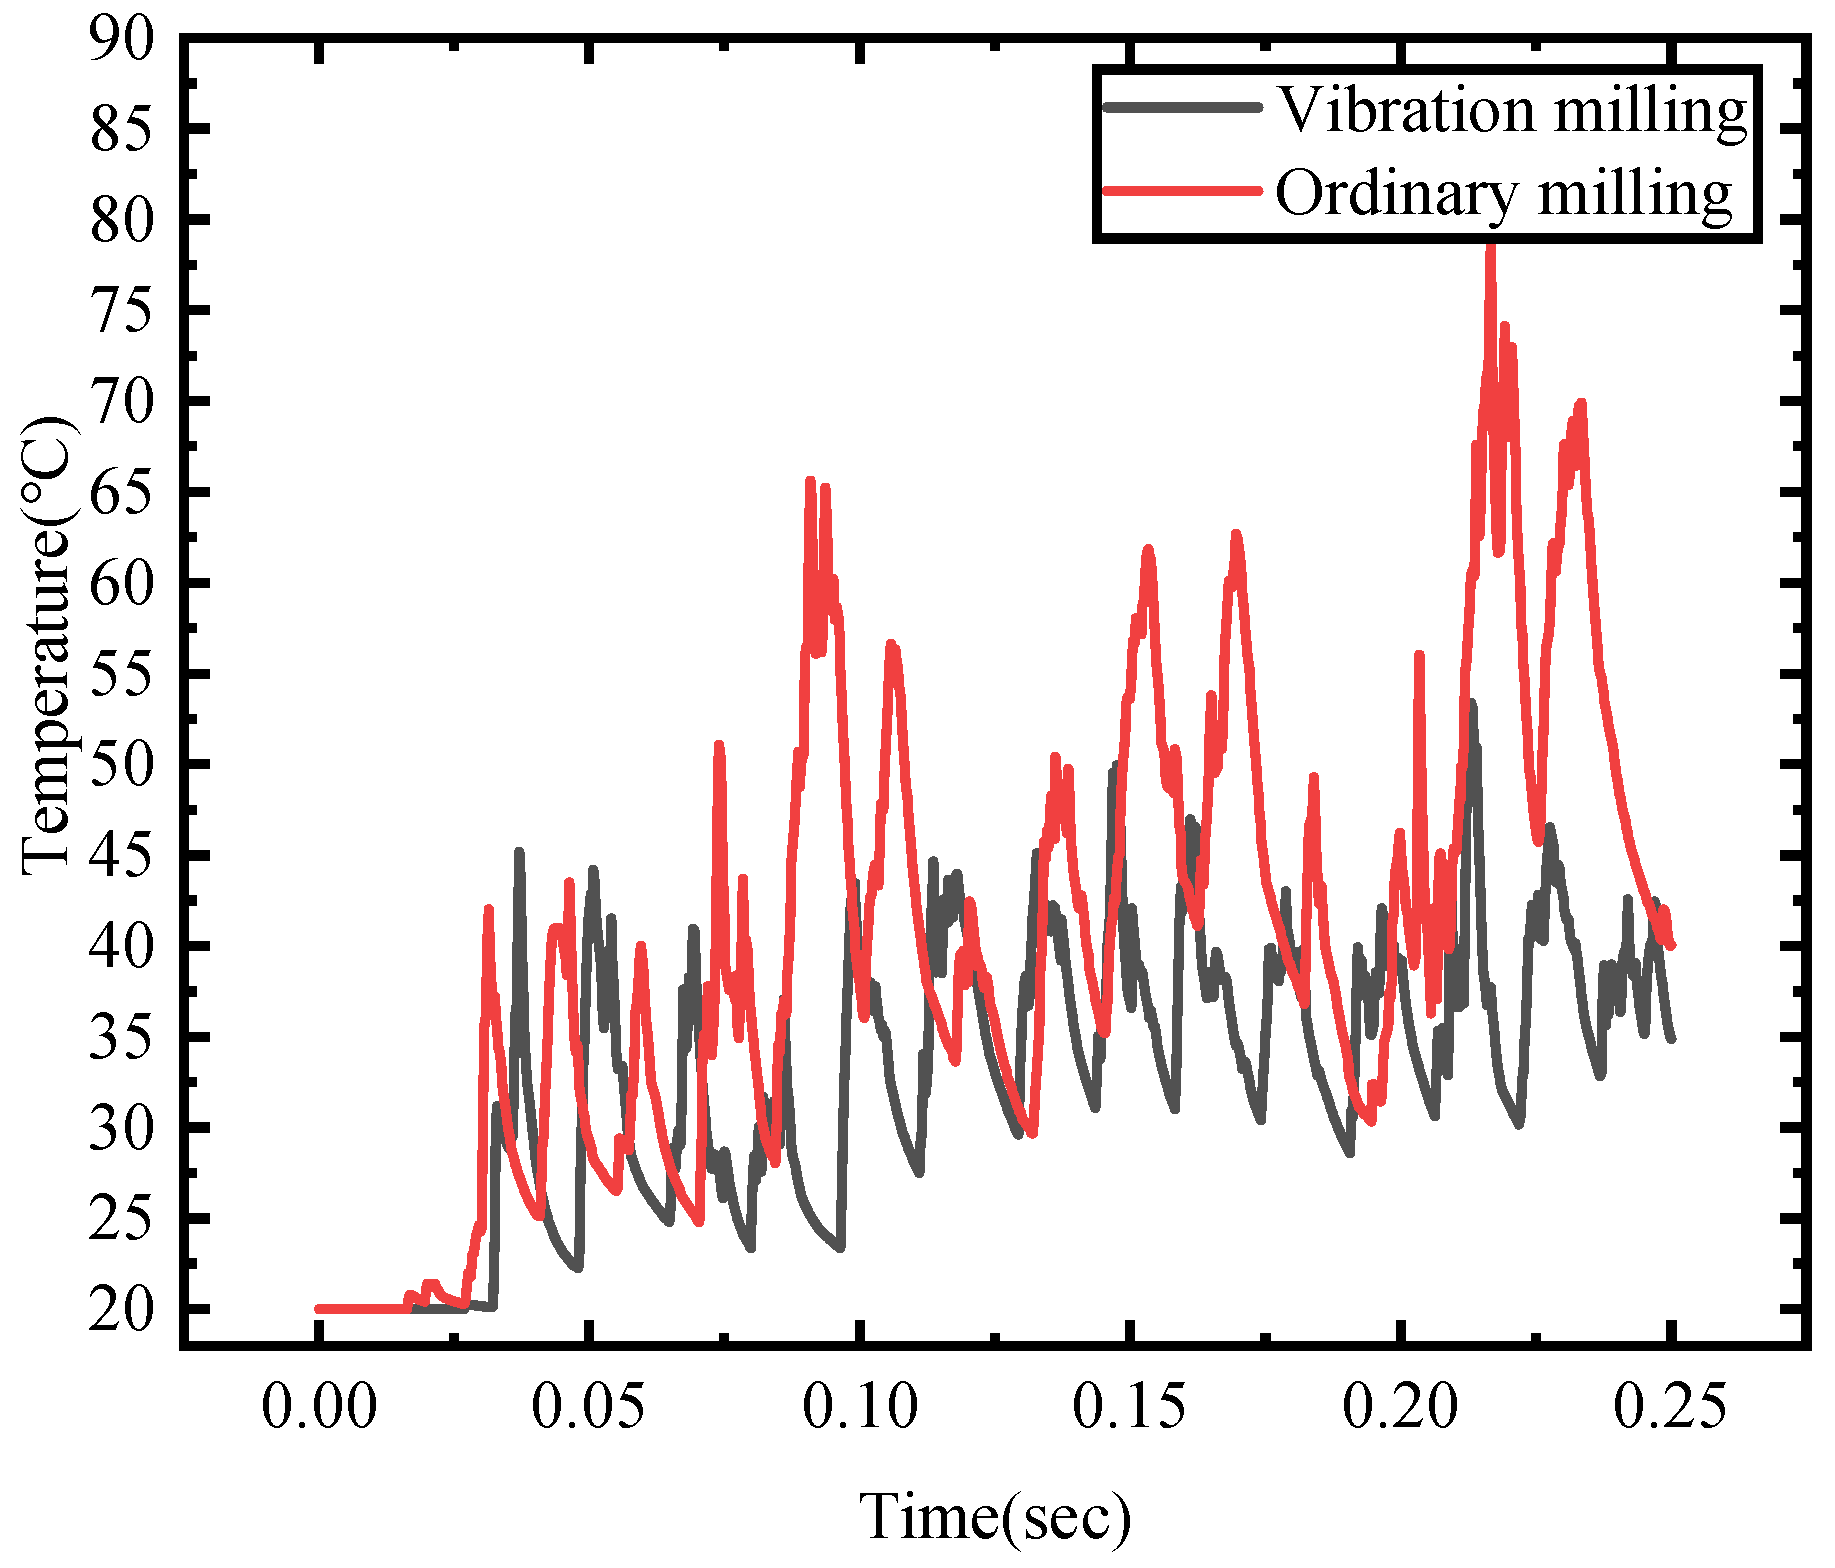
3.2.3. Tool Temperature Comparison

According to Figure 8, it can be seen that when the tool first comes into contact with the workpiece, the temperature in the ordinary milling area rises first. There is a heat conduction phenomenon between the tool and the workpiece, which causes the tool temperature to rise first. However, during vibration milling, the tool temperature rises slowly and the fluctuation range is small. The temperature of the cutting tool is closely related to the temperature of the milling area. During intermittent milling, every contact between the cutting tooth and the workpiece causes a drastic fluctuation in temperature, leading to an increase in milling force, increased work, and an increase in the temperature of the milling area. As a result, the temperature of the cutting tool increases. Vibration milling alleviates the impact force during contact, making it easier to release pressure and heat. The heat transmitted to the cutting tool is lower and the temperature of the cutting tool is relatively stable. Overall, the tool temperature fluctuates within the range of 20–60 °C.

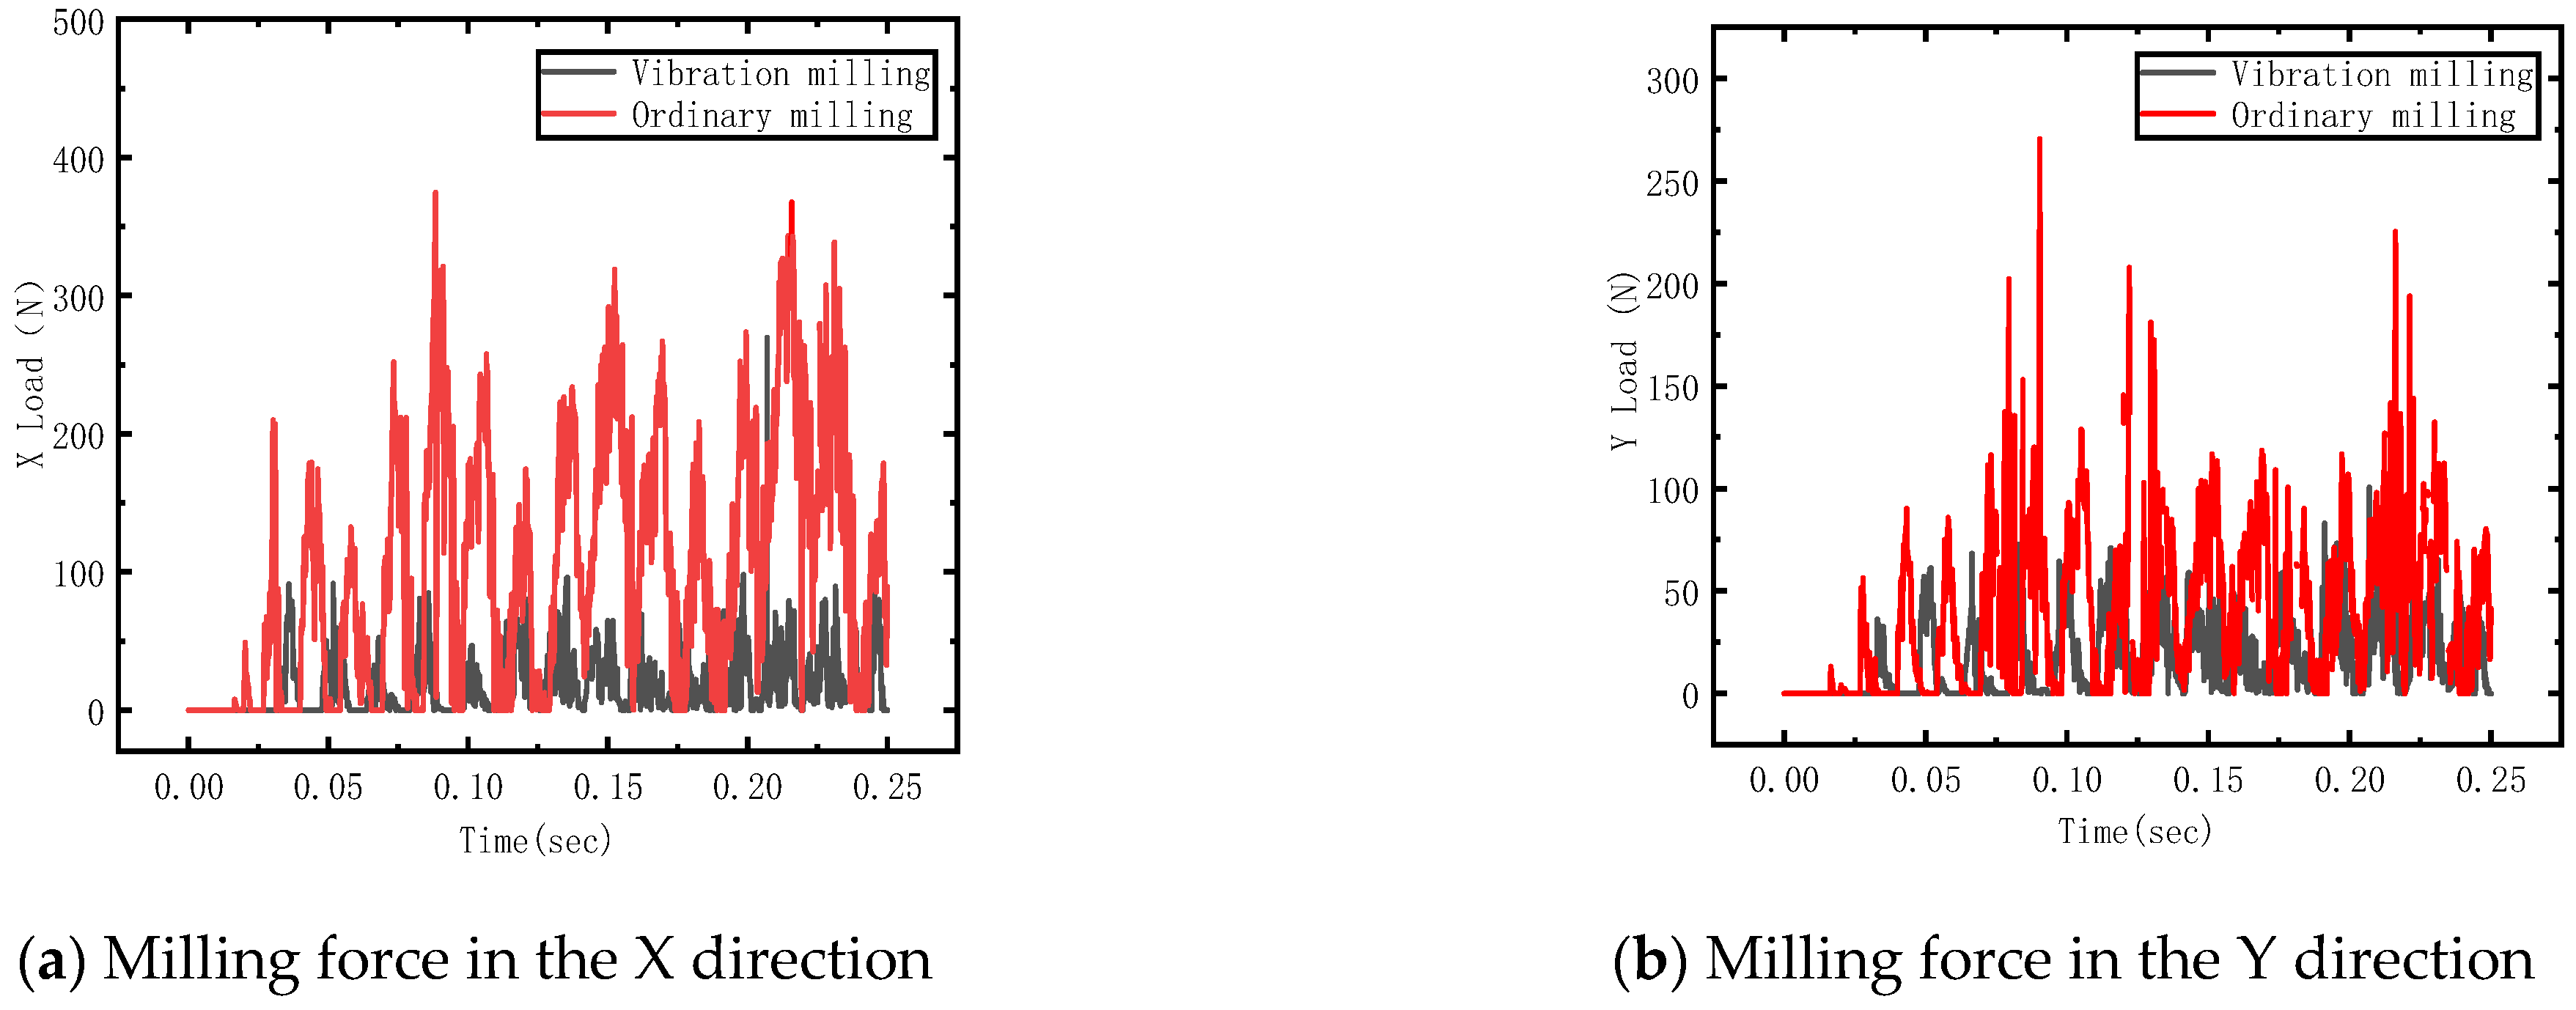
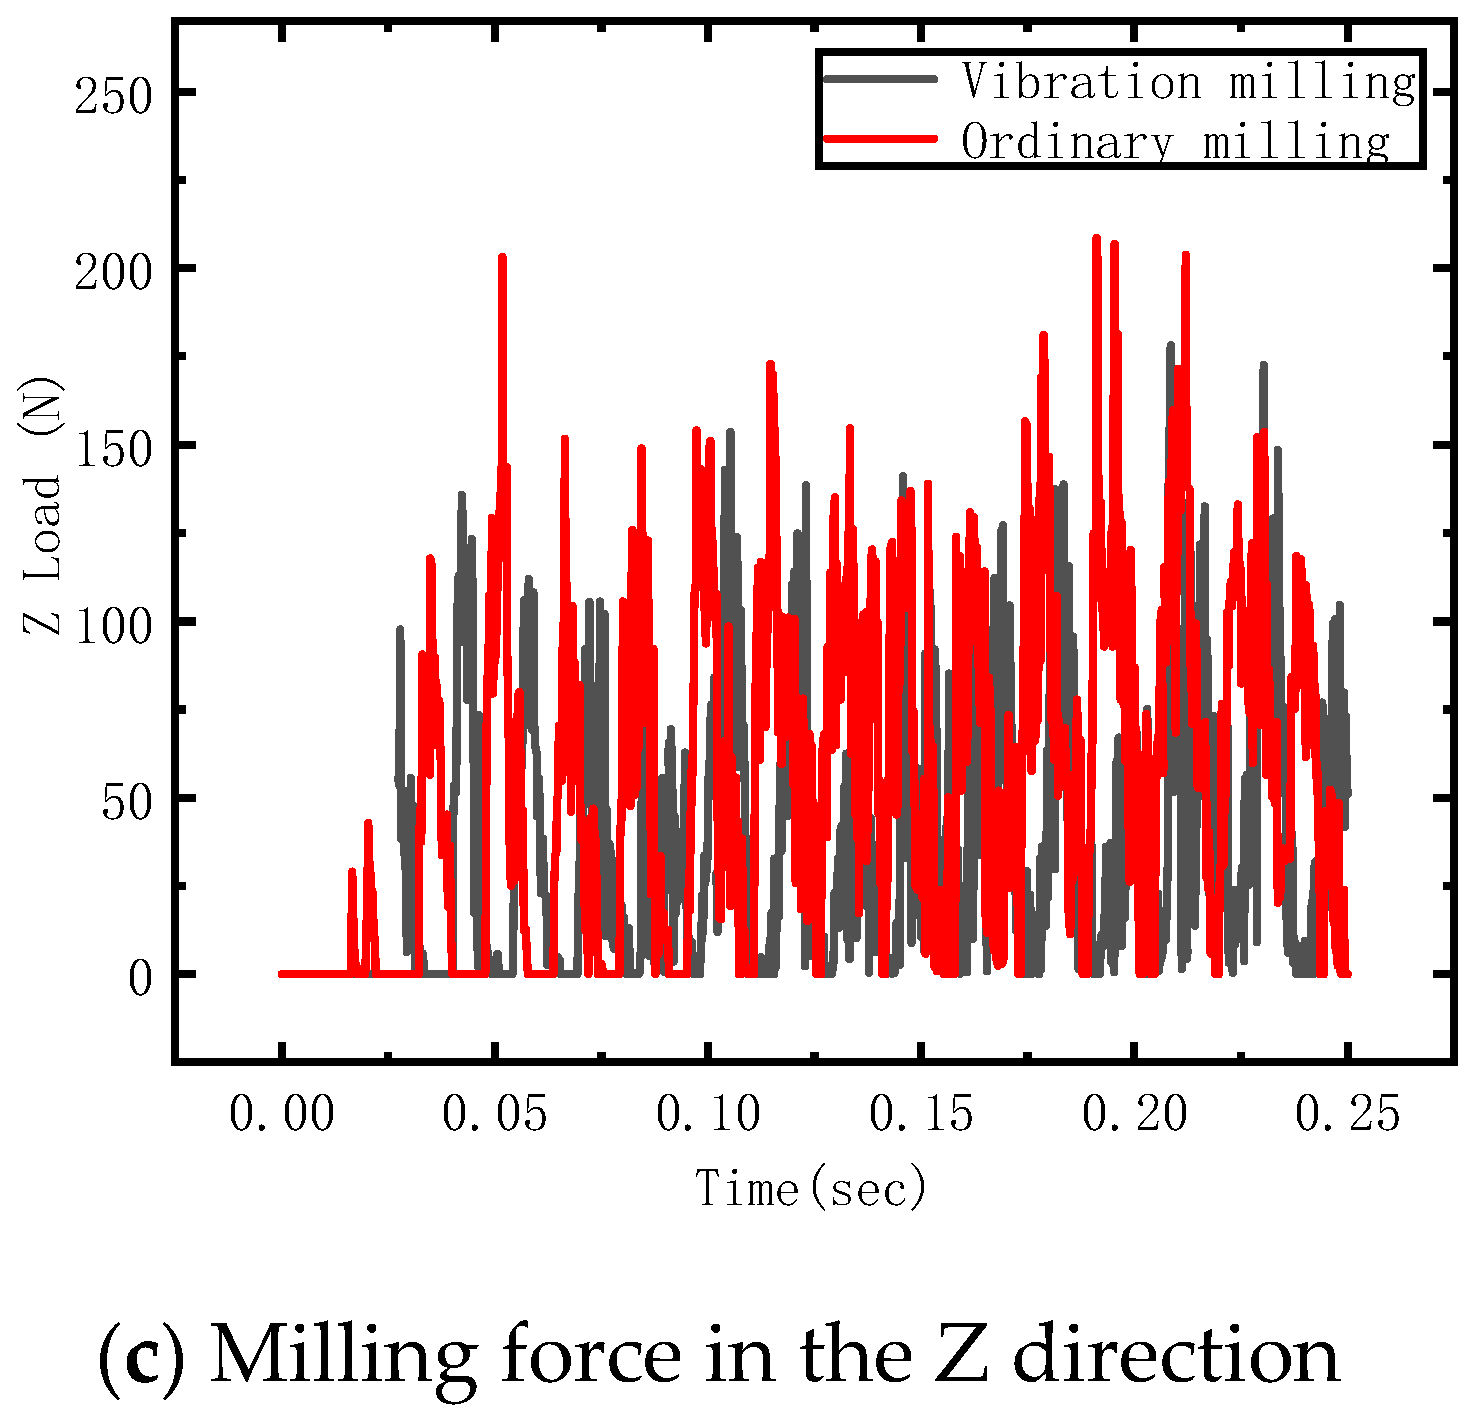
3.2.4. Comparison of Three-Way Milling Forces

Milling force is a type of resistance experienced by a milling cutter when cutting off the material allowance on the workpiece. It is the sum of the cutting forces on each cutting tooth that operates simultaneously. As the milling process progresses, its direction and size changes become more complex. Decomposing it into three main directions (X, Y, Z) is helpful in analyzing the impact of ultrasonic vibration on milling force.
Figure 9 shows the comparison of three-dimensional milling forces between vibration milling and ordinary milling. Overall, the milling force of ordinary milling is greater than that of vibration milling, and the milling process is intermittent. Therefore, during the ordinary milling process, the tool and workpiece suddenly come into contact multiple times, resulting in significant fluctuations in milling force. During vibration milling, chips are prone to detachment, reducing the resistance of chips to the tool. At the same time, the temperature in the milling area decreases and the tool always maintains good hardness, which is beneficial for reducing milling force. The overall milling force is: FX > FZ > FY. The vibration signal has a greater impact on the feed force and axial force and a smaller impact on the radial force. In this experiment, the overall milling width and depth are relatively small, so the milling force is also relatively small.

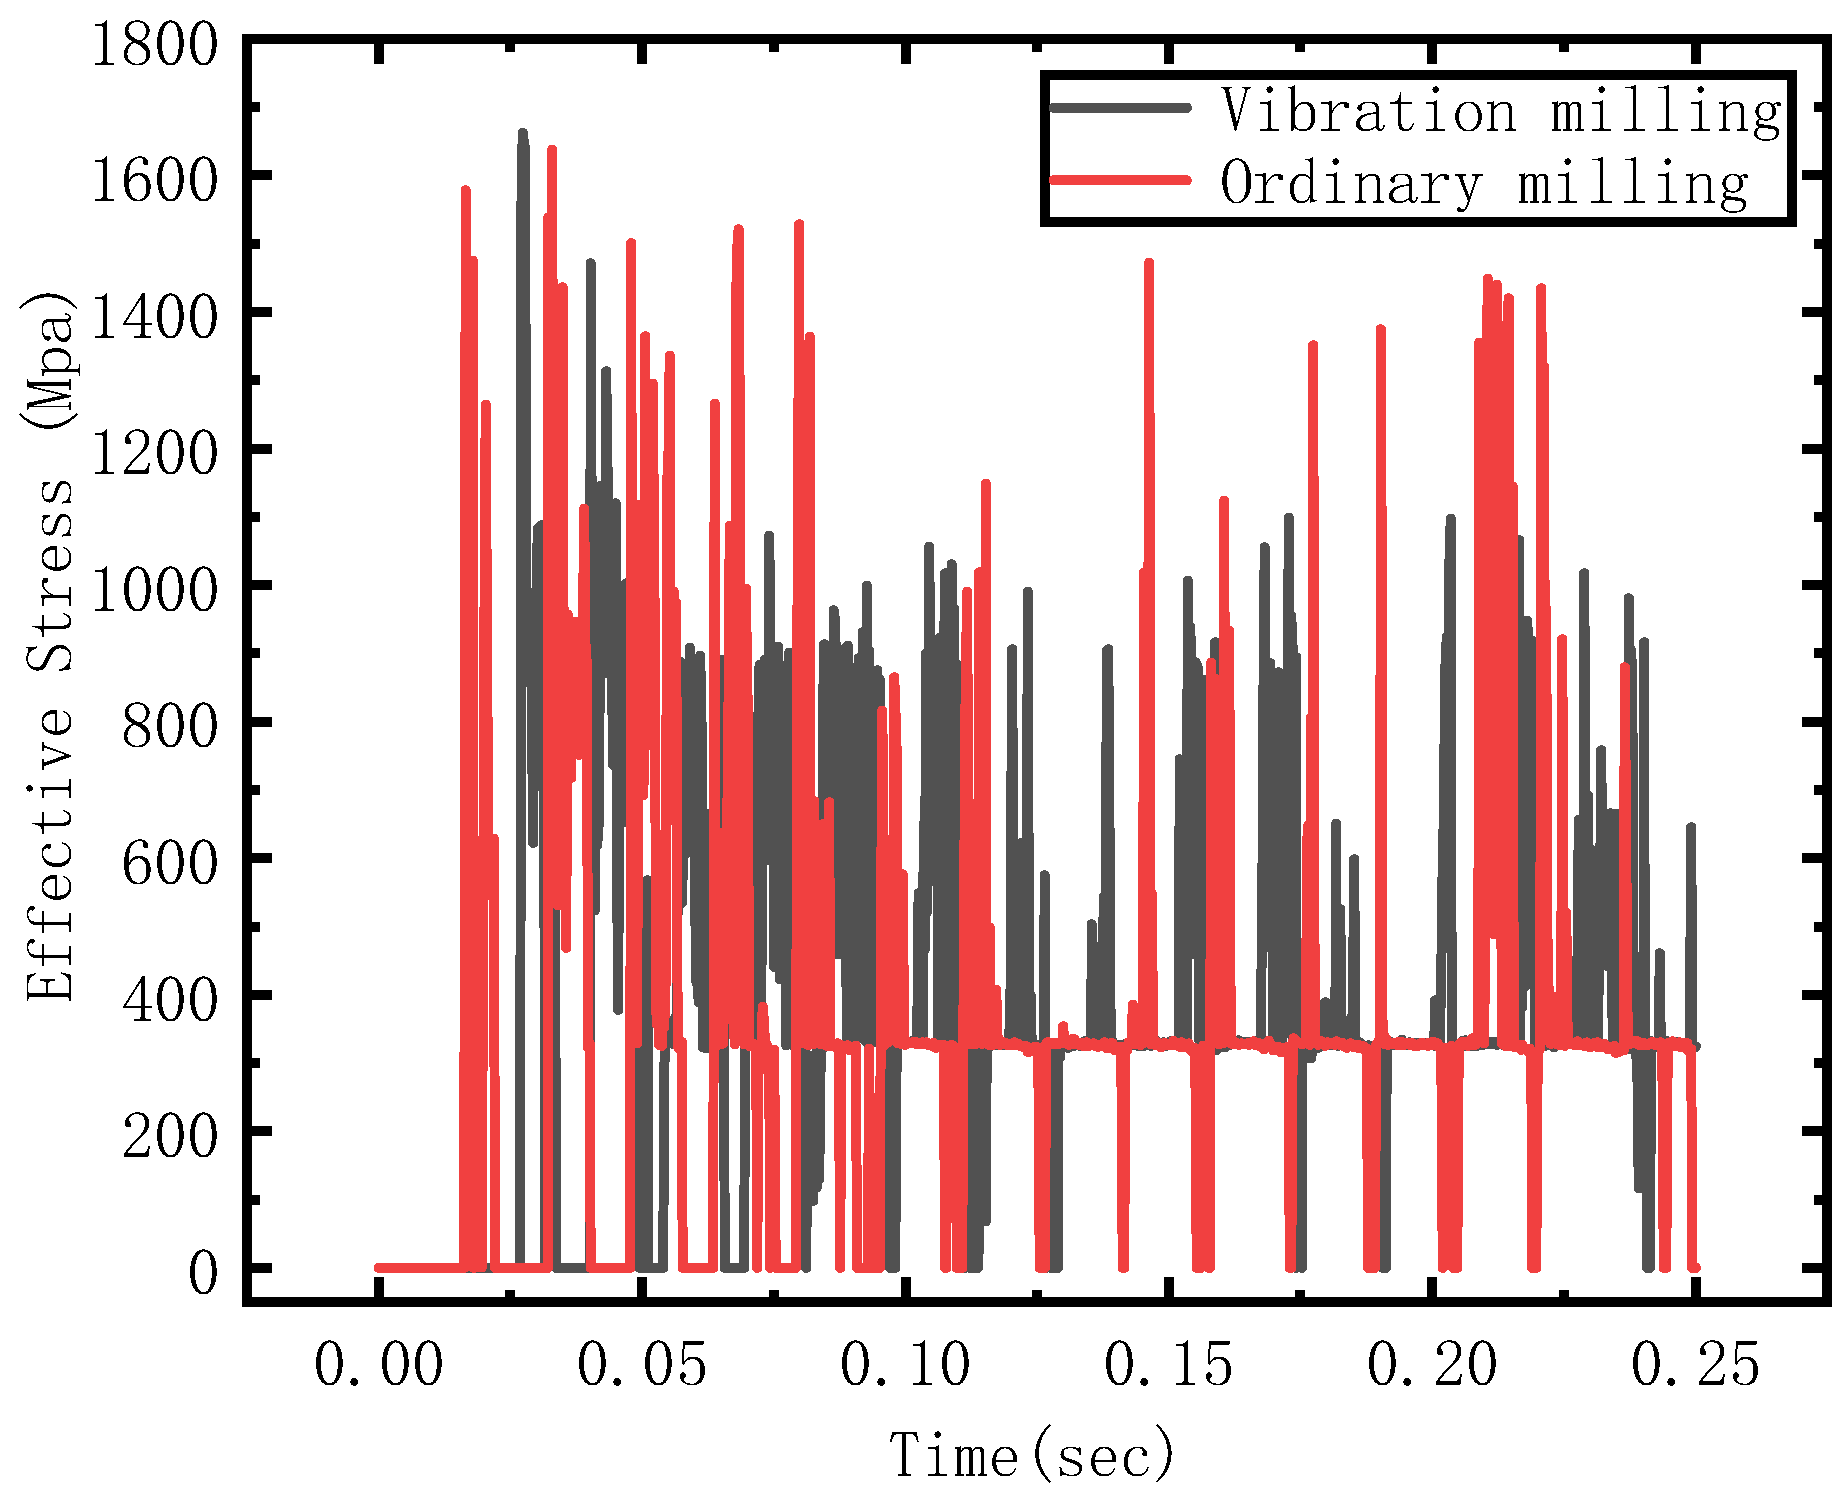
3.2.5. Comparison of Surface Stress of Workpieces

From Figure 10, it can be seen that the equivalent stress of the workpiece in ordinary milling is greater than that in vibration milling, and ordinary milling is more prone to severe mutations due to sudden contact and separation between the workpiece and the tool. The stress in vibration milling is relatively dense, and low-frequency vibration signals cause frequent stress fluctuations. Ultrasonic vibration milling reduces the equivalent stress on the surface of the workpiece, prevents stress concentration on the surface of the workpiece, and reduces the performance of the part, which is beneficial for enhancing the surface quality of the workpiece.

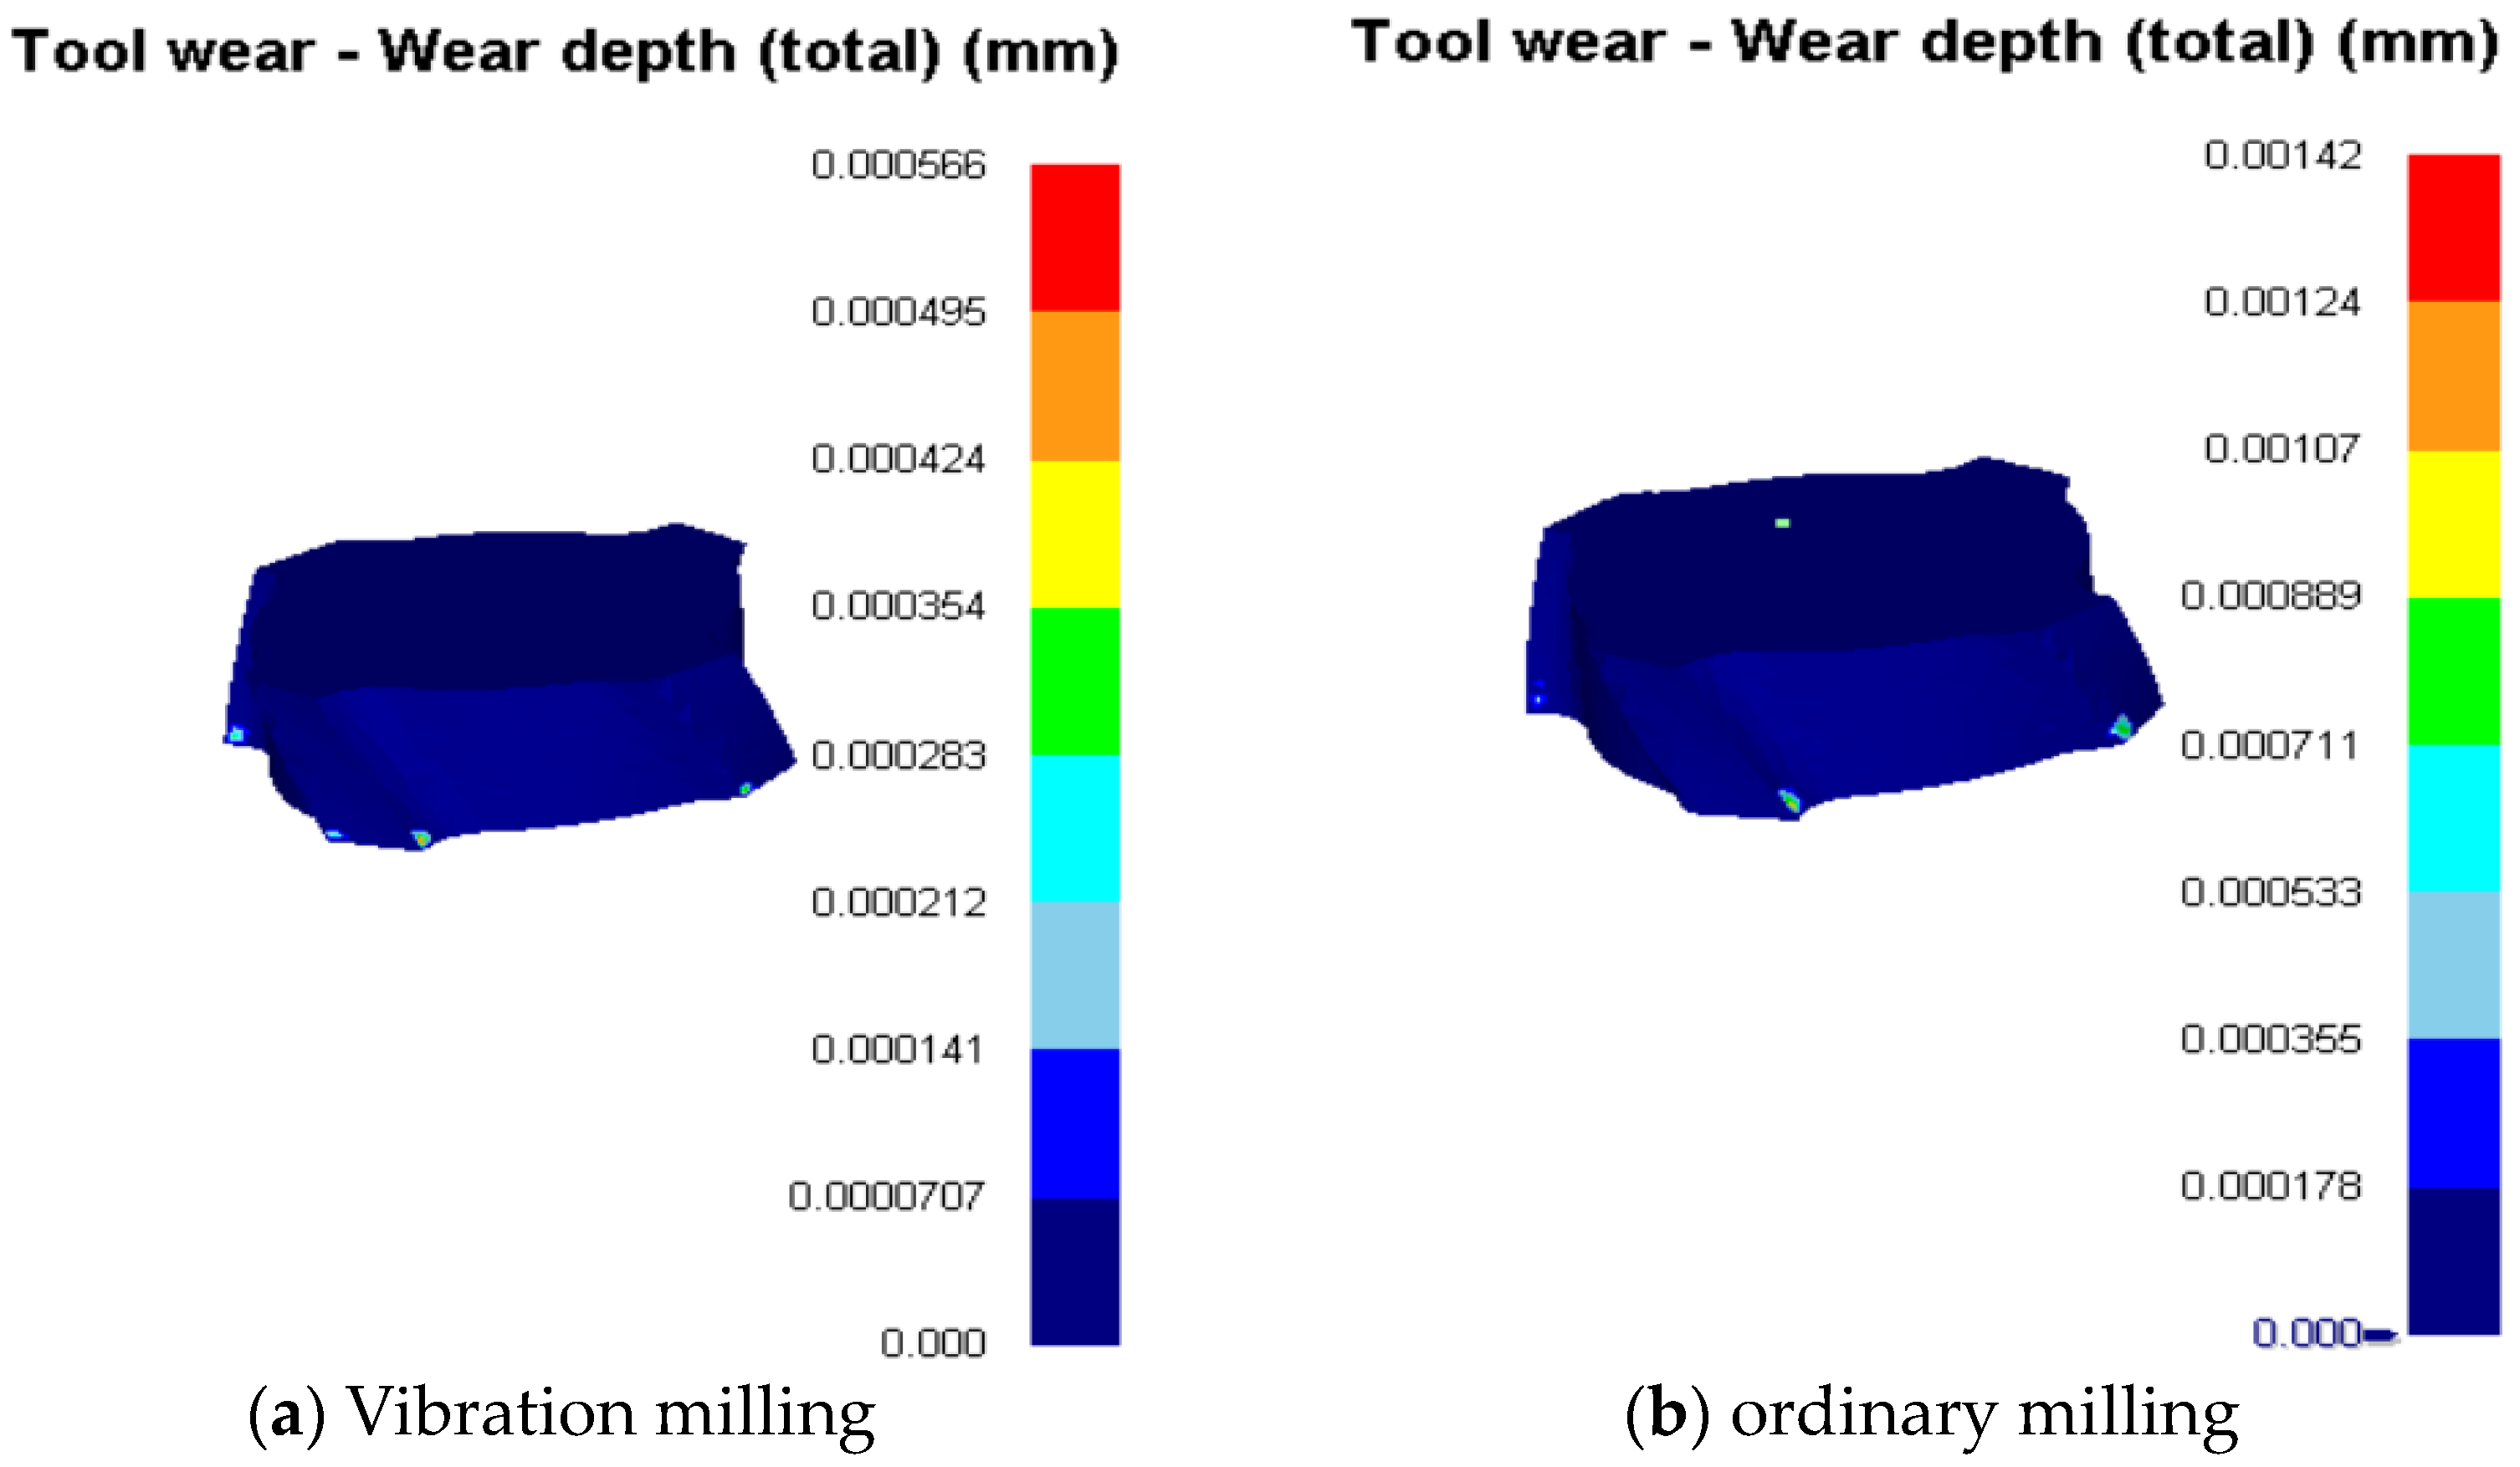
3.2.6. Comparison of Tool Wear

As can be seen from Figure 11, when the tool travel is 10 mm, the wear amount of vibration milling is about 1/2 of that of ordinary milling. Because the chips produced by vibration milling are more likely to break, the chips are more regular, the milling process is more stable, and the tool temperature and cutting force in the cutting process are greatly reduced, which reduces the tool wear. In contrast, the temperature of the ordinary milling area is too high and the impact force of intermittent cutting is relatively large. The internal stress of the workpiece is concentrated and the deformation is more serious. The cutting force will increase and produce larger fluctuations, which will increase the tool wear.

4. Effect of Coating Materials on Tool Wear in GH4169 Milling

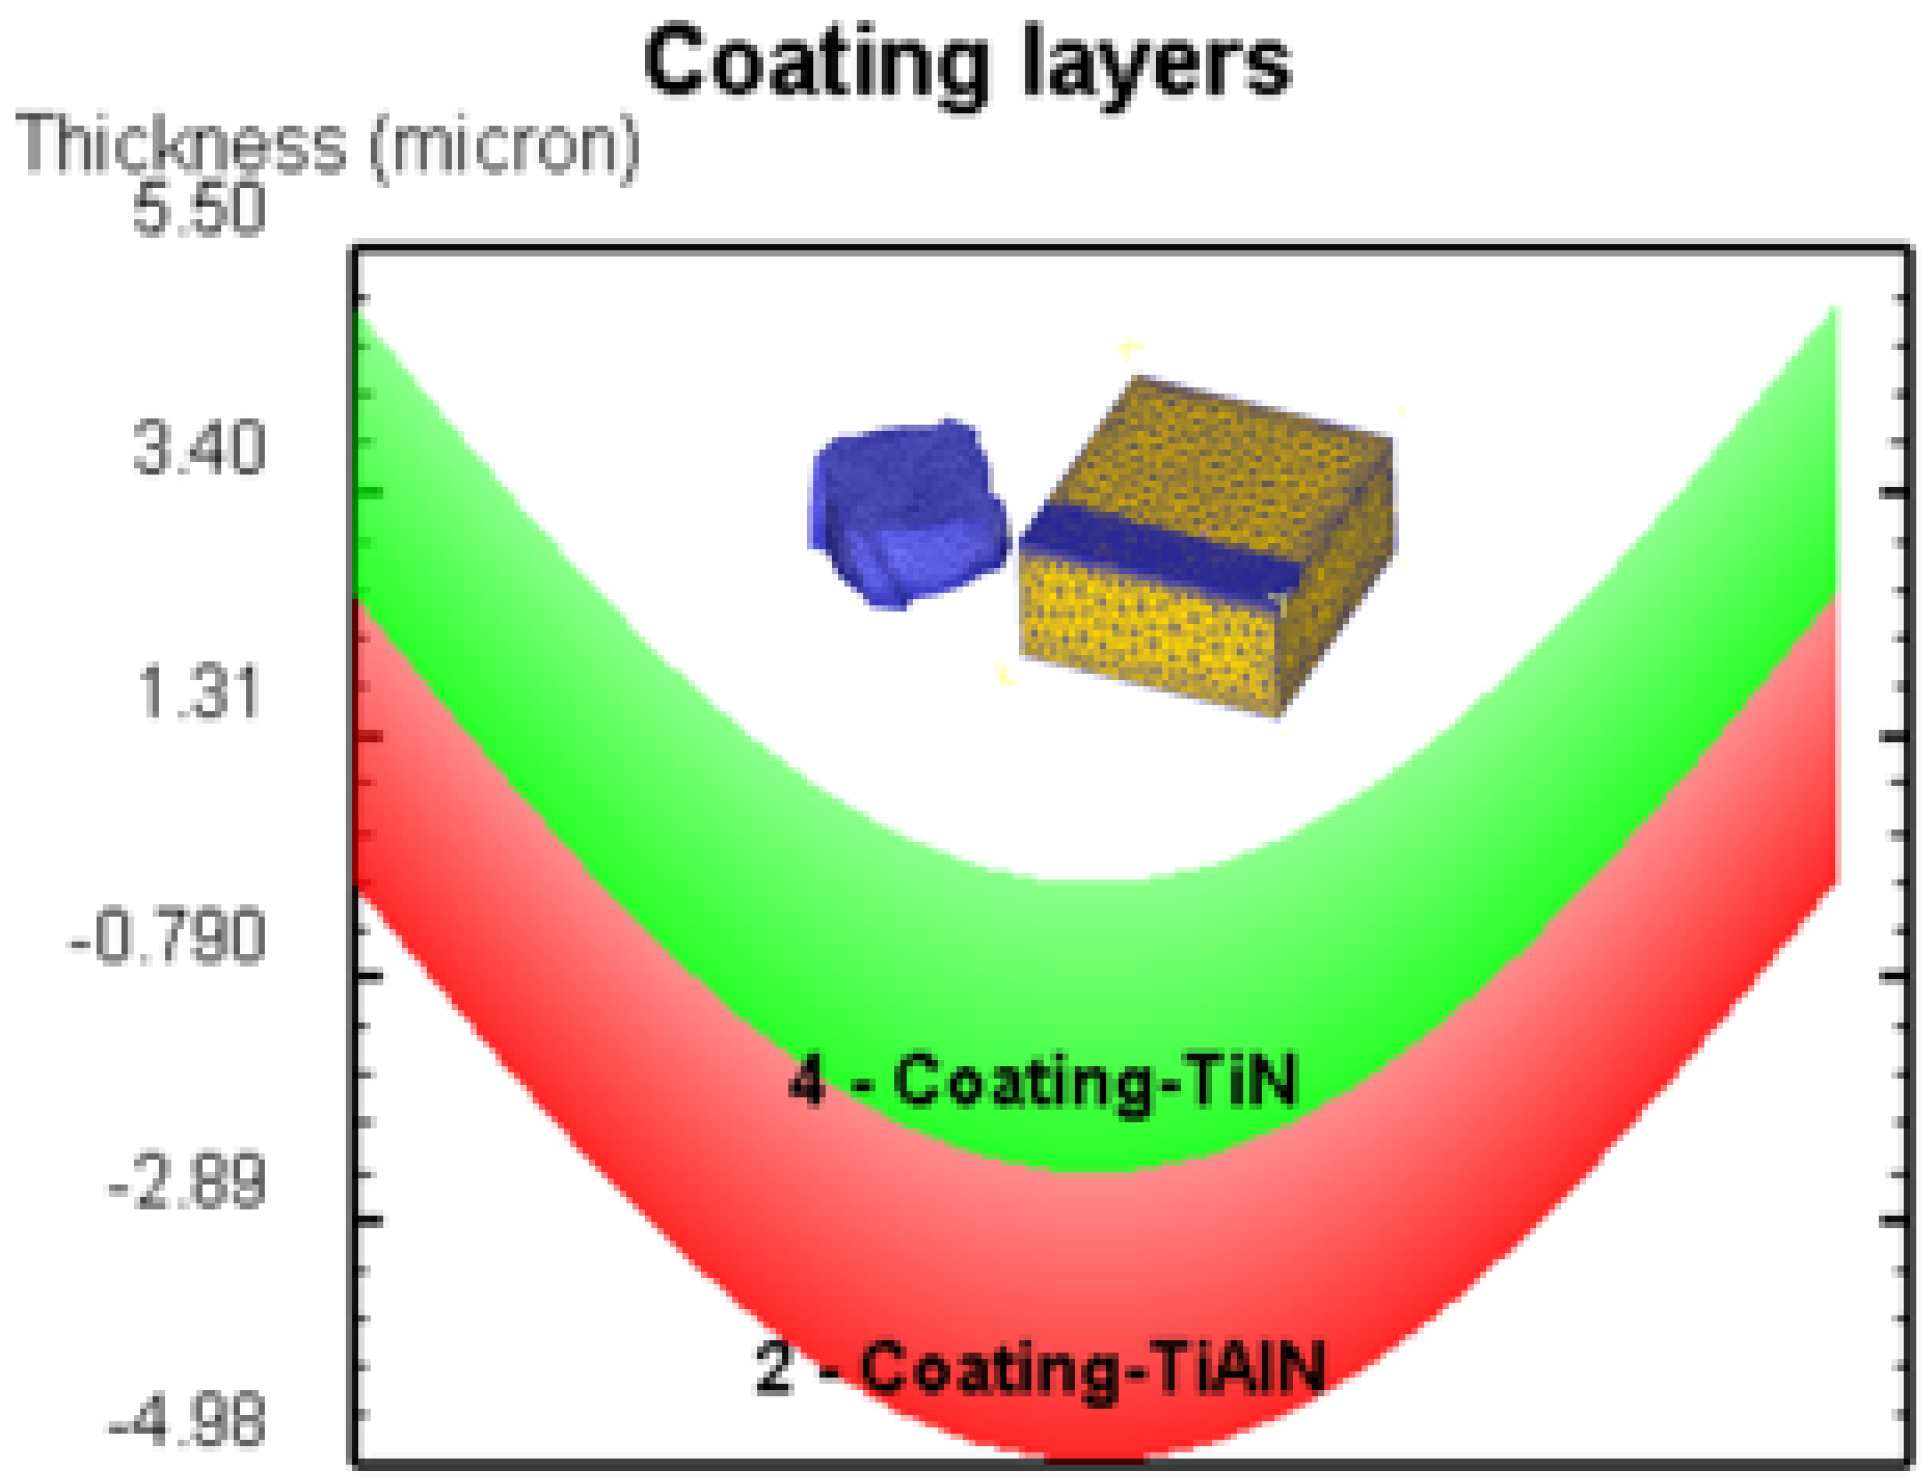
4.1. Establishment of Simulation Model for GH4169 Milling with Coated Tools

Coated tools have high hardness, high wear resistance, high oxidation resistance, and strong film substrate bonding strength, which meet the requirements of today’s high-precision and high-efficiency machining. Coated tools can improve the surface machining quality of the workpiece, reduce the milling force, reduce the surface temperature of the tool, and reduce tool wear. The physical properties of various common coatings have been encapsulated in the material library of DEFORM, and only need to be selected. Special structural coatings or newly developed coatings can be added to the material library based on their physical properties. The default bonding between coatings and between coatings and the substrate in the model is good. The coating thickness is 5 mm.
The following main study focuses on the influence of TIALN and TIN coatings on the milling process of hard alloy GH4169. This article sets the tool substrate material as WC, the axial milling depth of the tool is 2 mm, the spindle speed is 6000 r/min, and the feed rate per tooth is 0.1 mm/z. The distribution of coatings is shown in Figure 12:
Based on existing material processing books [31], the performance parameters of TIN and TIALN coatings set in this article are shown in Table 5:

4.2. Analysis of Simulation Results

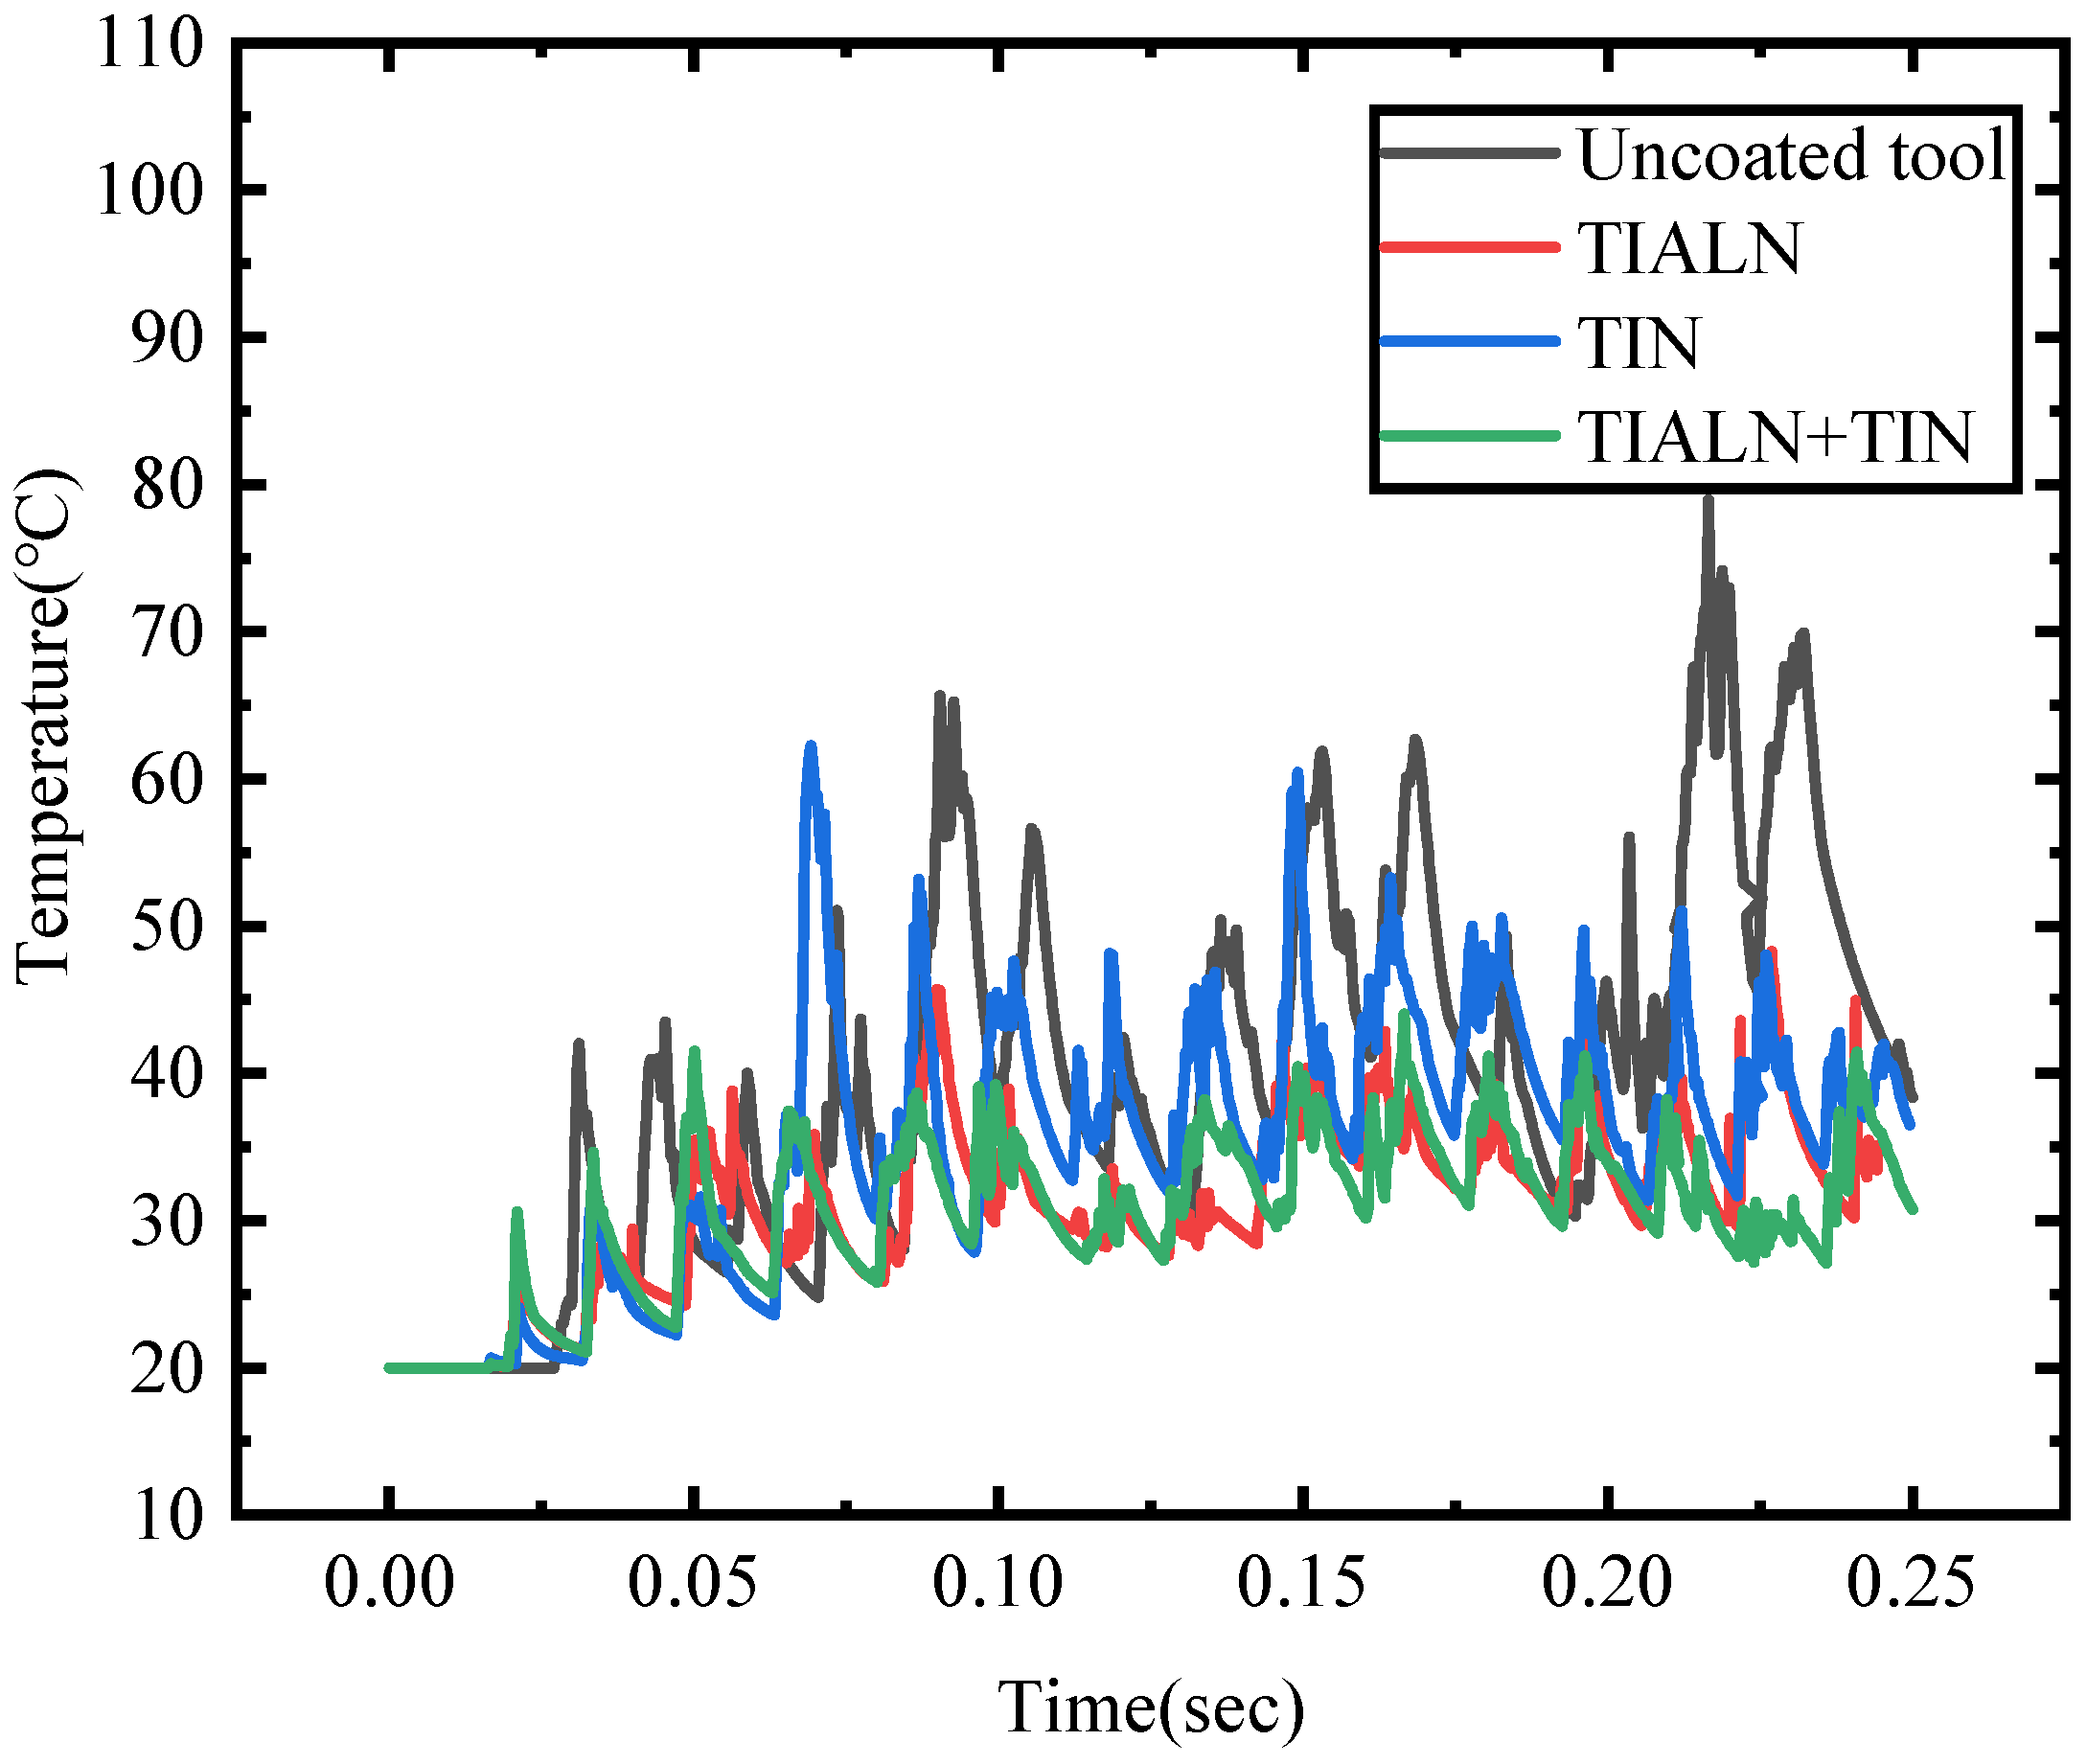
4.2.1. Temperature Changes of Cutting Tools with Different Coating Types

From Figure 13, it can be seen that when the tool first comes into contact with the workpiece, the temperature difference between different types of coated and uncoated tools is not significant. At the beginning of cutting, the tool has less cutting material and less cutting force, and the temperature transmitted to the tool is relatively low. As cutting progresses, the contact area between the tool and the workpiece increases, the cutting force also increases, the temperature of the cutting area increases, and the heat transmitted to the tool also increases. The tool temperature undergoes periodic changes as chips are generated and shed. The temperature of uncoated tools is maximum. Due to the maximum thermal conductivity, a large amount of heat generated in the milling area is transmitted to the tool, causing a rapid increase in tool temperature. Secondly, the temperature of TIN-coated tools is highest, with TIALN-coated tools having the lowest temperature and TIN/TIALN-composite-coated tools having the lowest temperature. This coating has a soft and hard structure, greatly alleviating the stress on the tool. The composite coating can better prevent the temperature in the milling area from spreading inside the tool. It has a great protective effect on cutting tools and greatly reduces tool wear.

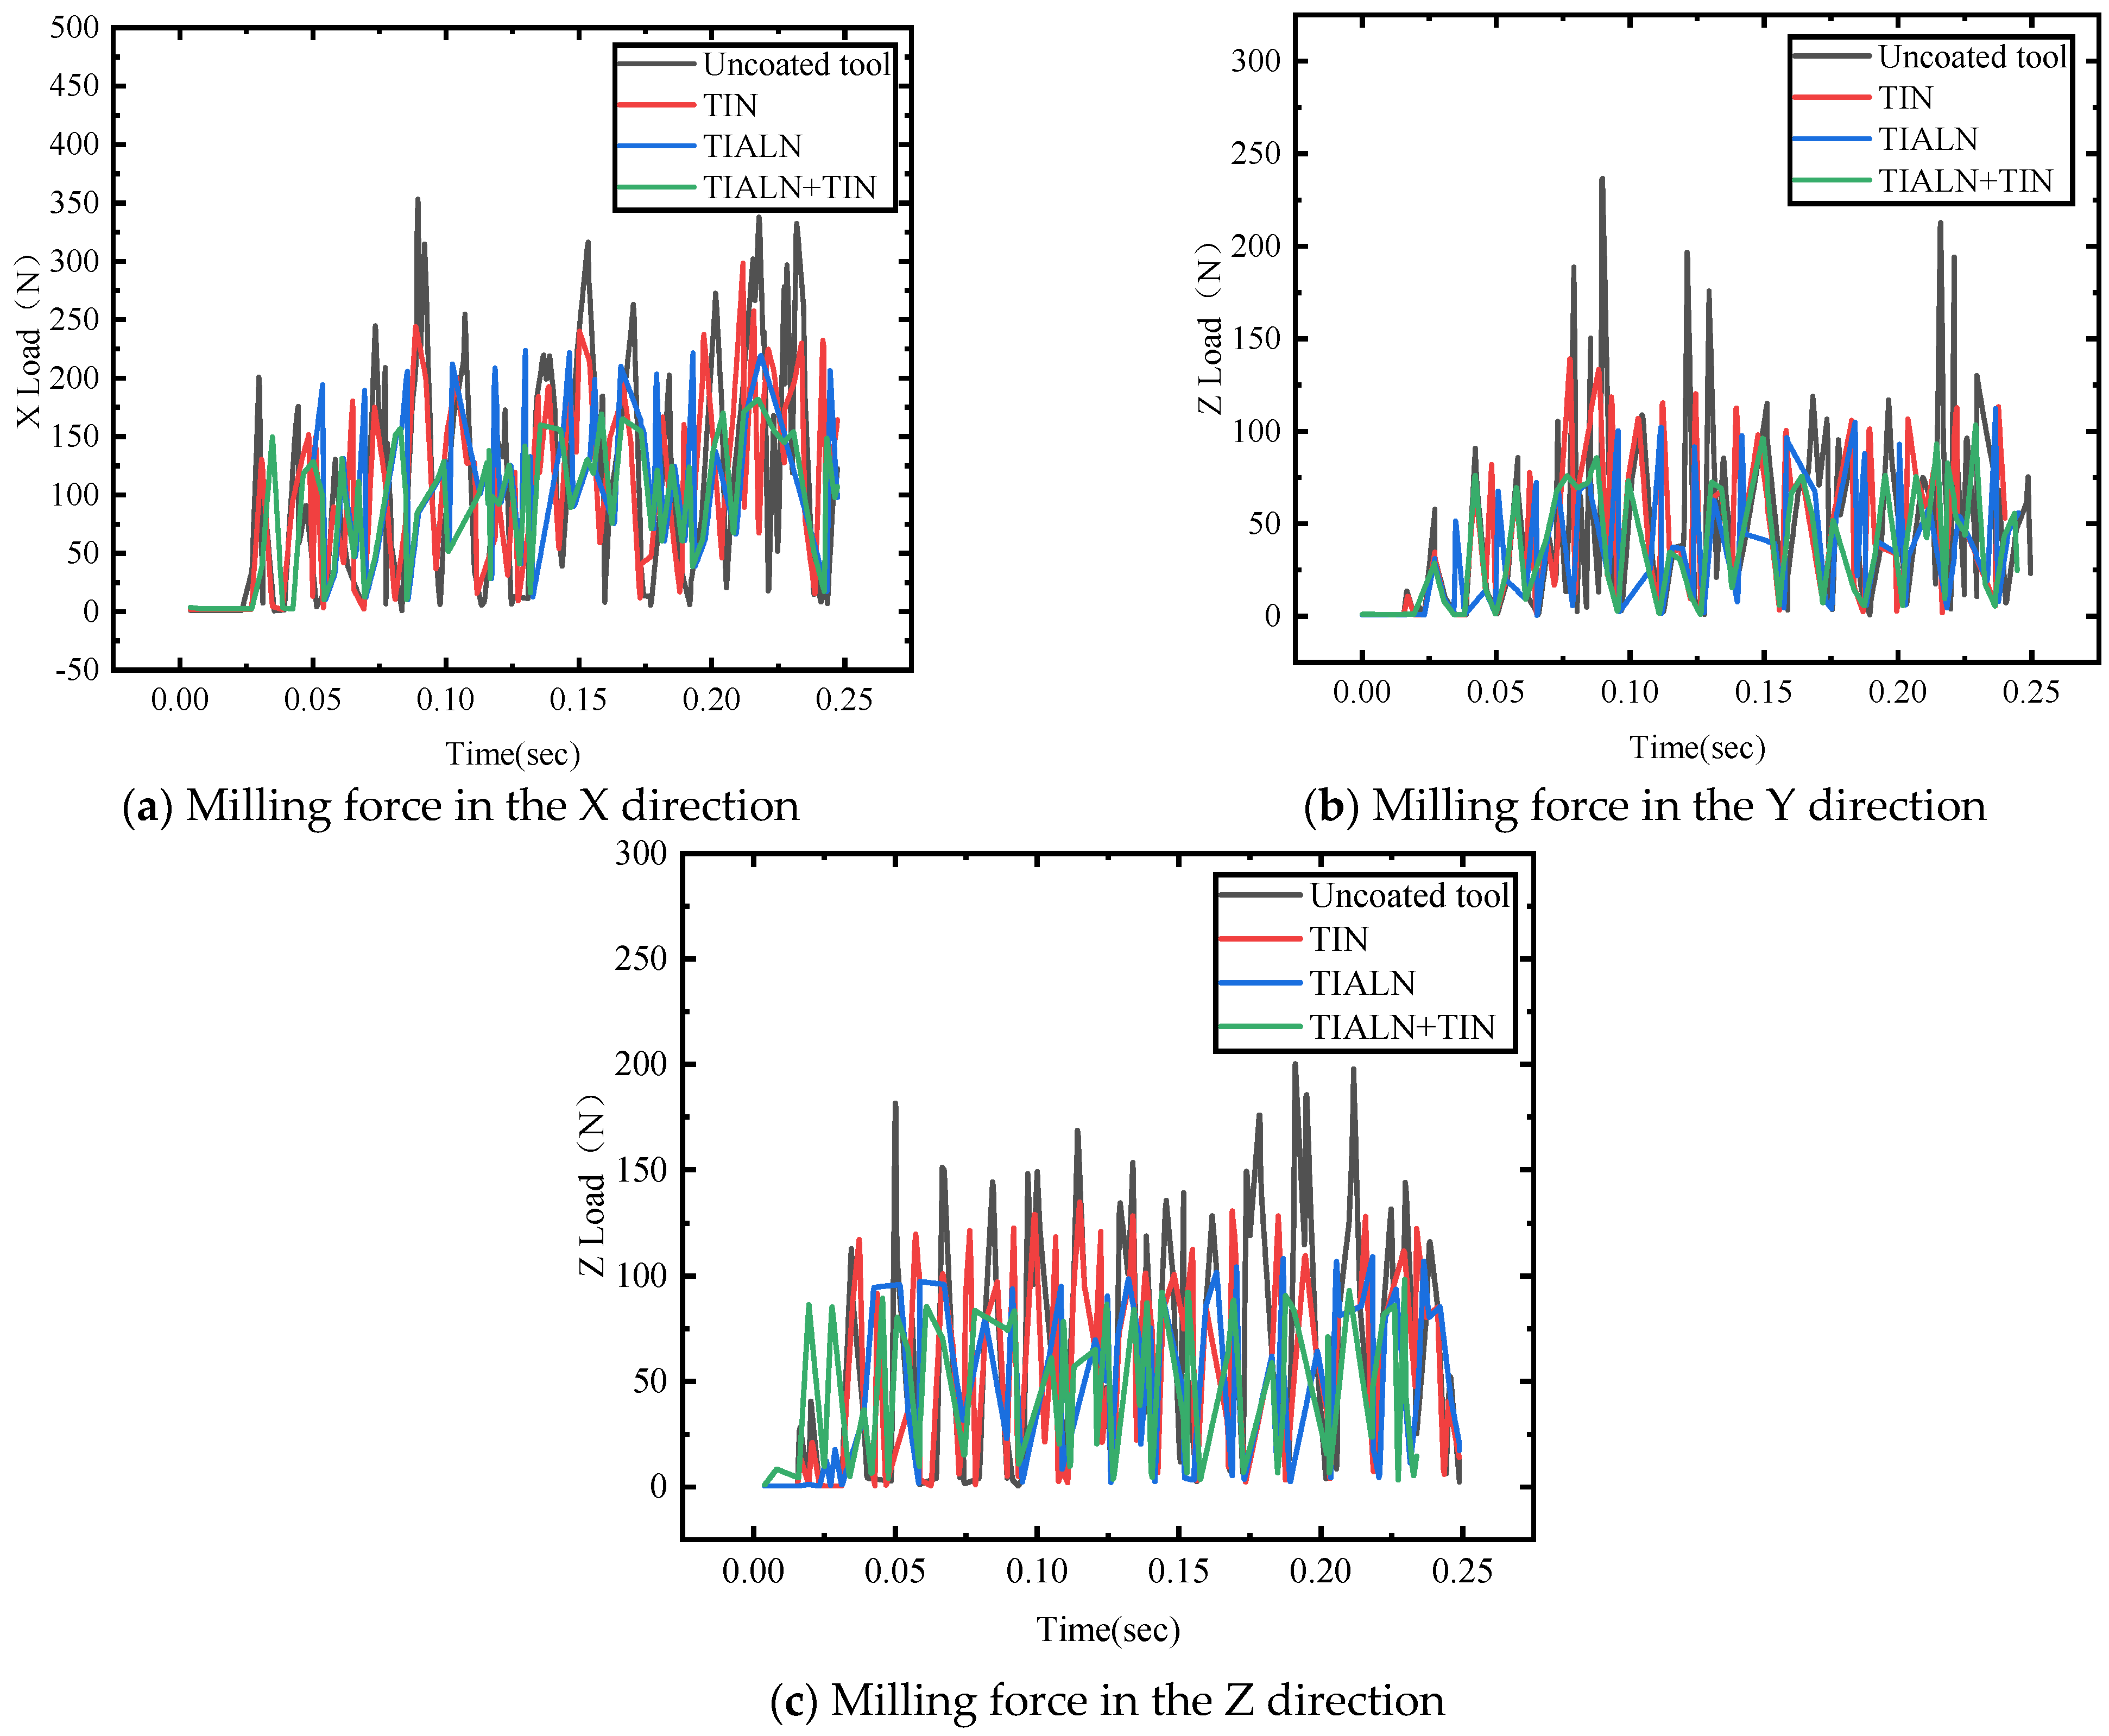
4.2.2. Changes in Milling Force of Different Coating Types of Cutting Tools

From Figure 14, it can be seen that in the early stage of milling, the tool and workpiece just come into contact, the cutting distance is short, the temperature in the milling area is low, the milling force is also small, and the coating material has not yet been effective. With the progress of cutting, the temperature in the milling area increases and the thermal conductivity of the coating material is small, resulting in less heat entering the tool. The high temperature in the milling area causes the workpiece material to soften, resulting in a decrease in milling force. The material cut by the uncoated tool has a higher hardness, and the tool itself has a lower hardness than the coated material, so the milling force is relatively large. The difference in friction coefficient between TIALN and TIN coatings is not significant, and the main factor affecting milling force is the thermal conductivity coefficient. During the milling process, it can be roughly seen that FTIALN+TIN < FTIALN < FTIN < FUncoated, and the thermal conductivity of the composite coating is low. The soft and hard structure can serve as a good thermal barrier, with a greater degree of material softening and less milling force. Secondly, the milling force of TIALN-coated tools is smaller than that of TIN-coated tools, with uncoated tools having the highest milling force. At the same time, it can be seen that the fluctuation range of milling force for TIN + TIALN-coated tools is relatively small, indicating that the composite coating can reduce the impact force during the milling process and increase the stability of the milling process.

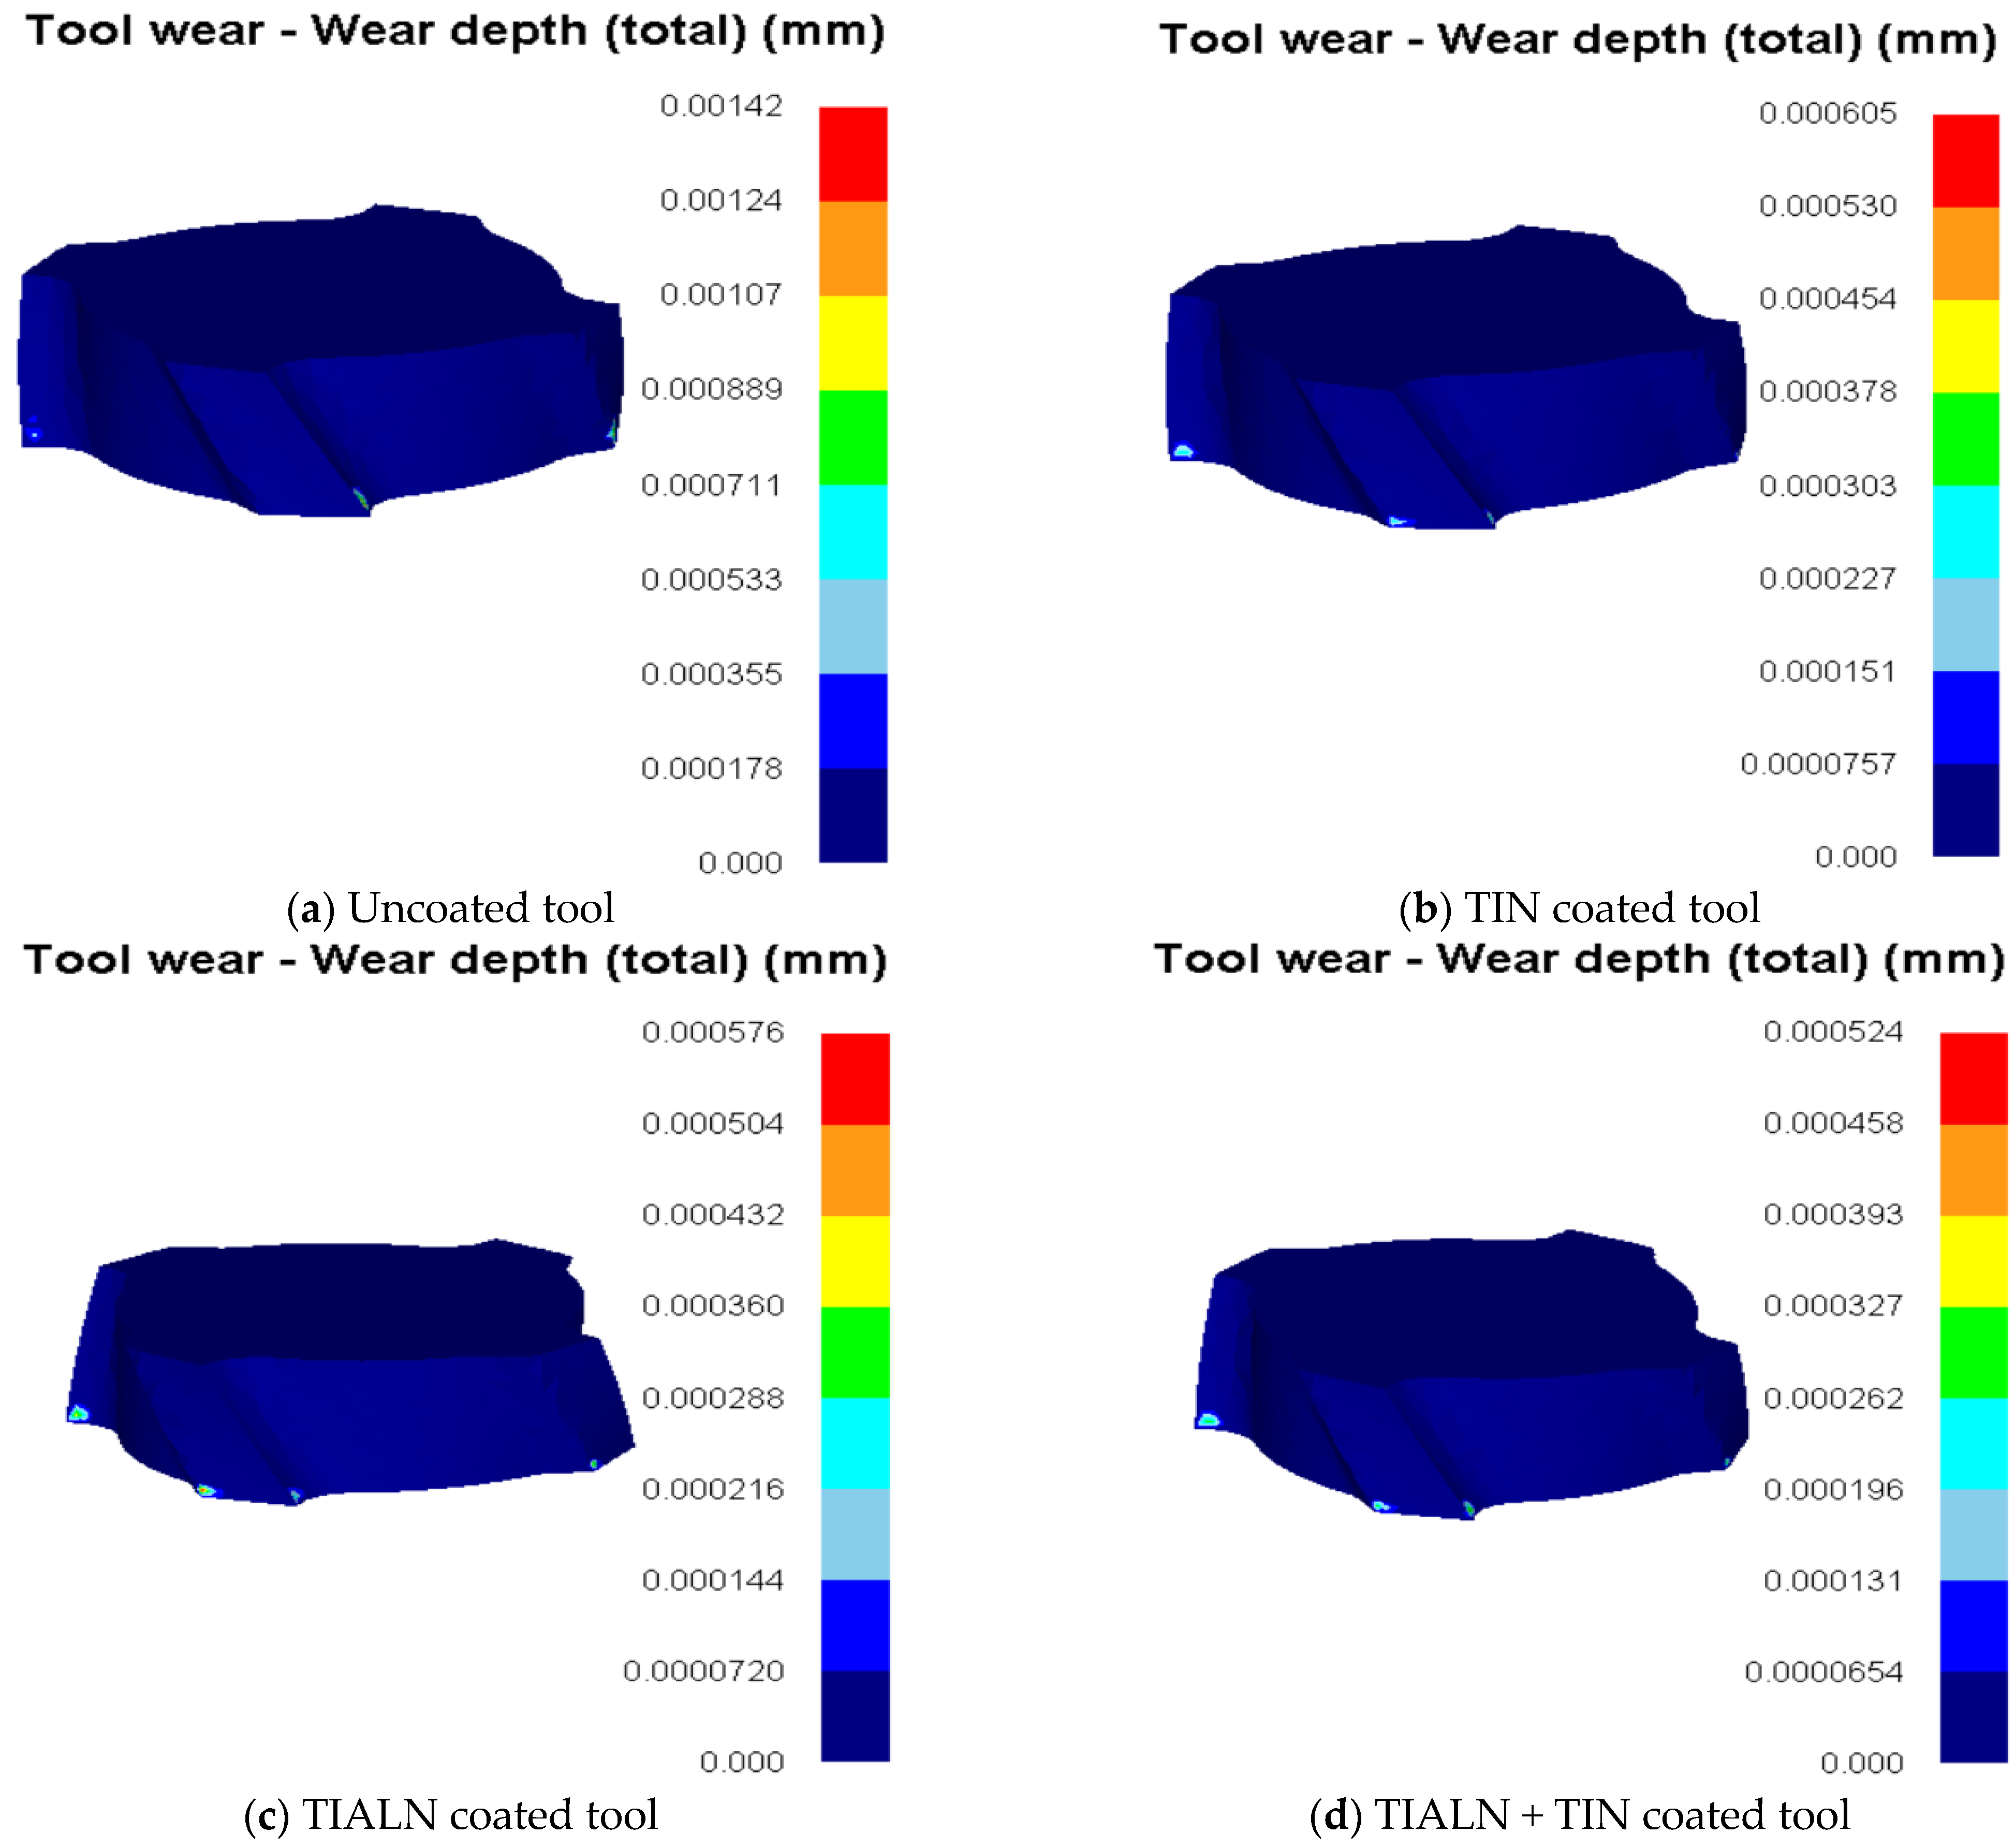
4.2.3. Comparison of Tool Wear of Different Coating Types

From Figure 15, it can be seen that when the milling stroke of the tool is 10 mm, the minimum wear of the TIN + TIALN-coated tool is 0.524 μm. Secondly, the TIALN coating tool wear is 0.576 μm. The wear amount of TIN-coated tools is 0.605 μm. The maximum uncoated tool wear is 1.42 μm. This simulation uses the Usui wear calculation formula. The tool wear is related to the temperature and pressure of the contact surface. TIN + TIALN-coated tools have good impact resistance and thermal insulation, and the milling force and tool temperature are relatively low, so the tool wear is relatively small. TIALN and TIN also reduce tool wear, which is due to the low thermal conductivity of the coating material, which maintains good hardness of the tools, and the tool temperature and cutting force are small. The impact of uncoated tools and workpiece materials is large, the workpiece surface hardens significantly, and the tool milling force and temperature are large, so the tool wear is large.

5. Conclusions

(1) Using the finite element simulation software DEFORM, the GH4169 model for carbide milling is established. The orthogonal experiments of tool wear simulation on n, ap, and fz parameters are carried out, and the regression prediction model of tool wear is established. The range analysis of the model is conducted, and the simulation effect is good. The empirical formula of tool wear is H = 0.01·n0.4112·ap0.5345·fz−0.6866.
(2) In the process of milling GH4169, the order of the influence of n, ap, and fz on tool wear is: fz > ap > n. Tool wear increases with the increase in n and ap. When fZ increases, the tool wear decreases. Taking the minimum tool wear as the target, the optimal milling parameters are obtained as n = 3000 r/min, ap = 0.2 mm, and fz = 0.4 mm/z.
(3) Based on the path planning method, a simulation model of ultrasonic vibration milling GH4169 is established. Compared with ordinary milling, it is found that ultrasonic-vibration-assisted milling is beneficial to chip breaking, reducing the temperature of the milling area, milling force, workpiece surface stress, and cutting tool temperature, which is of great significance to reduce tool wear and optimize the quality of the machined surface.
(4) The GH4169 simulation model of coated tool milling is established. By analyzing the milling conditions of cemented carbide tools, TIALN-coated tools, TIN-coated tools, and TiAlN/TiN-composite-coated tools, the influence of coating materials on tool temperature, milling force, and tool wear is obtained. The results show that coating materials greatly reduce the tool surface temperature, three-way milling force, and tool wear. The TiAlN/TiN composite coating has the best cutting performance and is more suitable for milling difficult-to-machine material GH4169.

Author Contributions

X.L. guided the overall design and analysis of the study, W.Z. conducted simulation analysis and wrote the manuscript, L.M. and Z.P. helped collect data and simulate. All authors have read and agreed to the published version of the manuscript.

Funding

This work was financially supported by the National Natural Science Foundation of Jilin Province, China (Grant No. 20200201065JC).

Data Availability Statement

Data available in a publicly accessible repository.

Acknowledgments

This work was financially supported by the National Natural Science Foundation of Jilin Province, China (Grant No. 20200201065JC). The authors would also like to thank the anonymous reviewers for their helpful comments. All authors have agreed.

Conflicts of Interest

The authors declare that they have no conflict of interest.

References

  1. Ezugwu, E.O. High speed machining of aero-engine alloys. J. Braz. Soc. Mech. Sci. Eng. 2004, 26, 1–11. [Google Scholar] [CrossRef]
  2. Mei, Z.; Huang, C.; Fan, Y. Development and prospect of the aircaft digital assembly technology. Acronautical Manuf. Technol. 2015, 58, 31–37. [Google Scholar]
  3. Chu, G. Research on the status quo of aircraft digi tal assembly techmology in China. J. Xi’an Acronautical Univ. 2016, 1, 40–43. [Google Scholar]
  4. Ezugwu, E.Q.; Bonney, J.; Yamane, Y. An Overview of the Machinability of Aero Engine Alloys. J. Mater. Process. Technol. 2003, 135, 233–253. [Google Scholar] [CrossRef]
  5. Dudzinski, D.; Devillez, A.; Moufki, A.; Larrouquère, D.; Zerrouki, V.; Vigneau, J. A review of developments towards dry and high speed machining of Inconel 718 alloy. Int. J. Mach. Tools Manuf. 2004, 44, 439–456. [Google Scholar] [CrossRef]
  6. Attanasio, A.; Ceretti, E.; Fiorentino, A.; Cappellini, C.; Giardini, C. Investigation and FEM-based simulation of tool wear in turning operations with uncoated carbide tools. Wear 2010, 269, 344–350. [Google Scholar] [CrossRef]
  7. Jianxin, D.; Yousheng, L.; Wenlong, S. Difusion wear in dry cutting ofTi-6Al-4V with WC/Co carbide tools. Wear 2008, 265, 1776–1783. [Google Scholar] [CrossRef]
  8. List, G.; Sutter, G.; Bouthiche, A. Cutting temperature prediction in high speed machining by numerical modelling of chip formation and its dependence with crater wear. Int. J. Mach. Tools Manuf. 2012, 54–55, 1–9. [Google Scholar] [CrossRef]
  9. Li, B.; Zhang, H.; Wang, H.; Chang, J.; Sun, X. Numerical simulation technology on tool wear of metal cutting. In Proceedings of the International Conference on Advanced Technology of Design & Manufacture, Beijing, China, 23–25 November 2010. [Google Scholar]
  10. Chemn, G.; Chang, Y. Using two-dimensional vibration cutting for micro-milling. Int. J. Mach. Tools Manuf. 2006, 46, 659–666. [Google Scholar]
  11. Hsu, C.Y.; Huang, C.K.; Wu, C.Y. Milling of MAR -M247 nickel-based superalloy with high temperature and ultrasonic aiding. Int. J. Adv. Manuf. Technol. 2007, 34, 857–866. [Google Scholar] [CrossRef]
  12. Suárez, A.; Veiga, F.; de Lacalle, L.N.L.; Polvorosa, R.; Lutze, S.; Wretland, A. Effects of ultrasonics-assisted face milling on surface integrity and fatigue Life of Ni- Alloy 718. J. Mater. Eng. Perform. 2016, 25, 5076–5086. [Google Scholar] [CrossRef]
  13. Biermann, D.; Kersting, P.; Surmann, T. A general approach to simulating workpiece vibrations during five-axis milling of turbine blades. CIRP Ann. Manuf. Technol. 2010, 59, 125–128. [Google Scholar] [CrossRef]
  14. Shen, X.H.; Zhang, J.H.; Yin, T.J.; Dong, C.J. A study on cutting force in micro end milling with ultrasonic vibration. Adv. Mater. Res. 2010, 905, 1910–1914. [Google Scholar] [CrossRef]
  15. Shen, X.H.; Wang, M.Y. Finite element analysis of temperature field in vibration milling. Key Eng. Mater. 2016, 693, 1030–1037. [Google Scholar] [CrossRef]
  16. Shen, X.H.; Zhang, J.H.; Li, H.; Wang, J.J.; Wang, X.C. Ultrasonic vibration- assisted milling of aluminum alloy. Int. J. Adv. Manuf. Technol. 2012, 63, 41–49. [Google Scholar] [CrossRef]
  17. Ni, C.H.; Zhu, L.; Yang, Z.H. Comparative investigation of tool wear mechanism and corresponding machined surface characterization in feed-direction ultrasonic vibration assisted milling of Ti-6Al-4V from dynamic view. Wear 2019, 436, 203006. [Google Scholar] [CrossRef]
  18. Sajjady, S.A.; Abadi, H.N.H.; Amini, S.; Nosouhi, R. Analytical and experimental study of topography of surface texture in ultrasonic vibration assisted turming. Mater. Des. 2016, 93, 311–323. [Google Scholar] [CrossRef]
  19. Tao, G.; Ma, C.; Bai, L.; Shen, X.; Zhang, J. Feed-direction ultrasonic vibration. assisted milling surface texture formation. Mater. Manuf. Process 2017, 32, 193–198. [Google Scholar] [CrossRef]
  20. Chen, G.; Ren, C.; Zou, Y.; Qin, X.; Lu, L.; Li, S. Mechanism for material removal in ultrasonic vibration helical milling of Ti6Al4V alloy. Int. J. Mach. Tools Manuf. 2019, 138, 1–13. [Google Scholar] [CrossRef]
  21. Byme, G.; Dornfeld, D.; Denkena, B. Advancing cutting technology. CIRP Ann. Manuf. Technol. 2003, 52, 483–507. [Google Scholar]
  22. Pawade, R.S.; Sonawane, H.A.; Joshi, S.S. An analytical modeling to predict specific shear energy in high-speed turming of Inconel 718. Int. J. Mach. Tools Manuf. 2009, 49, 979–990. [Google Scholar] [CrossRef]
  23. Fang, N.; Wu, Q. A comparative study of the cutting forces in high speed machining ofTi-6AI-4V and Inconel718 with around cutting edge tool. J. Mater. 2009, 209, 4385–4389. [Google Scholar]
  24. Chen, R. Principles of Metal Cutting; Machine Press: Beijing, China, 2007. [Google Scholar]
  25. Wu, J.; Han, R. New Technologies in Modern Mechanical Processing; Publishing House of Electronics Industry: Beijing, China, 2017. [Google Scholar]
  26. Wang, Q. Research and Application of Functional Principal Component Analysis and Functional Linear Regression Model. Diploma Thesis, Chongqing Technology and Business University, Chongqing, China, 2020. [Google Scholar]
  27. Ma, Y.; Yue, Y. Research on Surface Roughness Prediction Model of T-itanium Alloy TC25 Milling. Manuf. Technol. Mach. Tool 2020, 8, 141–145. [Google Scholar] [CrossRef]
  28. Liu, A. SPSS Basic Analysis Tutorial; Peking University Press: Beijing, China, 2014. [Google Scholar]
  29. Peng, D. Prediction of Milling Process and Analysis of Surface Quality for TC4. Diploma Thesis, Tianjin University, Tianjin, China, 2012. [Google Scholar]
  30. Yang, Y. Numerical Simulation and Experimental Study on Axial Ultrasonic Vibration Assisted Milling of Titanium Alloy. Diploma Thesis, Nanjing University of Science and Technology, Nanjing, China, 2021. [Google Scholar]
  31. Liu, Z.; Zhang, C.; Ren, J. Dry Cutting Technology and Its Application; China Machine Press: Beijing, China, 2005. [Google Scholar]
Figure 1. Milling Model.
Lubricants 11 00245 g001
Figure 2. Residual Analysis of tool wear.
Lubricants 11 00245 g002
Figure 3. Influence distribution of n, ap, and fz on tool wear.
Lubricants 11 00245 g003
Figure 4. Schematic diagram of axial vibration milling.
Lubricants 11 00245 g004
Figure 5. Axial vibration path planning.
Lubricants 11 00245 g005
Figure 6. Comparison of chip cutting between ordinary milling and vibration milling.
Lubricants 11 00245 g006
Figure 7. Temperature distribution diagram of vibration milling and ordinary milling area.
Lubricants 11 00245 g007
Figure 8. Temperature Distribution Diagram of Vibration Milling and Common Milling Cutters.
Lubricants 11 00245 g008
Figure 9. Trend of milling force between vibration milling and ordinary milling.
Lubricants 11 00245 g009aLubricants 11 00245 g009b
Figure 10. Equivalent Stress Trend of Vibration Milling and Ordinary Milling Workpieces.
Lubricants 11 00245 g010
Figure 11. Analysis of tool wear in Vibration Milling and Ordinary Milling.
Lubricants 11 00245 g011
Figure 12. TIALN and TIN coating distribution diagram.
Lubricants 11 00245 g012
Figure 13. Temperature variation trend of cutting tools with different coating types.
Lubricants 11 00245 g013
Figure 14. Trend of Three Direction Milling Force Changes for Different Coating Types of Tools.
Lubricants 11 00245 g014
Figure 15. Distribution of maximum wear of different types of coated tools.
Lubricants 11 00245 g015
Table 1. Milling cutter model parameters.
DiameterTooth NumberFront AngleBack AngleHelix AngleRadius of the Tool
10 mm412°30°1 mm
Table 2. Orthogonal Simulation Experimental Data.
Spindle Speed
n (r/min)
Cutting Depth
ap (mm)
Feed per Tooth
fz (mm/z)
Tool Wear Amount
H (μm)
130000.20.10.557
230000.30.20.499
330000.40.30.343
430000.50.40.351
535000.20.20.387
635000.30.10.778
735000.40.40.349
835000.50.30.444
940000.20.30.208
1040000.30.40.323
1140000.40.11.010
1240000.50.20.645
1345000.20.40.309
1445000.30.30.363
1545000.40.20.718
1645000.50.10.898
Table 3. Regression Model Calculation Results.
Regression CoefficientEstimated Value of Regression CoefficientConfidence Interval
a0−1.9922−3.9917, 0.0072
a10.4112−0.1472, 0.9695
a20.53450.2881, 0.7808
a3−0.6866−0.8487, −0.5244
Table 4. Analysis of Maximum Tool Wear (H) Range.
n (Speed)ap (The Millin Depth)fz (Feed per Tooth)
K11.75001.46103.2430
K21.95801.96302.2490
K32.18602.42001.3580
K42.28802.33801.3320
k10.43750.36530.8108
k20.48950.49080.5623
k30.54650.60500.3395
k40.57200.58450.3330
RF0.13450.23980.4778
Primary and secondary orderfz > ap > n
Table 5. Performance Table of TIALN and TIN Coatings.
Coating TypesTIALNTIN
Hardness value (HV)33002300
The coefficient of friction (N/s/mm/C)0.40.49
Coefficient of heat conduction1023
Disclaimer/Publisher’s Note: The statements, opinions and data contained in all publications are solely those of the individual author(s) and contributor(s) and not of MDPI and/or the editor(s). MDPI and/or the editor(s) disclaim responsibility for any injury to people or property resulting from any ideas, methods, instructions or products referred to in the content.

