Article

An Experimental Investigation of the Tribological Performance and Dispersibility of 2D Nanoparticles as Oil Additives

Department of Mechanical Engineering, Indian Institute of Technology, Delhi 110016, India
*
Author to whom correspondence should be addressed.
Lubricants 2023, 11(4), 179; https://doi.org/10.3390/lubricants11040179
Submission received: 22 March 2023 / Revised: 13 April 2023 / Accepted: 14 April 2023 / Published: 17 April 2023
(This article belongs to the Special Issue Tribology of 2D Nanomaterials)

Abstract

:
The present study aims to investigate the tribological performance of 2D nanoparticles such as graphene (G), molybdenum disulfide (MoS2), hexagonal boron nitride (hBN), and reduced graphene oxide (rGO) as gear lubricant additives. A new method of additive doping in gear lubricants was proposed and examined in terms of the degradation of lubricants. The additives were energized by ultrasonication, thermal agitation, and mechanical shearing to enhance the dispersibility and stability, which were confirmed using visual and rheological analysis. Further, the tribological performance of the nano-additives was studied by doping them in fresh lubricants, chemically degraded lubricants, and chemically degraded lubricants with surfactants. The results indicate that surface roughness and the method of mixing play a crucial role in reducing wear. The nano-additives exhibit an inverse relationship with the roughness, and their agglomeration results in a decline in performance. To mitigate agglomeration, oleic acid surfactant was employed, which diminished the effects of nano-additives and degraded the lubricant. The attenuated total reflectance-Fourier transform infrared spectroscopy (ATR-FTIR) analysis revealed that the oleic acid and deteriorating reagent work synergistically, leading to enhanced wear volume and reduced friction. The nano-additives were characterized using field emission scanning electron microscopy (FESEM) and transmission electron microscopy (TEM). Overall, the study presents a comprehensive plan for new method of additive mixing, stability, dispersibility and tribological performance of the selected 2D nanoparticles.

1. Introduction

The growing global demand for energy has emphasized the need for more energy-efficient components of moving machinery. Wear and friction are major contributors to machinery inefficiency and material loss [1,2]. Several researchers [3,4,5,6,7,8,9,10,11] have proposed using various solid/liquid lubricants and low shear material coatings, chosen based on the application and its responsiveness, to address this issue. Spikes et al. [12] provided a detailed classification and listing of liquid lubricants formulated with molecular additives to confer specific properties based on their intended use.
In recent years, researchers [13,14,15,16] have focused on the use of solid lubricants as compounds in liquid lubricants to study their composite effects, which can be synergistic or antagonistic [12]. There has been a growing interest among researchers in the synthesis of 2D nanoparticles [17,18] and the investigation of their tribological performance [19] under various operating conditions. This is a result of the exceptional ultra-low shear strength exhibited by 2D nanoparticles, which is a result of their material isotropy and controlled layer orientation [17].
The tribological efficacy of 2D nanomaterials in boundary lubrication is proportional to the number of atomic layers and the interlayer shear force [17,20], and the tribological behaviour is determined using techniques such as atomic force microscopy (AFM) and friction force microscopy (FFM) [15,17,18]. The number of layers has a direct relationship with friction force [20]. However, boundary lubrication has limitations, particularly with the critical thickness of the coated layer, which can be worn away over time [18]. The reactivity of the nanomaterial with water and corrosive environments can lead to the breakdown of the deposited layer [21].
When dispersed in base oils, synthesized nanomaterials exhibit a high tendency to agglomerate [18,22,23], necessitating physical and chemical treatments [23,24] to enhance their stability. Temperature, time, and dispersion rate have a significant impact on the stability of dispersed nanoparticles. In addition, oxidation and acidification of the lubricant have a significant impact on the nanoparticles’ stability [25]. Physical treatments, such as ultrasonication and homogenization, and chemical treatments, such as surface modification and the use of surfactants, have been used to increase the nanoparticles’ stability [17]. It has been discovered that ultrasonication and homogenization effectively reduce the aggregation of nanoparticles by dispersing the clusters into smaller particles [24]. Surface modification entails the coating of nanoparticles with functional groups to enhance their dispersion and stability in lubricants [23]. It has been discovered that the use of surfactants [26,27,28,29] improves the dispersion and stability of nanoparticles in lubricants by reducing interparticle forces and averting agglomeration.
Numerous studies [8,11,18,30,31,32,33,34,35,36,37,38,39,40,41,42,43,44,45,46,47] have investigated the tribological efficacy of nano-additives in base oil. According to these studies, the incorporation of nano-additives improves the load carrying capacity, frictional properties, and wear resistance of lubricants significantly. The working mechanisms of nano-additive modified lubricants are currently based on four main theories [40,47]: (a) the ball effect (nanoparticles function as a rolling ball between the contacting surfaces); (b) tribochemical reactions form a thin tribofilm separating contacting surfaces; (c) the adsorption film theory; and (d) the mending effect. The mending effect theory proposes that nano-additives can restore and renew worn machine surfaces during operation [30].
It is possible to improve the properties of widely available lubricants by dispersing granules of solid lubricant that are either layered, flake-like, or spherical [14,32,33,34]. Synergistic improvements in tribological performance [43,44,45] can be achieved by dispersing granules of molybdenum disulfide, graphite, boron nitride, graphite, fullerene, Cu, CuO, functionalized graphene, silicon oxide, carbon nanotubes, etc., in lubricants [17]. Several studies [14,17,19] have investigated the impacts of oils containing dispersed solid lubricants on wear and friction. The optimum concentration, morphology, size, oil solubility, and particle hardness were found to have a significant impact on the tribological efficacy of these additives [17,19]. Few researchers categorize nano-additives from 0-D to 3-D [47], based on the number of dimensions they have. Finding the optimal concentration and dimension of nano-additives is crucial for optimal performance. However, the use of nano-additives is constrained by operational variables such as temperature, load, and contact type [18]. Therefore, when using nano-additives for tribological uses, it is important to consider the aforementioned factors.
The effects of load, shear, particle size, and humidity on lubricant behaviour have been studied [18,48,49,50,51,52,53], and optimization methods [49] have been used to select appropriate lubricant formulations. Lubricants’ responses to load and stress are crucially important [48]. Because of the deformation and tension that high loads put on contacting surfaces, friction and wear can be made worse. A lubricant’s viscosity, thickness, and film strength all contribute to how well it reduces friction and wear under heavy weights; high shear rates can cause the lubricant to experience substantial mechanical and thermal stresses, lowering its effectiveness [50]. These problems can be mitigated, and the lubricant’s performance can be improved by picking the right additives and basic oils. Furthermore, humidity is a significant element that can affect lubricant performance. When the humidity is too high, acids and other corrosive species form in the lubricant, which can cause serious harm to the mating surfaces. Scientists have created cutting-edge formulations with improved water separation and rust protection properties [51] to lessen the lubricant’s vulnerability to the effects of moisture. Additionally, the impacts of polytetrafluoroethylene (PTFE) particles as grease additives were studied by Kumar et al. [30]. Results showed that tiny, spherical particles performed better than other shapes when tested. In addition, Kumar et al. [31] looked into how talc nanoparticles in oil would affect tribological performance. The results showed that anti-wear properties were improved by 43% at an optimum concentration of 2 wt%, while extreme pressure properties were improved by 17%. The significance of particle size, shape, and concentration in the selection of nano-additives for tribological uses is demonstrated by these findings. The efficiency of the grease and the longevity of the equipment both benefit from careful consideration of these factors. With an eye toward oil-based, water-based, and metal-derivative additives, Xiao and Liu [14] performed a thorough review of 2D nanomaterial lubricant additives. Graphene, with a thickness of only 0.335 nm and a hexagonal structure, was reported as the thinnest nanomaterial in the review, which focused mainly on the role of 2D materials in lowering friction and wear. The authors also described how functionalizing graphene with GO, iron oxide, and zirconium oxide improved its performance by creating a hybrid with shearing and rolling characteristics. Some nanoparticles, like WS2 and MX2, tend to aggregate in base oil because of their high density, but MoS2 showed excellent dispersibility and relatively low load-bearing capacity, as noted by the authors. To enhance tribological performance in different lubrication applications, these results highlight the significance of choosing the appropriate 2D nanomaterial and its functionalization. Research by Huang et al. [32] on the effects of doping paraffin oil with graphene nanosheets found that the inclusion of these nanosheets increased the oil’s resistance to friction, wear, and load. At a concentration of 0.05% graphene, How et al. [33] found a 33% and 34% decrease in friction and wear in synthetic oil.
In addition, Xie et al. [34], who investigated the tribological performance of SiO2/graphene mixtures, reported that a mixture of 0.1 wt% nano-SiO2 and 0.4 wt% graphene in water decreased the friction coefficient by about 48% and the wear volume by about 79%. These studies lay the groundwork for the synergistic use of a combination of nano-additives in lubrication applications, in which the tribological performance of the lubricant can be significantly improved through the proper selection of additive concentration and combination. The effect of two-dimensional (2D) materials on interfacial friction was the subject of a recent systematic study by Guo et al. [15] and Marian et al. [43]. Nanomaterial integration, the authors note, can ease surface changes that lessen surface roughness. Furthermore, suitable base lubricants can encourage surface self-healing, which further reduces friction and wear. These results indicate that surface modification incorporating 2D materials can enhance interfacial friction and wear properties.
Recent research has largely centred on finding optimal nano-additives to improve lubricant performance. However, there is a lack of published work on restoring the effectiveness of lubricants that have deteriorated during storage or while in use. Limited studies have been conducted on degraded grease [54] and liquid lubricants [55]. Given this, the current research set out to examine how four different 2D nanoparticles—G, MoS2, hBN, and rGO—improve the tribological performance of chemically deteriorated lubricants. Chemically degraded gear lubricants of API GL4 grade were used in the experiments. The impact of surface roughness and surfactant addition on the performance of the nano-additives investigated, and a new methodology for effectively dispersing the 2D nano-additives in the oil was developed.

2. Materials and Methods

2.1. Materials

2.1.1. Lubricant

The study employs the commercially available API GL4 EP90 (VI = 90) grade gear lubricant, Maharashtra, India. At a shear rate of 100 s−1, the lubricant has a dynamic viscosity of 0.21 Pa·s.

Artificial Lubricant Degradation
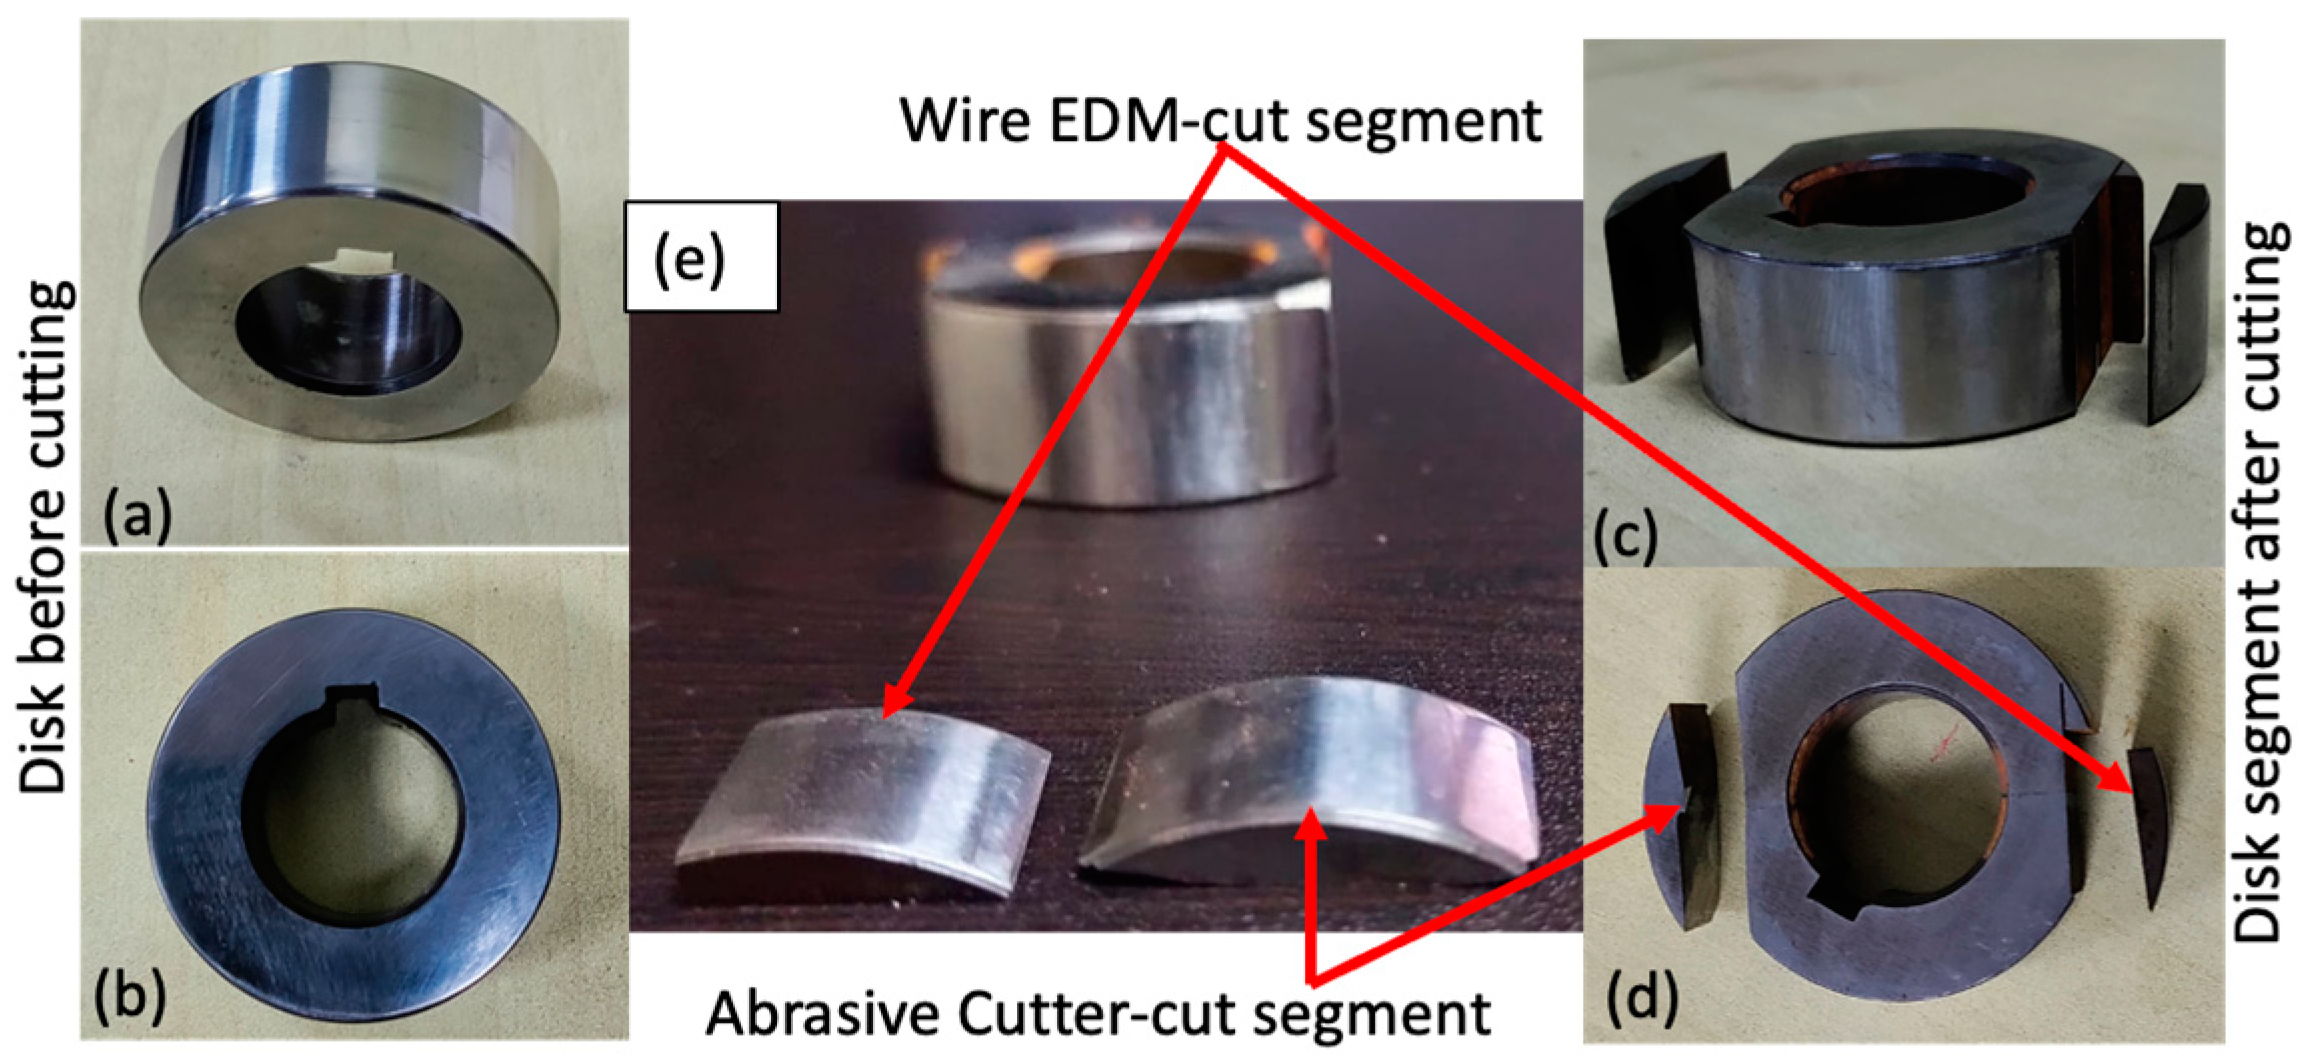
The lubricant is degraded artificially by mixing aqueous HCl in the manner described in reference [55]. The lubricant’s life can be estimated using the following relationship:
Time = 10 18.02 × ( %   aqueous   HCl   ) 4.75
In the current study, aqueous HCl doped at 0.0025% v/v degrades the GL4 EP90 oil to an equivalent degraded life of ~7520 h.

2.1.2. Test Samples

The tests were performed on a 12 mm × 12 mm × 12 mm cuboid block made of EN24 steel. The hardness of the block is maintained at 40 ± 1 HRC. While looking for better nano-additives for liquid lubricants, it is necessary to use superfinish tribo-surfaces because specific film thickness, which determines whether lubrication regimes are boundary, mixed, or hydrodynamic, is determined by the surface roughnesses of the tribo-surfaces. Therefore, all of the test surfaces were superfinished using grit numbers 600, 1000, and 2000 abrasive sandpapers. The average surface roughness of all surfaces decreased from “Ra = 0.1817 ± 0.05 μm, and Rq = 0.3615 ± 0.119 μm” to “Ra = 0.032 ± 0.005 μm, and Rq = 0.051 ± 0.0.009 μm”. A disc of 40 mm diameter with an average hardness of 60 HRC and an average roughness of “Rq = 0.046 ± 0.007 μm” was used as the counter surface.

2.1.3. Nano-Additive Particles

Potential lubricants must provide superlubricity and maximum wear resistance to increase service life and ensure equipment dependability. Four distinct nanomaterials (graphene (G), reduced graphene oxide (rGO), hexagonal boron nitride (hBN), and molybdenum disulfide (MoS2)) with high bond strength between atoms in the same layer and low shear strength between layers were chosen as potential candidates for lubricating tribo-surfaces. The purpose of this research is to develop a new generation of lubricants with improved tribological (superlubricity and zero-wear) properties to improve the energy efficiency and reliability of existing mechanical systems. Table 1 contains the specifics.

2.2. Methodology

Figure 1 depicts the current study’s overall framework. In the study, the framework consists of four steps. Initially, the 2D nanoparticles were dried at 100 °C. Subsequently, the 2D nanoparticles were mixed into the lubricant using the method proposed in the literature [56]. Additionally, a new method for dispersing the 2D nanoparticles in the lubricant is proposed. Both methods are described in greater detail in subsequent sections.
After preparing the colloidal solution, it was used for tribological testing in a lubricity tester and rheological analysis. The dried 2D nanoparticles and lubricity tester samples were processed for morphological and elemental characterisation.

2.2.1. Preparation of the Nanoparticle Contained Improved Lubricants

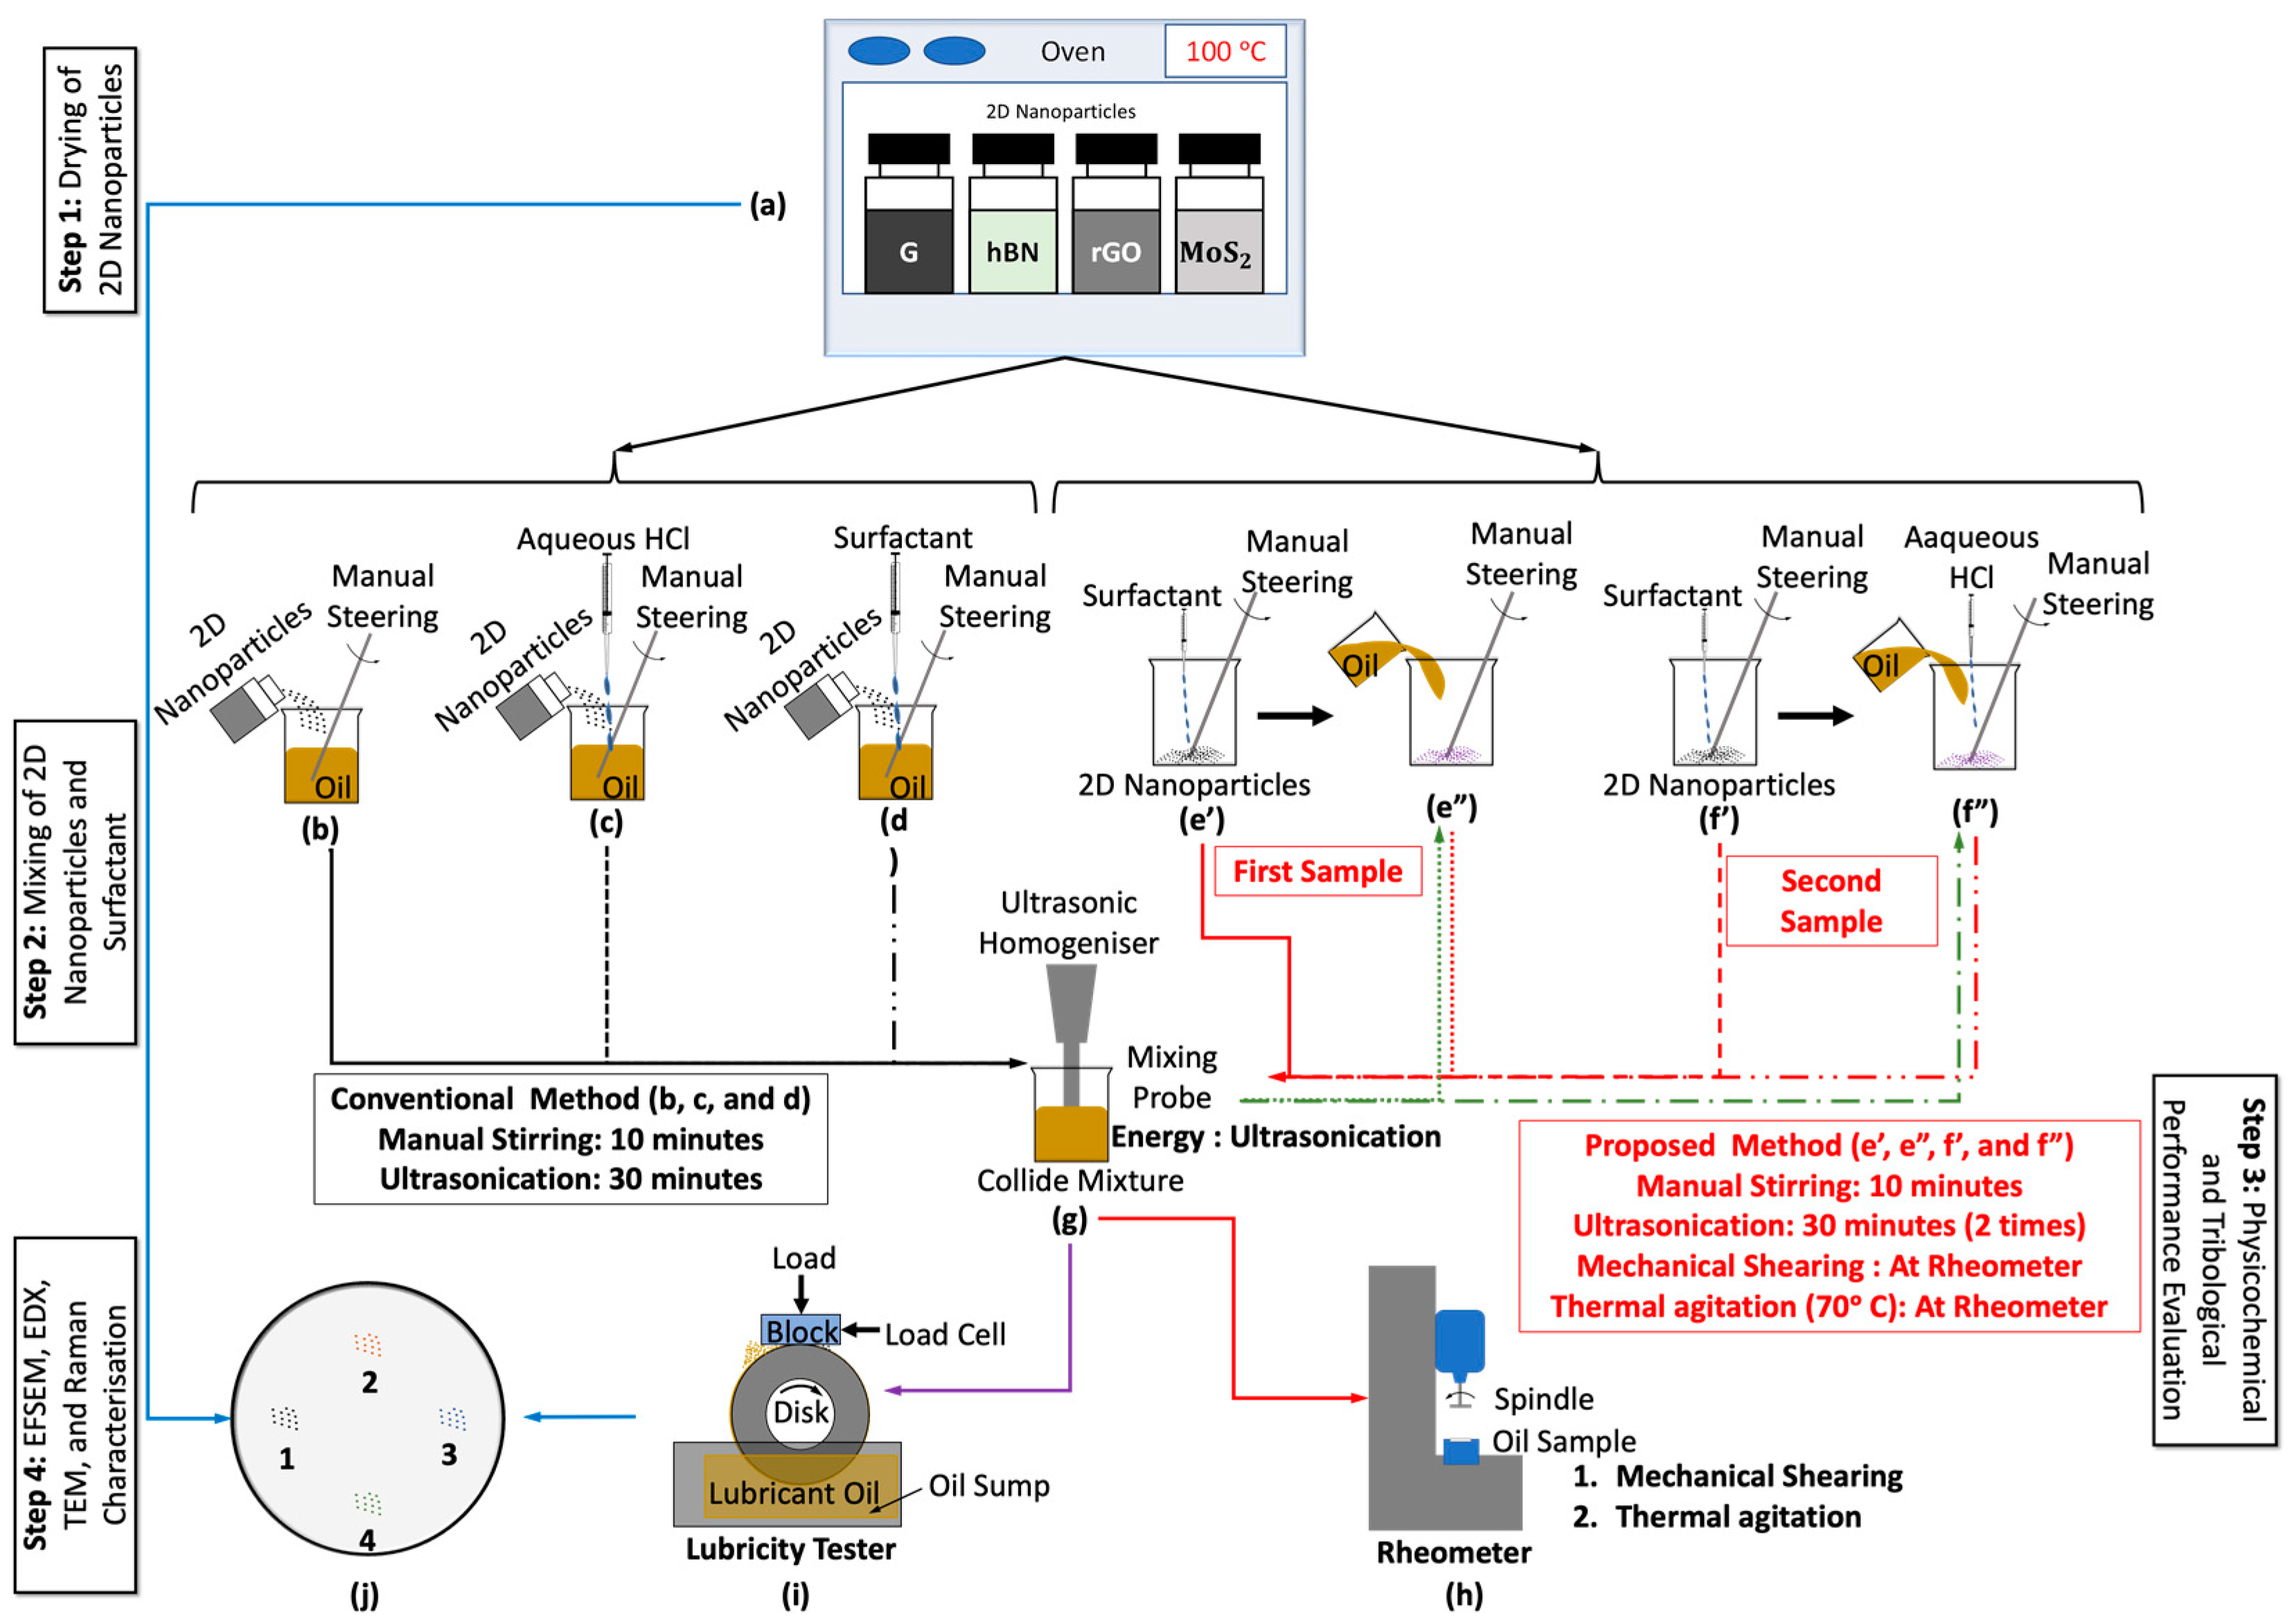
Process of Mixing of the Nanoparticles in Liquid Lubricant—Conventional Method

In this method, a volume of 40 mL of lubricant is placed in a glass beaker, and a predetermined weight percentage of nanoparticles is added to the lubricant. The mixture is then manually stirred for a duration of 10 min to ensure thorough mixing of the nanoparticles within the lubricant. In total, three samples were prepared using this method:
  • Figure 1b depicts the samples prepared using the conventional method, where the nanoparticles are mixed with fresh oil, and the solution is manually stirred.
  • Figure 1c, the nanoparticles are mixed with fresh oil and manually stirred, and the solution is chemically degraded using aqueous HCl.
  • Figure 1d, the nanoparticles are mixed with fresh oil, and a surfactant, oleic acid, is added after manually stirring the solution.
After mixing, the mixture is sonicated for 30 min using an ultrasonic sonicator with a probe diameter of 10 mm and a pulse on/off duration of 3 s. In order to homogenise the mixture and improve the dispersion of nanoparticles within the lubricant, this stage is crucial.

Process of Mixing of the Nanoparticles in Liquid Lubricant—Proposed Method

When using 2D nanomaterials, dispersibility in oil is a major issue. Because of the high surface-to-volume ratio of 2D materials and compelling van der Waals forces, nanomaterials appear to have a high tendency to aggregate. The interaction of nanoparticles with the liquid lubricant, as well as the interaction of nanoparticles with each other, can be managed to control nanoparticle dispersion. Energy (ultrasonication), thermal agitation, and mechanical shearing can all be used to reduce particle agglomeration. In fact, heterostructures (combining one nano-additive with other kinds of nano-additives: hBN and MoS2) will aid in the deagglomeration process because the surface of one type of nano-additive can be coated with another, reducing the cohesive force among similar nano-additive particles. Nanoparticles may deagglomerate during the regular sonication process, but over time, because of a stronger binding force, they often re-agglomerate. The concept of building heterostructures out of two or more nanomaterials to improve their durability was proposed as a solution to this issue. Under mechanical shearing, uncoiled nanoparticles exfoliate to produce nano-sheets of bimaterials or trimaterials with weaker cohesion forces. The nanoparticles are less likely to rebound under these conditions, and the dispersibility of nanomaterials will be effective.
To test this hypothesis, a small sample was prepared using 3 mL of lubricant and a corresponding concentration of nanoparticles. The sample was sonicated conventionally and then subjected to mechanical shearing for 10 min using a rheometer with a shear rate of 1000 s−1 and a temperature of 70 °C. The result of consistent viscosity over time at 1000 s−1 shear rate hinted at the efficacy of the proposed method. However, a different setup was required to scale up because the rheometer can only hold 2–3 mL of oil sample.
To test the same hypothesis, a larger sample was made with 5 mL of lubricant and nanoparticles corresponding to 40 mL of the sample, as shown in Figure 1(e’ and f’). Three samples (Case 1—Fresh lubricant, Case 2—0.4 wt% of rGO, MoS2, hBN of each mixed with fresh lubricant and case 3—0.4 wt% graphene, 0.4 wt% rGo and 0.2 wt% of MoS2 mixed with fresh lubricant) were prepared to maintain heterogeneity. The mixture was sonicated for 30 min before being mixed with the remaining 35 mL of oil (Figure 1(e”)). The sample was sonicated once more to achieve a temperature of around 70 °C. These samples were tested in a lubricity tester at a high mechanical shear rate (10,000 s−1) while maintaining a very thin film thickness, and we compared these friction results. It’s worth noting that friction force decreases over time (as shown in Figure 2). The physical mechanisms of generating nanosheets and forming protective 2D films of nanomaterials on steel tribo-interfaces are responsible for the possibility of such positive friction results.
To summarize, the proposed method of generating heterostructures (as seen in Section 3) of the selected nanomaterials via mechanical exfoliation following sonication shows promise for improving the stability of 2D nano lubricants.

2.2.2. Experimental Design and Methodology

For the purpose of estimating the efficacy of nano-additives, a series of experiments (three levels of each nano-additive) were created using the L9 orthogonal array [57]. The chosen factors, their values, and the experimental strategy are displayed in Table 2.
The lubricating ability of a nano-lubricant is well known to be extremely sensitive to the concentration of nanoparticles. While low concentrations of particles may not help to improve tribological performance, high concentrations of nanoparticles increase the likelihood of particle agglomeration. According to the literature that is currently accessible, tribological performance has been enhanced using graphene in the range of 0.1% to 4% w/w [58], rGO in the range of 0.03% to 0.5% w/w [59], MoS2 in the range of 0.02% to 2% w/w [15,60], and hBN in the range of 0.1 to 0.5% w/w [61]. In the present study, nanoparticles have been maintained in the range of 0 to 0.4% w/w.
When using the lubricity testing apparatus (See Figure 3), the block (test specimen) was pressed against the spinning disc to gauge the tribological performance of the synthesized lubricants. Prior to and following the test, the test specimens’ weights were measured using a balance with a minimum count of 0.00001 g. Low rotational speed (100 rpm) of the disc and high normal load (125.86 N) on the block were kept, maintaining harsh operating conditions (boundary to mixed lubrication regimes). The detailed parameters selected for the study are listed in Table 3.

2.3. Experimental Setup

The tribological performance of the nanoparticles was evaluated using a lubricity tester manufactured by Ducom, India. Figure 3 depicts the test setup, which engages a cubical EN24 steel block on a hardened steel disc (counter surface). The induction motor drives this disc, which is partially immersed in lubricant. The lubricant inside the tank was kept at 40 degrees Celsius by an inbuilt heater and thermal cut-off switch.

2.4. 2D Nanoparticles Morphological Analysis (FESEM, EDX, TEM and Raman Analysis)

This paper examines the tribological performance of two-dimensional (2D) nanomaterials as lubricant additives. The underlying physical mechanisms, the creation of nanosheets, the development of heterostructures from the chosen nanomaterials, the development of a protective 2D film on steel tribo-interfaces, and the stable dispersion will depend mainly on intrinsic factors, such as the thickness, surface characteristics, and structural defects of the purchased 2D materials. Field emission scanning electron microscopy (EFSEM), energy dispersive X-ray spectroscopy (EDX), transmission electron microscopy (TEM), and Raman analysis were used to shed light on the morphology and elemental makeup of the particles.

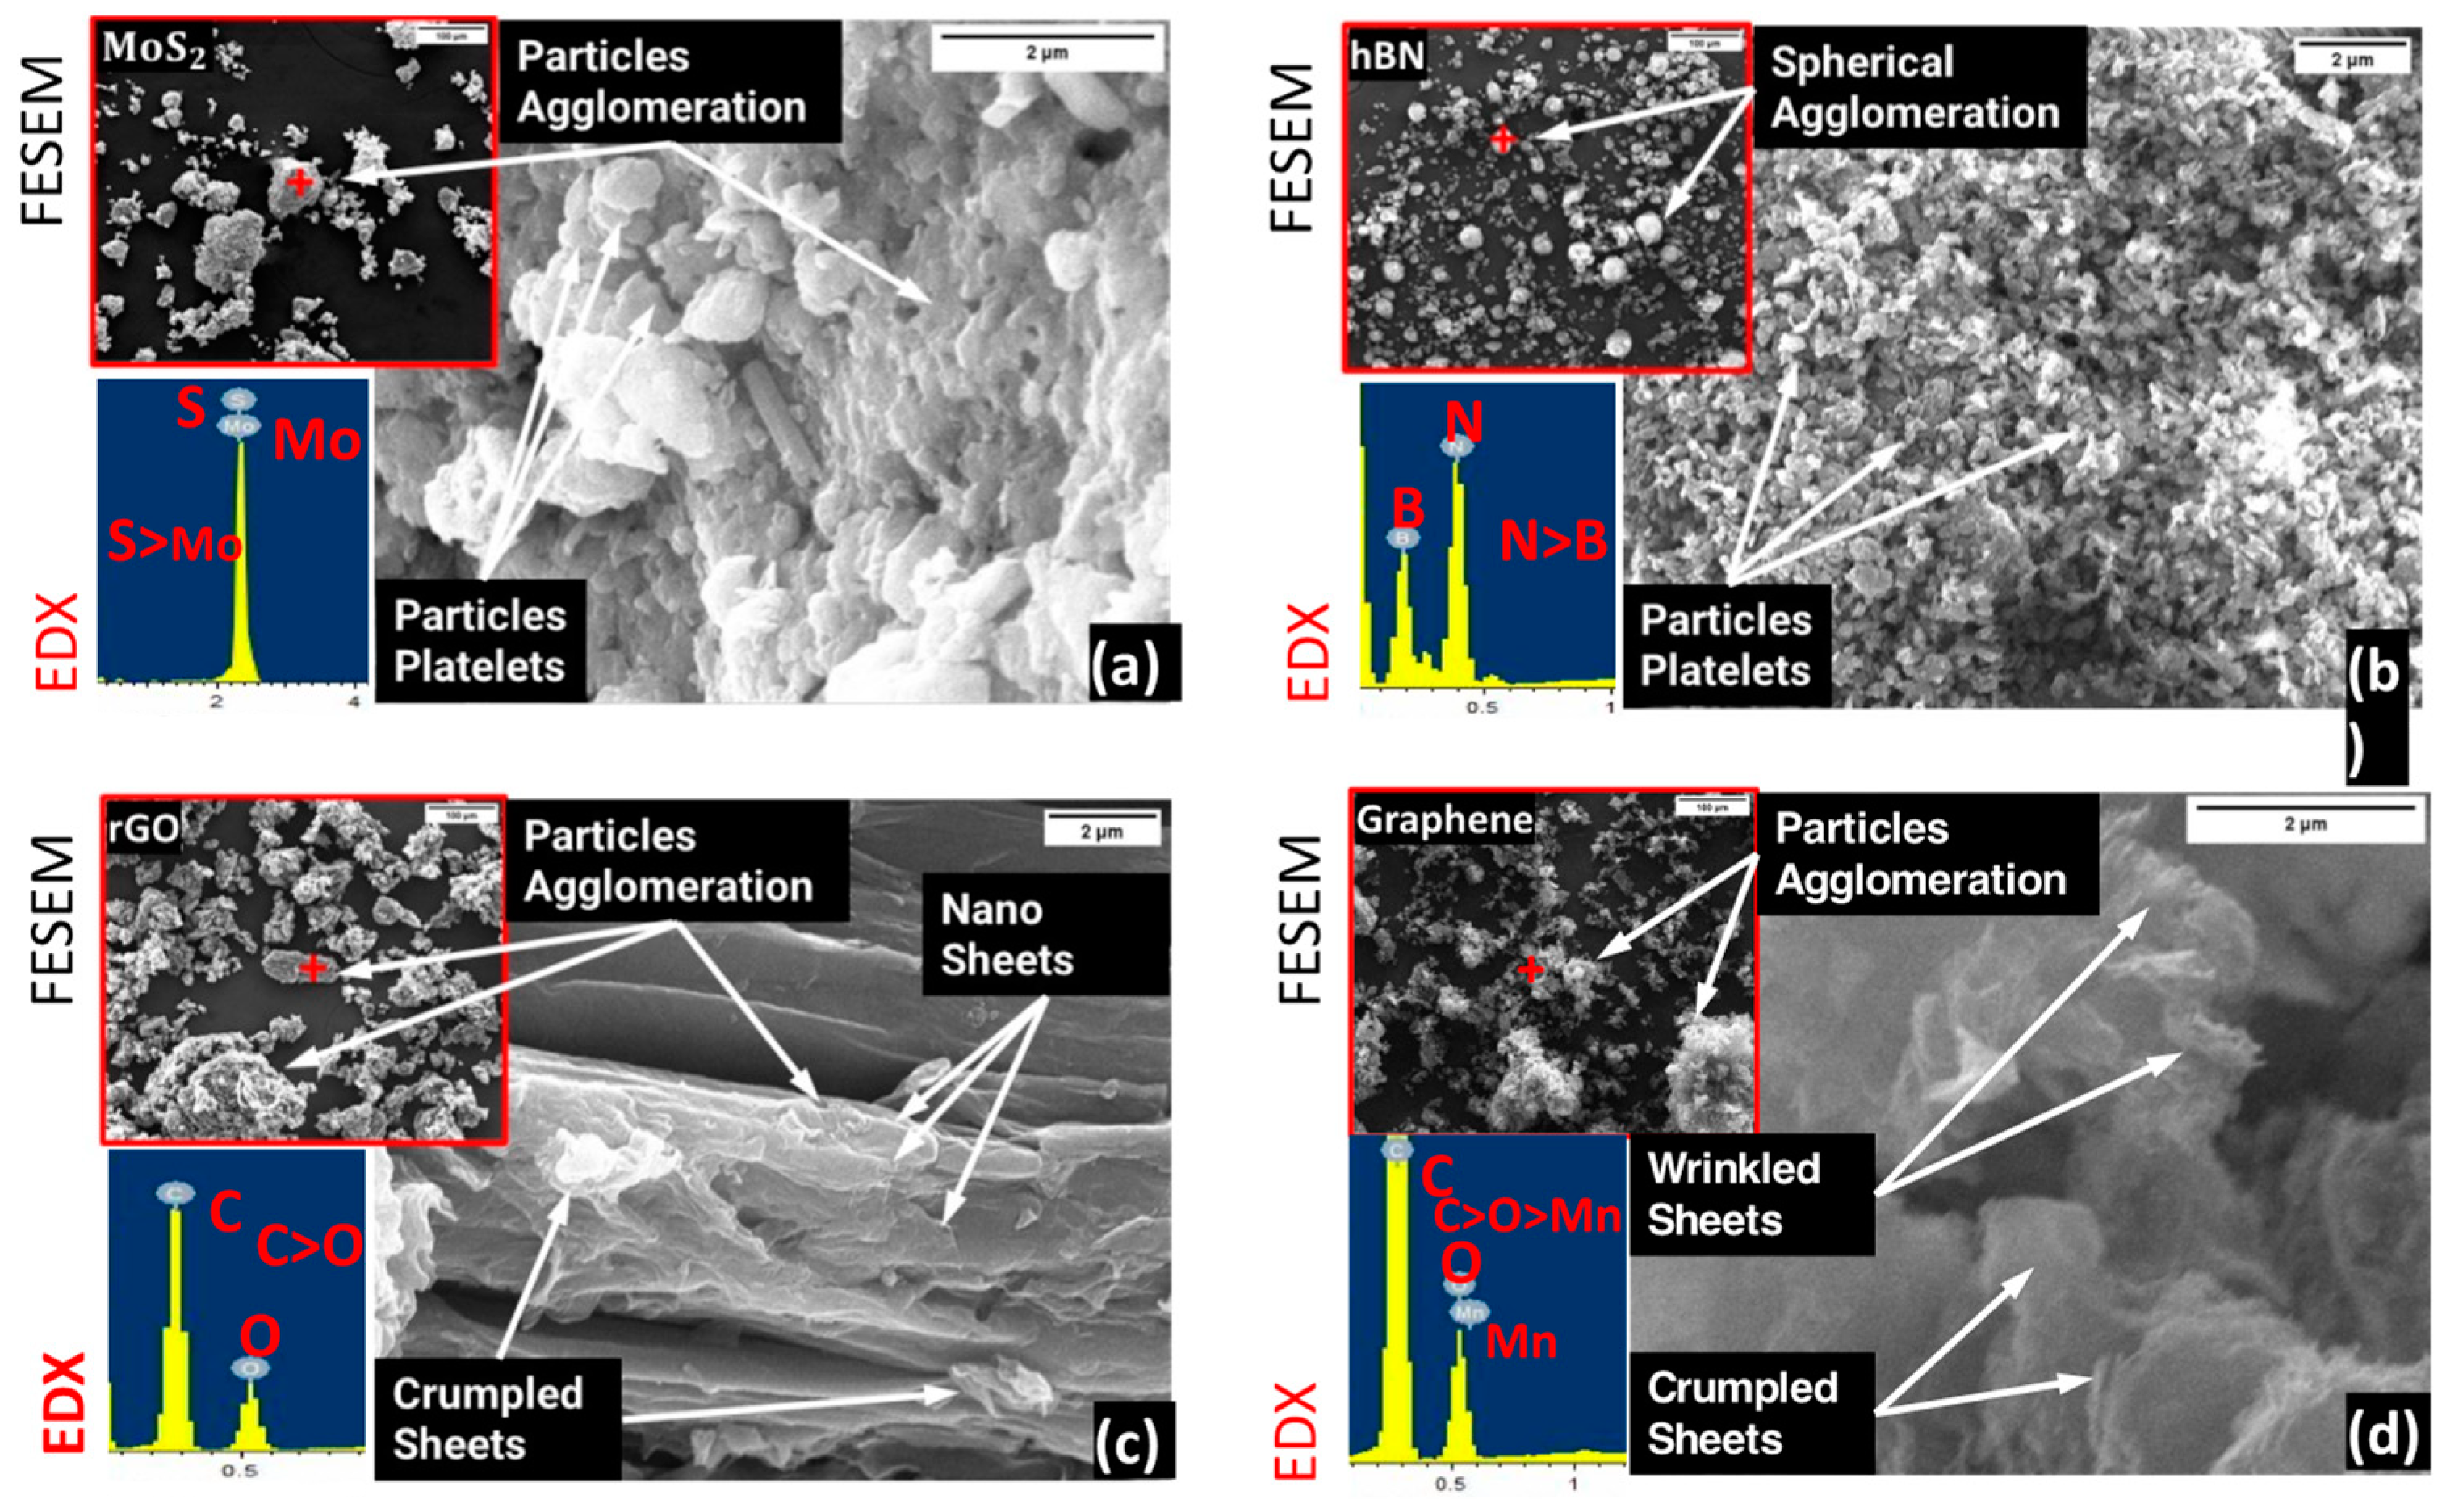
2.4.1. FESEM, EDX and TEM Analysis of 2D Nanoparticles

The morphology and topography of the nanosheets can be seen in FESEM pictures, and their elemental makeup and any impurities that may already be present can be determined by EDX analysis. The MoS2 and hBN were discovered to be aggregated and to have an irregular and spherical form, respectively, as shown in Figure 4 (a–d, FESEM’s images). High magnification images of MoS2 and hBN revealed a small, irregular sheet agglomerated shape. The rGO and graphene, on the other hand, were discovered in the shape of flakes, with layers agglomerated on top of one another. The strips of rGO and graphene were discovered in a crumpled and wrinkly state. It is also possible that rGO and graphene’s crumpled and wrinkled appearance is due to the particles’ extreme thinness, which makes them bend and crumple readily.
Furthermore, EDX spectra showed that the particles were primarily composed of their base elements, except for graphene, which had a manganese impurity of 0.21%. (Mn). The 0.21% impurity level, though low, is not likely to have a major effect on their performance. Strong van der Waals pressures caused the particles to aggregate into small sheets, as was observed.
In order to validate the nature, crystallinity, and size distribution of the nanosheets, as well as to find any impurities within the 2D sheets that might have an impact on their performance, the particles were also subjected to TEM analysis. The results of the TEM examination in Figure 5a–d showed that the particles were layered, with a thickness of about 1 nm and a width of a few nanometres (as shown in the figure). As a result, it was verified that the particles were 2D.

2.4.2. Raman Analysis of 2D Nanoparticles

The Raman spectra of four 2D nanoparticles (shown in Figure 6), including graphene, reduced graphene oxide (rGO), molybdenum disulfide (MoS2), and hexagonal boron nitride (hBN), were obtained using a microscopic Raman spectrometer with a 532 nm laser wavelength. For graphene and rGO, the D, G, and 2D bands were observed, with the D band attributed to defects and disordered carbon and the G band representing the vibration of ordered sp2–C in a 2D hexagonal lattice. The G, D, and 2D bands are affected by the number of layers and the graphene material’s quality. The G band is typically found at around 1586 cm−1 and corresponds to the stretching vibration of graphene’s sp2 carbon–carbon bonds. The 2D band, which is sensitive to the number of graphene layers, is located at around 2894 cm−1. The ratio of 2D to G band intensities (233/2259) can be used to estimate the number of graphene layers, with higher ratios indicating fewer layers.
The ID/IG (Graphene—‘2259/1124’ and rGO—‘2359/1735’) value was used to assess the degree of disorder and defect, and rGO’s lower ID/IG value compared to graphene indicated a lower degree of disordering and defects in the GO structure. The analysis of MoS2 revealed two distinct peaks at 382 cm−1 and 405 cm−1, corresponding to the E 2 g 1 and A1g mode of the material, respectively. The number of layers present in the sample was estimated by calculating the Raman shift difference between the E 2 g 1 and A1g vibration modes, which was found to be 23 cm−1 (shown in Figure 6b). Utilizing an empirical relationship proposed by Lee et al. [62], which relates the Raman shift corresponding to E 2 g 1 and A1g band and their difference to the thickness of the material, the thickness of the MoS2 layer was determined to be between 3 and 4 layers for a 23 cm−1 peak difference. The Raman spectrum of hBN showed a single peak at 1367 cm−1 corresponding to the E2g mode, which was attributed to the in-plane vibrational motion of the boron and nitrogen atoms. No other peaks in the spectrum demonstrate the purity of hBN nanoparticles.

3. Results and Discussions

In accordance with the designed experiments outlined in Section 2.2.2, tests were conducted on a lubricity tester. Prior to these tests, the impact of sample surface roughness was evaluated through two experiments utilizing blocks with differing roughness values, Rq 0.362 and 0.053, while utilizing parameters specified in Table 3. Wear was observed and quantified through mass loss and material density, resulting in wear volumes of 28.182 × 10⁻¹² and 7.686 × 10⁻¹² m3, respectively, as depicted in Figure 7. The reduction of surface roughness Rq from 0.362 µm to 0.053 µm was found to lead to a ~73% decrease in wear volume. Because high surface roughness causes the system to operate under the boundary lubrication regime (specific film thickness 0.49, Appendix A), more asperity contact occurs, resulting in increased wear. The schematic representation of the contact is shown in Figure 8, where asperities are present in the contact, leading to increased wear. Nanoparticles will relatively be more useful on rough surfaces, where the 2D nanoparticles fill the valleys, reducing the overall roughness and wear of the contacting surfaces.
Furthermore, as the film thickness decreases, the shear rate approaches 10,000 s−1. Under such high shear rates, hetero-nanomaterials may rub against each other, transfer layers, and form heterostructures (Figure 8e) of nanoparticles that aid in friction reduction.

3.1. Specific Film Thickness Calculation

The viscosity of a lubricant is an important factor. Temperature and shear rate have a significant impact on viscosity, which is important for determining film thickening. The rheometer was used to determine the viscosity of three selected lubricant samples, L1, L3, and L9, as listed in Table 2. As shown in Figure 9a, viscosity measurements were obtained by modulating the shear rate. Changes in viscosity with varying shear rates revealed that viscosity curves are a result of both Newtonian and non-Newtonian behaviour in certain locations. To better understand the behaviour of these three nanofluids, we ran further tests on the viscosity of the nanofluids in three different regions—Region 1 shear rate 100–500 s−1 (Figure 9b), Region 2 shear rate 1000–1500 s−1 (Figure 9c), and Region 3 shear rate 1500–2000 s−1 (Figure 9d).
Our findings demonstrate that all the samples display non-Newtonian behaviour, despite the fact that the degree of non-Newtonian behaviour varies for various regions in contrast to the region where the shear rate is 500–1000 s−1. Investigating the viscoelastic behaviour of such non-Newtonian samples is worthwhile, as is contrasted with the behaviour of pure (base) oil. The characteristics of the base oil are unknown to the authors because the OEM did not disclose data relating to the base oil of the commercial gear oil [63] used in the current study. As a result, we were unable to test the viscoelastic behaviour of synthesized lubricants. Furthermore, as shown in Figure 10, it was challenging to obtain accurate data when we attempted to expand experiments to shear rates higher than 2000 s−1 due to lubricant splashing out.
By incorporating nanoparticles into oil, the viscosity of the lubricant is raised (improving anti-wear effectiveness) while also increasing the oil’s shear thinning tendency. Lubricant effective viscosity at operating temperature and shear rate must be specified for the experimental task. The lubricant’s dynamic viscosity was measured at 1000 s−1 at two temperatures (40 and 70), as listed in Table 4. Walther’s relation [64,65] was used to calculate the lubricant’s dynamic viscosity at 60 °C. It should be noted that the lubricant’s viscosity varies with shear rate. The shear rate at the contact region was around 0.2 million s−1, implying that the viscosity would decrease further under these conditions.
The procedure of calculating a particular film thickness detailed in Appendix A.
The calculated specific film thickness is in the range of 2–3 and the computed contact pressure is less than 150 MPa, confirming the mixed lubrication condition.

3.2. Tribological Evaluation

The tribological performances of nanoparticles, for both combining nanoparticles in fresh oil (without aqueous HCl) and mixing nanoparticles in chemically degraded (with aqueous HCl mixed) lubricants, were evaluated using the lubricity tester (as shown in Figure 3). The wear mass was calculated by weighing the test specimen before and after the test with an accuracy of 0.00001 g. Figure 11 depicts the obtained results for wear volume and coefficient of friction. The sample ID corresponds to the designed experiments specified in Table 2. The wear volume increased with the addition of the aqueous HCl, as shown in Figure 11a. From Figure 11b, it can be observed that the coefficient of friction (COF) for the chemically degraded oil shows a lower value as compared to fresh oil. The observed anomaly is attributed to the development of an oxide layer [12] on the test specimen, which facilitates the attachment of friction modifiers and subsequently leads to a reduction in friction. To investigate this, we selected four samples (L1 and L3, with fresh and degraded lubricant) to determine why the performance of L3 with fresh lubricant is superior and does not adhere as well with degraded lubricant. Surfaces of test blocks were investigated by conducting FESEM and EDX analyses on all four samples. More detailed information about the experimental setup, methods, and results can be found in Section 3.3.
Sample L3 exhibited the greatest ‘wear resistance’ of the nano-additives mixed in conventional gear oil, as the measured wear is nearly zero. Moreover, sample L9 exhibits the worst performance, as the wear volume for nano-additives mixed in chemically degraded oil was 6.405 × 10⁻¹² m3. To investigate these results and comprehend the function of nanoparticles, it was decided to enhance the efficacy of nano-additives with surfactants like oleic acid. For a comprehensive understanding, both samples (L3 with the highest performance and L9 with the lowest performance) were chosen for testing. The oleic acid is expected to drop the agglomeration. However, as shown in Figure 12, the addition of oleic acid decreases the COF while increasing the volume of wear. The data presented in Figure 12a indicates a substantial reduction in wear, with a maximum decrease of 75% when compared to the wear rate of the initial base lubricant. Moreover, the addition of nano-additives to degraded lubricants can minimize wear by approximately 83%. In Figure 12b, the findings demonstrate that the nano-additives effectively decrease the average coefficient of friction in the range of 23.4% to 42.53% compared to the base lubricant.
According to the literature, oleic acid enhances the dispersibility and stability of nano-additive particles through polar bonding with them. However, the increased wear suggests that oleic acid (OA) may react with either the test surface or the chemically aged oil. To confirm this, four samples were selected for attenuated total reflectance-Fourier transform infrared spectroscopy (ATR-FTIR) analysis: ‘pure oil’, ‘best performing combination sample ID L3 mixed with aqueous HCl (L3@HCl)’, ‘L3 mixed with OA (L3@OA)’, and ‘L3@HCl + OA’. Figure 13 shows the ATR-FTIR spectra of the samples.
It can be observed from Figure 13 that the addition of aqueous HCl and OA leads to soot formation in the gear oil and acidification of the gear oil, as evidenced by an increase in the peak at about 2000 cm−1 and 1720–1732 cm−1. Increase in the peak at 3410 cm−1 indicates the formation of moisture. Increased moisture results from the disintegration of OA into carboxylic compounds, free oxygen, and hydrogen. It is also observed that aqueous HCl and OA act synergistically to degrade the lubricant, leading to an increase in wear volume and a decrease in friction. The formed oxide layer was ideal for the attachment as friction modifiers [12], resulting in a decrease in overall friction.
Based on the observations, it is possible to conclude that the formation of oxide layers on the surface decreases the coefficient of friction (COF) but increases wear in the form of oxides when the lubricant has degraded. The study also suggests that the nano-additives’ ineffectiveness may be due to their aggregation, which inhibits their ability to improve wear performance. In terms of wear, the study indicates that oleic acid did not exhibit positive results. To enhance the efficacy of nano-additives, improved dispersion techniques must be researched.
By calculating the mean wear mass of the blocks, the wear performance of the four selected nanomaterials was examined at three different lubricant concentration levels (0, 0.2, and 0.4 wt%). The “smaller is better” criterion [55] has been applied to the measured wear mass to assess the specific effects of each 2D nano additive. The results have been plotted in Figure 14. This figure indicates that, among the selected nano-additives, the hBN nanomaterial consistently exhibits the lowest wear values. The hBN nanomaterial showed the lowest wear values while using fresh gear lubrication for both concentration levels (0.2 and 0.4 wt%); however, when using degraded lubricant, it showed the lowest wear values at the second level of lubricant concentration (0.2 wt%). Notably, the minimum mean wear for hBN, which is the lowest of all nano-additives, is still greater than the best performing heterogeneous nano-lubricant combinations (L3 with fresh oil and L2 with degraded oil). This indicates that heterogeneity in 2D nonadditive behaviour plays a significant role in limiting agglomeration and positively influencing wear and friction performance. In conclusion, these findings indicate that the hBN nanomaterial is the most effective of the selected nano-additives tested in this research at reducing wear, although it is less effective than the heterogeneous mixture.

3.3. FESEM and EDX Analysis of the Worn out Surfaces

Two samples from each set of experiments were taken based on the aforementioned findings and processed for FESEM imaging and EDX elemental analysis. L1 and L3 are the chosen sample IDs for comparing the two cases.
According to Figure 15a,c, a thin oxide layer in the worn track is formed for the sample ID “L1” aqueous HCl mixed lubricant without any nano-additive. The oxide layer decreases the overall friction value but increases the wear rate. The EDX spectra shows a tiny amount of oxide in the form of elevated oxygen levels between 3.20 and 7.62 wt%, as well as an extra chloride component at 0.19 wt%. Additionally, it may be deduced from FESEM images that pure gear oil exhibits more plastic deformation than oil that has undergone chemical deterioration.
As seen in Figure 15b,d, sample ID “L3” exhibits zero wear when fresh oil is combined with 2D nano-additives but increases wear when aqueous HCl is added to degrade it. It can be observed that, for fresh lubricant, a smooth topography was found (FESEM images), but a more metallic passive layer was observed under degraded lubricant usage, which gets scrapped and reformed by successive sliding between the surface and relaxation.
Hence, it can be said that the HCl reacts with the test specimen and form a passive oxide layer that leads to increased wear. Further, as reported in reference [55], it also deteriorates the lubricant by increased oxide formation.
We carried out more experiments on a sample with ID “L1” to investigate the phenomena of disc wear. Prior to processing the disc for FESEM imaging and EDX elemental analysis, the disc was weighed before and after the experiment to assess the wear. The geometry of the disc poses certain challenges for FESEM and EDX. To overcome this, two cutting techniques—wire cut electro discharge machining (EDM) and abrasive cutting—were utilised to segment the disc profile, as illustrated in Figure 16.
The findings from Figure 17a,b demonstrate that only a small oxide layer forms in the worn track when using gear oil (sample ID “L1”) doped with aqueous HCl. The EDX spectra show that there is very little oxide, with oxygen levels of 2.4 wt% when the disc was segmented with wire EDM and 0.9 wt% when the disc was segmented with an abrasive cutter. The chloride component was discovered to be approximately 0.2 wt%. Despite the minimal oxide formation, the disc exhibited no measurable wear.
In conclusion, our findings support the hypothesis that the formation of oxide layers on the surface can reduce the coefficient of friction (COF) but can also increase wear in the form of oxides when lubricated with degraded oil. The additional experiments to track the damage to the disk profile provided further insights into this phenomenon, despite the challenges posed by the disk’s geometry.

3.4. Comparison of the Conventional Methodology of Mixing the 2D Nano Additives and the New Proposed Methodology

To evaluate the efficacy of the new mixing methodology that has been proposed, sedimentation/agglomeration phenomena related to nanoparticles were investigated. Three methods are used to assess sedimentation: visual examination, optical imaging, and evaluation of the viscosity/rheological properties.

3.4.1. Visual Inspection

In order to conduct a visual examination, the nanoparticles were mixed in a fixed ratio of 0.4 wt% and allowed to settle for 24 h. As seen in Figure 18a, all nanoparticles exhibit some degree of sedimentation when mixed using the conventional technique. The sedimentation range for all the particulates was between 2.5 scale point height (rGO) to 5 scale point height (hBN and graphene) and scale point height for MoS2 was 3.
The nanoparticles were mixed utilising the proposed technique and all prepared samples are illustrated in Figure 18b. Only for MoS2 and rGO was deposition of 1.5 scale point height discovered. Therefore, it is pretty apparent from this that the new mixing methodology provides better stability than the earlier method.

3.4.2. Inspection through Optical Imaging

In this instance, a digital microscope with an 800× magnification was used to assess the stability of the nano additives. The solution is made up by mixing the 0.4 wt% of graphene, 0.4 wt% of rGO and 0.2 wt% MoS2, and prepared by both methods. Pictures of the solutions were captured for three hours.
As seen in Figure 19, the old technique of mixing the particles results in the particles clumping together in various locations. When compared to the oil technique, the new proposed method’s particles are quite stable and do not exhibit any significant agglomeration.

3.4.3. Viscosity Measurement

To investigate the homogeneity and dispersion stability of the mixed 2D nanoparticles over time, the dynamic viscosities of the particles were studied. For 300 s, the dynamic viscosity was recorded at a shear rate of 1000 s−1. The two oils were synthesized by blending gear oil with the nanoparticles (0.4 wt% of graphene, 0.4 wt% of rGO, 0.2 wt% MoS2) and aqueous HCl using the conventional method (OM) and the proposed method (NPM). The third oil was pure oil (PO). Each sample underwent three tests, as depicted in Figure 20. The viscosity of PO originally decreased with time, but after 70 s it remains almost constant. The viscosity of NPM oil exhibits the same pattern. When it comes to the OM, viscosity changes erratically over time, before becoming nearly constant after 100 s. It is clear from Figure 20 that the NPM oil has a greater viscosity value, which may help to reduce the wear value. These findings clearly show that the proposed mixing approach exhibits a high degree of homogeneous blending and consistent stability over time.
We also examined whether the new method has an impact on performance of sample ID L3 (as described in Table 2) with aqueous HCl which was mixed in lubricant. The results of the test showed that the wear of the sample was reduced by 50% compared to previous tests, as illustrated in Figure 21a. Additionally, the friction of the sample was reduced by 33.33%, as shown in Figure 21b.

4. Conclusions

The current research focused on the effect of 2D nanoparticles on the tribological performance of liquid lubricants and proposes a new method of mixing 2D nanoparticles into the lubricant. Based on the findings, the following conclusions can be drawn:
(a)
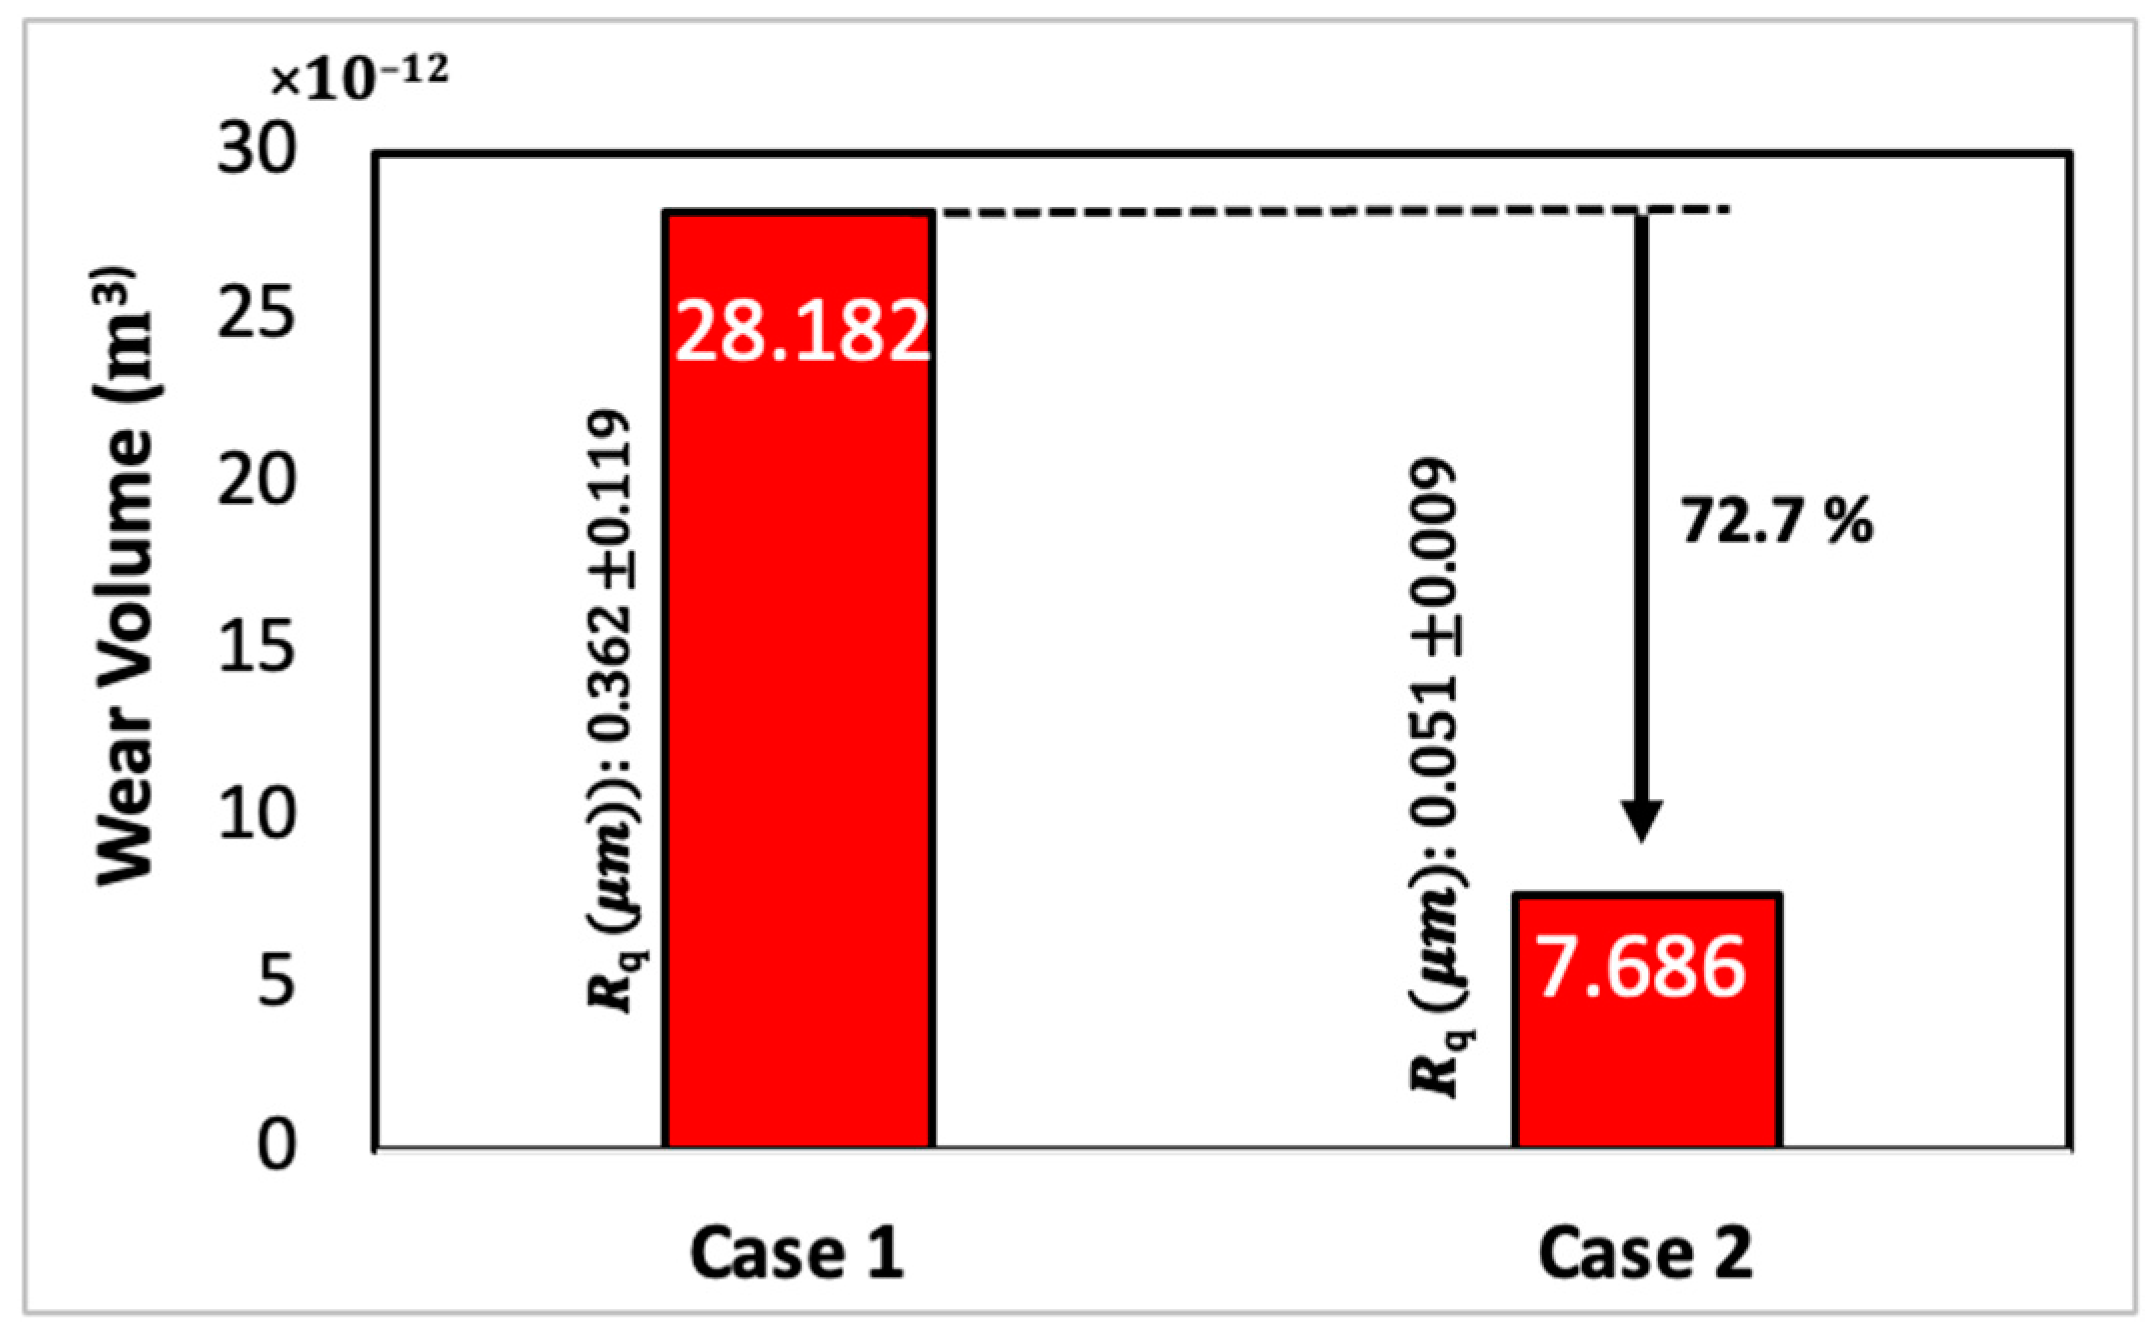
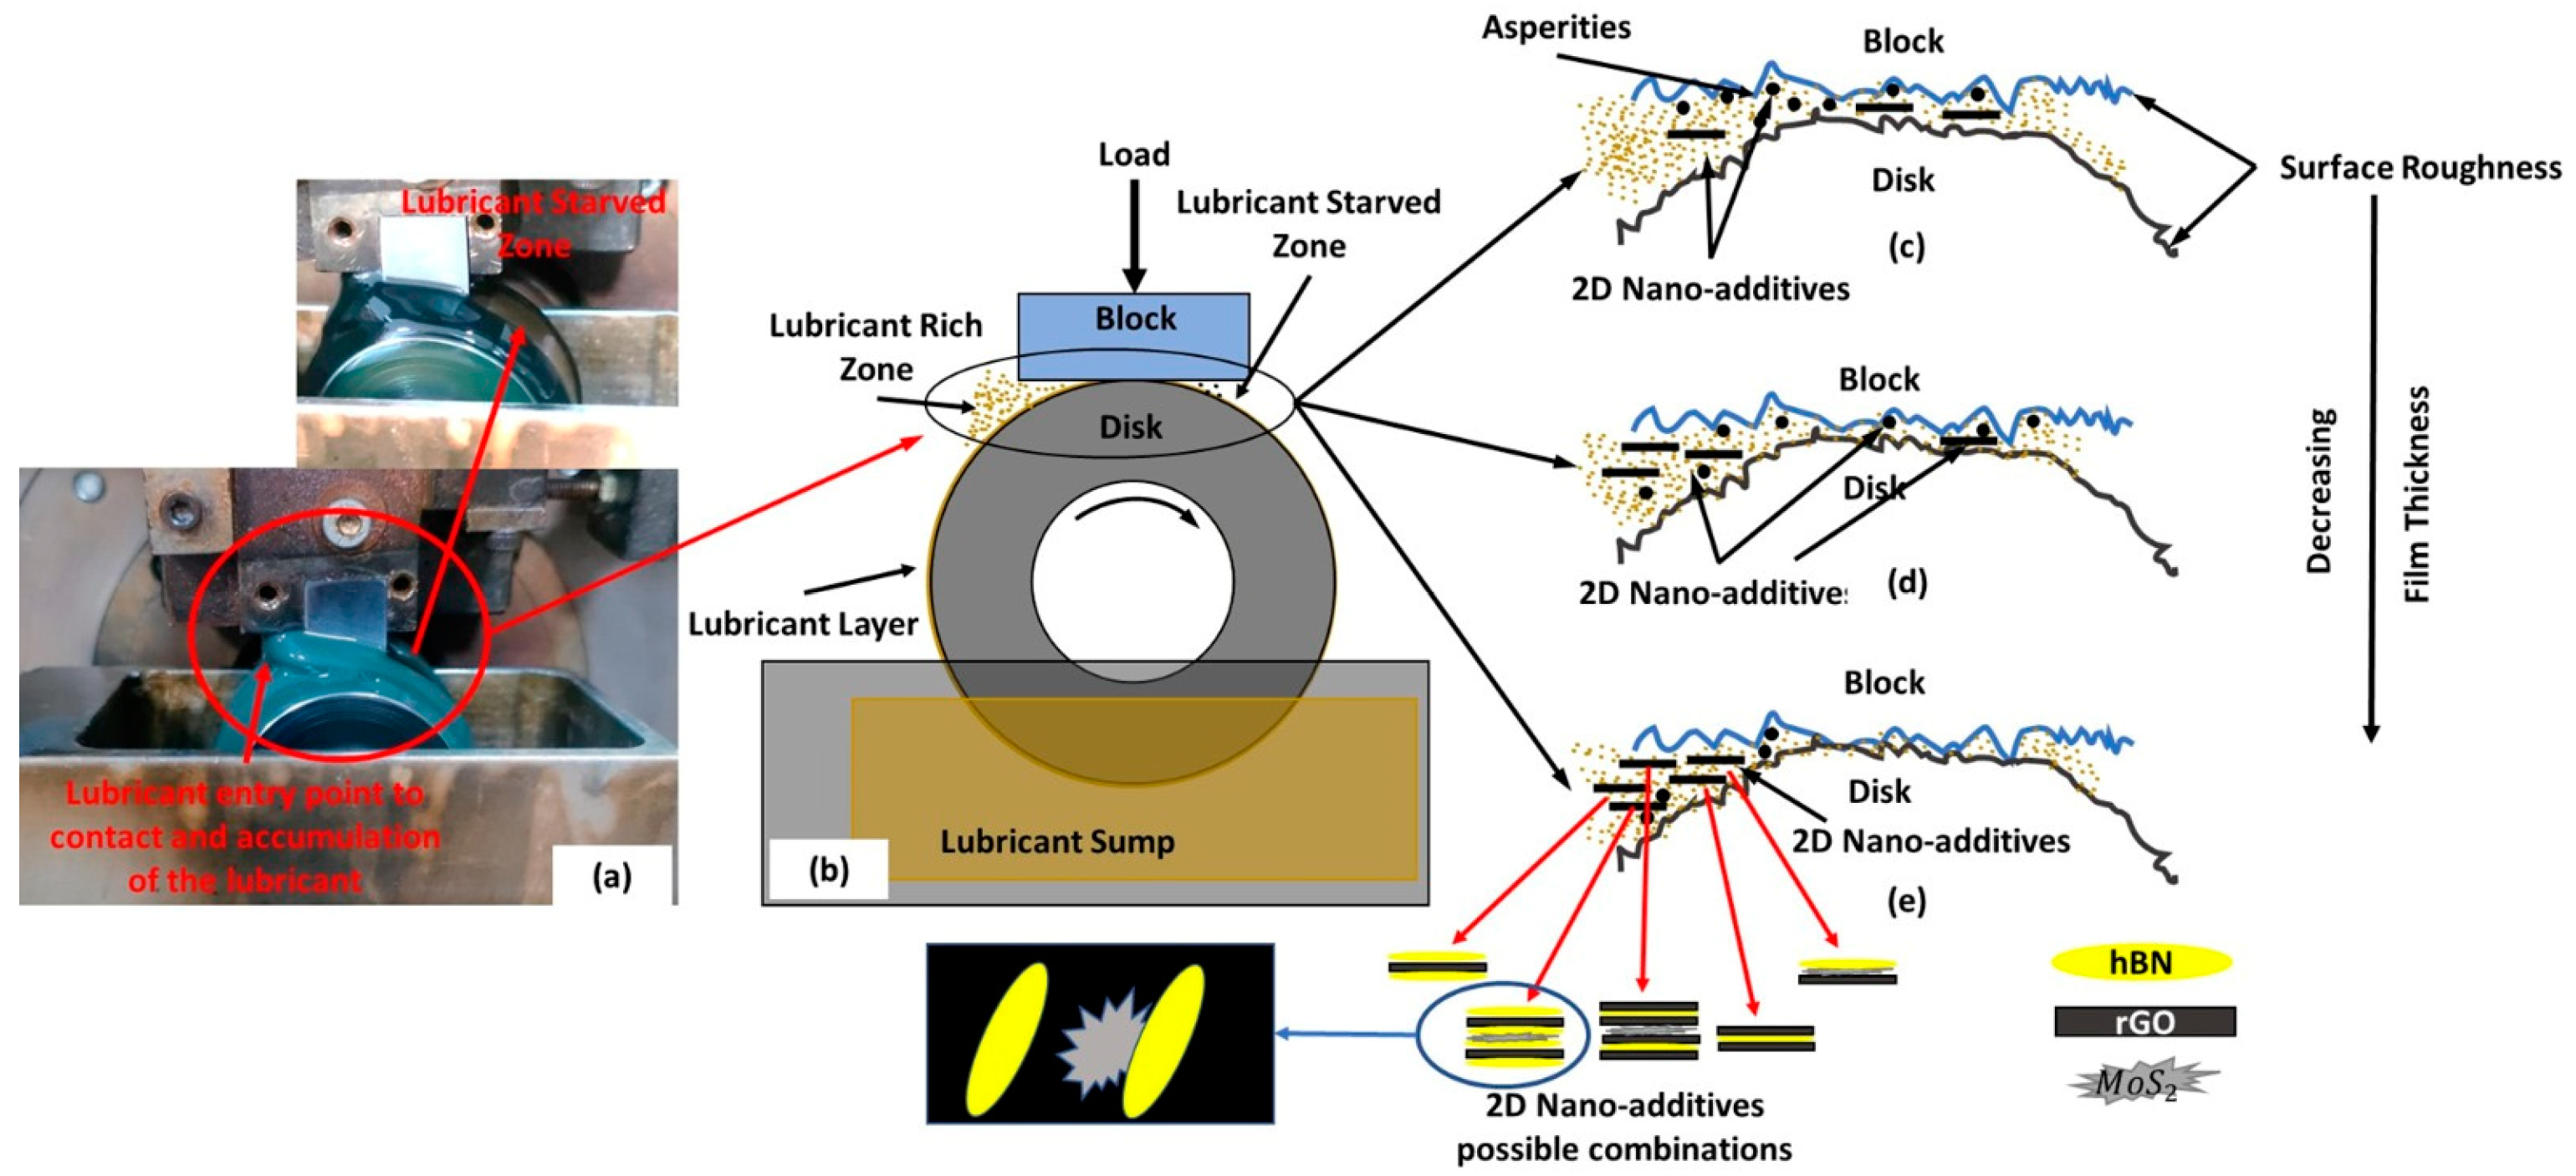
Surface roughness has a direct relationship with wear volume, with increased roughness resulting in more boundary lubrication and increased asperity contact. Lowering surface roughness by 85% can decrease wear volume by 72.7%.
(b)
Graphene-based nanolubricants remain ineffective in improving the performance of chemically degraded lubricants.
(c)
The proposed dispersion method for mixing the 2D nanoparticles was confirmed to reduce agglomeration and enhance the lubricant consistency. The results confirm a wear reduction of 50% and a friction reduction of 33.33%, compared those results obtained from sample synthesised by the conventional method.
(d)
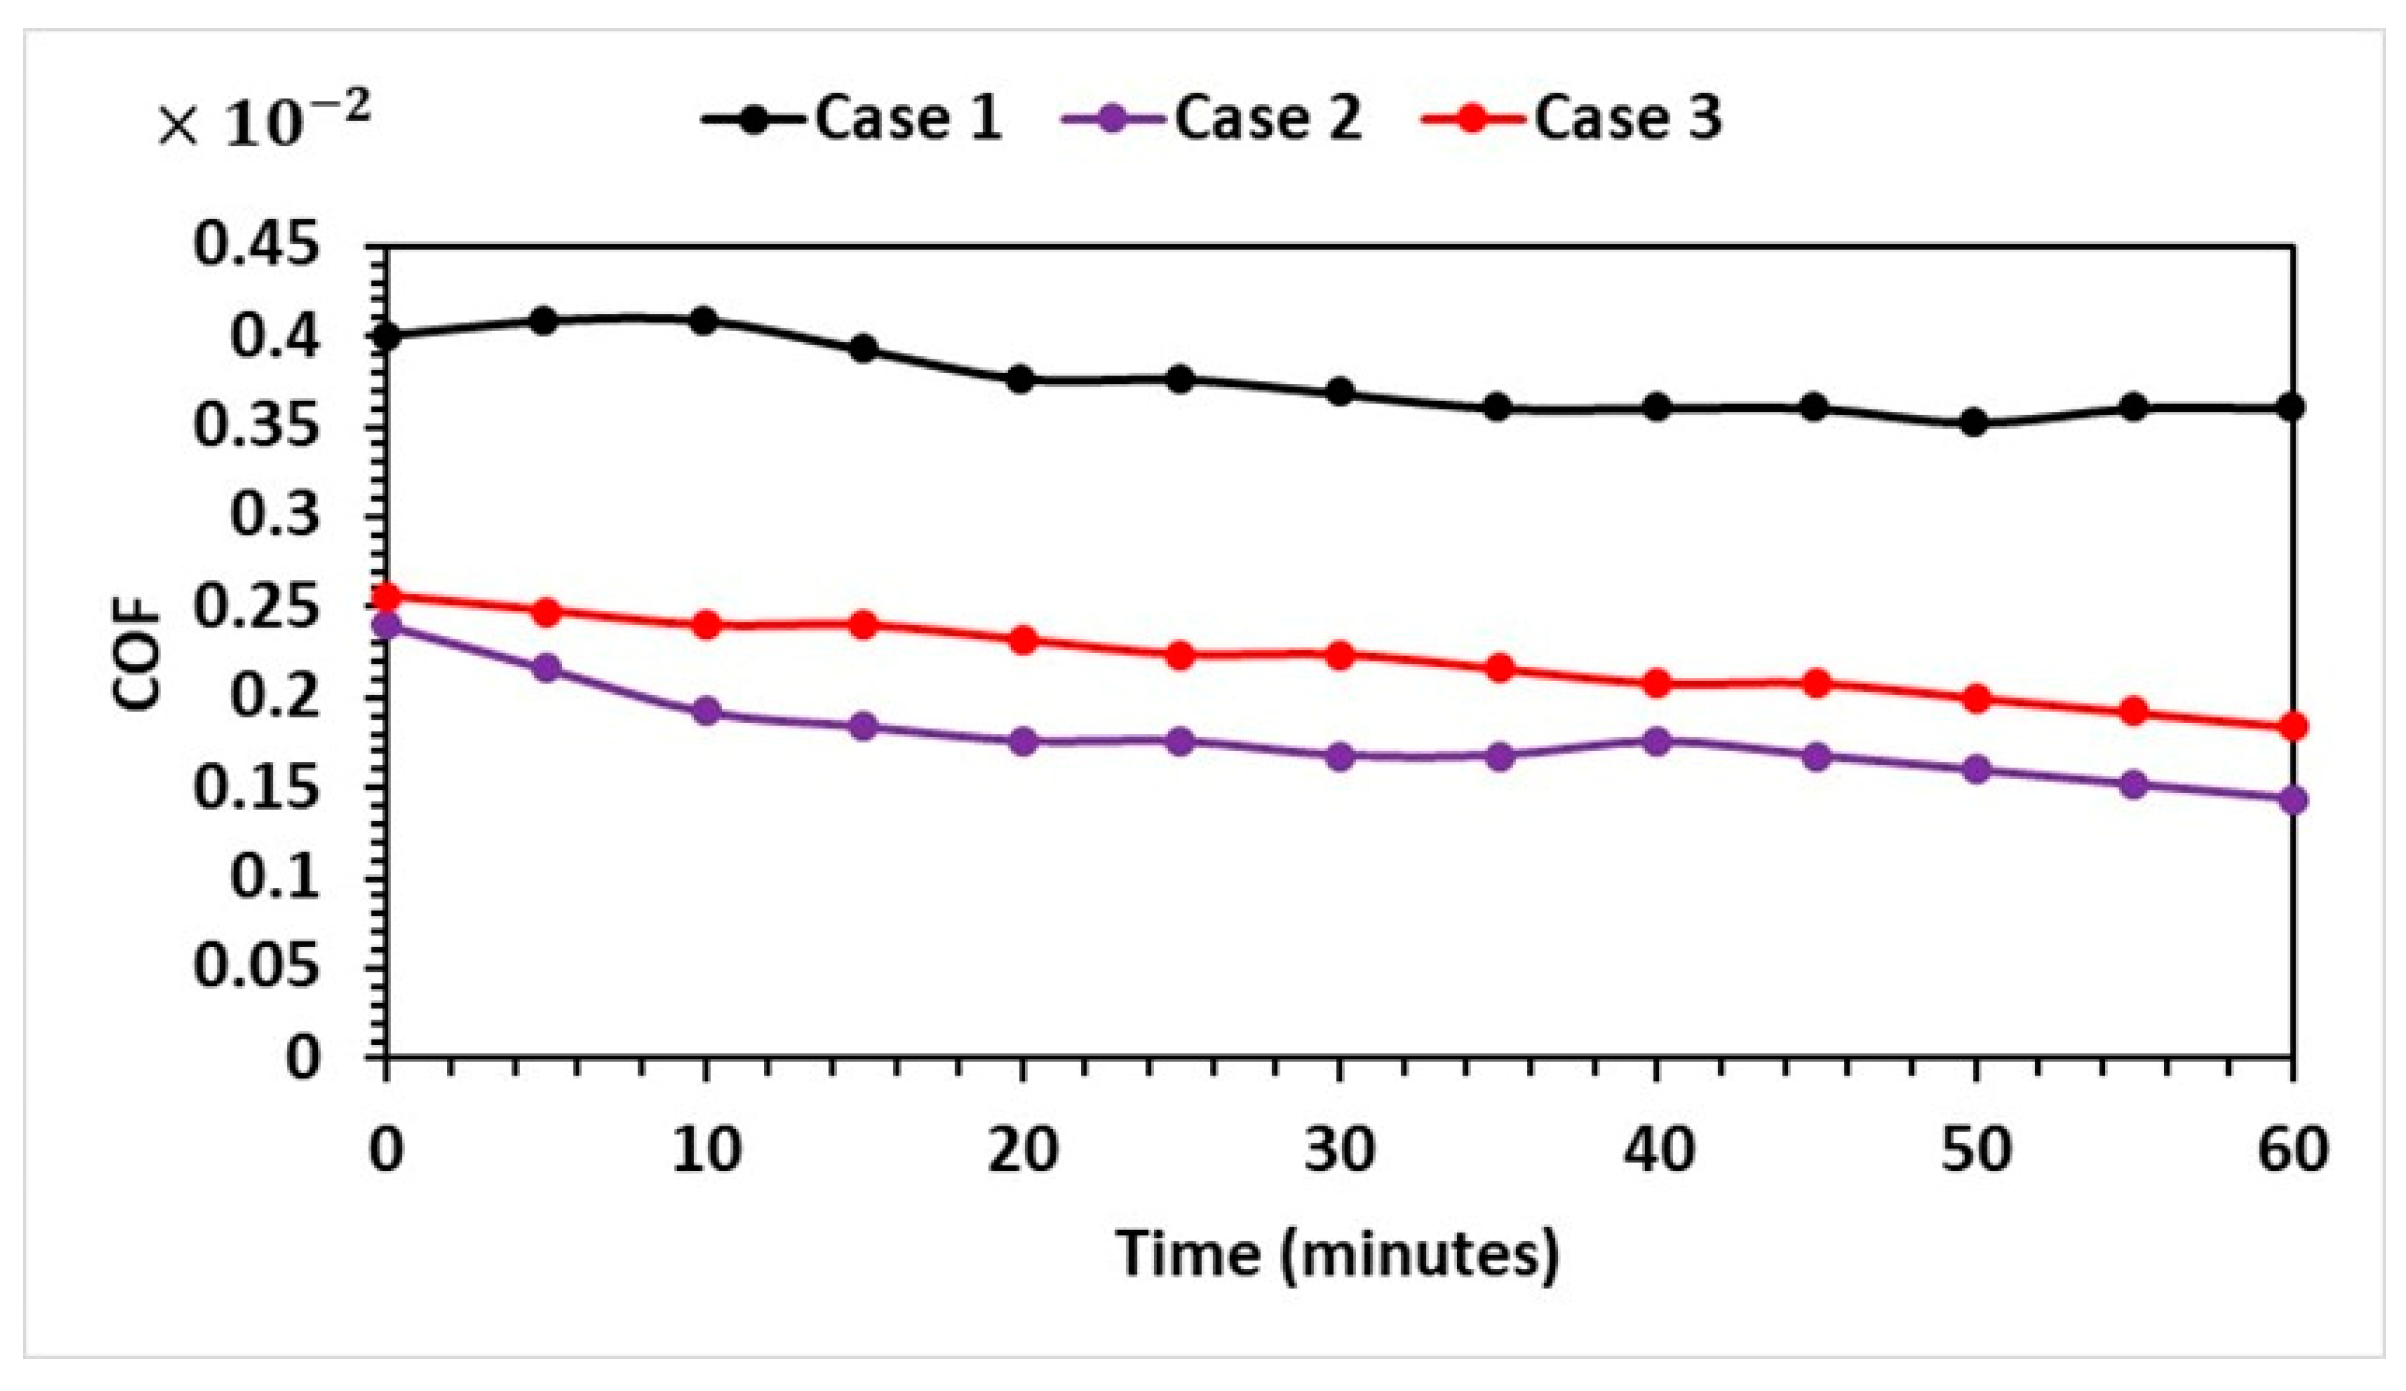
The average coefficient of friction reduction achieved by the nano-additives, compared to the base fluid, ranges from 23.4% to 42.53%.
(e)
The implementation of two-dimensional (2D) nano-additives with exceptionally thin longitudinal dimensions has demonstrated a significant reduction in wear, of up to 75% compared to the fresh base lubricant, and up to approximately 83% when utilized with deteriorated lubricant.
Based on the study’s findings, it can be concluded that the efficacy of 2D nanoparticles is affected by both the mixing method, aging of lubricant, and the lubrication regime. To tap the potential of 2D nanolubricants, more research is needed, particularly in the field of dispersion of 2D materials in a liquid phase, utilizing advanced surface analysis techniques and molecular dynamics simulations practices. Both microscopic experiments and nanoscopic tests are required to correctly assess the different interactions at the interfaces of the nano-additives, liquid, and solid surfaces. To reutilize the developed knowledge, there is a need to build a model library using machine learning techniques to extract the relevant features of the constructed model to apply the optimized model to selection of nanoparticles percentage, sonication, and high strain rate at higher temperature to improve the performance of nanosheets.

Author Contributions

Conceptualization, H.H.; methodology, H.H.; resources, H.H.; supervision, H.H.; writing-editing of the manuscript H.H. and D.J.; data curation, D.J. and K.N.S.; formal analysis, D.J. and K.N.S.; writing—original draft preparation, D.J. and K.N.S. All authors have read and agreed to the published version of the manuscript.

Funding

This research received no external funding.

Data Availability Statement

Data can be shared on request.

Conflicts of Interest

The authors declare no conflict of interest.

Appendix A

Appendix A.1. Specific Film Thickness

The specific film thickness was computed by using the following relation [66]:
λ = h m i n R q 1 2 + R q 2 2
The oil film thickness h m i n is calculated using the Dowson–Higginson formula [66].
h m i n = 0.985 × ( U * ) 0.7 × ( G * ) 0.6 × ( W * ) 0.11
where U * , G * , W * are dimensionless parameters. These can be computed using the following relations:
G * = α × E
U * = μ 0 × ( u 1 + u 2 ) E × R x
W * = W E × R x × L
a = 8 × W × R x E × π × L
P 0 = 2 × W π × a × L
where:
  • α  = Pressure viscosity coefficient
  • L = Face width of the gear
  • W = Load normal to contact
  • μ 0  = Dynamic viscosity
  • Rq = Peak-to-valley surface roughness
  • Rx = Effective radius
  • P0 = Hertzian pressure
  • a = Contact half width
  • E = Equivalent modulus of elasticity
The measured temperature (using an infrared thermometer) at the contact area in the current research was found to be around 60 °C. Walther’s relation [65] is used to calculate the dynamic viscosity of the lubricant at this temperature. To use this equation for the present study, the lubricant density was assumed to be constant across all samples, at around 900 kg/m3. The equation is as follows:
loglog(cSt + 0.6) = A − Blog(T)
where cSt is the kinematic viscosity, T is the temperature in Kelvin, and A and B are constants.
Parameters used for study:
  • α  = 1.2 × 10⁻⁸ m2/N
  • L = 0.012 m
  • W = 125 N
  • μ 0    = 0.24 to 0.26 Pa·s
  • Rx = 0.02 m
  • E = 226 GPa
So, hmin = ~0.18 μm
Specific film thickness (for roughness of block Rq = 0.362 μm and roughness of ring 0.046 μm) = 0.49 (boundary lubrication).

References

  1. Holmberg, K.; Andersson, P.; Erdemir, A. Global energy consumption due to friction in passenger cars. Tribol. Int. 2012, 47, 221–234. [Google Scholar] [CrossRef]
  2. Holmberg, K.; Andersson, P.; Nylund, N.-O.; Mäkelä, K.; Erdemir, A. Global energy consumption due to friction in trucks and buses. Tribol. Int. 2014, 78, 94–114. [Google Scholar] [CrossRef]
  3. Grutzmacher, P.G.; Suarez, S.; Tolosa, A.; Gachot, C.; Song, G.; Wang, B.; Presser, V.; Mücklich, F.; Anasori, B.; Rosenkranz, A. Superior wear-resistance of Ti3C2T × multilayer coatings. ACS Nano 2021, 15, 8216–8224. [Google Scholar] [CrossRef]
  4. Singer, I.L. How Third-Body Processes Affect Friction and Wear. MRS Bull. 1998, 23, 37–40. [Google Scholar] [CrossRef]
  5. Holmberg, K.; Ronkainen, H.; Laukkanen, A.; Wallin, K. Friction and wear of coated surfaces—Scales, modelling and simulation of tribomechanisms. Surface Coat. Technol. 2007, 202, 1034–1049. [Google Scholar] [CrossRef]
  6. Khadem, M.; Penkov, O.V.; Yang, H.-K.; Kim, D.-E. Tribology of multilayer coatings for wear reduction: A review. Friction 2017, 5, 248–262. [Google Scholar] [CrossRef]
  7. Subramanian, C.; Strafford, A.K. Review of multicomponent and multilayer coatings for tribological applications. Wear 1993, 165, 85–95. [Google Scholar] [CrossRef]
  8. Bartz, W.J. Tribology, lubricants and lubrication engineering—A review. Wear 1978, 49, 1–18. [Google Scholar] [CrossRef]
  9. Boyde, S. Green lubricants. Environmental benefits and impacts of lubrication. Green Chem. 2002, 4, 293–307. [Google Scholar] [CrossRef]
  10. Syahir, A.Z.; Zulkifli, N.W.M.; Masjuki, H.H.; Kalam, M.A.; Alabdulkarem, A.; Gulzar, M.; Khuong, L.S.; Harith, M.H. A review on bio-based lubricants and their applications. J. Clean. Prod. 2017, 168, 997–1016. [Google Scholar] [CrossRef]
  11. Cai, M.; Yu, Q.; Liu, W.; Zhou, F. Ionic liquid lubricants: When chemistry meets tribology. Chem. Soc. Rev. 2020, 49, 7753–7818. [Google Scholar] [CrossRef]
  12. Spikes, H.A. Additive-additive and additive-surface interactions in lubrication. Lubr. Sci. 1989, 2, 3–23. [Google Scholar] [CrossRef]
  13. Yan, Z.; Liu, J.; Wang, C.; Lu, X.; Hao, J. Synergistic effect and long-term lubricating mechanism of WS2/oil combinations determined via oil molecule structures in vacuum. Tribol. Int. 2023, 179, 107997. [Google Scholar] [CrossRef]
  14. Xiao, H.; Liu, S. 2D nanomaterials as lubricant additive: A review. Mater. Des. 2017, 135, 319–332. [Google Scholar] [CrossRef]
  15. Guo, Y.; Zhou, X.; Lee, K.; Yoon, H.C.; Xu, Q.; Wang, D. Recent development in friction of 2D materials: From mechanisms to applications. Nanotechnology 2021, 32, 312002. [Google Scholar] [CrossRef] [PubMed]
  16. Liu, L.; Zhou, M.; Li, X.; Jin, L.; Su, G.; Mo, Y.; Li, L.; Zhu, H.; Tian, Y. Research Progress in Application of 2D Materials in Liquid-Phase Lubrication System. Materials 2018, 11, 1314. [Google Scholar] [CrossRef] [PubMed]
  17. Zaharin, H.; Ghazali, M.; Thachnatharen, N.; Ezzah, F.; Walvekar, R.; Khalid, M. Progress in 2D materials based Nanolubricants: A review. Flatchem 2023, 38, 100485. [Google Scholar] [CrossRef]
  18. Uzoma, P.C.; Hu, H.; Khadem, M.; Penkov, O.V. Tribology of 2D Nanomaterials: A Review. Coatings 2020, 10, 897. [Google Scholar] [CrossRef]
  19. Gulzar, M.; Masjuki, H.H.; Kalam, M.A.; Varman, M.; Zulkifli, N.W.M.; Mufti, R.A.; Zahid, R. Tribological performance of nanoparticles as lubricating oil additives. J. Nanoparticle Res. 2016, 18, 223. [Google Scholar] [CrossRef]
  20. Pantano, M.F.; Kuljanishvili, I. Advances in mechanical characterization of 1D and 2D nanomaterials: Progress and prospects. Nano Express 2020, 1, 022001. [Google Scholar] [CrossRef]
  21. Pritchard, C.; Midgley, J. The effect of humidity on the friction and life of unbonded molybdenum disulphide films. Wear 1969, 13, 39–50. [Google Scholar] [CrossRef]
  22. Jazaa, Y.; Lan, T.; Padalkar, S.; Sundararajan, S. The Effect of Agglomeration Reduction on the Tribological Behavior of WS2 and MoS2 Nanoparticle Additives in the Boundary Lubrication Regime. Lubricants 2018, 6, 106. [Google Scholar] [CrossRef]
  23. Hwang, Y.; Lee, J.-K.; Lee, J.-K.; Jeong, Y.-M.; Cheong, S.-I.; Ahn, Y.-C.; Kim, S.H. Production and dispersion stability of nanoparticles in nanofluids. Powder Technol. 2008, 186, 145–153. [Google Scholar] [CrossRef]
  24. Feng, J.; Mao, J.; Wen, X.; Tu, M. Ultrasonic-assisted in situ synthesis and characterization of superparamagnetic Fe3O4 nanoparticles. J. Alloy. Compd. 2011, 509, 9093–9097. [Google Scholar] [CrossRef]
  25. Bakunin, V.; Suslov, A.; Kuzmina, G.; Parenago, O.; Topchiev, A. Synthesis and Application of Inorganic Nanoparticles as Lubricant Components—A Review. J. Nanoparticle Res. 2004, 6, 273–284. [Google Scholar] [CrossRef]
  26. Shiao, S.; Chhabra, V.; Patist, A.; Free, M.; Huibers, P.; Gregory, A.; Patel, S.; Shah, D. Chain length compatibility effects in mixed surfactant systems for technological applications. Adv. Colloid Interface Sci. 1998, 74, 1–29. [Google Scholar] [CrossRef]
  27. Negin, C.; Ali, S.; Xie, Q. Most common surfactants employed in chemical enhanced oil recovery. Petroleum 2017, 3, 197–211. [Google Scholar] [CrossRef]
  28. Gbadamosi, A.O.; Junin, R.; Manan, M.A.; Agi, A.; Yusuff, A.S. An overview of chemical enhanced oil recovery: Recent advances and prospects. Int. Nano Lett. 2019, 9, 171–202. [Google Scholar] [CrossRef]
  29. Raffa, P.; Broekhuis, A.A.; Picchioni, F. Polymeric surfactants for enhanced oil recovery: A review. J. Pet. Sci. Eng. 2016, 145, 723–733. [Google Scholar] [CrossRef]
  30. Kumar, N.; Saini, V.; Bijwe, J. Performance properties of lithium greases with PTFE particles as additive: Controlling parameter- size or shape? Tribol. Int. 2020, 148, 106302. [Google Scholar] [CrossRef]
  31. Kumar, N.; Saini, V.; Bijwe, J. Exploration of Talc nanoparticles to enhance the performance of Lithium grease. Tribol. Int. 2021, 162, 107107. [Google Scholar] [CrossRef]
  32. Huang, H.; Tu, J.; Gan, L.; Li, C. An investigation on tribological properties of graphite nanosheets as oil additive. Wear 2006, 261, 140–144. [Google Scholar] [CrossRef]
  33. How, H.G.; Jason, Y.J.J.; Teoh, Y.H.; Chuah, H.G. Investigation of Tribological Properties of Graphene Nanoplatelets in Synthetic Oil. J. Adv. Res. Fluid Mech. Therm. Sci. 2022, 96, 115–126. [Google Scholar] [CrossRef]
  34. Xie, H.; Dang, S.; Jiang, B.; Xiang, L.; Zhou, S.; Sheng, H.; Yang, T.; Pan, F. Tribological performances of SiO2/graphene combinations as water-based lubricant additives for magnesium alloy rolling. Appl. Surface Sci. 2019, 475, 847–856. [Google Scholar] [CrossRef]
  35. Singh, A.; Chauhan, P.; Mamatha, T.G. A review on tribological performance of lubricants with nanoparticles additives. Mater. Today: Proc. 2020, 25, 586–591. [Google Scholar] [CrossRef]
  36. Patel, J.; Pereira, G.; Irvine, D.; Kiani, A. Friction and wear properties of base oil enhanced by different forms of reduced graphene. AIP Adv. 2019, 9, 045011. [Google Scholar] [CrossRef]
  37. Ali, I.; Basheer, A.A.; Kucherova, A.; Memetov, N.; Pasko, T.; Ovchinnikov, K.; Pershin, V.; Kuznetsov, D.; Galunin, E.; Grachev, V.; et al. Advances in carbon nanomaterials as lubricants modifiers. J. Mol. Liq. 2019, 279, 251–266. [Google Scholar] [CrossRef]
  38. Patel, J.; Kiani, A. Effects of Reduced Graphene Oxide (rGO) at Different Concentrations on Tribological Properties of Liquid Base Lubricants. Lubricants 2019, 7, 11. [Google Scholar] [CrossRef]
  39. Thampi, A.D.; Prasanth, M.; Anandu, A.; Sneha, E.; Sasidharan, B.; Rani, S. The effect of nanoparticle additives on the tribological properties of various lubricating oils—Review. Mater. Today Proc. 2021, 47, 4919–4924. [Google Scholar] [CrossRef]
  40. He, T.; Chen, N.; Fang, J.; Cai, G.; Wang, J.; Chen, B.; Liang, Q. Micro/nano carbon spheres as liquid lubricant additive: Achievements and prospects. J. Mol. Liq. 2022, 357, 119090. [Google Scholar] [CrossRef]
  41. Rahman, M.; Islam, M.; Roy, R.; Younis, H.; AlNahyan, M.; Younes, H. Carbon Nanomaterial-Based Lubricants: Review of Recent Developments. Lubricants 2022, 10, 281. [Google Scholar] [CrossRef]
  42. Morshed, A.; Wu, H.; Jiang, Z. A Comprehensive Review of Water-Based Nanolubricants. Lubricants 2021, 9, 89. [Google Scholar] [CrossRef]
  43. Marian, M.; Berman, D.; Rota, A.; Jackson, R.L.; Rosenkranz, A. Layered 2D Nanomaterials to Tailor Friction and Wear in Machine Elements—A Review. Adv. Mater. Interfaces 2021, 9, 2101622. [Google Scholar] [CrossRef]
  44. Marian, M.; Berman, D.; Nečas, D.; Emami, N.; Ruggiero, A.; Rosenkranz, A. Roadmap for 2D materials in biotribological/biomedical applications—A review. Adv. Colloid Interface Sci. 2022, 307, 102747. [Google Scholar] [CrossRef] [PubMed]
  45. Rosenkranz, A.; Liu, Y.; Yang, L.; Chen, L. 2D nano-materials beyond graphene: From synthesis to tribological studies. Appl. Nanosci. 2020, 10, 3353–3388. [Google Scholar] [CrossRef]
  46. Ashraf, A.; Shafi, W.K.; Ul Haq, M.I.; Raina, A. Dispersion stability of nano additives in lubricating oils—An overview of mechanisms, theories and methodologies. Tribol. Mater. Surf. Interfaces 2022, 16, 34–56. [Google Scholar] [CrossRef]
  47. Shahnazar, S.; Bagheri, S.; Hamid, S.B.A. Enhancing lubricant properties by nanoparticle additives. Int. J. Hydrog. Energy 2016, 41, 3153–3170. [Google Scholar] [CrossRef]
  48. Muzakkir, S.M.; Hirani, H.; Thakre, G.D. Lubricant for Heavily Loaded Slow-Speed Journal Bearing. Tribol. Trans. 2013, 56, 1060–1068. [Google Scholar] [CrossRef]
  49. Shinde, A.B.; Pawar, P.M. Multi-objective optimization of surface textured journal bearing by Taguchi based Grey relational analysis. Tribol. Int. 2017, 114, 349–357. [Google Scholar] [CrossRef]
  50. Hirani, H.; Athre, K.; Biswas, S. Lubricant Shear Thinning Analysis of Engine Journal Bearings. Tribol. Trans. 2001, 44, 125–131. [Google Scholar] [CrossRef]
  51. Das, R.; Bej, S.; Hirani, H.; Banerjee, P. Trace-level humidity sensing from commercial organic solvents and food products by an AIE/ESIPT-triggered piezochromic luminogen and ppb-level “OFF–ON–OFF” sensing of Cu2+: A combined experimental and theoretical outcome. Acs Omega 2021, 6, 14104–14121. [Google Scholar] [CrossRef] [PubMed]
  52. Sengupta, S.; Murmu, M.; Mandal, S.; Hirani, H.; Banerjee, P. Competitive corrosion inhibition performance of alkyl/acyl substituted 2-(2-hydroxybenzylideneamino)phenol protecting mild steel used in adverse acidic medium: A dual approach analysis using FMOs/molecular dynamics simulation corroborated experimental findings. Colloids Surf. A: Physicochem. Eng. Asp. 2021, 617, 126314. [Google Scholar] [CrossRef]
  53. Bej, S.; Das, R.; Hirani, H.; Ghosh, S.; Banerjee, P. “Naked-eye” detection of CN from aqueous phase and other extracellular matrices: An experimental and theoretical approach mimicking the logic gate concept. New J. Chem. 2019, 43, 18098–18109. [Google Scholar] [CrossRef]
  54. Rezasoltani, A.; Khonsari, M. Experimental investigation of the chemical degradation of lubricating grease from an energy point of view. Tribol. Int. 2019, 137, 289–302. [Google Scholar] [CrossRef]
  55. Hirani, H.; Jangra, D.; Sidh, K.N. Experimental Investigation on the Wear Performance of Nano-Additives on Degraded Gear Lubricant. Lubricants 2023, 11, 51. [Google Scholar] [CrossRef]
  56. Gupta, M.K.; Bijwe, J. A complex interdependence of dispersant in nano-suspensions with varying amount of graphite particles on its stability and tribological performance. Tribol. Int. 2020, 142, 105968. [Google Scholar] [CrossRef]
  57. Box, G.E.; Hunter, J.S.; Hunter, W.G. Statistics for experimenters. In Wiley Series in Probability and Statistics; Wiley: Hoboken, NJ, USA, 2005. [Google Scholar]
  58. Guo, P.; Chen, L.; Wang, J.; Geng, Z.; Lu, Z.; Zhang, G. Enhanced Tribological Performance of Aminated Nano-Silica Modified Graphene Oxide as Water-Based Lubricant Additive. ACS Appl. Nano Mater. 2018, 1, 6444–6453. [Google Scholar] [CrossRef]
  59. Bao, Y.Y.; Sun, J.L.; Kong, L.H. Tribological properties and lubricating mechanism of SiO2 nanoparticles in water-based fluid. In IOP Conference Series: Materials Science and Engineering; IOP Publishing: Bristol, UK, 2017; Volume 182, p. 12025. [Google Scholar] [CrossRef]
  60. Fan, X.; Li, X.; Zhao, Z.; Yue, Z.; Feng, P.; Ma, X.; Li, H.; Ye, X.; Zhu, M. Heterostructured rGO/MoS2 nanocomposites toward enhancing lubrication function of industrial gear oils. Carbon 2022, 191, 84–97. [Google Scholar] [CrossRef]
  61. Reyes, L.; Loganathan, A.; Boesl, B.; Agarwal, A. Effect of 2D Boron Nitride Nanoplate Additive on Tribological Properties of Natural Oils. Tribol. Lett. 2016, 64, 41. [Google Scholar] [CrossRef]
  62. Lee, C.; Yan, H.; Brus, L.E.; Heinz, T.F.; Hone, J.; Ryu, S. Anomalous Lattice Vibrations of Single- and Few-Layer MoS2. ACS Nano 2010, 4, 2695–2700. [Google Scholar] [CrossRef] [PubMed]
  63. HPCL India. Available online: https://www.hplubricants.in/sites/default/files/hp-gear-drive-ep-90.pdf (accessed on 10 April 2023).
  64. Booser, E.R. Applied Tribology: Bearing Design and Lubrication; John Wiley & Sons: Hoboken, NJ, USA, 2008. [Google Scholar]
  65. Ash, D.C.; Joyce, M.J.; Barnes, C.; Booth, C.J.; Jefferies, A.C. Viscosity measurement of industrial oils using the droplet quartz crystal microbalance. Meas. Sci. Technol. 2003, 14, 1955–1962. [Google Scholar] [CrossRef]
  66. Amarnath, M.; Lee, S.-K. Assessment of surface contact fatigue failure in a spur geared system based on the tribological and vibration parameter analysis. Measurement 2015, 76, 32–44. [Google Scholar] [CrossRef]
Figure 1. Schematic of comprehensive framework. (a) Drying of the 2D nanoparticles using the oven at 100 °C, (bd) samples prepared by employing the conventional method, (e’, e”, f’, and f”) samples prepared by employing the proposed method, (g) ultrasonic homogenizer, (h) rheometer (MCR-102, Anton Paar India made), (i) lubricity tester (Ducom India made), and (j) characterization of the dried powder and post-test samples (samples 1–4).
Lubricants 11 00179 g001
Figure 2. Variation of COF with time.
Lubricants 11 00179 g002
Figure 3. Schematic of the lubricity tester.
Lubricants 11 00179 g003
Figure 4. FESEM images and EDX of the (a) MoS2, (b) hBN, (c) rGO, and (d) graphene.
Lubricants 11 00179 g004
Figure 5. TEM images of the (a) MoS2, (b) hBN, (c) rGO, and (d) graphene.
Lubricants 11 00179 g005
Figure 6. (a) Raman spectra of the graphene, rGO, MoS2, and hBN, and (b) enlarged spectra of the MoS2.
Lubricants 11 00179 g006
Figure 7. Effect of surface roughness on the wear volume.
Lubricants 11 00179 g007
Figure 8. The images and schematic show the running condition (a,b) as lubricant get blocked at the entry point and (ce) the effect of surface roughness and particles deposition on each other that enhance its stability.
Lubricants 11 00179 g008
Figure 9. Dynamic viscosity variation to shear rate (a) shear rate 100–2000 s−1 (b) shear rate 100–500 s−1 (c) shear rate 1000–1500 s−1 (d) shear rate 1500–2000 s−1.
Lubricants 11 00179 g009
Figure 10. Rheometer setup (a) shear rate 1000 s−1 (b) shear rate 2500 s−1.
Lubricants 11 00179 g010
Figure 11. (a) Wear volume, and (b) coefficient of friction for fresh oil (without aqueous HCl) and chemically degraded lubricant (with aqueous HCl mixed).
Lubricants 11 00179 g011
Figure 12. (a) Wear volume, and (b) COF for the best performance and worst performance cases for both set of experiments.
Lubricants 11 00179 g012
Figure 13. ATR-FTIR spectra of the prepared lubricant.
Lubricants 11 00179 g013
Figure 14. Comparison among nano-additives.
Lubricants 11 00179 g014
Figure 15. FESEM and EDX of the tested blocks using two samples of fresh oil (ID (a) L1 and (b) L3) and two samples of chemically degraded oil (ID (c) L1 and (d) L3).
Lubricants 11 00179 g015
Figure 16. Segmentation of disk profile for FESEM and EDX analysis; (a,b) disk before cutting; (c,d) disk after segmentation; (e) profilometry of segmented disk.
Lubricants 11 00179 g016
Figure 17. FESEM imaging and EDX of the disk profile lubricated with chemically degraded oil sample ID L1; (a) wire EDM cut segment; (b) abrasive cut segment.
Lubricants 11 00179 g017
Figure 18. Effect of mixing methodology on the particle sedimentation; (a) old method of mixing, and (b) new proposed mixing method.
Lubricants 11 00179 g018
Figure 19. Images of the homogenised particles initially and after 3 h for both the old method and the newly proposed method.
Lubricants 11 00179 g019
Figure 20. Dynamic viscosity at shear rate 1000 s−1 and for a duration of 300 s.
Lubricants 11 00179 g020
Figure 21. (a) Wear and (b) Coefficient of friction comparison between conventional and proposed method.
Lubricants 11 00179 g021
Table 1. Details of selected nanoparticles (as per the OEM_ Vedayukt India Pvt. Ltd., Jamshedpur, India).
S. No.Particle NomenclatureAverage Size of Particles (nm)
1Graphene (G)50–60 nm with the purity of 99.99%
2MoS2
3hBN
4rGO
Table 2. Experimental plan and levels of different variables.
VariableLevel
123
Graphene (G)00.2 wt%0.4 wt%
rGO00.2 wt%0.4 wt%
MoS200.2 wt%0.4 wt%
hBN00.2 wt%0.4 wt%
Experiment Design
Experiment No./Sample IDGraphene (in wt%)rGO (in wt%)MoS2 (in wt%)hBN (in wt%)
L10000
L200.20.20.2
L300.40.40.4
L40.200.20.4
L50.20.20.40
L60.20.400.2
L70.400.40.2
L80.40.200.4
L90.40.40.20
Table 3. Parameters and their levels for wear and friction analysis.
ParametersLevels
Test sampleEN24 with 40 ± 1 HRC
Roughness (µm)Ra: 0.032 ± 0.005
Rq: 0.051 ± 0.009
Load (N)125.86
Time (s)3600
Speed (rpm)100
Temperature (°C)40
Table 4. Specific film thickness for different samples.
Specific Film Thickness
Experiment No./Sample IDViscosity (Pa·s)
(@40 °C)
Viscosity (Pa·s) (@70 °C)Viscosity (Pa·s)
(@60 °C, Using Equation (A8))
Specific Film Thickness
L10.7310.1570.2472.529
L30.7410.1710.2642.649
L90.7470.1740.2682.671
Disclaimer/Publisher’s Note: The statements, opinions and data contained in all publications are solely those of the individual author(s) and contributor(s) and not of MDPI and/or the editor(s). MDPI and/or the editor(s) disclaim responsibility for any injury to people or property resulting from any ideas, methods, instructions or products referred to in the content.

