Article

Tuning the Parameters of Cu–WS2 Composite Production via Powder Metallurgy: Evaluation of the Effects on Tribological Properties

1
Department of Chemistry, Materials and Chemical Engineering “Giulio Natta”, Politecnico di Milano, Piazza Leonardo da Vinci 32, 20133 Milano, Italy
2
Department of Mechanical Engineering, Politecnico di Milano, 20156 Milano, Italy
3
Materials and Mechanical Engineering, Centre for Advanced Steels Research, University of Oulu, Pentti Kaiteran Katu 1, 90570 Oulu, Finland
*
Author to whom correspondence should be addressed.
Lubricants 2023, 11(2), 66; https://doi.org/10.3390/lubricants11020066
Submission received: 3 January 2023 / Revised: 30 January 2023 / Accepted: 2 February 2023 / Published: 6 February 2023
(This article belongs to the Special Issue Assessment of Adhesive Wear)

Abstract

:
Metal matrix self-lubricating composites exhibit outstanding performance in various environments, reaching the required properties by modifying the reinforcement–matrix ratio and the production method. The present research investigated the effects on tribological performance and electrical properties of different pressure loads, maintaining pressing time, and sintering temperatures during the production of copper–10 wt% tungsten disulfide (Cu–WS2) composite via powder metallurgy. Moreover, additional thermo-mechanical treatments were evaluated, namely second pressing and second sintering steps. The density and the hardness of the produced composites were measured, as well as the electrical resistivity, considering sliding electrical contacts as possible employment. The outputs of the wear tests were considered together with the analysis of the wear track via scanning electron microscopy and confocal laser scanning microscopy to understand wear mechanisms. Different production routes were compared in terms of electrical resistivity, wear coefficient, and specific wear rate, calculated by the confocal laser scanning microscopy, and friction coefficient, measured during the wear test. The main results highlighted that the increase in sintering temperature was detrimental to the hardness and tribological properties; higher load and additional pressing step determined a general improvement in the tested properties.

Graphical Abstract

1. Introduction

Different methods are available to produce Metal Matrix Composites (MMCs). The selection of the manufacturing process and conditions determines the characteristic profiles of the final product, although having the same composition. The choice depends on the matrix, the quantity, distribution, and material of the reinforcements, and the final application, hence the requirements. The production methods include liquid-state, solid-state, and vapor-state processing [1,2].
In the solid-state process, reinforcement is embedded in the matrix through diffusion phenomena produced at high pressures and temperatures following different techniques. Among these, the most spread is powder metallurgy, which is usually used for high melting point matrixes and to avoid segregation effects and brittle reaction product formation prone to occur in liquid state processes.
The powder metallurgy process employs metal powders or powders mixture. It is typically used for short fibers, whiskers, and particles as fillers. This technology is an important alternative to traditional forming ones: it allows to obtain net-shape or near-net-shape components, thus eliminating or reducing the need for further processing. Moreover, it limits materials exploitation and waste generation, increasingly becoming a sustainable alternative: up to more than 97% of the raw powder material is converted in the finished product, to machine metals that are difficult or dangerous to form with standard techniques due to their very high melting point, to produce components with complex shapes and good finishing [3,4,5,6,7].
Powder metallurgy generally consists of four main steps; in the first step, metal powders are prepared according to the composition of the composite. This production can be carried out through mechanical routes, such as crushing, grinding, shot blasting, granulation, and atomization, or through physical and chemical processes such as condensation, reduction of oxides, precipitation, and electrolytic process. In the second stage, metal powders are mixed with particle or whisker reinforcements. This step can be done through the blending or milling process; the most common is mechanical milling, in which a crushing machine generates high energy impact and heating by friction, causing local micro-fusions at the particle interfaces that may facilitate the next sintering. The third phase is compaction, which consists of pressing powders in suitable molds. The aim is to create the so-called ‘green compact’, namely, a component possessing a shape and size consistent with the final project and a suitable green strength so that in subsequent operations there is no breakage or deformation. The final step of powder metallurgy is consolidation, where the green compact is subjected to sintering. In this process, powder particles are joined together to make the final product by using a high temperature to make the matrix pliable without creating a significant amount of liquid phase. The excessive liquid phase could negatively impact the product mechanical properties by causing segregation in the grain and formation of harmful intermetallic compounds. In addition, consolidation can also be performed through hot or cold rolling [8].
Once the consolidation phase is completed, additional processes can be performed to improve the microstructure and mechanical properties. Among these, it is possible to mention impregnation, coining, and thermal treatment such as nitriding, carburizing, and infiltration [8]. Moreover, other processes for improving the mechanical strength of sintered components are the double-pressing, and double-pressing and double-sintering techniques, whose goal is to increase the density by exploiting a twofold pressing or twofold pressing and dual sintering, respectively. According to the literature [9], reductions of 2–3% in porosity would result in a 20% increase in mechanical strength. Industrially, the main drawback of these methods is the higher cost associated with the equipment and the manufacturing time compared to a traditional single pressing-single sintering process. Concerning equipment, an additional die with a slightly larger cavity than the first is needed to re-press the components to accommodate their expansions and any dimensional change that may occur during the first sintering. Therefore, if parts have to be produced continuously, the process requires an additional press and a sintering furnace [10,11,12].
The classical preparation of self-lubricating MMCs through powder metallurgy requires a mixing step via ball milling of metal powders and lubricants to obtain suitable dispersion and distribution. This process enhances plastic deformation; it can change particles shape and morphology and leads to finer particles. Sintering is critical to fulfilling desired properties; temperature selection determines the liquidus phase formation, residual porosity, possible reinforcement degradation, the formation of undesired compounds at the metal–lubricant interface, and the reaction of the materials with the environment [13,14].
A higher annealing temperature can promote the degradation of the lubricant phase and the formation of undesired compounds. Xiao et al. [5] studied the effect of annealing temperatures at 700, 800, 900, and 950 °C, in an N2 atmosphere, on copper (Cu)–tungsten disulfide (WS2) composites, with WS2 ranging from 0 to 40 vol%. This paper proved that a high annealing temperature is more likely to lead to the decomposition of WS2. Indeed, XRD patterns of composites annealed at 700 and 800 °C showed a decrease in WS2 content and the presence of Cu2S. Annealing at 900 and 950 °C caused the WS2 peak to completely disappear, but the Cu2S peak did not increase due to the low degree of crystallinity.
The particle dimension affects the mechanical properties and the tribological behavior of MMCs. Zhou et al. [15] analyzed copper-based composites containing WS2 particles at 20 wt% as solid lubricants with a grain size of 0.6 and 5.0 μm. The powders were mixed in a milling tank for 24 h and then sintered by spark plasma sintering in an Ar atmosphere at 650 °C. Under these conditions, XRD patterns revealed that no chemical reaction occurred at the Cu–WS2 interface, accordingly to previous considerations. Although both composites showed self-lubricating properties, the specimen with the bigger dimension (5 μm) led to higher bending strength, higher hardness, lower friction coefficient, and lower wear rate. The different features of the two tests were attributed to the higher bonding strength with the matrix exhibited by larger WS2 particles. Since WS2 particles can be considered a defect in the composite, microcracks tend to generate and propagate at the interface. The distance to travel for cracks is longer with bigger particles. Moreover, smaller particles were in higher numbers, leading to a higher surface available to react with moisture and oxygen to form tribo-oxidation products, thus increasing friction and wear.
Generally, WS2 in micrometric or nanometric forms delivers better mechanical properties, including improved hardness and bending strength, a lower and more consistent friction coefficient, and a lower wear rate, contributing to longer service life compared to carbon brushes, graphite, and MoS2 self-lubricating MMCs [16,17,18,19,20]. Freschi et al. [21] investigated the effects of the different concentrations of WS2 reinforcement in a copper matrix composite, highlighting the detrimental effects of an excess of the solid lubricant on the tribological properties and electrical properties. Cao et al. [22] compared the tribological behavior of three copper matrix composites, the first one containing 24 vol% graphite, the second 24 vol% WS2, and the third 12 vol% graphite and 12 vol% WS2. Samples with tungsten disulfide at 24 vol% exhibited higher mechanical performance and lower wear rate than the graphite composite with the same volume fraction of solid lubricant. The difference was attributed to the high-strength chemical bonding of the interface between WS2 and the copper matrix, which prevented plastic deformation and crack formation at the worn sub-surfaces. The composite with mixed lubrication exhibited an intermediate feature.
This research aimed to examine the influence of factors such as sintering temperature, pressure load, and maintaining time in conjunction with additional thermo-mechanical treatments using powder metallurgy techniques. The study aims to provide a complete understanding of these parameters’ effects, ultimately improving the design of composite materials and optimizing the manufacturing process.

2. Materials and Methods

The composite material was made of copper (Cu) matrix, and previous analysis [21] found out an optimal concentration of the second phase, tungsten disulfide (WS2), equal to 10 wt%. Electrolytic dendritic copper powder supplied by Makin Metal Powders, Rochdale, UK, had a declared purity of 99.5% and a nominal particle size lower than 45 μm. The nominal particle diameter of the tungsten (IV) disulfide powder, supplied by Sigma-Aldrich Corporation, St. Louis, MO, USA, was 2 μm and had a high purity level (99%).

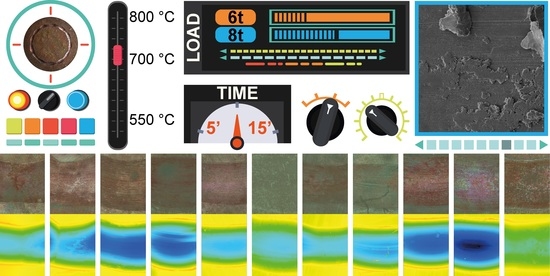
2.1. Production Method

The powders were dried in an oven at 120 °C for 8 h to remove moisture. Cu and 10 wt% of WS2 were mixed with a high-energy ball milling (MGS S.r.l., Olginate, Italy) for two hours, at room temperature, with a milling speed of 60 rpm. Zirconia spheres with a diameter of 15 mm were employed as grinding medium, with a ball-to-powder ratio of 10:1. The green composites were produced by putting 1.5 g of evenly mixed powder into a steel cylindrical rigid die and subjecting it to uniaxial cold pressing using a manual press (Specac Ltd., Orpington, UK) with a nominal load of 6 tons (approximately 445 MPa) maintained for 5 min. The obtained sample was a compacted tablet with a diameter of 13 mm and a thickness of 2 mm. The consolidation of the green compacts was performed through a sintering process carried out for 1 h in a Carbolite Gero, Hope, UK, 1200 °C E-Range tube furnace—EHA model with a 301 controller. Three different sintering temperatures were analyzed: 550 °C (sample 6–5550), 700 °C (sample 6–5700), and 800 °C (sample 6–5800) reached with a heating rate of 8 °C min−1. Additional thermo-mechanical treatments were analyzed: a second pressing step, investigating the combination of 6 or 8 tons applied for 5 or 15 min (samples P(6–5), P(6–15), P(8–5), P(8–15)); a second sintering step after the additional press, at 550 °C for 1 h (samples PS(6–5), PS(6–15), PS(8–5), PS(8–15)). The complete set of the eleven analyzed samples is reported in Table 1.

2.2. X-ray Diffractometry

X-ray diffractometry (XRD) was carried out using a D8 Advance diffractometer (Bruker Corporation, Billerica, MA, USA) to investigate the presence of any unwanted compounds that could form during high-temperature sintering. The diffractometer exploited the radiation Cu (λ = 1.54 Å) that scanned the samples at a rate of 0.02° s−1 in the range of 5°–90° with applied tension and current of 40 kV and 40 mA, respectively.

2.3. Absolute Density

Absolute density was measured by a hydrostatic balance (Sartorius Lab Instruments GmbH & Co. YDK 01, Goettingen, Germany) based on Archimedes’ principle, assessing the amount of porosity that may influence the mechanical behavior of the composite. Three measurements were performed for each sample.

2.4. Electrical Resistivity

The DC resistance-meter model 2841 by B&K Precision Corporation, Yorba Linda, CA, USA, performed the electrical resistance measurement. Each sample was tested three times. The measured resistance R (Ω) was used to calculate the electrical resistivity ρ (Ω m) through Ohm’s second law, considering the thickness t (m) of the tablet, the length l (m) of the chord, and the distance d (m) between the two clips, as reported in Figure 1.

2.5. Static Optical Contact Angle

The static optical contact angle (SOCA) was evaluated by measuring the contact angle of a 3 μL water drop on the sample surface with the Optical Contact Angle 15 plus (Dataphysics GmbH, Filderstadt, Germany). The average value was calculated after ten measurements. This analysis evaluated the wettability of the composite, considering the wide range of applications in which the self-lubricating composite can be used. Hydrophobicity is typically desired to avoid the formation of a uniform liquid layer that may affect the component performance.

2.6. Micro-Indentation Hardness

The micro-indentation hardness measurement was carried out by applying a static load of 500 gf, maintained for 15 s, on the surface of the sample through the Microhardness Tester FM700 (TECMET 2000 S.r.l., Corsico, Italy) by a Vickers indenter. The test was performed three times for each sample, considering different points along the diameter of the tablet.

2.7. Wear Test

A CSM Instrument (now Anton Paar TriTec SA, Corcelles, Switzerland) tribometer analyzed the behavior of the produced materials at room temperature. A ball-on-disc configuration was selected, using a force (F) of 5 N orthogonal to the sample surface, applied by a 100Cr6 counter ball with a diameter of 6 mm and a nominal hardness of 831 HV. As in the previous analysis of the research group [17,18,21], the tangential speed was 0.18 m s−1 and the radius of the ball path on the sample was 4.5 mm. The total analyzed distance was 500 m. Wear tracks and counter balls were observed via optical microscopy (OM), Eclipse LV150NL (Nikon, Tokyo, Japan), scanning electron microscopy (SEM), EVO 50 EP/LZ4 PENTAFET (Carl Zeiss S.p.A., Oberkochen, Germany), and confocal laser scanning microscopy (CLSM), VK-X200 (Keyence Corporation, Osaka, Japan). Moreover, SEM equipped with an energy dispersive spectrometer (EDS), Oxford Inca Energy 200 (Oxford Instruments plc. Tubney Woods, Abingdon, Oxon, UK) was employed to analyze the wear tracks, evaluating the effects of the thermo-mechanical treatments and the wear mechanisms. Through the CLSM, the volumetric wear loss Wv (mm3) was estimated as the difference between the areas of the grooves Ag (mm2) and the ridges Ar (mm2) multiplied for the sliding distance l, (mm), as in Equation (1). The wear coefficient k (-) and the specific wear rate W (mm3 N−1 m−1) were calculated by Equations (2) and (3) [23,24,25,26].
W v = A g A r   l
W = W v l   F
k = A g A r   l   H l   F

3. Results

3.1. X-ray Diffractometry

The XRD patterns are reported in Figure 2. The analysis highlighted the presence of copper, with characteristic diffraction angles of 43° (1 1 1), 51° (2 0 0), and 74° (2 2 0), and of tungsten disulfide, with characteristic diffraction angles of 14° (0 0 2), 29° (0 0 4), 44° (0 0 6), and 52° (0 0 8), as expected. The samples sintered at 700 °C and 800 °C exhibited a small peak at 25.7°, which may be attributed to the monoclinic tungsten dioxide (WO2). The annealing at high temperatures determined the decomposition of tungsten disulfide; sulfur was typically volatile, while tungsten bonded with oxygen.

3.2. Density

The density of the employed dendritic pure copper is 7.55 g cm−3, given as a reference in Figure 3 to better understand the reported data. The measured values are all below the one of pure copper; the minimum and the maximum density were found for the samples sintered at 700 °C (7.15 g cm−3) and the sample PS(8–5) (7.95 g cm−3), respectively. Generally, the different production routes did not determine great differences in density. As a comparison, the average value was 7.59 g cm−3.
During sintering, the partial melting of the solid phase flows, determining two opposite mechanisms: the enlargement of the porosities due to the gaseous phase pressure or the filling of the pores with the liquidus. In the measured samples, the slight lowering found for sample 6–5700 suggested that the first mechanism, the enlargement of the pores, dominated at 700 °C. Considering the same period, 1 h, the temperature increase to 800 °C could have determined the switch to the other mechanisms to a small extent. The absolute density of produced composites increased after applying a post-sintering pressing at both 6 and 8 tons and for different periods, namely 5 or 15 min. The additional pressing step determined the collapse of the pores structure, probably eliminating the most superficial porosity. The higher the applied load, the better the densification effect. Composites subjected to the double-pressing and double-sintering process showed a slightly higher density or non-relevant variation with respect to the ones produced by exploiting the double-pressing route with the same pressing parameters. This pointed out that the effect of the second pressing was greater than that of the second sintering. The trapped gaseous phase was hindered from moving out from the composite. Possible reasons are the lack of sufficient liquidus, limiting the mobility within the composite, or a too short time that did not permit the gas to come out.

3.3. Electrical Resistivity

The electrical resistivity of the pure copper tablet is 4.92 × 10⁻⁸ Ωm. Figure 4 displays the graphical representation of the resistivity values and standard deviations. The electrical resistivity of all the tested samples was higher than that of the pure copper tablet because of the presence of the semiconductive tungsten disulfide.
In agreement with density results, the composite tablet sintered at 700 °C showed a slightly higher electrical resistivity than the reference sample 6–5550, probably due to a slight amount of porosity. The electrical conductivity improved in the case of sintering at 800 °C thanks to better compaction; hence, the metal network, which formed the conductive path, was preserved. The application of a second pressing gave rise to a slight increase in resistivity in most cases. Based on density data, post-sintering pressing increased density and reduced porosity with a more extensive conductive network. However, the mechanical treatment also induced defects and dislocations, new grain boundaries that hindered electrical conductivity.
The only exception was the value recorded for the sample double-pressed at 8 tons for 15 min, for which a resistivity lower than the single pressed-single sintered sample was found. The increased density possibly overcame the defects introduction effect. The PS specimens presented a better electrical conductivity with respect to single-pressed single-sintered and double-pressed tablets with the same experienced sintering temperature. Since the density values remained almost unchanged for the different treatments, the resistivity results can be attributed to the reduction of dislocations and lattice stresses achieved during the second sintering.

3.4. Static Optical Contact Angle

As depicted in Figure 5, the tested samples exhibited hydrophobic behavior, with contact angles that ranged from 97.6° of the 6–5550 sample to 117.56° of the 6–5800 sample. The hydrophobic behavior determined the formation of single drops on the surface of the samples, avoiding the formation of a uniform layer of water, where due to moisture, different temperatures and environments may cause or facilitate unwanted phenomena such as the formation of ice, the reaction with chemicals, or the oxidation of the surface.
Specimens compacted through double-pressing processes show a hydrophobic behavior and a lower contact angle with respect to the specimen produced through the single-pressing and single-sintering route. Among the specimens subjected to a post-sintering pressing, the lowest contact angle was recorded for the tablet P(6–5), i.e., 97.6°, while the highest one was found for the specimen P(6–15), i.e., 104.4°. In addition, the double-pressed and double-sintered tablets (PS) display a hydrophobic behavior: the contact angles are well above 90°. The value recorded for composite PS(8–5) is very close to the one of the reference sample 6–5. For the same second pressing parameters, the samples compacted via PS exhibited higher values of optical contact angles compared to the double-pressed tablets, probably due to the relaxation of the lattice thanks to the second thermal treatment. As reported in Figure 6, the drops are generally similar, and the additional thermo-mechanical treatments do not strongly affect the hydrophobic behavior.

3.5. Micro-Indentation Hardness
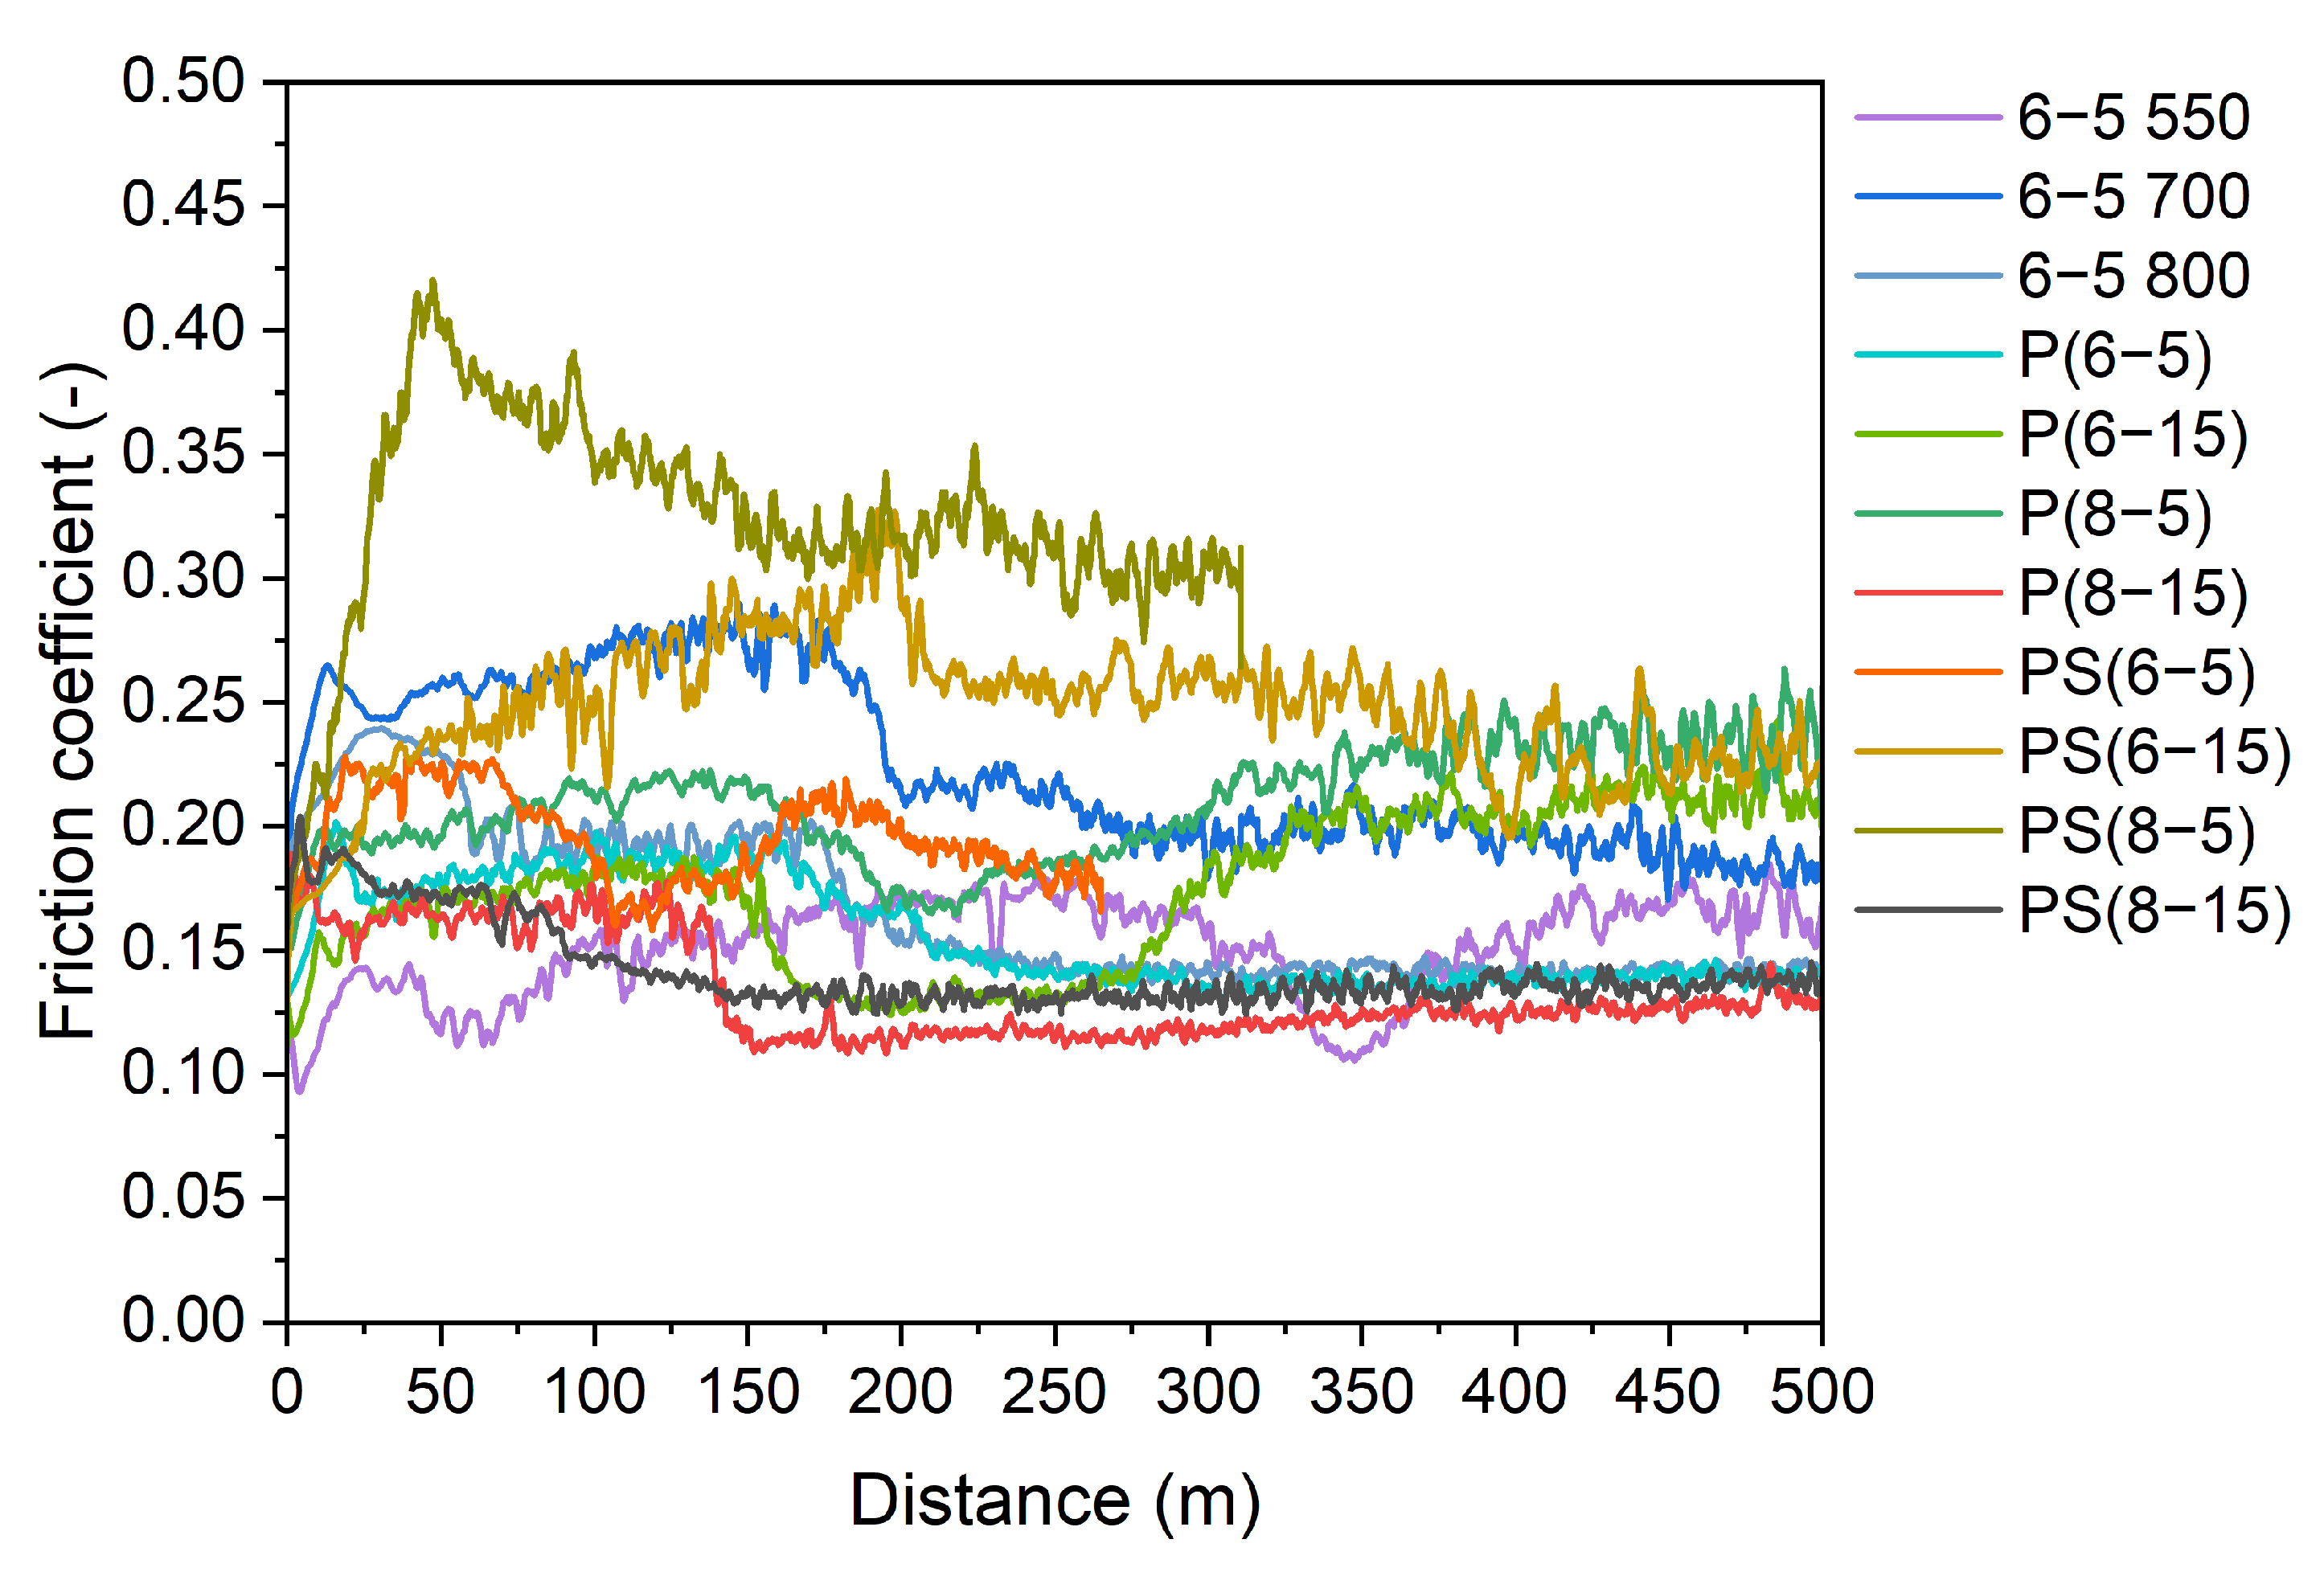
Pure dendritic copper micro-indentation hardness, previously measured, is 518.8 MPa [21] and is presented in Figure 7 as a reference. Measured values did not strongly differ and ranged from 601.4 MPa, sample 6–5800, to 996.4 MPa, sample P(8–15). The sintering temperature increase from 550 °C to 700 °C or 800 °C determined the hardness reduction, which can be correlated to the easiness of hydrogen diffusion on the outer part of the samples with increased temperature. The results pointed out an improvement in the specimen hardness due to the additional pressing treatment related to the increase in density and reduction of porosities and the greater plastic deformation to which the material is subjected when there is an increase of pressure applied to it. It was observed that a greater hardness was achieved for the same application time as the applied load increased from 6 to 8 tons. The effect of the applied load was more relevant in determining the increase in sample hardness than that of the time of the second pressing. The hardness value is lower than the corresponding double-pressed tablet. This decrement probably was caused by a relaxation of stresses and dislocations introduced during the plastic deformation induced by the second pressing.

3.6. Wear Test

The friction coefficient (FC) curves, Figure 8, as the first output of the tribological assessment, are analyzed here. As a result, the recorded friction coefficient values are all well below the pure copper previously tested [17]. Images from the optical microscope at different magnifications of the wear track of the composites, as well as the images at the stereomicroscope of the corresponding counter ball, are reported to better identify the involved wear mechanisms.

3.6.1. Sintering Temperature

A detailed image of the FC trend of the samples sintered with different temperatures is reported in Figure 9. The sample sintered at 550 °C exhibited an FC ranging from 0.1 to 0.17. A decrement was observed around 350 m, which can be traced back to the uncovering of a bigger portion of solid lubricant, which facilitated the countersurface sliding on the sample. With the test proceeding, solid lubricant was consumed and dispersed along and outside the wear track, and the FC came back around 0.15.
At the beginning of the test, the samples sintered at 700 °C and 800 °C had a higher FC than the reference sample 6–5550. The one sintered at 700 °C showed the greatest initial FC. A running-in stage characterized the sample sintered at 700 °C until 200 m, where FC decreased, reaching the final steady state around 0.18, slightly higher than the reference specimen. The composite sintered at 800 °C presented a lower FC throughout the test, and the running-in stage extended until 200 m. Then, a steady-state approximately equal to 0.14 was achieved, which was lower than the reference sample.
The images of the wear tracks in Figure 10 indicate that oxidation, abrasion, and adhesion wear mechanisms occurred. The presence of a chipping phenomenon led to non-homogenous wear tracks width. This mechanism is typical of composite materials made of different phases. It is generated by the deformation of the material induced by the counter ball during its sliding; chips of material are detached and remain in front of the ball, hindering the correct sliding. An enlargement in the wear track is observed when the wear debris is between the two coupling surfaces, while a bottleneck is found when the chip is worn or removed, allowing the approach of the two surfaces.
Specimens sintered at 700 °C (Figure 10B) and 800 °C (Figure 10C) showed a wider wear track than the one of the sample sintered at 550 °C (Figure 10A), respectively, equal to 1756 µm and 1652 µm. Moreover, comparing the measures taken at the bottleneck of the track with the ones at the largest point, it can be assessed that the greatest variation was detected for the specimen subjected to 700 °C sintering, around 300 µm. On the other hand, a difference of almost 200 µm was recorded for composite 6–5800. The analysis of the counter balls highlighted the presence of some transfer layer. The width of the abrasive area, around 1500 µm, was not proportional to the width of the wear track of the correspondent sample; it followed the trend of the previously presented indentation hardness. The harder the composite material, the wider the worn area on the counter ball.
According to the above considerations, sintering at a temperature higher than 550 °C seemed to lead to a more regular trend of the FC curve and the formation of a more stable tungsten disulfide lubricating film, given that the steady state was reached in both cases. Moreover, the best result obtained among these three samples was achieved by applying a sintering temperature of 800 °C, since the final friction coefficient was lower, and there was a gain with respect to the reference sintering at 550 °C.

3.6.2. Double-Pressing

The friction coefficient of all the double-pressed samples is reported in Figure 11. The reference specimen 6–5550 showed the lowest FC value at the beginning of the test, then, it increased and fluctuated. As previously discussed, a hollow around 350 m was found: the friction coefficient reached its minimum, and then it raised again. This feature was also found in samples P(8–5) and P(6–15), and it could be related to the solid lubricant instability or the non-homogeneity of the material. In the first case, the friction coefficient increased because of the detachment of chips from the unstable lubricating film during the repeated sliding. In the second case, the counter ball adhered to a WS2 particle or a discontinuous lubricating film, with the consequent FC reduction. Then, once the particle or the lubricating film was worn, the friction coefficient increased. The solid lubricant consumption was not properly compensated because of a lack of composite homogeneity.
The specimens P(6–5) and P(8–15) showed a trend characterized by two main stages: a running-in and a steady-state stage. In the first one, the friction coefficient was higher (around 0.18) since the sliding contact between the composite surface and the countersurface was not perfect, and coupling was occurring. Coupling was achieved at a distance between 150 m and 250 m, a strong reduction of the FC was detected, and the steady-state stage was reached. This implied the formation of a stable tribo-film at the worn surface, providing lubrication. The distance at which the transition of the FC occurred is not attributable to the performed treatment; it depends on the surface condition of both the sample and the countersurface.
The visual inspection of the wear tracks, Figure 12, highlighted the main wear phenomena that occurred during the test: abrasion and adhesion. The non-homogenous appearance of the wear tracks indicated the presence of chipping phenomena, as previously discussed. The irregular sliding was reflected also in the friction coefficient curves, characterized by continuous oscillations as a sort of background noise.
The largest width was detected for sample P(6–5), equal to 1602 µm (Figure 12A), while the narrowest was 1282 µm for the tablet subjected to a second pressing of 8 tons for 5 min (Figure 12C). The other samples’ breadths were very similar, around 1400–1475 µm. In addition, shrinkage was around 300 µm for all the specimens except for P(6–5), for which the greatest shrinkage of 400–600 µm was reported.
The analysis of the counter ball highlighted the presence of material transfer on the countersurface. The width of the worn area on the counter ball almost resembled the one of the wear tracks, ranging from 1430 µm to 1680 µm.
Based on the presented considerations, the second pressing at 8 tons for 15 min seems to be the best combination of post-sintering pressing parameters.

3.6.3. Double-Pressing and Double-Sintering

The measured friction coefficient of the double-pressed and double-sintered (PS) samples are plotted in Figure 13 as a function of the distance in the wear test. All the obtained curves had an initial friction coefficient higher than the one recorded for the reference sample 6–5550, at least up to 100 m. The friction coefficient curve of sample PS(6–5) presented a hollow at about 100 m, probably due to the solid lubricant instability or to the non-homogeneity of the material. Even though a decrease in FC was observed starting from 200 m, the test stopped because of the high frictional tangential force, which may suggest the lack of a stable and complete tribo-layer, or due to the high volume of particles produced, which stopped the test. The PS(6–15) friction coefficient curve continuously increased, suggesting some adhesion phenomena between the composite and the counterpart. Around 200 m, a small reduction in friction was detected. However, the FC remained higher than the reference sample 6–5550 and fluctuated to some extent. This highlighted the possible formation of an unstable and incomplete lubricating film at the wear surface so that metal-to-metal contact and adhesive wear can still occur.
Composite PS(8–5) showed the highest friction coefficient throughout the entire traveled sliding distance. The friction reduction occurred around 50 m, but the steady state was not achieved due to the high frictional tangential force, which stopped the test, possibly due to the absence of continuous lubricating action and the adhesion with the countersurface. The FC curve of sample PS(8–15) regularly decreased as sliding distance increased, reaching a steady-state stage of approximately 0.14 around 100 m. This result indicated the presence of a stable tungsten disulfide lubricating film at the contact region. The presented results found that the PS treatment applied to sample PS(8–15) seemed to be the best combination of parameters.
Wear tracks in Figure 14 revealed the presence of grooves and debris, suggesting an abrasive wear mechanism occurred, as well as several pits, indicating adhesion. As previously seen for double-pressed composites, the wear tracks were non-homogenous because of a chipping phenomenon. The smallest irregularity was detected for the composite PS(8–15). This aspect was reflected in the trend of the friction coefficient, which was regular and characterized by only small peaks and fluctuations. The other specimens were characterized by a big variation of the FC, interruptions, and the absence of a regular steady-state regime.
PS composite tablets displayed a larger track with respect to the reference sample 6–5550. In particular, the greatest difference of around 400 µm was reported for most of the specimens, except for PS(8–15), which showed a slight increase. Moreover, the samples PS(6–5) and PS(8–5) did not reach the 500 m goal. The comparison of wear tracks of specimens in Figure 12 and Figure 14, considering the same second pressing parameters, shows that the additional sintering step determined wider wear tracks.
The stereoscope microscopy revealed the presence of a transfer layer on the countersurfaces and a larger contact area between the sample surface and the ball, resulting from the ball wear.
Other techniques should be employed to better understand the nature of the visible deposited material. The track on the counter ball associated with the tribological analysis of sample PS(8–15) is the narrowest, 1533 µm, while the other counter ball had a wear width of around 1900 µm. The tribological performances of the PS samples suggested that the additional treatment did not determine the consistent improvement of the wear behavior of the composites.

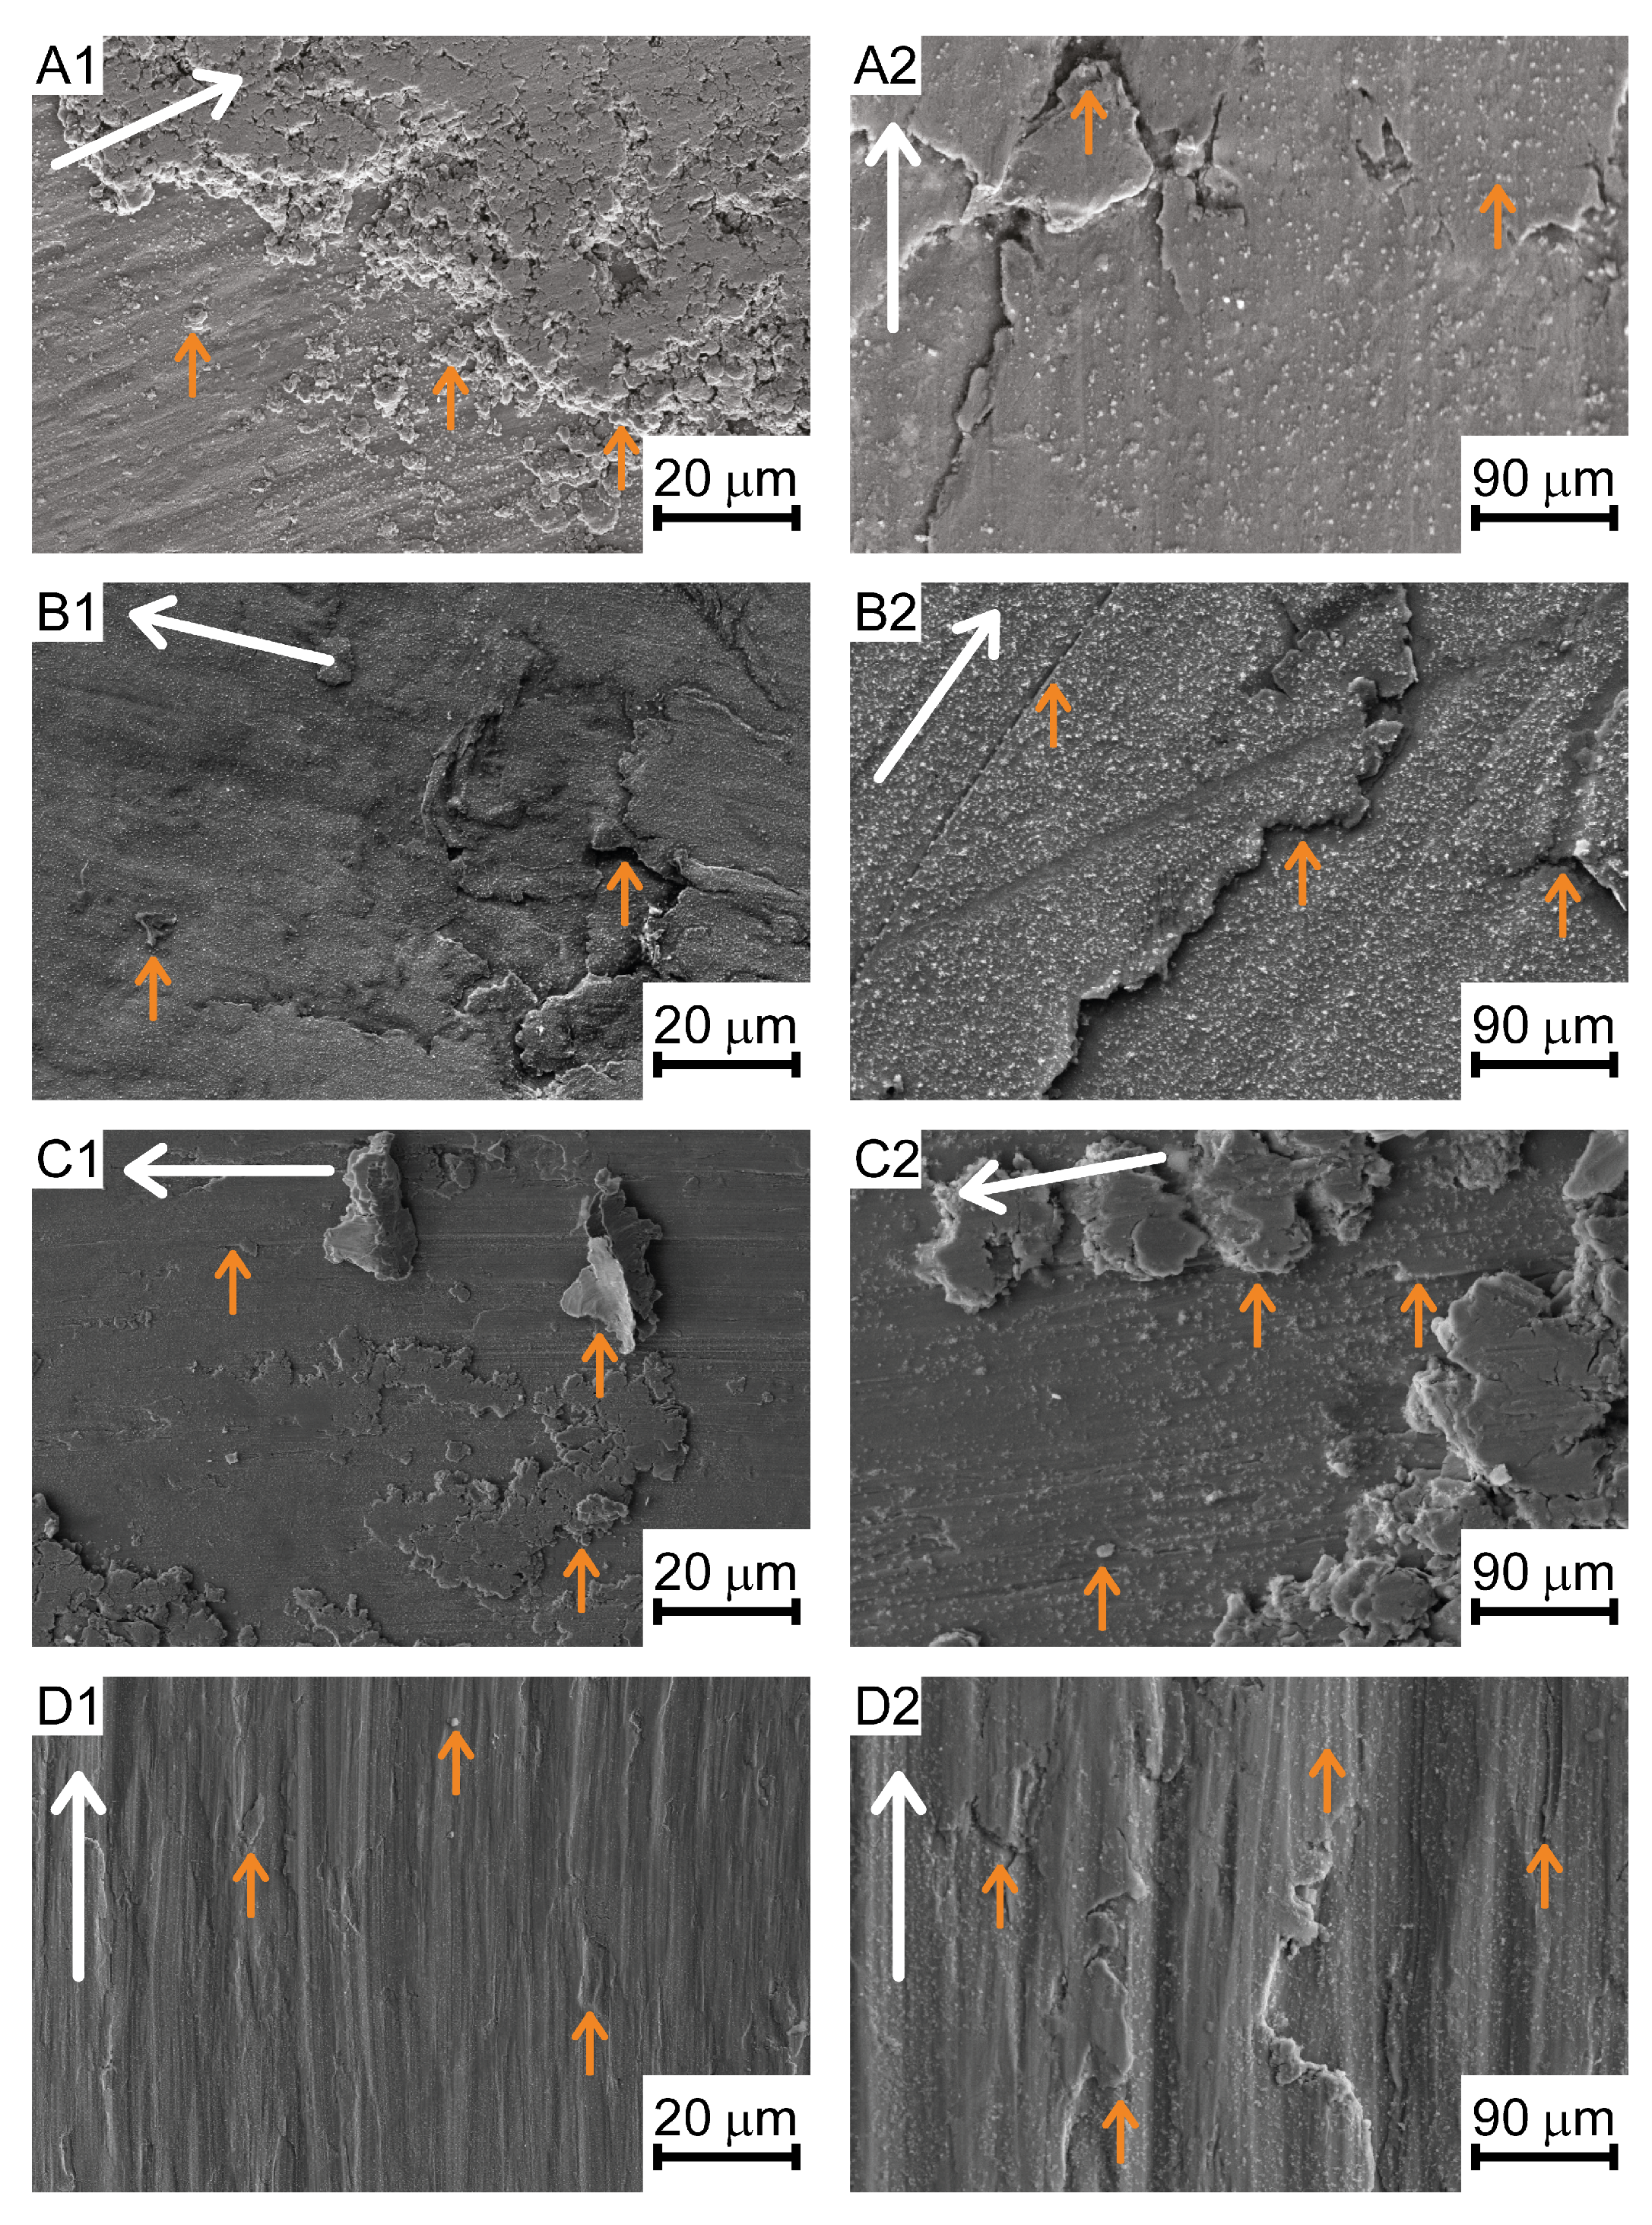
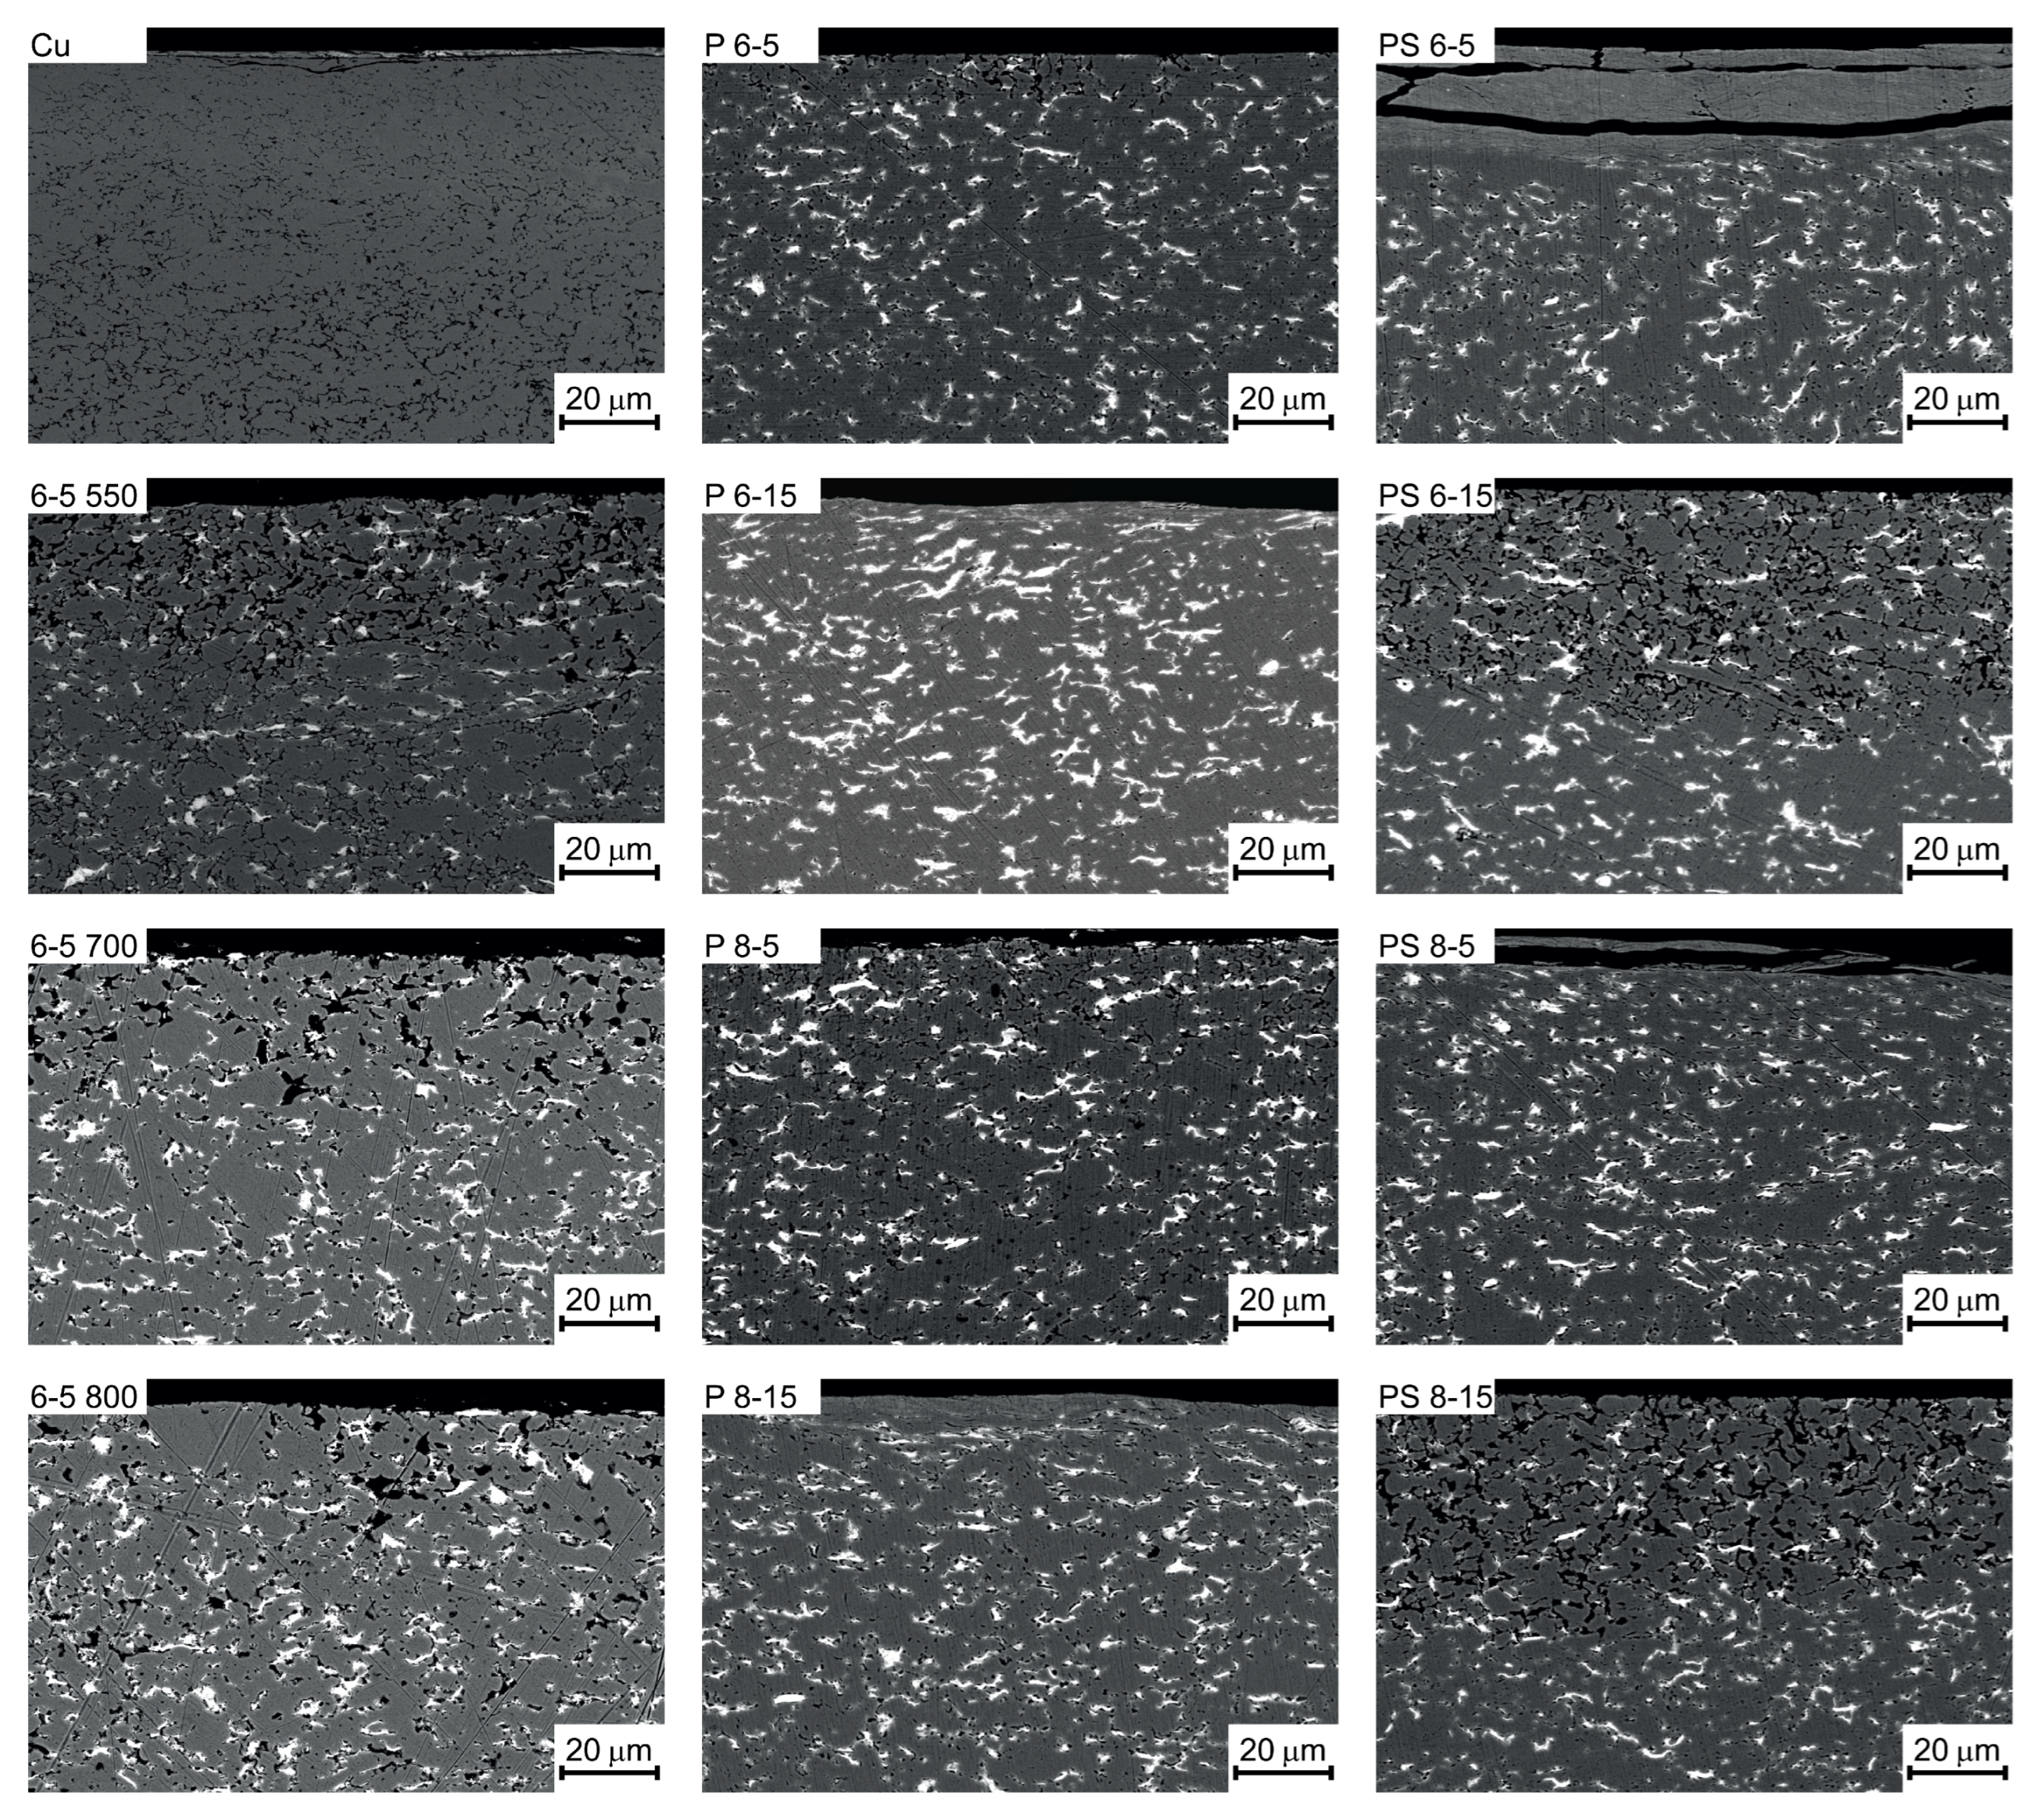
3.6.4. Scanning Electron Microscopy

Figure 15 shows the scanning electron micrographs at different magnifications (400× and 1500×) of the selection of some wear tracks of Cu–10 wt.% WS2 composite tablets. The white arrow indicates the sliding direction, and the orange arrows point out the main wear damages.
In sample 6–5550, Figure 15A, the morphology of the wear track was very irregular and showed distinctive marks of abrasive and adhesive wear. Many ploughing grooves were present parallel to the sliding direction due to the abrasive action of wear debris or hard asperities eventually present on the surface of the counter ball.
The lubricating film was better observed in the samples 6–5800, P(8–5), and PS(8–15), Figure 15B–D, respectively. In particular, a smoother and more homogeneous surface was detected on the sample PS(8–15), where a small amount of debris was found.
Several signs characteristic of the adhesive mechanism were found. In particular, plastic deformation of the material within the wear track, caused by the transfer of material from one surface to the other, adhesive wear particles, torn off from the surface, and roughening, caused by the wear particles acting as abrasive particles. Pits, chips, and many aggregations of flake-like and scaled debris were found at different sites, suggesting the occurrence of adhesion phenomena and confirming a third-body mechanism that led to the wear track irregular shape. Delamination of surface material was located close to the boundary of the wear track at different points. This wear mechanism was probably induced by the formation and growth of subsurface cracks during the repeated sliding due to porosities at the interface of copper matrix and tungsten disulfide particles. In fact, in the delamination region, many pores were observed. The large number of irregularities detected through the SEM investigation and previously collected data from the wear test confirmed the lack of a stable film of solid lubricant.
Energy dispersive spectrometry carried within the wear track revealed the presence of iron and oxygen beyond the elements that constitute the composite, as reported in Table 2. Iron belongs to the 100Cr6 steel counter ball, confirming the adhesion mechanism and wear of the countersurface. The presence of oxygen is related to the oxidation of the copper surface during sliding.
The SEM analysis of the cross-section of the samples, as shown in Figure 16, reveals a well-distributed solid lubricant (white areas) in the matrix. Sintering temperatures above 550 °C result in high porosity concentrated near the surface, which could contribute to wear debris production. The porosity in P samples is lower compared to composites that were pressed and sintered only once, regardless of sintering temperature. The PS samples exhibit more distributed and smaller pores than the composites pressed and sintered once. A thick crack is visible in sample PS(6–5), suggesting delamination or adhesion issues. To a lesser extent, delamination and cracks are visible in sample PS(8–5).

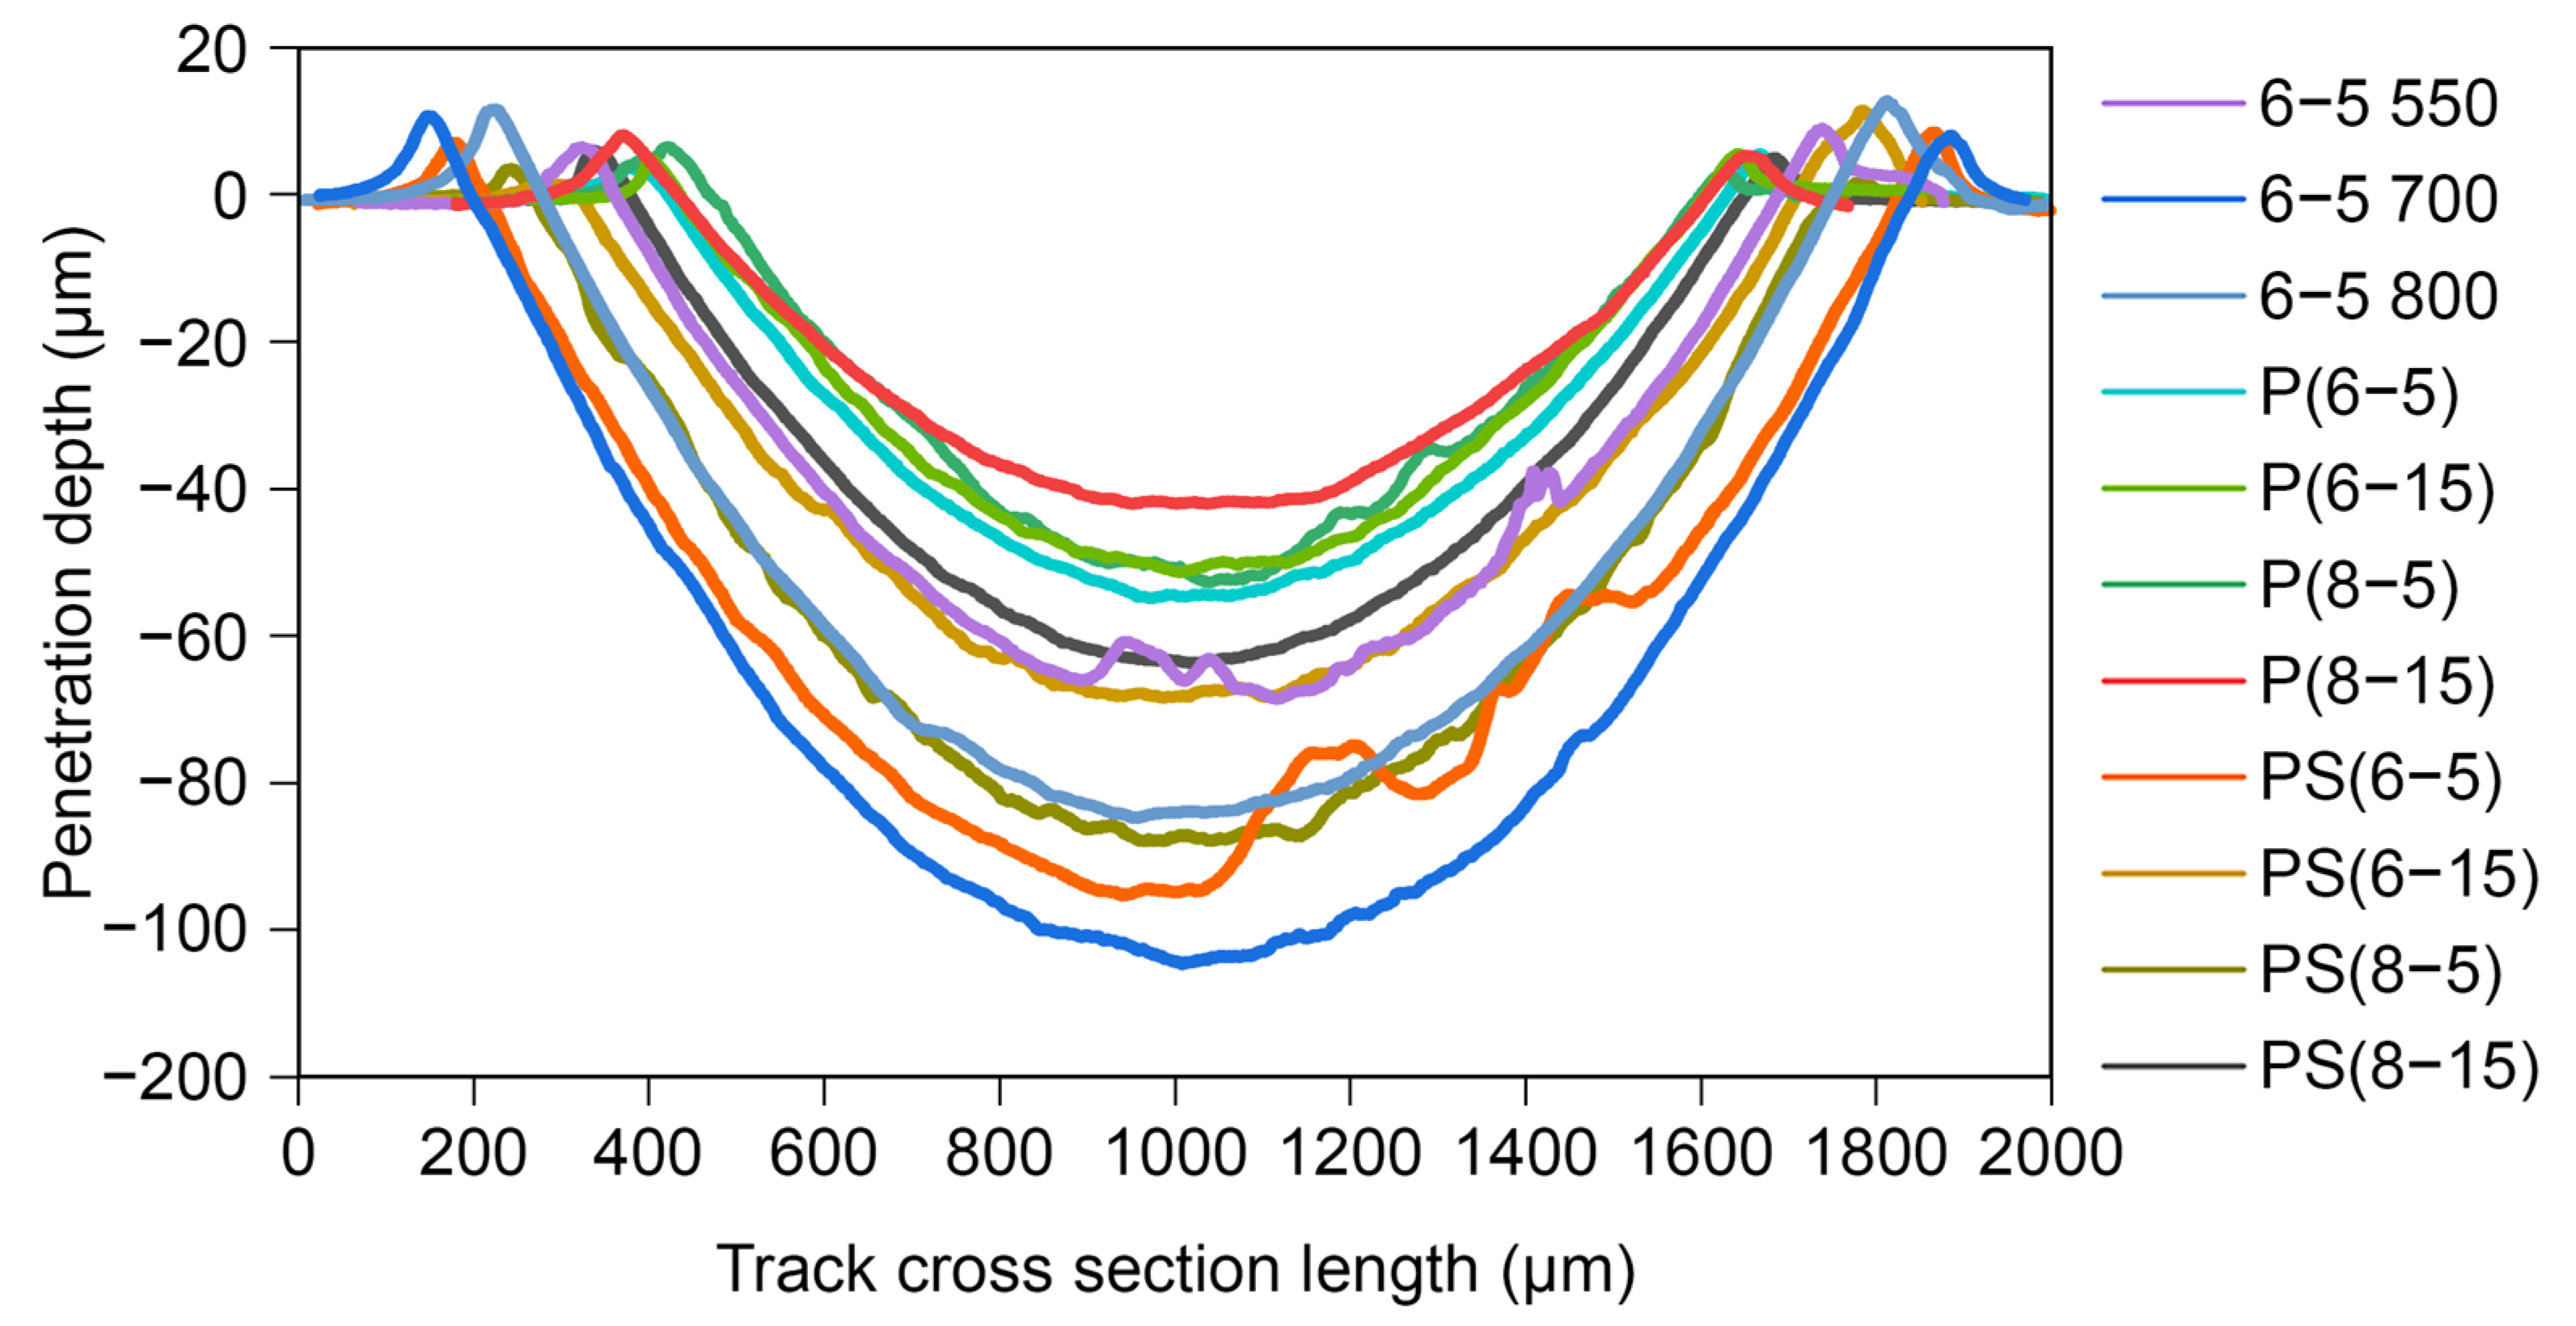
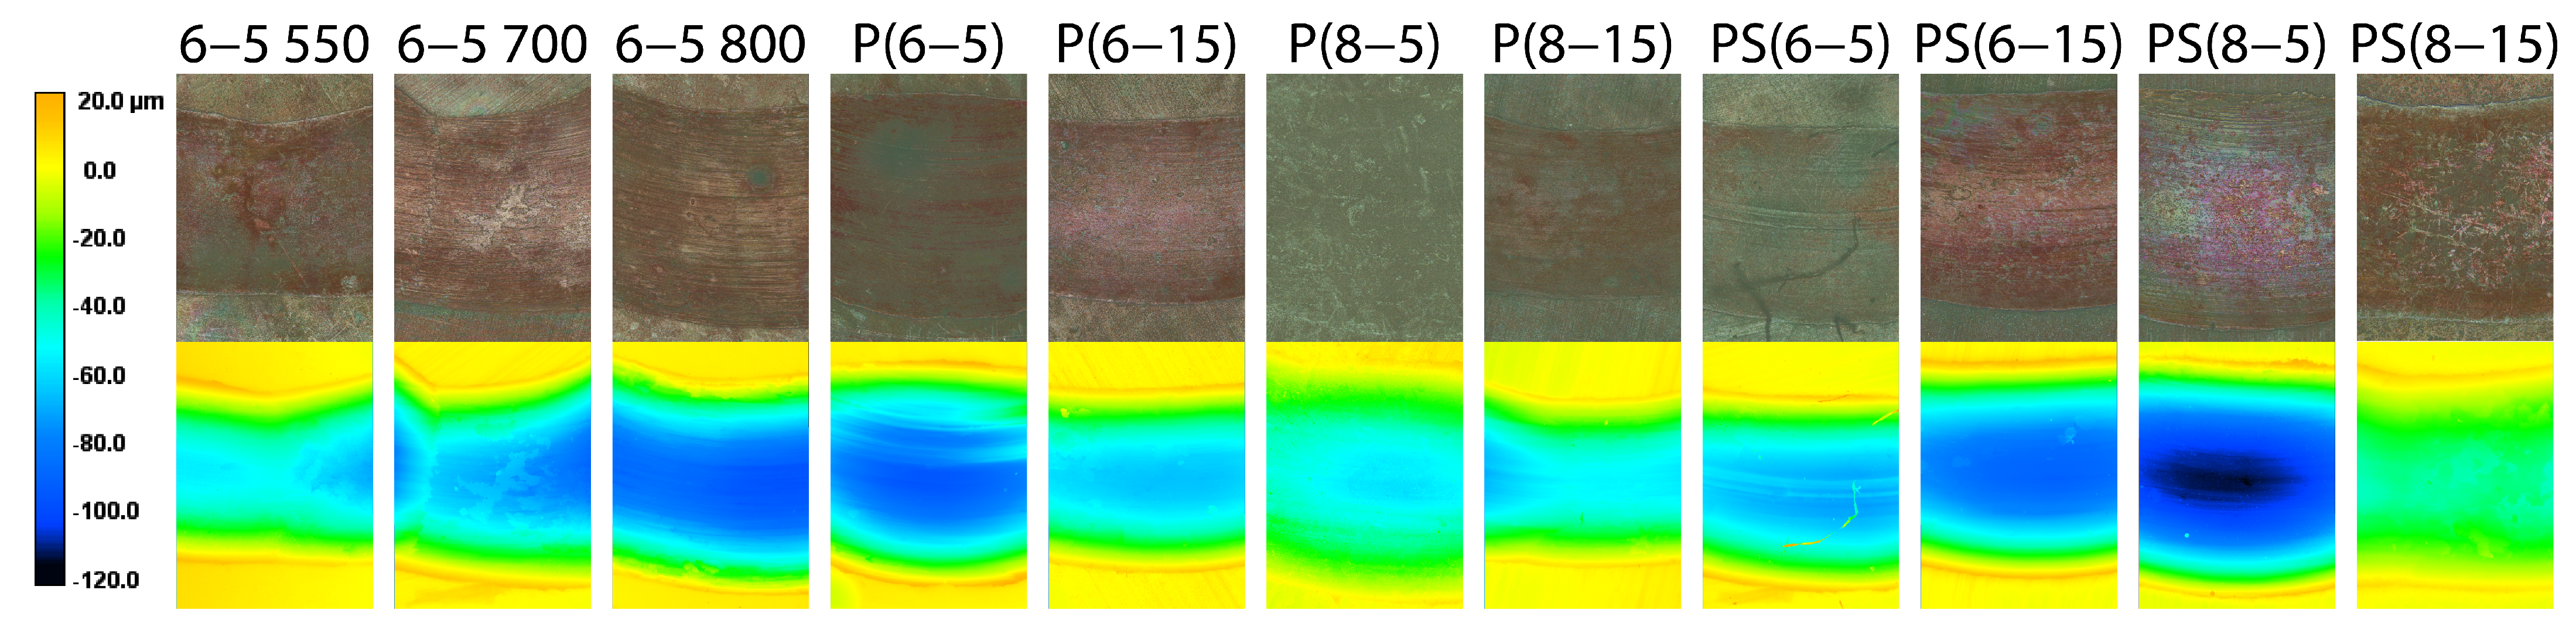
3.6.5. Confocal Laser Scanning Microscopy

The confocal laser scanning microscopy investigated the depth and width of the wear track. Examples of the obtained profiles of the wear track for each sample are reported in Figure 17. The cross-sections highlighted an increase in removed material due to a sintering temperature higher than 550 °C, probably caused by the higher porosity individuated by the SEM cross-section analysis. The same trend was observed in the samples that did not complete the wear test, pointing out the worsening of the tribological properties and the harshening of the wear mechanisms.
The images obtained by optical microscopy and CLSM in Figure 18 highlight the different depths thanks to the scale color. In the optical microscopy images, the wear tracks exhibited a variety of colors mainly due to oxidative phenomena.
The analysis of the CLSM data led to calculating the specific wear rate and the wear coefficient that indicated the wear severity and the occurring mechanisms, Figure 19.
The additional thermo-mechanical treatments generally determined a decrease in wear coefficient at different extents, remaining in the same order of magnitude of the 6–5550 sample (4.16 × 10⁻⁴), meaning that the wear mechanism is not heavily modified, but a milder wear regime was reached. In particular, the best result, 1.12 × 10⁻⁴, was reached by the P(8–5) sample, which exhibited the lower value of the specific wear rate as well, namely 3.52 × 10⁻⁴ mm3 N−1 m−1. Thermal treatments worsened the specific wear rate, compared to the 6–5550 sample, leading to a higher volume of removed material due to the softer obtained composite. The high specific wear rate of the samples PS(6–5) and PS(8–5) considered the shorter distance due to the interruption of the test and confirmed the severe wear determined by the high friction coefficient. Higher pressure employed in the additional sintering step improved the tribological performance of the composite. In contrast, the additional sintering caused a slight increase in both wear coefficient and specific wear rate comparing both the couples P(6–15), PS(6–15) and P(8–15), PS(8–15).

4. Conclusions

This study explored various methods of using powder metallurgy to create composite materials made of copper and 10 wt% tungsten disulfide. The research focused on evaluating the effects of different sintering temperatures (550, 700, and 800 °C), pressing load (6 and 8 tons), and maintaining time (5 and 15 min) as the main parameters. Moreover, additional thermo-mechanical treatments, namely pressing and sintering, were evaluated. The findings revealed that the production method did not impact the material’s hydrophobic behavior. However, sintering temperatures above 550 °C deteriorated the mechanical and tribological properties, with the worst results observed at 700 °C. Higher specific wear rates were found for samples sintered at 800 °C and 700 °C compared to those sintered at 550 °C. Additional pressing generally improved the tested properties, especially when using a higher load of 8 tons. This resulted in better results in the electrical and tribological analysis and a decrease in both the specific wear rate and the wear coefficient. Using a double-pressing and double-sintering route did not enhance the results, but it was useful in cases of excessive material embrittlement. A slight worsening of the wear behavior and improved electrical properties were observed compared to samples obtained with the double-pressing route. The effect of maintaining time was limited and did not affect the results. Overall, the best results were obtained by applying an additional high load after traditional pressing and sintering using powder metallurgy methodology. The main outcomes of the tested properties are:
  • The presence of tungsten oxide (WO2) due to a sintering temperature above 550 °C indicates the deterioration of the solid lubricant.
  • The decrease in the density of the composite material with respect to pure copper is due to the presence of the reinforcement.
  • The electrical resistivity of the composite material is in the same order of magnitude as the pure copper sample, and slight differences occurred considering the production routes.
  • Hydrophobic behavior is not influenced by the different production routes proposed in this study.
  • Additional pressing determined an increase in the hardness of the composites, and a higher load corresponded to a higher hardness value.
  • During the wear test, the friction coefficient reached the lowest values due to additional pressing with the highest load (8 tons), both in double-pressed and double-pressed double-sintered cases. The SEM cross-section analysis pointed out a lower superficial porosity.
  • Wear test interruption of samples PS(6–5) and PS(8–5) was mainly due to the formation and propagation of sub-surface cracks that determined the detachment of big portions of materials.
  • The wear coefficient and specific wear rate decreased due to the additional thermo-mechanical treatments, but remained in the same order of magnitude as the reference sample sintered at 550 °C.
  • Wear volume lowest values were found for the double-pressed samples, with similar results independently from the load and the maintaining time.
  • Abrasion is the characteristic wear mechanism detected. The analysis of the wear track highlighted the presence of wear sub-mechanisms: adhesion, oxidation, third-body, and delamination, to different extents.

Author Contributions

Conceptualization, M.F., O.H., N.L. and G.D.; methodology, M.F., L.D. and M.M.; validation, O.H., J.K., N.L. and G.D.; formal analysis, M.F., L.D., M.M. and O.H.; investigation, M.F., L.D., M.M. and O.H.; resources, J.K., N.L. and G.D.; data curation, M.F. and L.D.; writing—original draft preparation, M.F. and L.D.; writing—review and editing, M.F., O.H., J.K., N.L. and G.D.; visualization, M.F.; supervision, O.H., J.K., N.L. and G.D.; project administration, G.D.; funding acquisition, G.D. All authors have read and agreed to the published version of the manuscript.

Funding

This research was funded by the European Institute of Innovation and Technology (EIT) Raw Materials (Berlin, Germany) with the project ADMA2-Practical training between Academia and Industry during doctoral studies, grant number 18252.

Data Availability Statement

All the data are available in the manuscript; additional information can be provided by contacting the corresponding author.

Conflicts of Interest

The authors declare no conflict of interest and the funders had no role in the design of the study; in the collection, analyses, or interpretation of data; in the writing of the manuscript; or in the decision to publish the results.

References

  1. Haghshenas, M. Metal-Matrix Composites. In Reference Module in Materials Science and Materials Engineering; Elsevier: Amsterdam, The Netherlands, 2016. [Google Scholar]
  2. Kainer, K.U. Metal Matrix Composites: Custom-Made Materials for Automotive and Aerospace Engineering; Willey: New York, NY, USA, 2006; p. 314. [Google Scholar]
  3. Metal matrix, fibre–metal and ceramic matrix composites for aerospace applications. In Introduction to Aerospace Materials; Woodhead Publishing: Sawston, UK, 2012; pp. 394–410.
  4. Freschi, M.; Paniz, A.; Cerqueni, E.; Colella, G.; Dotelli, G. The Twelve Principles of Green Tribology: Studies, Research, and Case Studies— A Brief Anthology. Lubricants 2022, 10, 129. [Google Scholar] [CrossRef]
  5. Xiao, J.K.; Zhang, W.; Zhang, C. Microstructure evolution and tribological performance of Cu-WS2 self-lubricating composites. Wear 2018, 412–413, 109–119. [Google Scholar] [CrossRef]
  6. Peters, S.T. (Ed.) Handbook of Composites, 2nd ed.; Springer: New York, NY, USA, 1998. [Google Scholar]
  7. Motozuka, S.; Tagaya, M.; Ikoma, T.; Yoshioka, T.; Xu, Z.; Tanaka, J. Preparation of copper-graphite composite particles by milling process. J. Compos. Mater. 2012, 46, 2829–2834. [Google Scholar] [CrossRef]
  8. Donnini, R. Metal Matrix Composites: Structure and Technologies: Advanced Investigations About High Performance Materials and Their Microchemical, Mechanical and Machining Properties/Monograph; VDM Verlag: Riga, Latvia, 2009; ISBN 9783639169287. [Google Scholar]
  9. German, R.M. Powder Metallurgy and Particulate Materials Processing: The Processes, Materials, Products, Properties and Applications; Metal Powder Industries Federation, Ed.; Princeton University: Princeton, NJ, USA, 2005; ISBN 0976205718. [Google Scholar]
  10. Hammes, G.; Schroeder, R.; Binder, C.; Klein, A.N.; De Mello, J.D.B. Effect of double pressing/double sintering on the sliding wear of self-lubricating sintered composites. Tribol. Int. 2014, 70, 119–127. [Google Scholar] [CrossRef]
  11. Rahimi Pouyani, M.; Rajabi, M. Microwave-assisted synthesis of Cu–ZrB2 MM Nano-composite using double pressing double sintering method. J. Mater. Sci. Mater. Electron. 2019, 30, 266–276. [Google Scholar] [CrossRef]
  12. Wartenberg, A.; Schade, C. Double Press Double Sinter Alternatives for High Density Applications. Adv. Powder Metall. Part. Mater. 2018, 266–275. [Google Scholar]
  13. Wang, Y.; Gao, Y.; Li, Y.; Zhang, C.; Huang, X.; Zhai, W. Effect of milling time on microstructure and mechanical properties of Cu–Ni–graphite composites. Mater. Res. Express 2017, 4, 096506. [Google Scholar] [CrossRef]
  14. Wang, Q.; Chen, M.; Shan, Z.; Sui, C.; Zhang, L.; Zhu, S.; Wang, F. Comparative study of mechanical and wear behavior of Cu/WS 2 composites fabricated by spark plasma sintering and hot pressing. J. Mater. Sci. Technol. 2017, 33, 1416–1423. [Google Scholar] [CrossRef]
  15. Zhou, J.; Ma, C.; Kang, X.; Zhang, L.; Liu, X. Effect of WS2 particle size on mechanical properties and tribological behaviors of Cu-WS2 composites sintered by SPS. Trans. Nonferr. Met. Soc. China 2018, 28, 1176–1185. [Google Scholar] [CrossRef]
  16. Lin, J.W.; Chang, H.C. Measurement of Friction Surface and Wear Rate between a Carbon Graphite Brush and a Copper Ring. Tribol. Trans. 2011, 54, 887–894. [Google Scholar] [CrossRef]
  17. Freschi, M.; Di Virgilio, M.; Zanardi, G.; Mariani, M.; Lecis, N.; Dotelli, G. Employment of Micro- and Nano-WS2 structures to enhance the tribological properties of copper matrix composites. Lubricants 2021, 9, 53. [Google Scholar] [CrossRef]
  18. Freschi, M.; Arrigoni, A.; Haiko, O.; Andena, L.; Kömi, J.; Castiglioni, C.; Dotelli, G. Physico-Mechanical Properties of Metal Matrix Self-Lubricating Composites Reinforced with Traditional and Nanometric Particles. Lubricants 2022, 10, 35. [Google Scholar] [CrossRef]
  19. Furlan, K.P.; de Mello, J.D.B.; Klein, A.N. Self-lubricating composites containing MoS2: A review. Tribol. Int. 2018, 120, 280–298. [Google Scholar] [CrossRef]
  20. Liu, Q.; Castillo-Rodríguez, M.; Galisteo, A.J.; de Villoria, R.G.; Torralba, J.M. Wear Behavior of Copper–Graphite Composites Processed by Field-Assisted Hot Pressing. J. Compos. Sci. 2019, 3, 29. [Google Scholar] [CrossRef]
  21. Freschi, M.; Di Virgilio, M.; Haiko, O.; Mariani, M.; Andena, L.; Lecis, N.; Kömi, J.; Dotelli, G. Investigation of second phase concentration effects on tribological and electrical properties of Cu–WS2 composites. Tribol. Int. 2022, 166, 107357. [Google Scholar] [CrossRef]
  22. Cao, H.; Qian, Z.; Zhang, L.; Xiao, J.; Zhou, K. Tribological Behavior of Cu Matrix Composites Containing Graphite and Tungsten Disulfide. Tribol. Trans. 2014, 57, 1037–1043. [Google Scholar] [CrossRef]
  23. Archard, J.F.; Hirst, W. The wear of metals under unlubricated conditions. Proc. R. Soc. London. Ser. A Math. Phys. Sci. 1956, 236, 397–410. [Google Scholar] [CrossRef]
  24. Archard, J.F. Contact, and rubbing of flat surfaces. J. Appl. Phys. 1953, 24, 981–988. [Google Scholar] [CrossRef]
  25. Kayaba, T.; Hokkirigawa, K.; Kato, K. Analysis of the abrasive wear mechanism by successive observations of wear processes in a scanning electron microscope. Wear 1986, 110, 419–430. [Google Scholar] [CrossRef]
  26. Chapter 5 Grooving Wear. In Tribology Series; Zum Gahr, K.-H. (Ed.) Elsevier: Amsterdam, The Netherlands, 1987; Volume 10, pp. 132–350. [Google Scholar]
Figure 1. Electrical resistance measurement and main geometrical parameters.
Lubricants 11 00066 g001
Figure 2. XRD patterns of the samples sintered at different temperatures, double-pressed or double-pressed and double-sintered.
Lubricants 11 00066 g002
Figure 3. Absolute density of the samples sintered at different temperatures, double-pressed or double-pressed and double-sintered.
Lubricants 11 00066 g003
Figure 4. Electrical resistivity of the samples sintered at different temperatures, double-pressed (P) or double-pressed and sintered (PS).
Lubricants 11 00066 g004
Figure 5. Static optical contact angle measurements of the samples sintered at different temperatures, double-pressed (P) or double-pressed and sintered (PS).
Lubricants 11 00066 g005
Figure 6. Water drops on the samples sintered at different temperatures, double-pressed or double-pressed and double-sintered, recorded during the static optical contact angle measurement.
Lubricants 11 00066 g006
Figure 7. Micro-indentation hardness of the samples sintered at different temperatures, double-pressed or double-pressed and double-sintered.
Lubricants 11 00066 g007
Figure 8. Friction coefficient as a function of the distance measured during the wear test for the samples sintered at different temperatures, double-pressed (P) or double-pressed and sintered (PS).
Lubricants 11 00066 g008
Figure 9. Friction coefficient as a function of the distance measured during the wear test for the samples sintered at different temperatures.
Lubricants 11 00066 g009
Figure 10. Optical microscopy images of wear tracks of the samples (A1) 6–5550 at 25× and (A2) at 50×, (B1) 6–5700 at 25× and (B2) at 50×, and (C1) 6–5800 at 25× and (C2) at 50×.
Lubricants 11 00066 g010
Figure 11. Friction coefficient curves as a function of the sliding distance evaluating the second pressing treatment.
Lubricants 11 00066 g011
Figure 12. Optical microscopy images of wear tracks of the samples (A1) P(6–5) at 25× and (A2) at 50×, (B1) P(6–15) at 25× and (B2) at 50×, (C1) P(8–5) at 25× and (C2) at 50×, and (D1) P(8–15) at 25× and (D2) at 50×.
Lubricants 11 00066 g012
Figure 13. Friction coefficient curves as a function of the sliding distance evaluating the second pressing and second sintering treatment.
Lubricants 11 00066 g013
Figure 14. Optical microscopy images of wear tracks of the samples (A1) PS(6–5) at 25× and (A2) at 50×, (B1) PS(6–15) at 25× and (B2) at 50×, (C1) PS(8–5) at 25× and (C2) at 50×, and (D1) PS(8–15) at 25× and (D2) at 50×.
Lubricants 11 00066 g014
Figure 15. SEM images of the worn surface of the samples (A1) 6–5550 at 400× and (A2) at 1500×, (B1) 6–5(800) at 400× and (B2) at 1500×, (C1) P(8–15) at 400× and (C2) at 1500×, and (D1) PS(8–15) at 400× and (D2) at 1500×; sliding direction (white arrow) and main damage (orange arrows) are reported.
Lubricants 11 00066 g015
Figure 16. SEM cross-section analysis of the pure copper and Cu (grey)–WS2 (white) composite samples after the wear test.
Lubricants 11 00066 g016
Figure 17. Examples of wear track cross sections of the samples sintered at different temperatures, double pressed or double pressed and sintered.
Lubricants 11 00066 g017
Figure 18. Optical microscopy and confocal laser scanning microscopy of a portion of the wear track of the samples sintered at different temperatures, double-pressed or double-pressed and sintered.
Lubricants 11 00066 g018
Figure 19. (A) Wear coefficient and specific wear rate and (B) wear volumetric loss, evaluated by confocal laser scanning microscopy of the samples sintered at different temperatures, double-pressed (P) or double-pressed and sintered (PS).
Lubricants 11 00066 g019
Table 1. Set of analyzed samples and main production parameters.
SampleSintering
Temperature (°C)
Pressing Load (ton)Pressing Time (min)Additional Pressing Load (ton)Additional Pressing Time (min)Additional
Sintering
Temperature (°C)
6–555055065---
6–570070065---
6–580080065---
P(6–5)5506565-
P(6–15)55065615-
P(8–5)5506585-
P(8–15)55065815-
PS(6–5)5506565550
PS(6–15)55065615550
PS(8–5)5506585550
PS(8–15)55065815550
Table 2. Results of EDS analysis within the wear track.
SampleElement
Cu (at%)S (at%)W (at%)O (at%)Fe (at%)
6–555055.302.871.246.1834.41
6–580049.322.341.059.0738.22
P(8–15)59.843.981.513.7530.92
PS(8–15)55.152.651.446.434.36
Disclaimer/Publisher’s Note: The statements, opinions and data contained in all publications are solely those of the individual author(s) and contributor(s) and not of MDPI and/or the editor(s). MDPI and/or the editor(s) disclaim responsibility for any injury to people or property resulting from any ideas, methods, instructions or products referred to in the content.

