Article

Extensive Stability Assessment of TiO2/Polyvinyl Ether Nanolubricant with Physical Homogenization

by
Mohd Farid Ismail
1,
Wan Hamzah Azmi
1,2,*,
Rizalman Mamat
1,2,
Korada Viswanatha Sharma
3 and
Hafiz Muhammad Ali
4,5,*
1
Faculty of Mechanical and Automotive Engineering Technology, Universiti Malaysia Pahang, Pekan 26600, Pahang, Malaysia
2
Centre for Research in Advanced Fluid and Processes, Lebuhraya Tun Razak, Gambang, Kuantan 26300, Pahang, Malaysia
3
Centre for Energy Studies, Department of Mechanical Engineering, JNTUH College of Engineering Kukatpally, Hyderabad 500085, India
4
Mechanical Engineering Department, King Fahd University of Petroleum and Minerals, Dhahran 31261, Saudi Arabia
5
Interdisciplinary Research Center for Renewable Energy and Power Systems (IRC-REPS), King Fahd University of Petroleum and Minerals, Dhahran 31261, Saudi Arabia
*
Authors to whom correspondence should be addressed.
Lubricants 2023, 11(2), 67; https://doi.org/10.3390/lubricants11020067
Submission received: 29 November 2022 / Revised: 2 February 2023 / Accepted: 6 February 2023 / Published: 8 February 2023
(This article belongs to the Special Issue Nanolubrication and Superlubrication)

Abstract

:
Proper preparation and stability evaluation of the nanolubricant shall be established when applying the nanoparticle dispersion technique in a two-phase system. The stability of the nanolubricant ensures the maximum benefit gained from the dispersion of nanoparticles in specified Polyvinyl ether (PVE). In this study, TiO2/PVE nanolubricant was prepared using two methods of physical homogenization: high-speed homogenizer (HSH) and ultrasonication bath. The HSH used a preparation time of up to 300 s in the stability assessment. Meanwhile, the ultrasonication bath had a preparation time of 1, 3, 5, and 7 h. The stability condition of the nanolubricant was evaluated using photo capturing, ultraviolet-visible (UV-Vis) spectrophotometer, zeta potential, and zeta sizer. A sample with 180 s of preparation time shows the best stability condition from HSH. The nanolubricant with ultrasonication offers excellent stability at 5 h of homogenizing time with a concentration ratio of more than 90% for up to 30 days of observation. In conclusion, ultrasonication homogenizing methods show better results than HSH with a zeta potential of more than 60 mV. In addition, HSH can be recommended as an optional method to produce nanolubricant with a low preparation time for immediate use.

1. Introduction

Nanofluid is an innovative material that made heat transfer technology leap to a new level. The suspension of solid particles less than 100 nm in a base fluid had engineered nanofluid as a new solid–liquid composite material for various applications, including nanolubricants, nanorefrigerants, and nanocoolants [1]. The nanofluid can improve thermo-physical and tribological properties and enhance the performance and efficiency of appliances. Nanoparticle dispersion techniques have been used in many applications, including two-phase systems. Initially, this method was explored by Masuda et al. [2] and Choi and Eastman [3]. The dispersion of nanoparticles into a base fluid significantly alters the effective properties of the novel solution called nanofluid.
For a two-phase system, nanoparticle dispersion studies can be categorized into three research avenues [4]. The first approach can be named nanorefrigerant. The nanoparticle was suspended in a pure base refrigerant where the refrigerant was in liquid form at ambient conditions [5]. It is a challenge for this approach to disperse nanoparticles in refrigerants under gas-phase conditions with low boiling temperatures relative to ambient. The second approach is to disperse nanoparticles in a base lubricant of an engineering system such as a compressor in residential air conditioning (RAC) [6]. Commonly called nanolubricant, this method appeared preferable among researchers as lubricants usually have high boiling temperatures, and the dispersion process can be performed at room temperature. A combination of both approaches can be categorized as the third method, where dispersion nanoparticles in pure refrigerant and lubricant enhance the performance of the refrigeration systems in the two-phase flow phenomena [7]. In extension of the third approach, a performance study on the vapor compression refrigeration system (VCRS) using oil lubrication and refrigerant plus a nanoparticle mixture widened the research area and positively impacted the energy efficiency research path [8,9].
In nanolubricant studies, stability is one of the crucial issues to be addressed. The nanolubricant performance strongly depends on the stability of the suspended nanoparticle in the lubricant. The primary purpose of stability investigation is to lengthen the dispersion of nanoparticles in a base fluid without agglomeration. Bi et al. [10] reported that the settlement and clogging of nanoparticles might reduce the potential of the heat transfer enhancement, thus defeating the technique’s purpose. Proneness to agglomeration may become a factor in destabilizing nanolubricant, leading to loss of the ability to transfer heat [11]. A stable mixture ensures the actual properties of nanolubricant and shows the correct performance of the evaluation result. A stable nanolubricant can maximize its potential to increase the system’s performance of the nanolubricant being applied. Sezer et al. [12] reported that the nanoparticle agglomeration and settlement might reduce the potential of the heat transfer enhancement, thus defeating the technique’s purpose. The Stokes equation expresses the theory behind the settlement of agglomeration as in Equation (1):
ν s = 2 R n 9 μ ρ n ρ l g
where ν s is the sedimentation speed of a particle; R n is the radius of a particle; µ is the dynamic viscosity; ρ n and ρ l are the density of the particle and density of the liquid, respectively; and g is the gravitational acceleration. Equation (1) informed us that the sedimentation speed is proportional to the square of the nanoparticle radius but inversely proportional to the fluid’s dynamic viscosity. Therefore, some actions can be taken to slow down the speed of nanoparticle sedimentation: reducing R n by using smaller particles; increasing µ, which is the viscosity of the base fluid; and reducing the density differences between the nanoparticle and the base fluid.
All three actions clearly show that by simply reducing the particle size, the sedimentation time can be prolonged by double. According to the colloid chemistry theory, when the particle agglomeration size decreases to a critical size, no sedimentation will take place [13]. In this condition, the nanoparticles are in Brownian motion. However, when the particle is smaller, it has higher surface-to-volume ratio energy. The increase in surface-to-volume ratio energy increased the possibility of nanoparticle aggregation [14]. Thus, the stable nanofluid preparation strongly links up with applying smaller nanoparticles to prevent the aggregation process concurrently.
The preparation method is critical to ensure the sample of nanolubricant is in stable condition. A wrong technique may cause agglomeration on nanoparticles, thus decreasing the total surface area and speeding up the particle settlement time. As deliberated by Khan and Valan Arasu [15], the stability of nanofluid has a strong relationship with other parameters such as sonication method, sonication period, surfactant, surface discharge, pH, and average particle size. Meanwhile, all these parameters were determined by the nanoparticle dispersion technique. Several dispersing techniques were introduced in the literature: ultrasonic agitation, homogenizing, high shear mixing, and magnetic force agitation [16,17]. Different types of equipment include ultrasonic homogenizers, bath sonicators, probe sonicators, or any other mechanical homogenizer such as high-speed homogenizer (HSH), disc mill, or three roller mills. The determination of the nanofluid stability is with the use of evaluation techniques such as zeta potential, transmission electron microscopy (TEM), scanning electron microscopy (SEM), light scattering, three omega, ultraviolet-visible (UV-Vis) spectrophotometer, and sediment photograph capturing [18,19]. The sedimentation of nanoparticles can be identified by analyzing the variation of data over time.
Nanolubricant preparation and stability evaluation has been performed previously by several researchers. For instance, Sharif et al. [20] dispersed Al2O3 nanoparticles in Polyalkylene glycol (PAG) lubricant to evaluate the thermo-physical properties. Later, Redhwan et al. [21] compared the thermo-physical properties of Al2O3/PAG and SiO2/PAG nanolubricants that are possibly being applied in automotive air conditioning systems. Before their investigation, nanolubricant stability was evaluated using a photo-capturing method and UV-Vis spectrophotometer. Further, Zawawi et al. [22] prepared Al2O3-SiO2 composite nanolubricant in the PAG-based lubricant. They investigated the stability condition and measured the thermo-physical properties of the composite nanolubricants. A sonication bath was used during the preparation of the nanolubricant. They concluded that two hours of ultrasonic homogenizing process produces stable nanolubricants for up to 30 days. Gill et al. [23] evaluated the stability of nanolubricants for TiO2 nanoparticles in mineral oil (MO) before setting up for a performance test in VCRS. The preparation took about 10 h of magnetic stirring and 15 h of ultrasonication process using an ultrasonic vibrator.
The present TiO2/PVE nanolubricant is prepared for application in vapor compression refrigeration systems. TiO2 nanoparticles have been extensively used for tribological coatings to control friction, wetting, wear, and antibacterial properties [24]. The surface and wetting properties of TiO2 nanoparticles were investigated by various researchers [25,26,27]. Lanka et al. [24] studied the wetting properties and tribological ability of TiO2 coating for ceramics. Further, the TiO2 nanoparticle was among the preferred materials for application in the refrigeration system. However, the preparation method and time become a challenge to researchers preparing stable TiO2 nanolubricants for their dedicated applications [28]. Additionally, for a relatively new lubricant such as Polyvinyl ether (PVE), its nanolubricant preparation and stability evaluation have not been reported yet. The PVE lubricant has better dielectric resistivity, lubricity, and miscibility. Therefore, in the present study, an extensive stability assessment was undertaken for TiO2/PVE nanolubricant by adopting two preparation methods: high-speed homogenizer (HSH) and ultrasonication bath. This paper will compare the stability of TiO2/PVE nanolubricant using two different approaches to identify the best preparation technique and each technique’s optimum parameters.

2. Materials and Methods

This section will discuss the experimental works in detail. The section is divided into two sub-sections (1) the preparation of TiO2/PVE nanolubricant by using two different methods, namely high-speed homogenizer and ultrasonication bath; and (2) the evaluation of nanolubricant stability qualitatively and quantitatively by using photo capturing visual sedimentation, UV-Vis spectrophotometer, zeta potential, and zeta sizer.

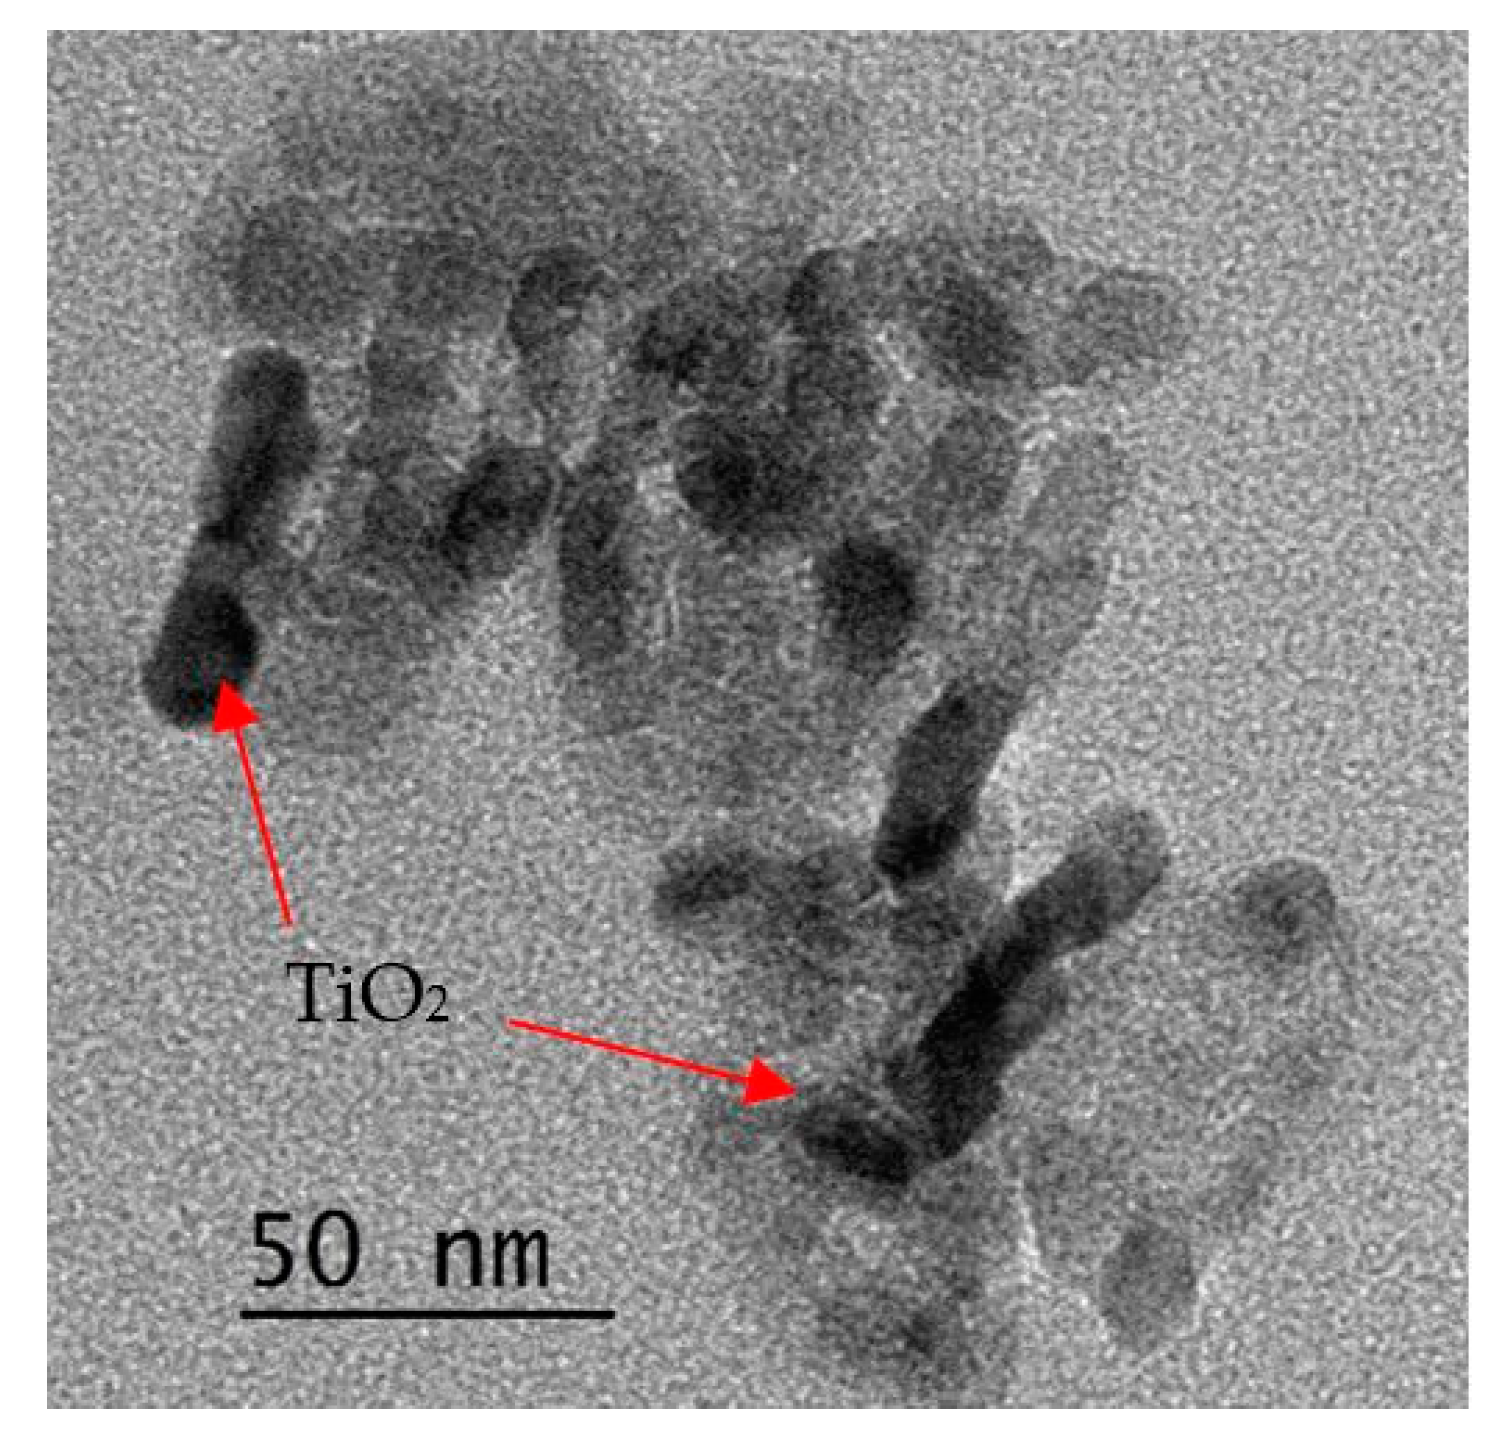
2.1. Material Properties and Preparation

The present study used a two-step method to prepare the nanolubricant using TiO2 nanoparticles dispersed in FVC68D synthetic oil from the polyvinyl ether (PVE) group as a base lubricant. The procurement of PVE lubricant was obtained from Idemitsu Kosan Co., Ltd., Tokyo, Japan. The properties of PVE lubricant are provided in Table 1 [29]. Meanwhile, TiO2 nanoparticles were procured from HWNANO (Hongwu International Group Ltd., Guangzhou, China) with an average particle size of 50 nm and 99.9% purity. Table 2 presents the material properties of TiO2 nanoparticles. The nanoparticle was characterized by the imaging technique of transmission electron microscopy (TEM). The imaging technique was conducted to verify the size of nanoparticles and the dispersion and stability condition of the TiO2/PVE nanolubricant. The TEM image of TiO2/PVE nanolubricant is presented in Figure 1 with a magnification of 88,000. The TiO2 nanoparticles were dispersed in the PVE lubricant and visualized in Figure 1. The TiO2 nanoparticles in Figure 1 are distributed well in PVE lubricants despite a small agglomeration in the solution. The TiO2 nanoparticles were measured between 30 and 50 nm, which agrees well with the manufacturer’s specifications. No homoagglomeration appeared in the image, proving that the nanolubricants were stable.
The volume concentration of TiO2/PVE nanolubricant was determined using Equation (2). The subscripts of n and l represent nanoparticles and PVE lubricants, respectively. The nanolubricant preparation was started by measuring the mass of TiO2 nanoparticles. An electronic balance with 0.0001 g accuracy was used for this purpose.
ϕ = m n ρ n m n ρ n + m l ρ l × 100 %
where ϕ is the volume concentration in percent; m n and m l are the masses of the nanoparticles and lubricant, respectively; and ρ n and ρ l are the density of the nanoparticles and density of lubricant, respectively. Next, 100 mL PVE lubricant was measured by using a measuring cylinder. The lubricant then was poured into a 150 mL beaker for the magnetic stirring process. The mixing process was performed by using a hot plate magnetic stirrer. The stirring process was undertaken under the ambient condition without heat supplied to the samples. The nanoparticles were added imperceptibly into the liquids to avoid agglomeration. The mechanical agitating process was undertaken for each sample of nanolubricant for up to 30 min at room temperature. After that, the process of homogenizing the lubricant and the nanoparticles took place.

2.2. Material Properties and Preparation

The present work applied two types of homogenization methods for nanoparticle dispersion. The HSH and ultrasonication techniques in the present study are categorized as a physical method because they do not use any surfactant or organic capping layers for stability improvement. It is because using a surfactant or any organic capping layers can significantly alter the properties of existing base PVE lubricants and harm the components of system applications such as residential air conditioning systems. The sample preparation without chemical substances is essential to avoid any complications to the engineering system. In this study, the TiO2/PVE nanolubricant is expected to be used in a vapor compression system. The present nanolubricant will be mixed with refrigerant in the system. Hence, modifying chemical properties such as pH or other surface alteration of lubricant for this system application is not an option. The HSH employed a stator–rotor system as a mechanical process to generate homogenous liquid. At the same time, the ultrasonication bath applied sound waves to create vibration and transmitted them through water to spread nanoparticles in smaller agglomeration sizes. The two types of dispersion techniques were recommended for the present nanolubricant preparation because of the short preparation time with excellent stability conditions.

2.2.1. High-Speed Homogenizer

The AD500S-H 18G Working Head high-speed homogenizer (HSH) by Worner Lab, Zhejiang, China was used to create homogenous nanolubricant samples. The machine can operate at a rotary speed between 2000 and 28,000 rpm and viscosity between 1000 and 7000 mPa·s. The nanolubricants were homogenized using this method with the variation of homogenizing time. The TiO2/PVE nanolubricant preparation with a homogenizing speed of more than 12,500 rpm was observed in better stability than lower speed. Therefore, the preparation of TiO2/PVE nanolubricant was tested at different HSH preparation times of up to 300 s and a constant homogenizing speed of 12,500 rpm.
Preparation of TiO2/PVE nanolubricant of 0.01% volume concentration one month after the first set of samples is made. The sample preparation with magnetic stirring without homogenizing is taken as a reference or baseline. The pressure and temperature were monitored to be maintained at room condition throughout the preparation. All samples were homogenized for 120 s before being poured into a 20 mL glass test tube for visual inspection and another 4.5 mL glass cuvette for UV-Vis spectrophotometer measurement. All samples were labeled accordingly, and the first measurement from the UV-Vis spectrophotometer was taken after the first hour of preparation time. Nine samples with 300 mL each were prepared and stirred using similar steps as in Section 2.1. One sample was prepared without homogenization using HSH as a reference, and the other eight samples were homogenized for 30 s intervals between 30 and 300 s at a constant speed of 12,500 rpm. Then, the samples were transferred into a 4.5 mL glass cuvette and a 20 mL glass test tube for stability evaluation, which will be discussed in the next section.

2.2.2. Ultrasonication Bath Homogenization

Compared to HSH homogenization, an ultrasonic bath breaks down the agglomeration to a smaller size. However, the duration of ultrasonication always becomes uncertain. The optimum time for the specified nanolubricant preparation is determined to avoid the severe problem of agglomeration and aggregation that results in faster sedimentation. The new sample of TiO2/PVE nanolubricant at 0.01% volume concentration was prepared as described in Section 2.1 and homogenized using an ultrasonic homogenizer. The samples were homogenized continuously with different sonication times from 1 to 7 h with an interval of two hours using ultrasonic bath vibrator model FB15051 by Fisherbrand. The vibrator generates ultrasonic pulses at 50 ± 3 khz for 230 V. A comparison of the final samples with the reference sample was made, which had not been subjected to ultrasonication. After preparation, the nanolubricant was poured into a 20 mL glass test tube and another 4.5 mL glass cuvette for stability evaluation. The samples were monitored for up to 30 days daily.

2.3. Stability Evaluation of Nanolubricant

The determination of nanofluid stability is undertaken using various methods, either qualitative or quantitative approaches. Four stability evaluations were considered in the present study: sedimentation photo capturing, UV-Vis spectrophotometer, zeta potential, and zeta sizer.

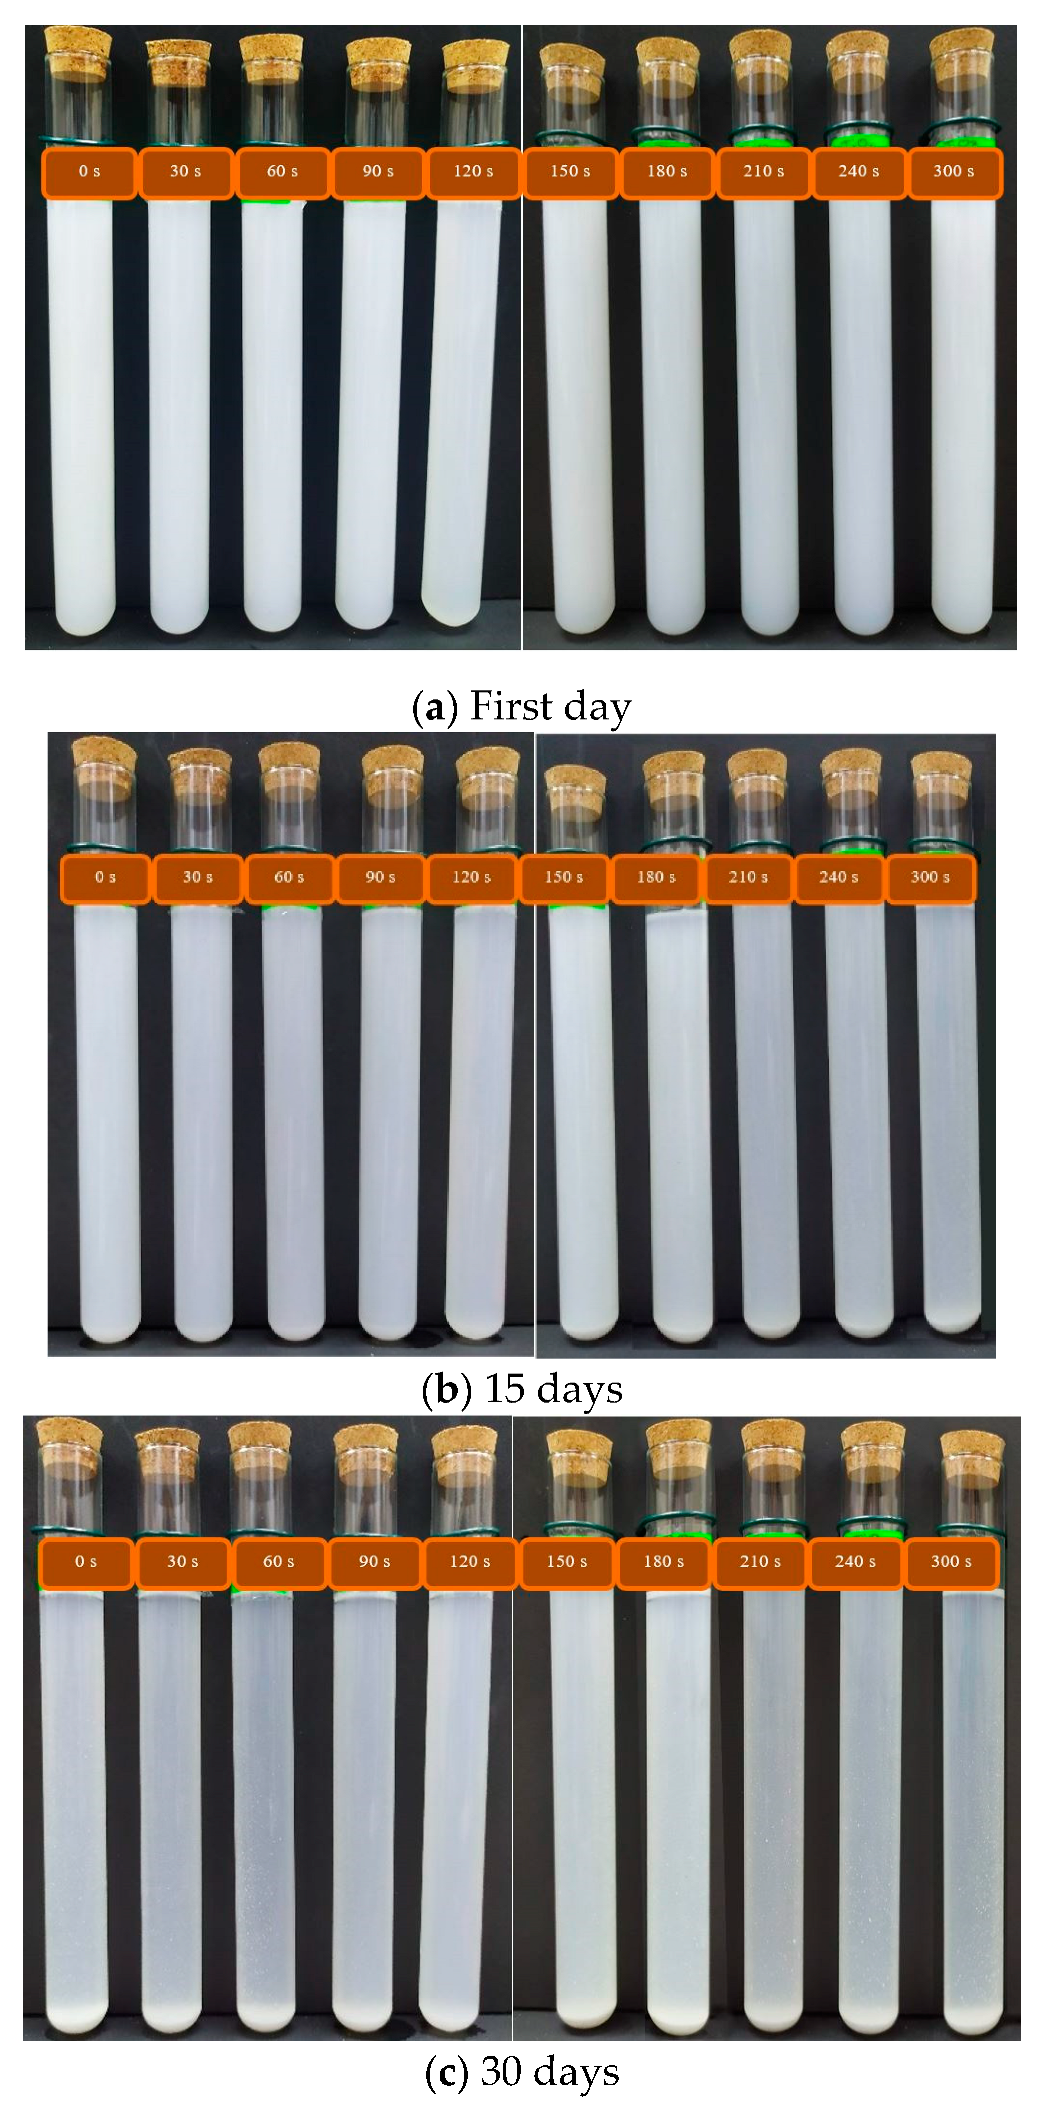
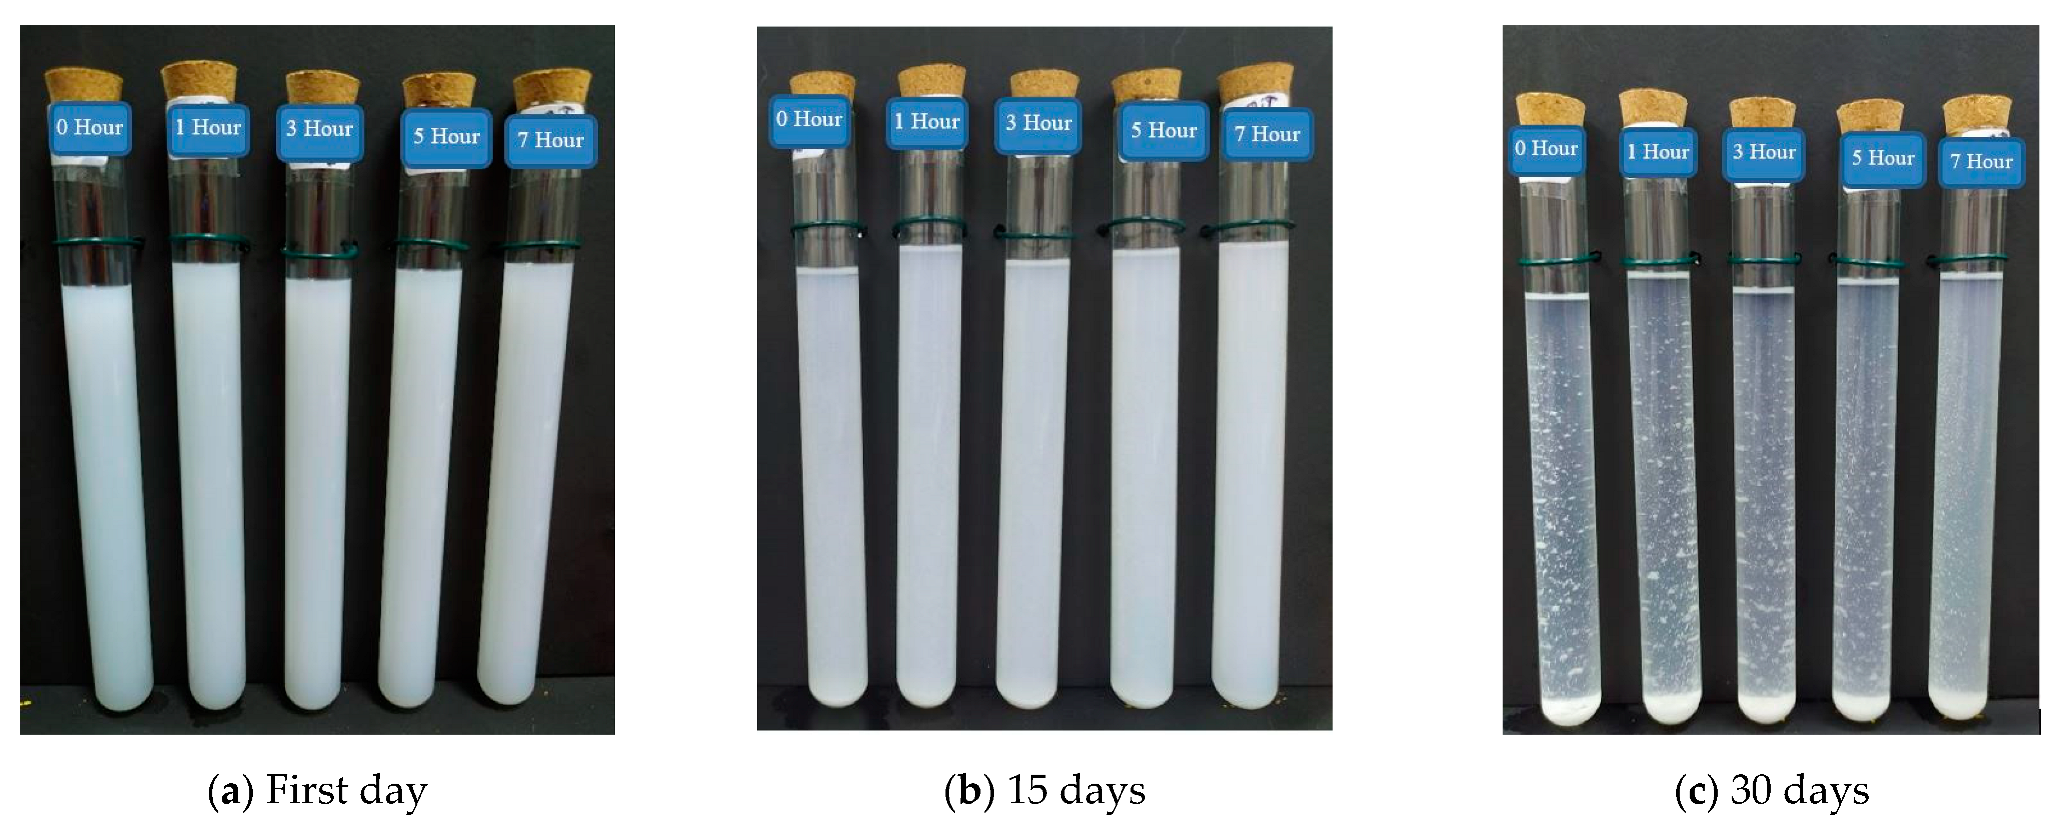
2.3.1. Photo Capturing

Photo capturing of the visual sedimentation method is the simplest and most used to assess the stability of nanolubricant. In this study, each sample was transferred into an exact-size test tube and labeled accordingly for identification. All test tubes were kept stagnant under control conditions and appropriately tied to avoid external movement. The background color of the test tube stand is in contrast with the sample for the best photo capture purpose. The samples were photographed on the first day and 15 days and 30 days after preparation. The stability of the nanolubricant was established by comparing the sample images over the sample color, the layer of nanoparticles, and the high of sedimentation. The use of photo capturing to evaluate the stability of a nanolubricant is classified under the qualitative approach because it does not provide any specified data.

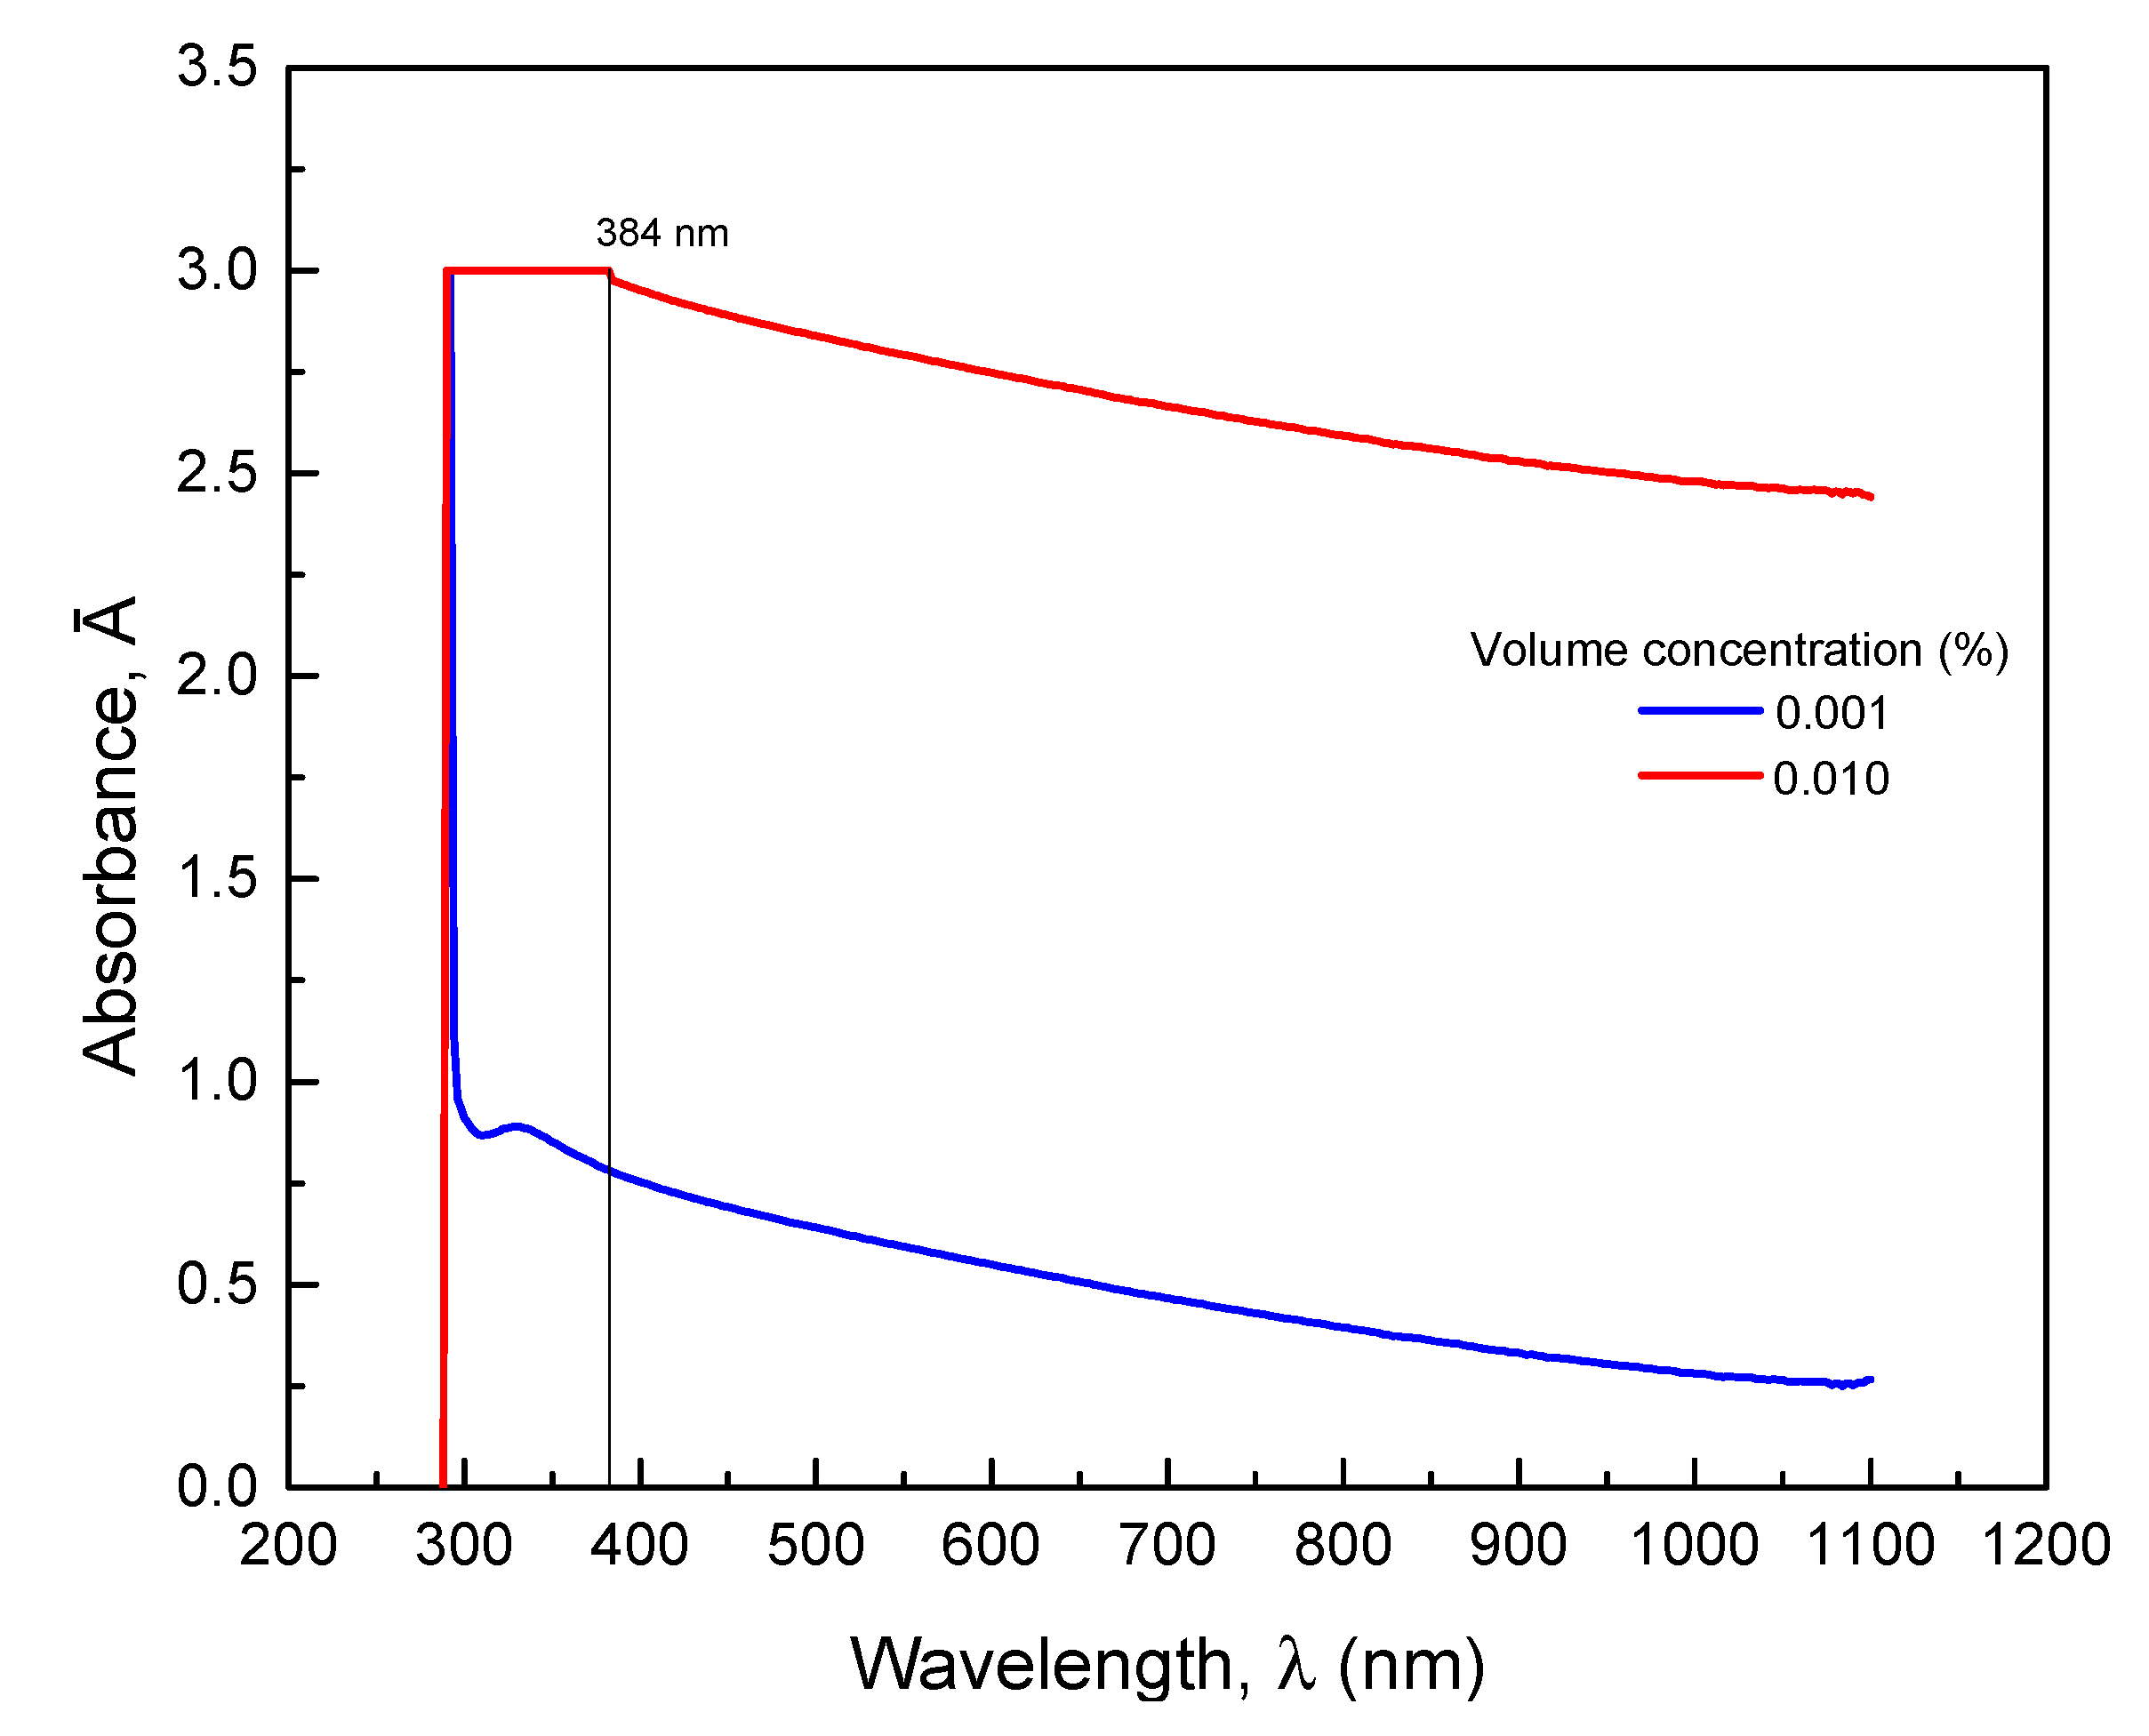
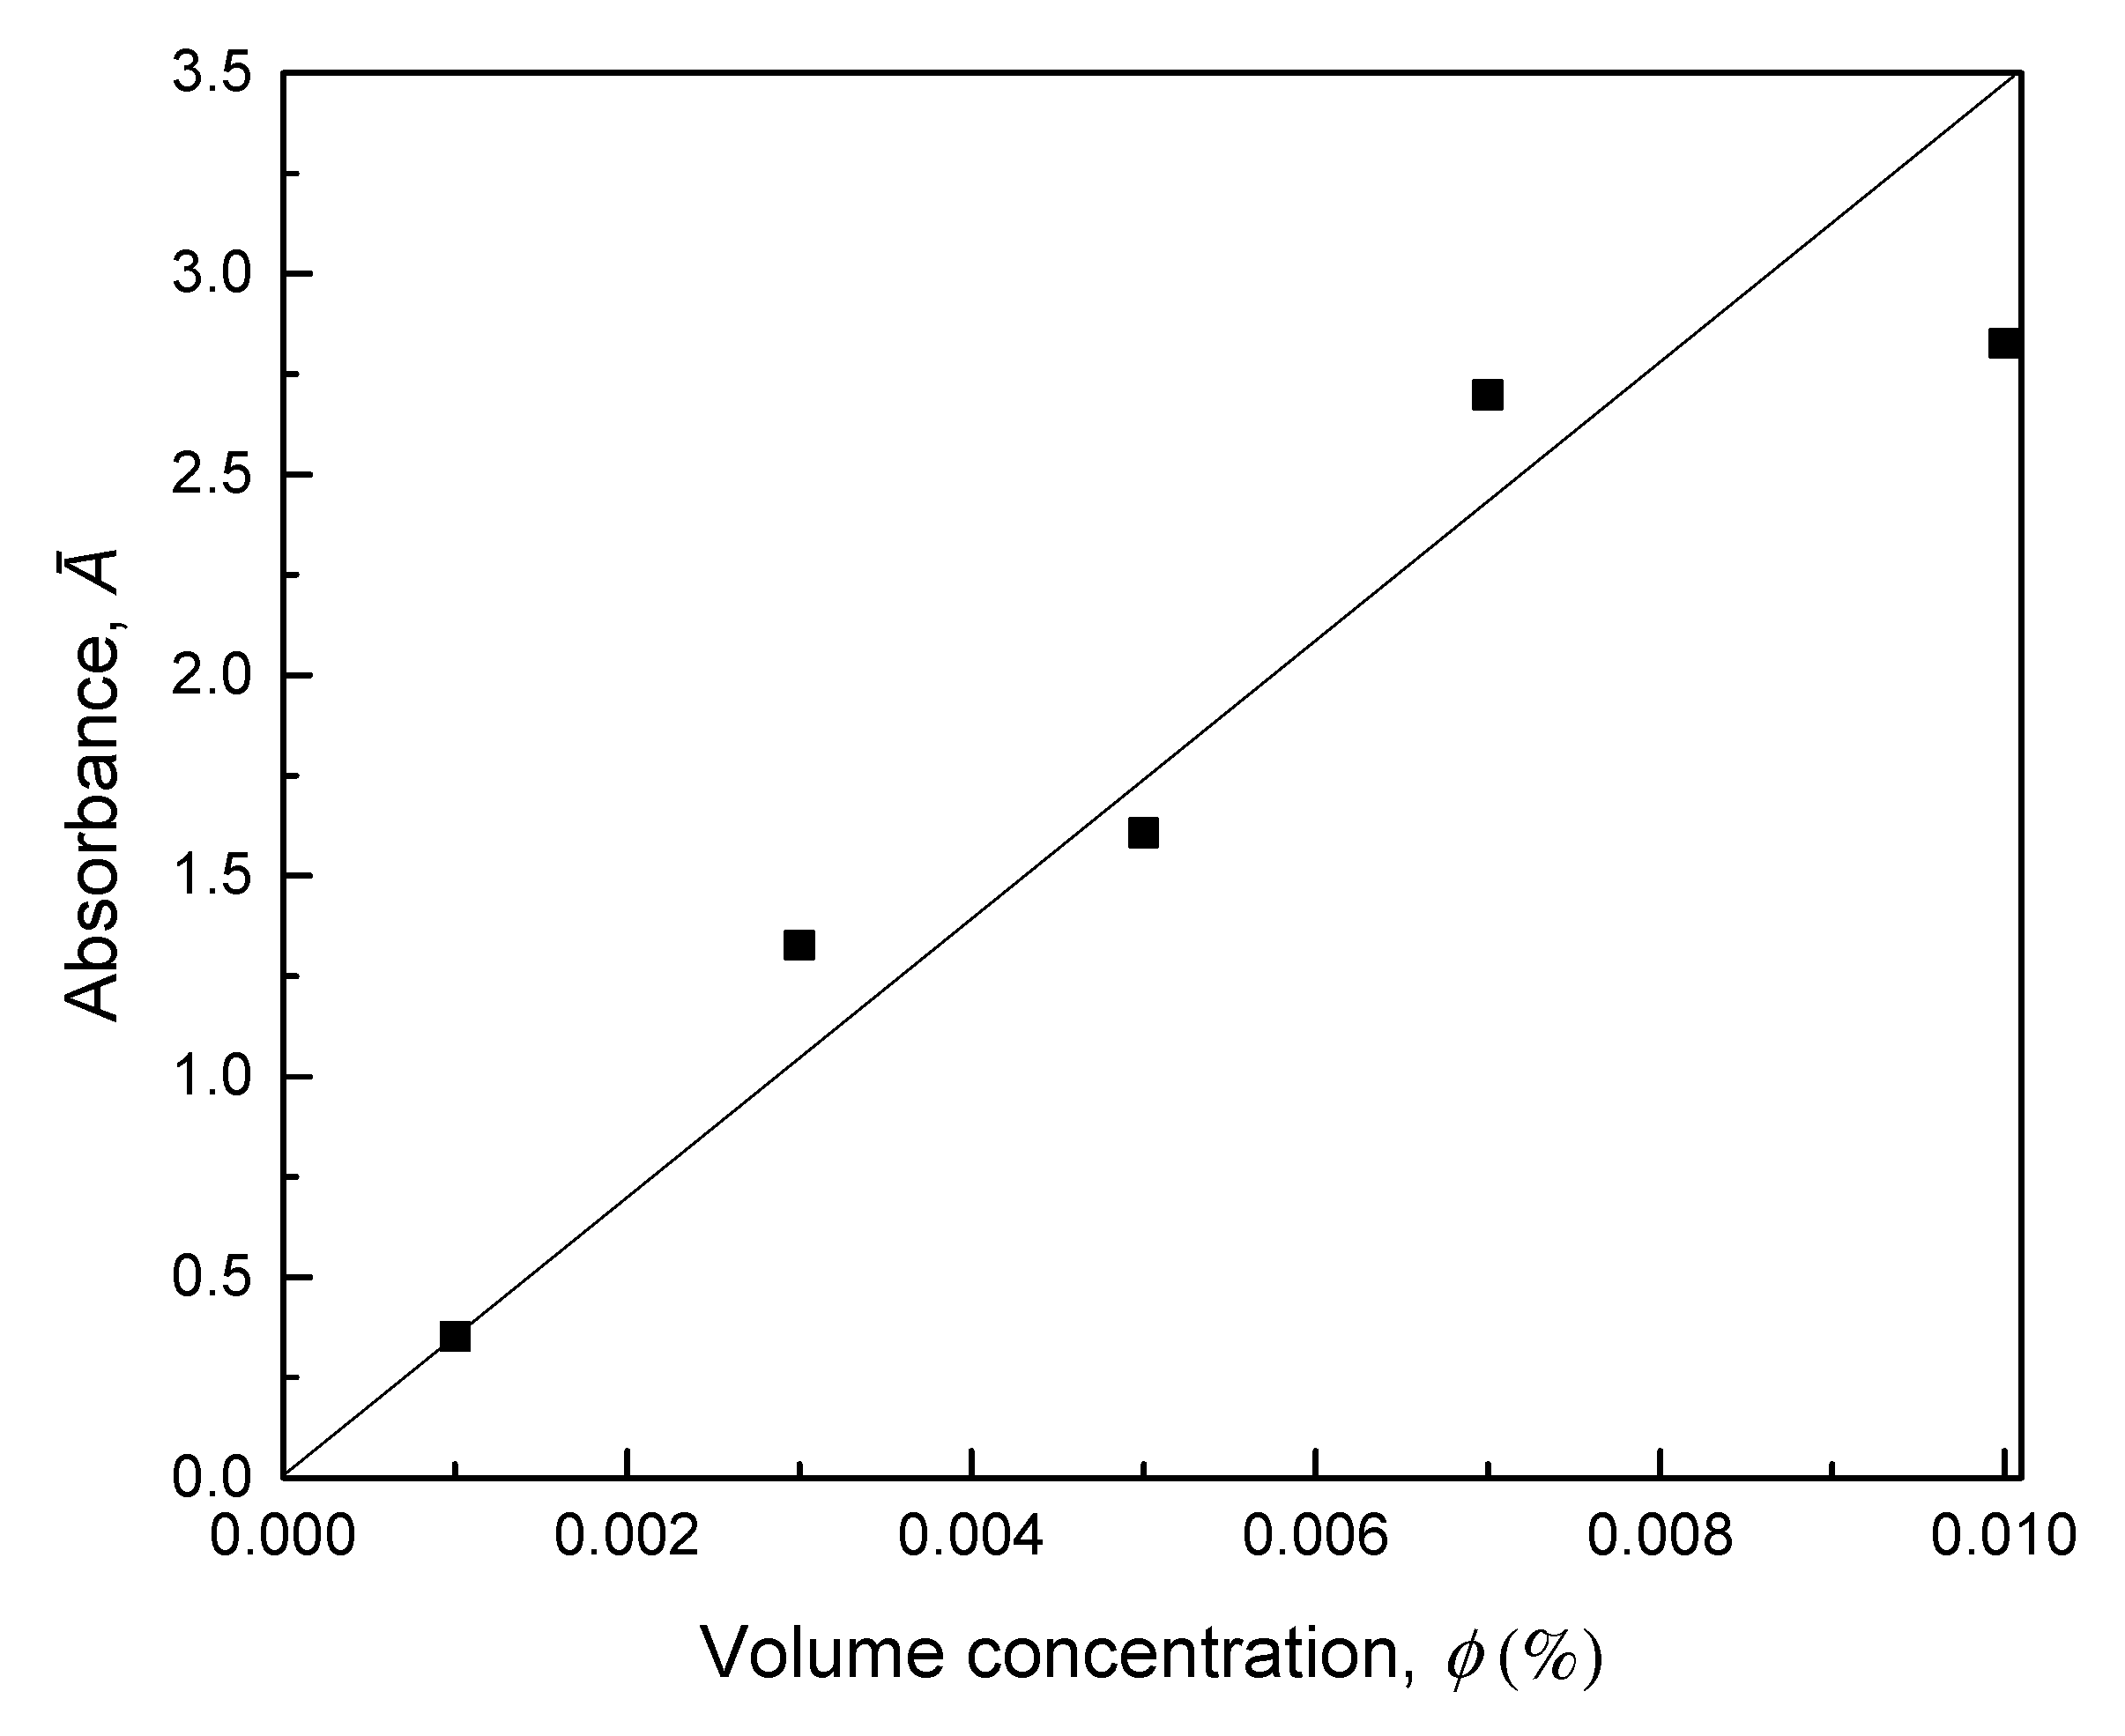
2.3.2. UV-Vis Spectrophotometer

In contrast with the photo-capturing method, a UV-Vis spectrophotometer was used to quantitatively evaluate the stability of TiO2/PVE nanolubricant. This method can quantitatively measure the colloidal stability of the dispersions by measuring the sample’s absorbance ratio between conditions before and after a specific period. The value obtained after ultraviolet radiation was given to the sample. The spectrophotometer from the Drawell, Chongqing, China (model: DU-8200) can measure the absorbance within the wavelength range from 290 to 1100 nm. It has four cuvette slots. The first slot is for pure lubricant, while the other three are for nanolubricant that can be measured simultaneously. Before the measurement, it is required to identify a constant light wavelength for a dedicated nanolubricant. The scanning process was performed for all wavelength ranges, and the wavelength was selected when it showed the highest absorbance. The measured absorbance for all samples was undertaken at a selected wavelength. The measured absorbance was recorded hourly for the first day and daily from the second day onwards. The absorbance was also compared with the first-day measurement to identify the daily concentration ratio or absorbance ratio of nanolubricant within 30 days.

2.3.3. Zeta Potential and Zeta Sizer

Zeta potential is another quantitative measurement for nanolubricant stability. In the present study, the stability evaluation using this method was conducted on the most stable sample for comparing different preparation methods. After the stability evaluations are undertaken in Section 2.3.1 and Section 2.3.2, the same sample of nanolubricant will be measured for zeta potential and zeta sizer. The zeta potential assesses the stability of nanolubricant with a different approach. A similar sample of TiO2/PVE nanolubricant was used for zeta potential and zeta sizer evaluation. The samples were prepared in a glass cell cuvette. In this measurement, 3 mL samples were taken from the previous 300 mL sample preparation in Section 2.1. A few characteristics, such as dielectric constant, viscosity, and reflective index, are required as input to the Malvern Zetasizer ZS for zeta potential analysis. The sample was in a control room at a constant temperature of 25 °C throughout the measurement. The measurement was repeated up to 3 times to ensure consistent data from the instrument.
The stability of the nanolubricant is further confirmed by comparing the present zeta potential measurement data with the standard range of zeta potential related to the stability conditions. According to Ghadimi et al. [18], zeta potential can be divided into five stability classifications. For zeta potential below 15 mV, nanolubricant can be classified under unstable condition. The zeta potentials from 15 to 30 mV and 30 to 45 mV are in limited and moderate stability, respectively. Good stability nanolubricant can be considered for the zeta potential between 45 to 60 mV. If the zeta potential is more than 60 mV, the nanolubricant is in excellent stability.

3. Results and Discussion

In this section, the results of stability evaluations with different physical homogenization methods will be presented. Photo capturing observation will show the visual quality of nanolubricant. A comparison will be made for every sample and different preparation methods. The results from UV-Vis spectrophotometer will be discussed quantitatively to evaluate the stability of the nanolubricant. In this subsection, the experimental results will be presented for different parameters and conditions. Finally, the zeta potential and zeta sizer will confirm the most stable sample with the best preparation method for TiO2/PVE nanolubricant.

3.1. Photo Capturing Observation

The nanolubricant stability was evaluated using the photo-capturing method for up to 30 days. Photo capturing was observed on the first day and 15 days and 30 days after nanolubricant preparation. As depicted in Figure 2, a similar visual comparison can be made regarding the sedimentation process of nanolubricant at different HSH preparation times for the first day and 15 days and 30 days after nanolubricant preparation. The visual observation for 30 s of HSH preparation leads to the fastest sedimentation rate in the 15 and 30 days, as shown in the figure. The nanolubricant samples with 120 to 300 s preparation time were observed with a reduction trend to sustain stability. The color of samples becomes more apparent by increasing the HSH preparation time above 120 s. In the present visual evaluation, the stability condition for sample preparation with HSH was compared with the sample without HSH and 0 s preparation time. The visual inspection for a sample at 0 s was found to be almost in a similar condition as the 90 s sample for observation for up to 30 days. The 60 s sample showed better stability conditions than the 30 s sample and was followed by a 90 s sample. The stability condition was improved gradually from the 90 s to 180 s samples. Further increase in the homogenization time after 180 s did not improve the samples’ stability but worsened it.
Figure 3 presents the visual observation of TiO2/PVE nanolubricant for ultrasonication bath preparation at different sonication times up to 7 h. The reference sample at 0 h was prepared without the homogenizing process. Figure 3b,c show the samples at 15 and 30 days after preparation. All samples on the 15 days do not display significant variation compared to the first-day samples. Only a limited amount of particle sedimentation appears at the bottom of the test tube. However, 30 days after preparation, the physical appearance of the samples changed significantly from the previous sample condition. The color of samples became more apparent in the test tube with visible particle sedimentation, and tiny white droplets appeared on the wall.
On the other hand, the sample for 7 h of sonication time behaved with the best stability by comparing the sample condition at different preparation times. The reference sample of nanolubricant experienced the most transparent color, followed by the 1 h sample, and gradually improved in stability with a sonication time of up to 7 h. All samples did not show any separation layer between nanoparticles and base PVE lubricant for up to 15 days of observation. Therefore, this condition confirmed a good dispersion of TiO2 nanoparticles in PVE lubricant, producing a stable nanolubricant for up to 15 days.

3.2. UV-Vis Spectrophotometer Evaluation

The sample for the TiO2/PVE nanolubricant in Section 3.1 also was evaluated using a UV-Vis spectrophotometer. Initially, the specific wavelength of absorbance measurement for the present nanolubricant was identified. The best wavelength was selected by measuring the absorbance of nanolubricant in a wide range of wavelengths. In this study, the UV-Vis spectrophotometer could measure sample absorbance for up to 3.000 with an ultraviolet visible wavelength range from 290 to 1100 nm. Therefore, the TiO2/PVE nanolubricant samples at volume concentrations from 0.001% to 0.01% were prepared for this stability analysis.
The absorbance variation of TiO2/PVE nanolubricants at different wavelengths is shown in Figure 4. The figure shows that the absorbance of 0.01% TiO2/PVE nanolubricants was more than 3.000 for a wavelength less than 384 nm. The present study cannot capture the peak absorbance due to the machine’s limitations, whereby the expected maximum absorbance is between 290 and 384 nm wavelengths. After the 384 nm wavelength, the absorbance decreased gradually, with the lowest absorbance of 2.441 at 1100 nm. Further, the TiO2/PVE nanolubricant at 0.001% volume concentration was evaluated to identify the wavelength with the maximum absorbance. The results show another peak of absorbance at 330 nm. At this 0.001% concentration, the absorbance for wavelengths more than 330 nm offers the same behavior as 0.01% concentration, decreasing gradually with increasing the wavelengths. Consequently, the absorbance measurement for subsequent TiO2/PVE nanolubricant stability analysis was fixed at 400 nm wavelengths and also was suggested by Ghadimi et al. [18]. The wavelength of 384 nm was not considered in the present study to avoid any absorbance value of more than 3.000. This condition generally happens in the first few hours of the stability analysis.
The nanolubricant was tested following the Beer–Lambert law. The law states that absorbance is increased linearly with the concentration of suspension under ideal conditions. Figure 5 illustrates the absorbance value of nanolubricant with volume concentration up to 0.01%. The results showed a linear relationship between absorbance, Ā and volume concentration, ϕ . The absorbance was increased linearly with the increasing volume concentration of the nanolubricant. The dispersion of nanoparticles in the lubricant prevents light from passing through, thus decreasing the amount of light arriving at the receiver [31].

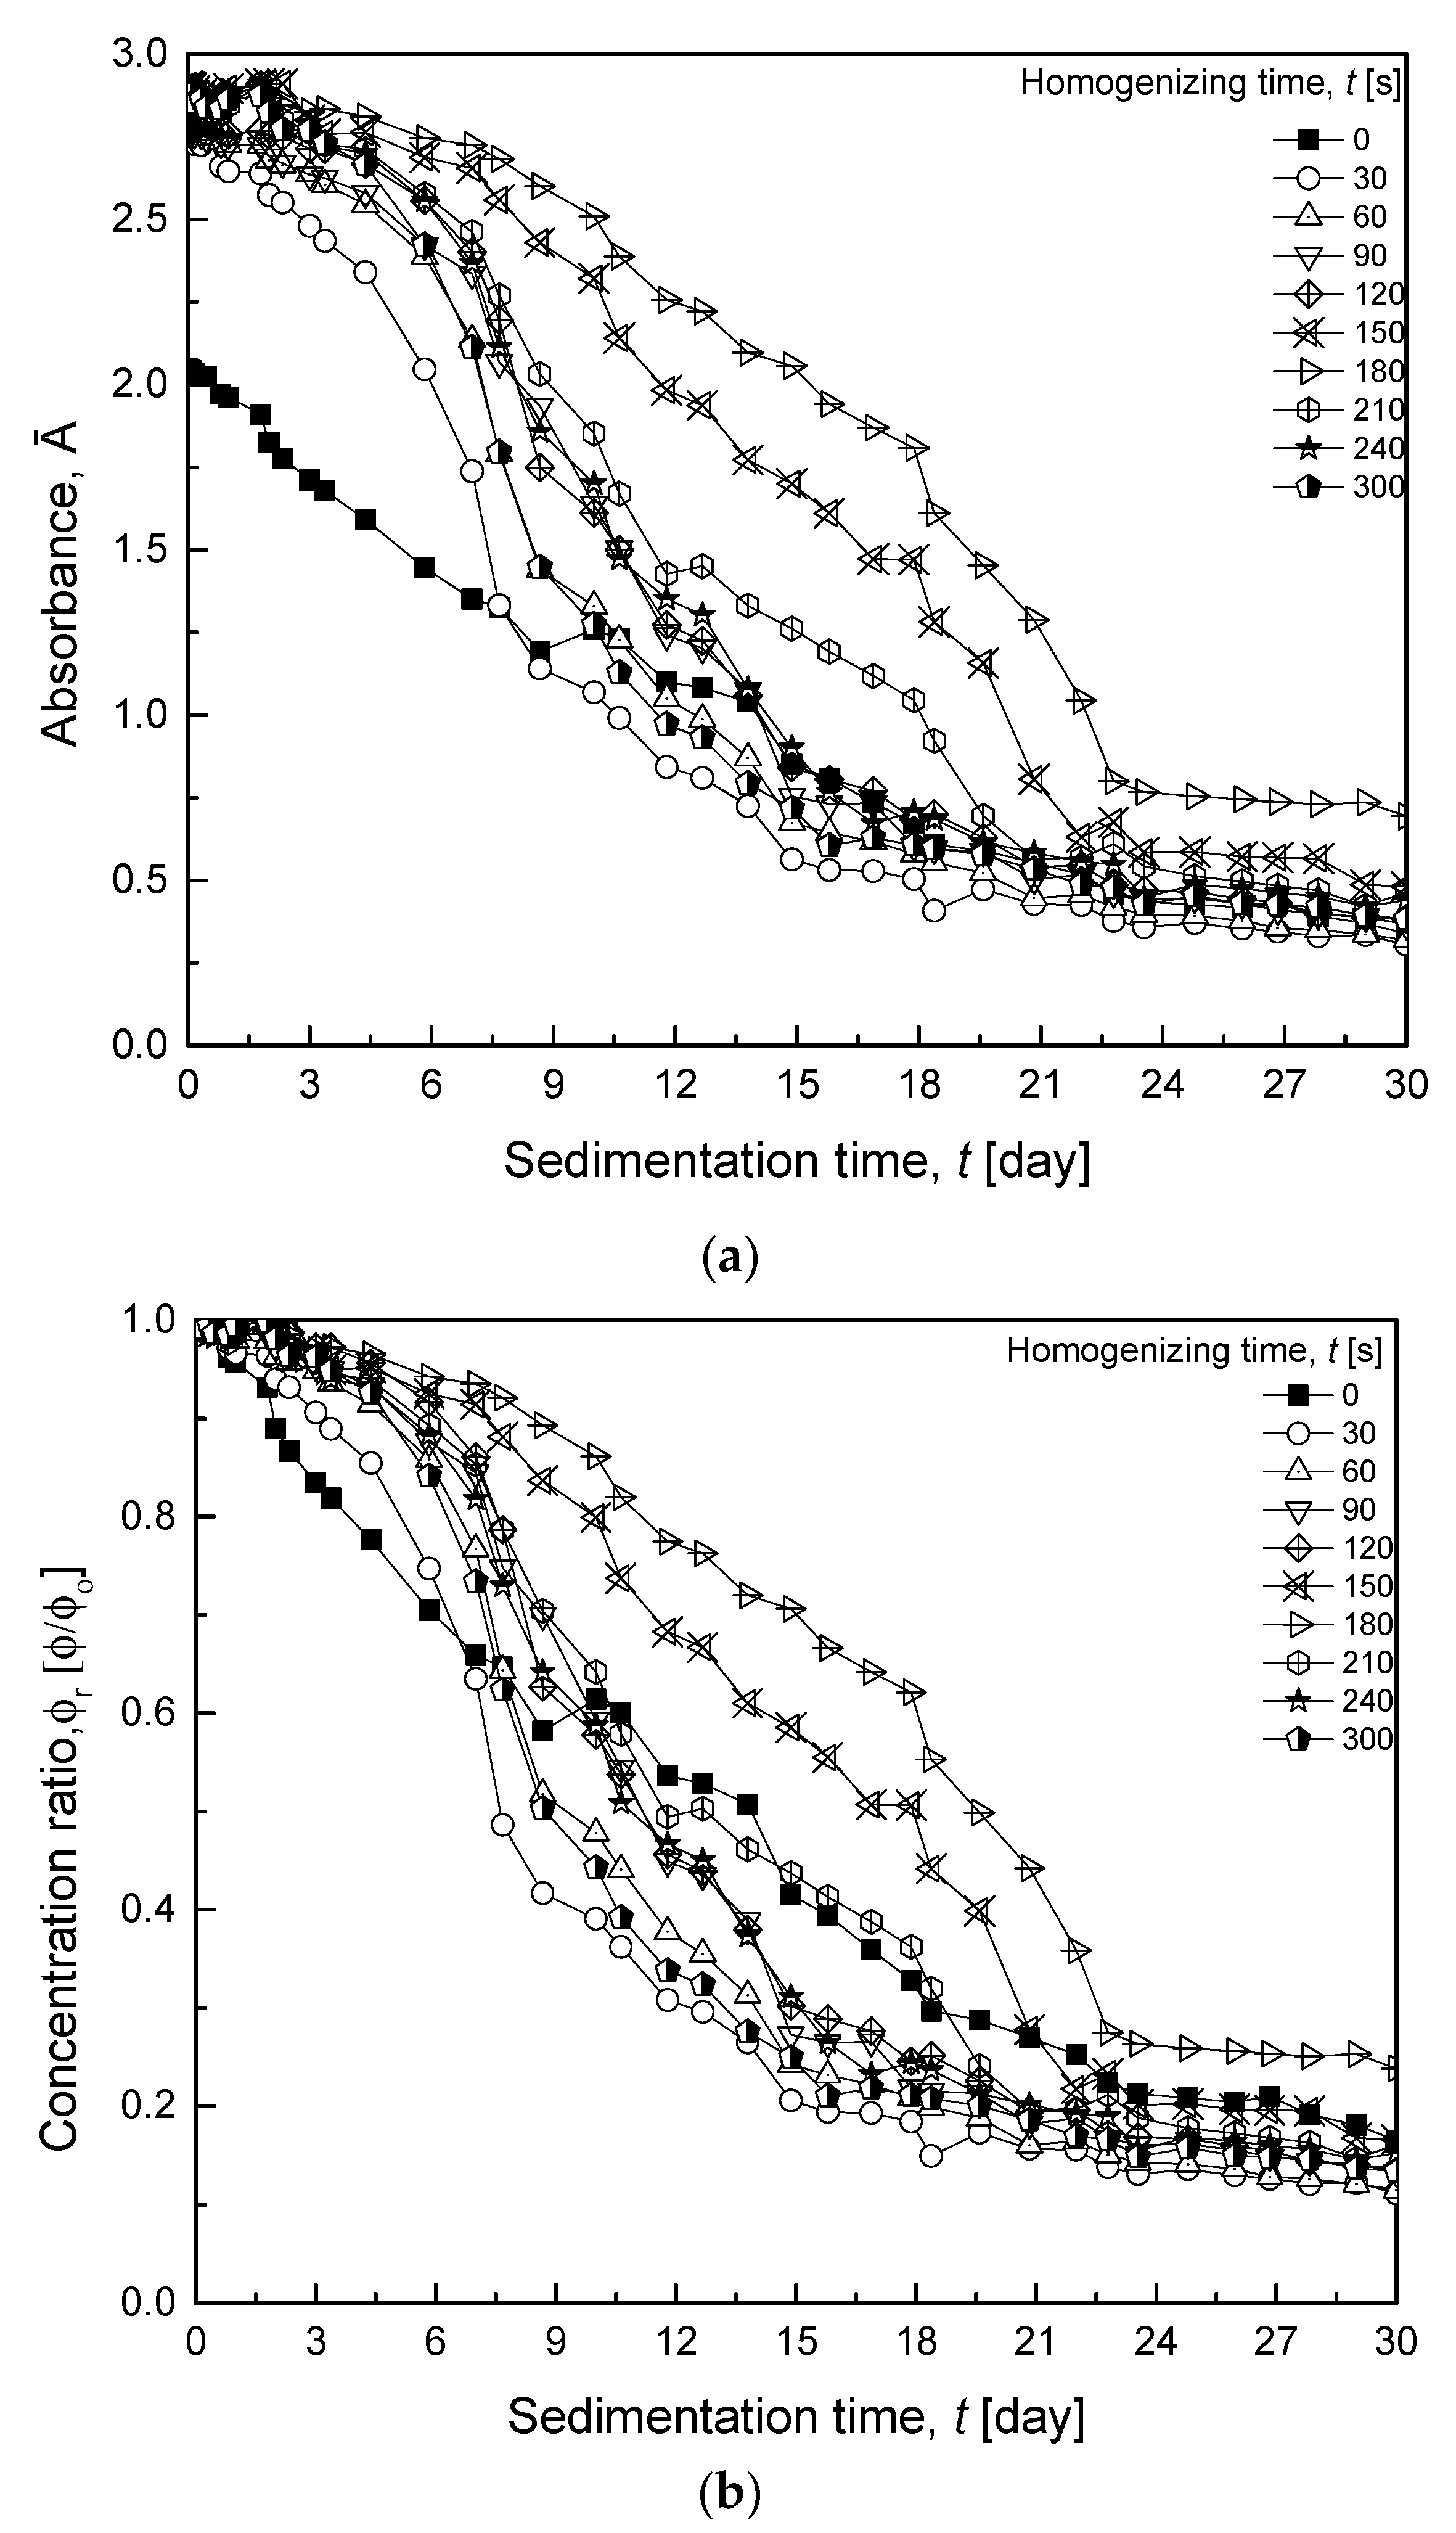
3.2.1. Various HSH Times

Figure 6 illustrates the absorbance and concentration ratio of nanolubricants for HSH evaluation at different homogenizing times. The UV-Vis spectrophotometer measurement of absorbance and concentration ratio was undertaken on a time-dependent basis for up to 30 days of evaluation. At the beginning of the observation, the absorbance of the nanolubricant in Figure 6a was reported between 2.738 and 2.904 for the sample with a homogenizing time of 30 to 300 s. The reference sample at 0 s was reported with an initial absorbance value of 2.050. On the first three days of the observation, the absorbance for 30 s homogenizing time was dropped to 2.481, while the reference sample was reduced to 1.711. All samples’ absorbance decreased rapidly from the fifth to the 22nd day. Lastly, the rate of the absorbance drop remained constant for all samples after the 22nd day of observation. Figure 6b shows the concentration ratios of the nanolubricant. All samples showed excellent ratios above 95% for the first three days of observation. The sample for 30 s homogenizing time showed the lowest concentration ratio for 30 days of observation. Meanwhile, the sample at 180 s homogenizing time was always performed with the highest concentration ratio.
Interestingly, the concentration ratio of the reference sample was recorded as higher than the 30 s sample on the seventh day after preparation. Later, on the 12th day, the ratio for the reference sample was observed to be even higher than most samples except for 150 s and 180 s till the 23rd day of evaluation. From day 24 onwards, only the 180 s sample was performed with a higher concentration ratio than the reference. From the overall observation, preparing TiO2/PVE nanolubricant with 180 s HSH homogenizing time can provide good stability conditions for up to 15 days. The optimum 180 s homogenizing time is deemed to have better nanolubricant stability when considering a concentration ratio greater than 70% or 0.7 [32]. The HSH generated high-velocity differentials. Simultaneously, high shear rates were produced by high turbulent fluid flow inside the shear gap. These physical mechanisms generated the separation distance and resulted in variation of particles and agglomeration size. The HSH homogenizing time at 180 s can perform to break up the agglomeration of nanoparticles into smaller sizes. However, after 180 s, the sample tends to settle down faster because of clogging and re-agglomeration of the nanoparticles.
The results in Figure 6 are congenial with visual observation in Figure 2, as presented in Section 3.1. On the 15th and 30th day after preparation, the 180 s sample shows the slightest color changes compared to the other samples. The visual observation of the samples proved that less sedimentation happened with 180 s nanolubricant as quantitatively measured using the UV-Vis spectrophotometer method. As elaborated in the previous section, the entire content of nanolubricant passes through the workhead (rotor-stator) a few times as long as the homogenization process continues. When the homogenization period is short, i.e., 30 s, there is not enough time for all nanoparticle agglomerations to break into optimum size.
The end product was a mixture of multiple agglomeration-sized nanolubricants. The large agglomeration size of nanoparticles tended to settle at the bottom of the lubricant container due to gravitational effect [33]. Meanwhile, increasing homogenization time gave a more extended period for nanolubricant agglomerates to break up into smaller sizes. If the homogenization exceeded the optimum time, severe complications such as clogging and agglomeration caused fast sedimentation [18]. Smaller nanoparticle size has higher surface energy. Homoagglomeration may occur in the nanolubricant after the preparation, thus deteriorating the nanolubricant stability [14]. Therefore, the HSH must be at the optimum time to ensure stability at the maximum yield. The optimum homogenizing duration during the preparation of a nanolubricant is also considered by various researchers [34,35], hence affecting the stability and thermal properties of the nanolubricant. Nonetheless, the HSH is recommended in the preparation of nanolubricants with shorter preparation time compared to other homogenization methods and is capable of producing the same stability conditions.

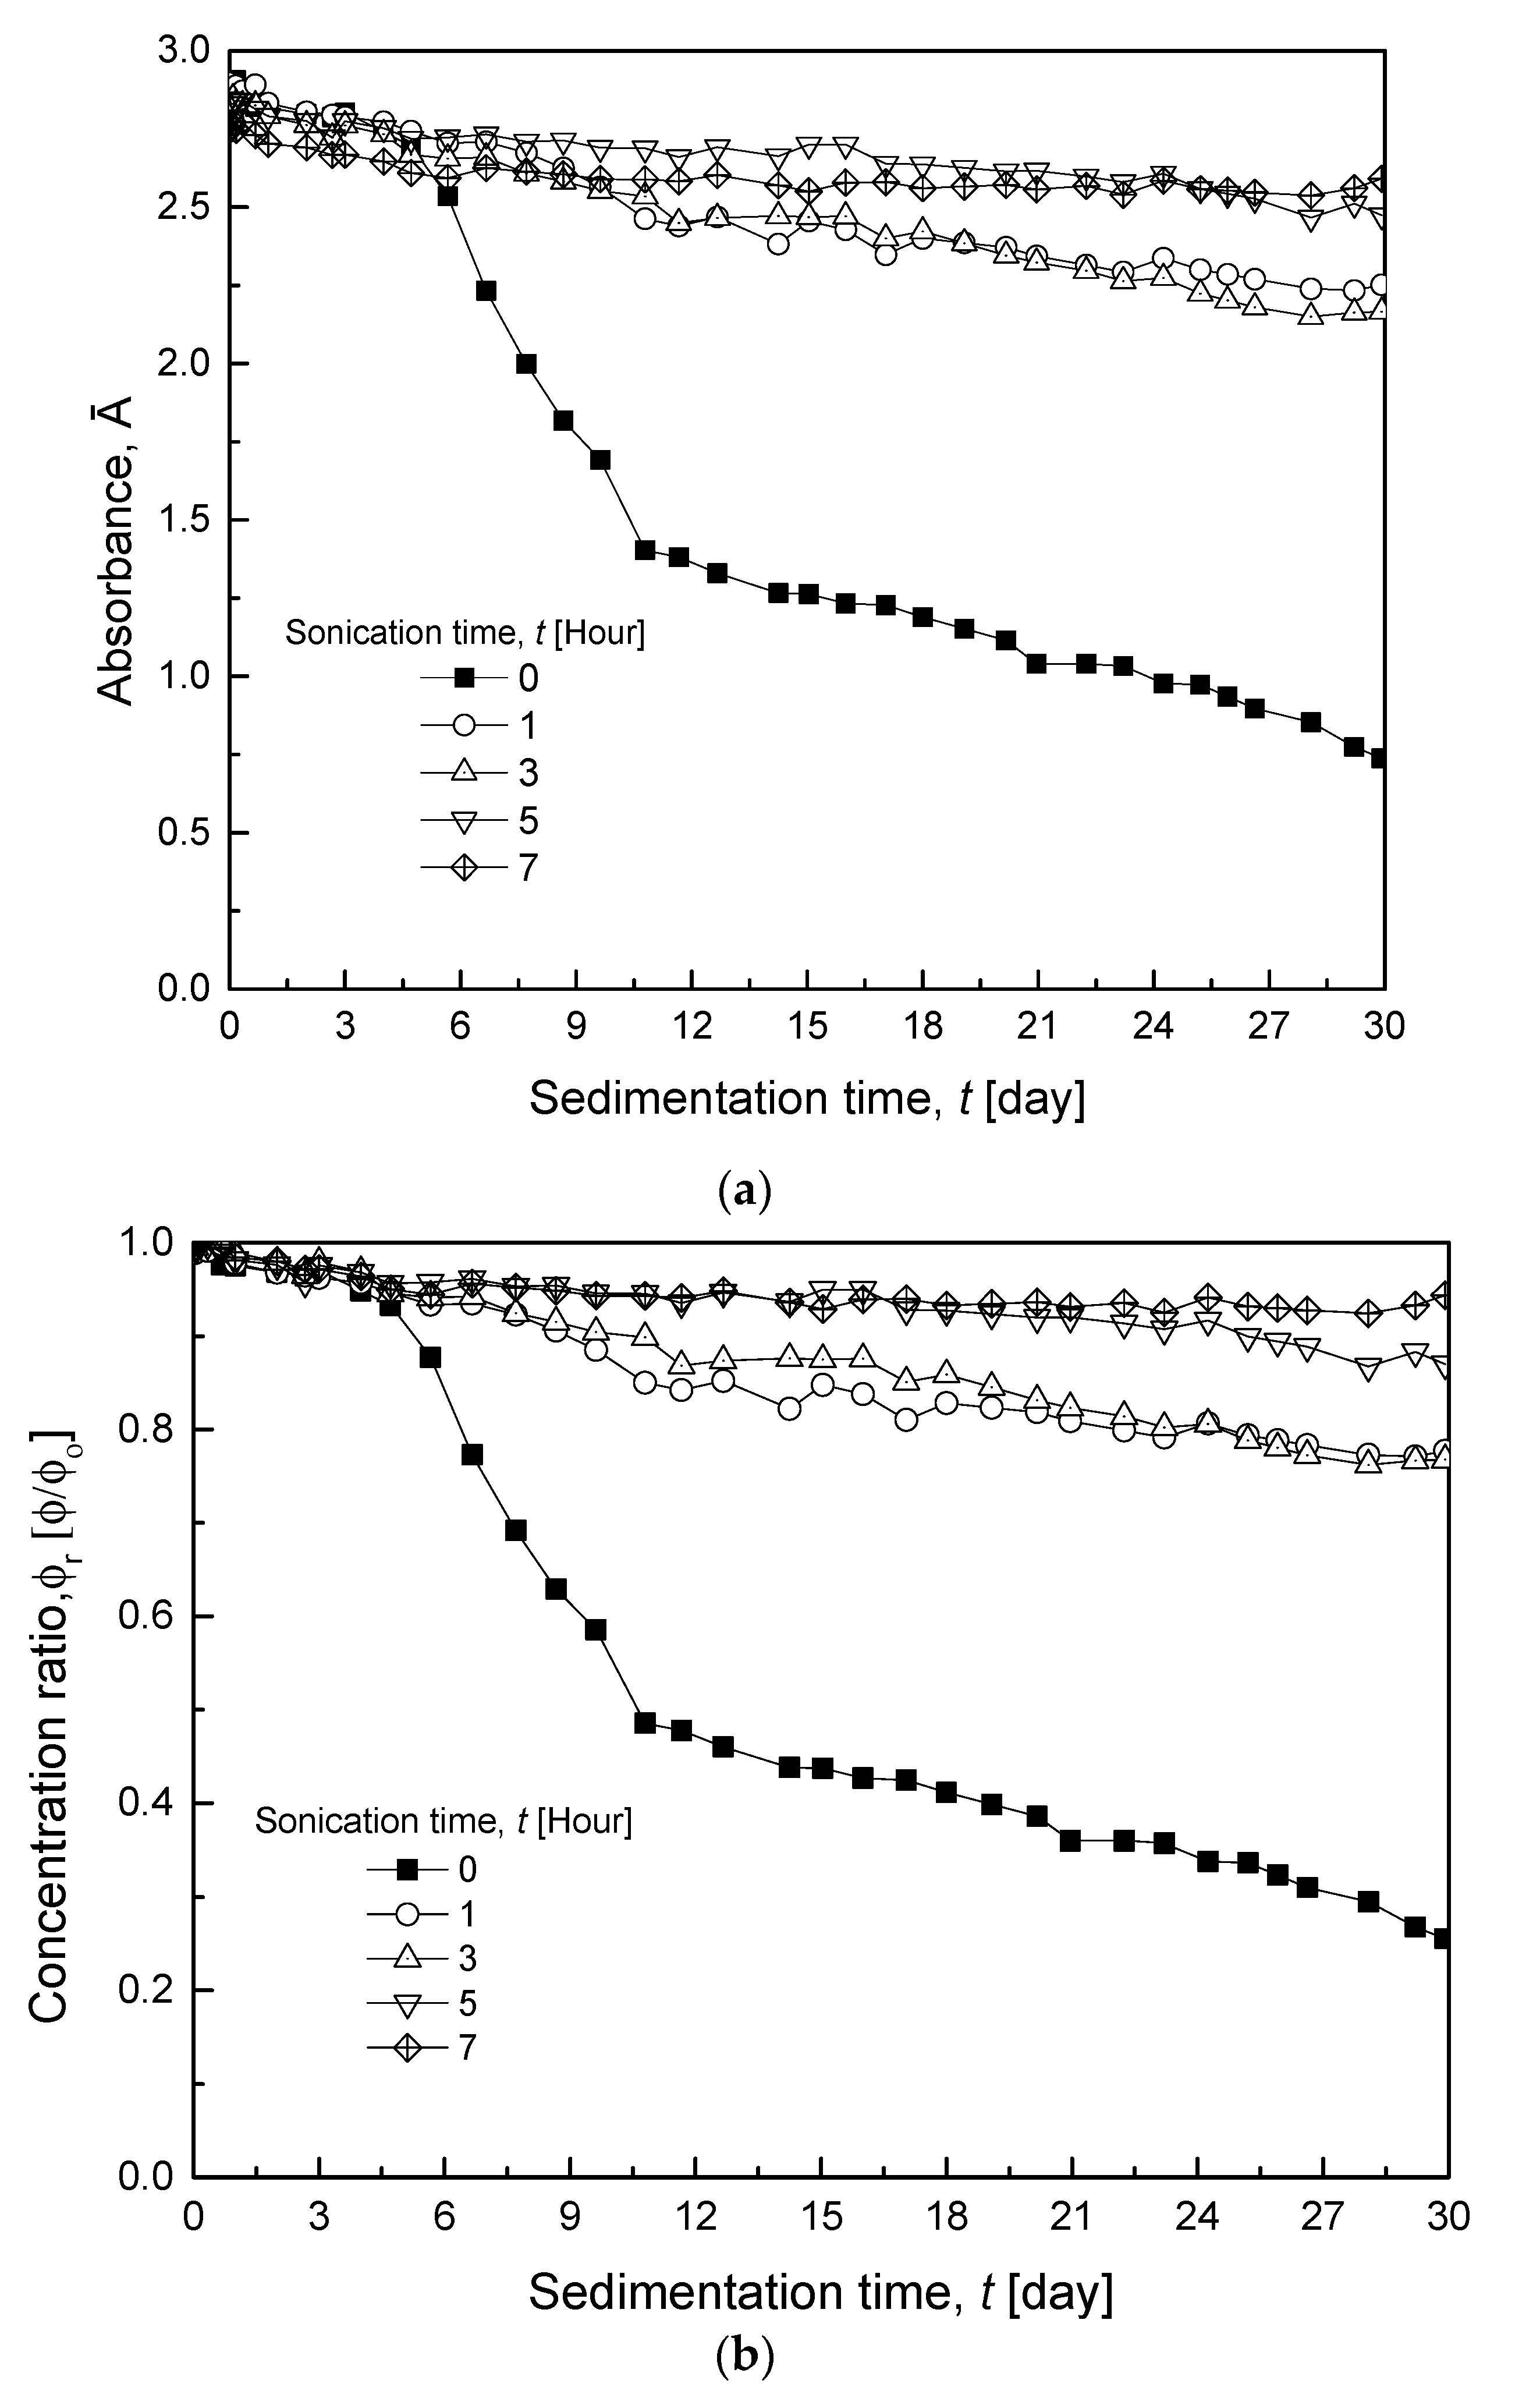
3.2.2. Various Sonication Times

In the second homogenization method, the ultrasonication bath method was used to prepare the TiO2/PVE nanolubricant, which was then evaluated using the UV-Vis spectrophotometer. Figure 7a shows the absorbance of the nanolubricant for various sonication times. The high absorbance value represents more suspended particles for a particular concentration in the lubricant. All samples were recorded with a slight drop from the beginning of the observation until the fifth day. The absorbance for the reference sample without sonication (0-h) dropped drastically from 2.9 to 0.6 in 30 days of observation. Meanwhile the samples at 1 h and 3 h sonication time showed a consistent drop and reached the absorbance value of 2.3 on the 30th day. The nanolubricant with a sonication time of 5 h and 7 h remained consistent with the high absorbance and was well distributed at an almost constant absorbance value until the last day of observation. Later, the absorbance trend of nanolubricants was supported by the concentration ratio in Figure 7b. The 7 h sonication time sample maintained the highest concentration ratio, greater than 95%, followed by a 5 h sample with a higher than 90% concentration ratio up to 30 days of preparation. However, the 1 h and 3 h samples were also considered stable when the concentration ratio occurred above 70% throughout the evaluation.
Figure 3 supports the findings in this section with qualitative evaluation. The 5 h and 7 h sonication time samples showed better dispersion than other samples on the 30th day after preparation. The ultrasonication bath used a sound wave to break the agglomeration in the solution. The agglomeration size became smaller when the nanolubricant was sonicated for extended periods. Consequently, the 5 h and 7 h samples were performed with higher absorbance and better concentration ratios than other samples. The ultrasonication bath method performed better than the HSH method in preparing the TiO2/PVE nanolubricant as shown in Figure 8. The HSH method can maintain the absorbance ratio above 70% at 180 s homogenizing time for up to 15 days. Interestingly, the ultrasonication bath method can preserve the absorbance ratio for up to 30 days above 90% at 5 h and 7 h sonication time. Therefore, the ultrasonication bath method is recommended to produce nanolubricant with high stability conditions. However, the HSH method is advantageous for preparing nanolubricant with significantly shorter time homogenization compared to the ultrasonication bath method.

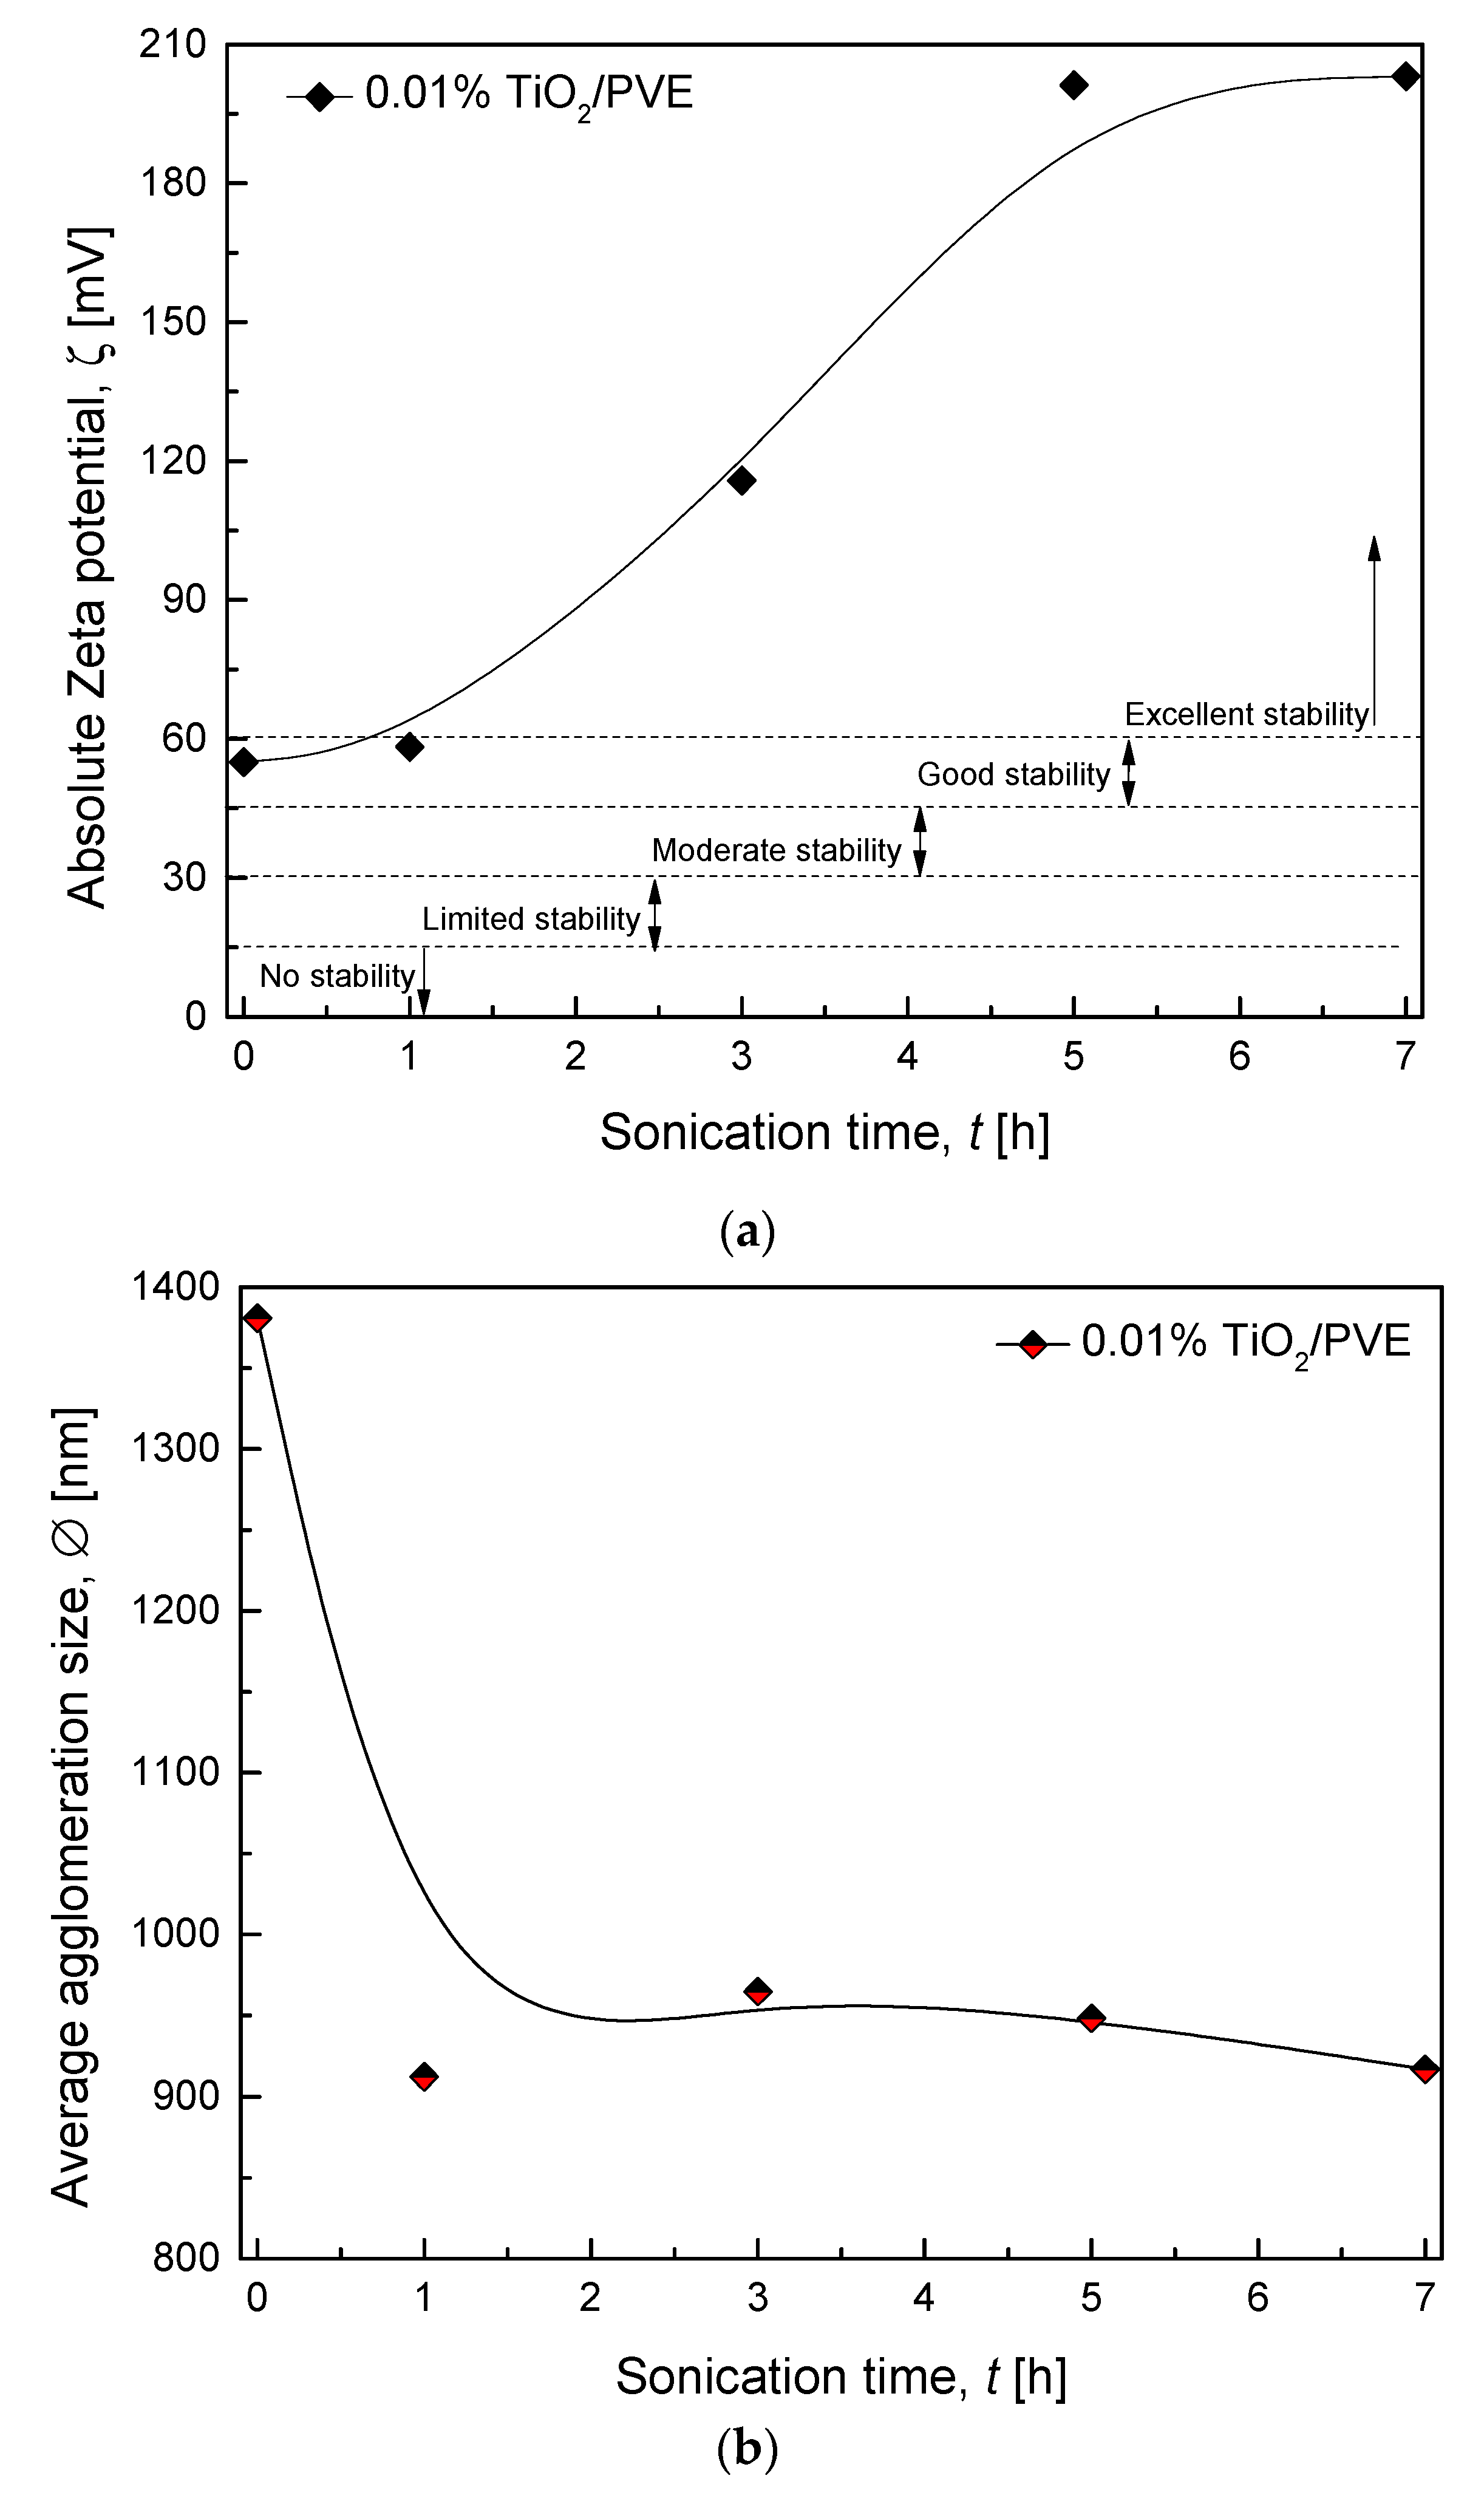
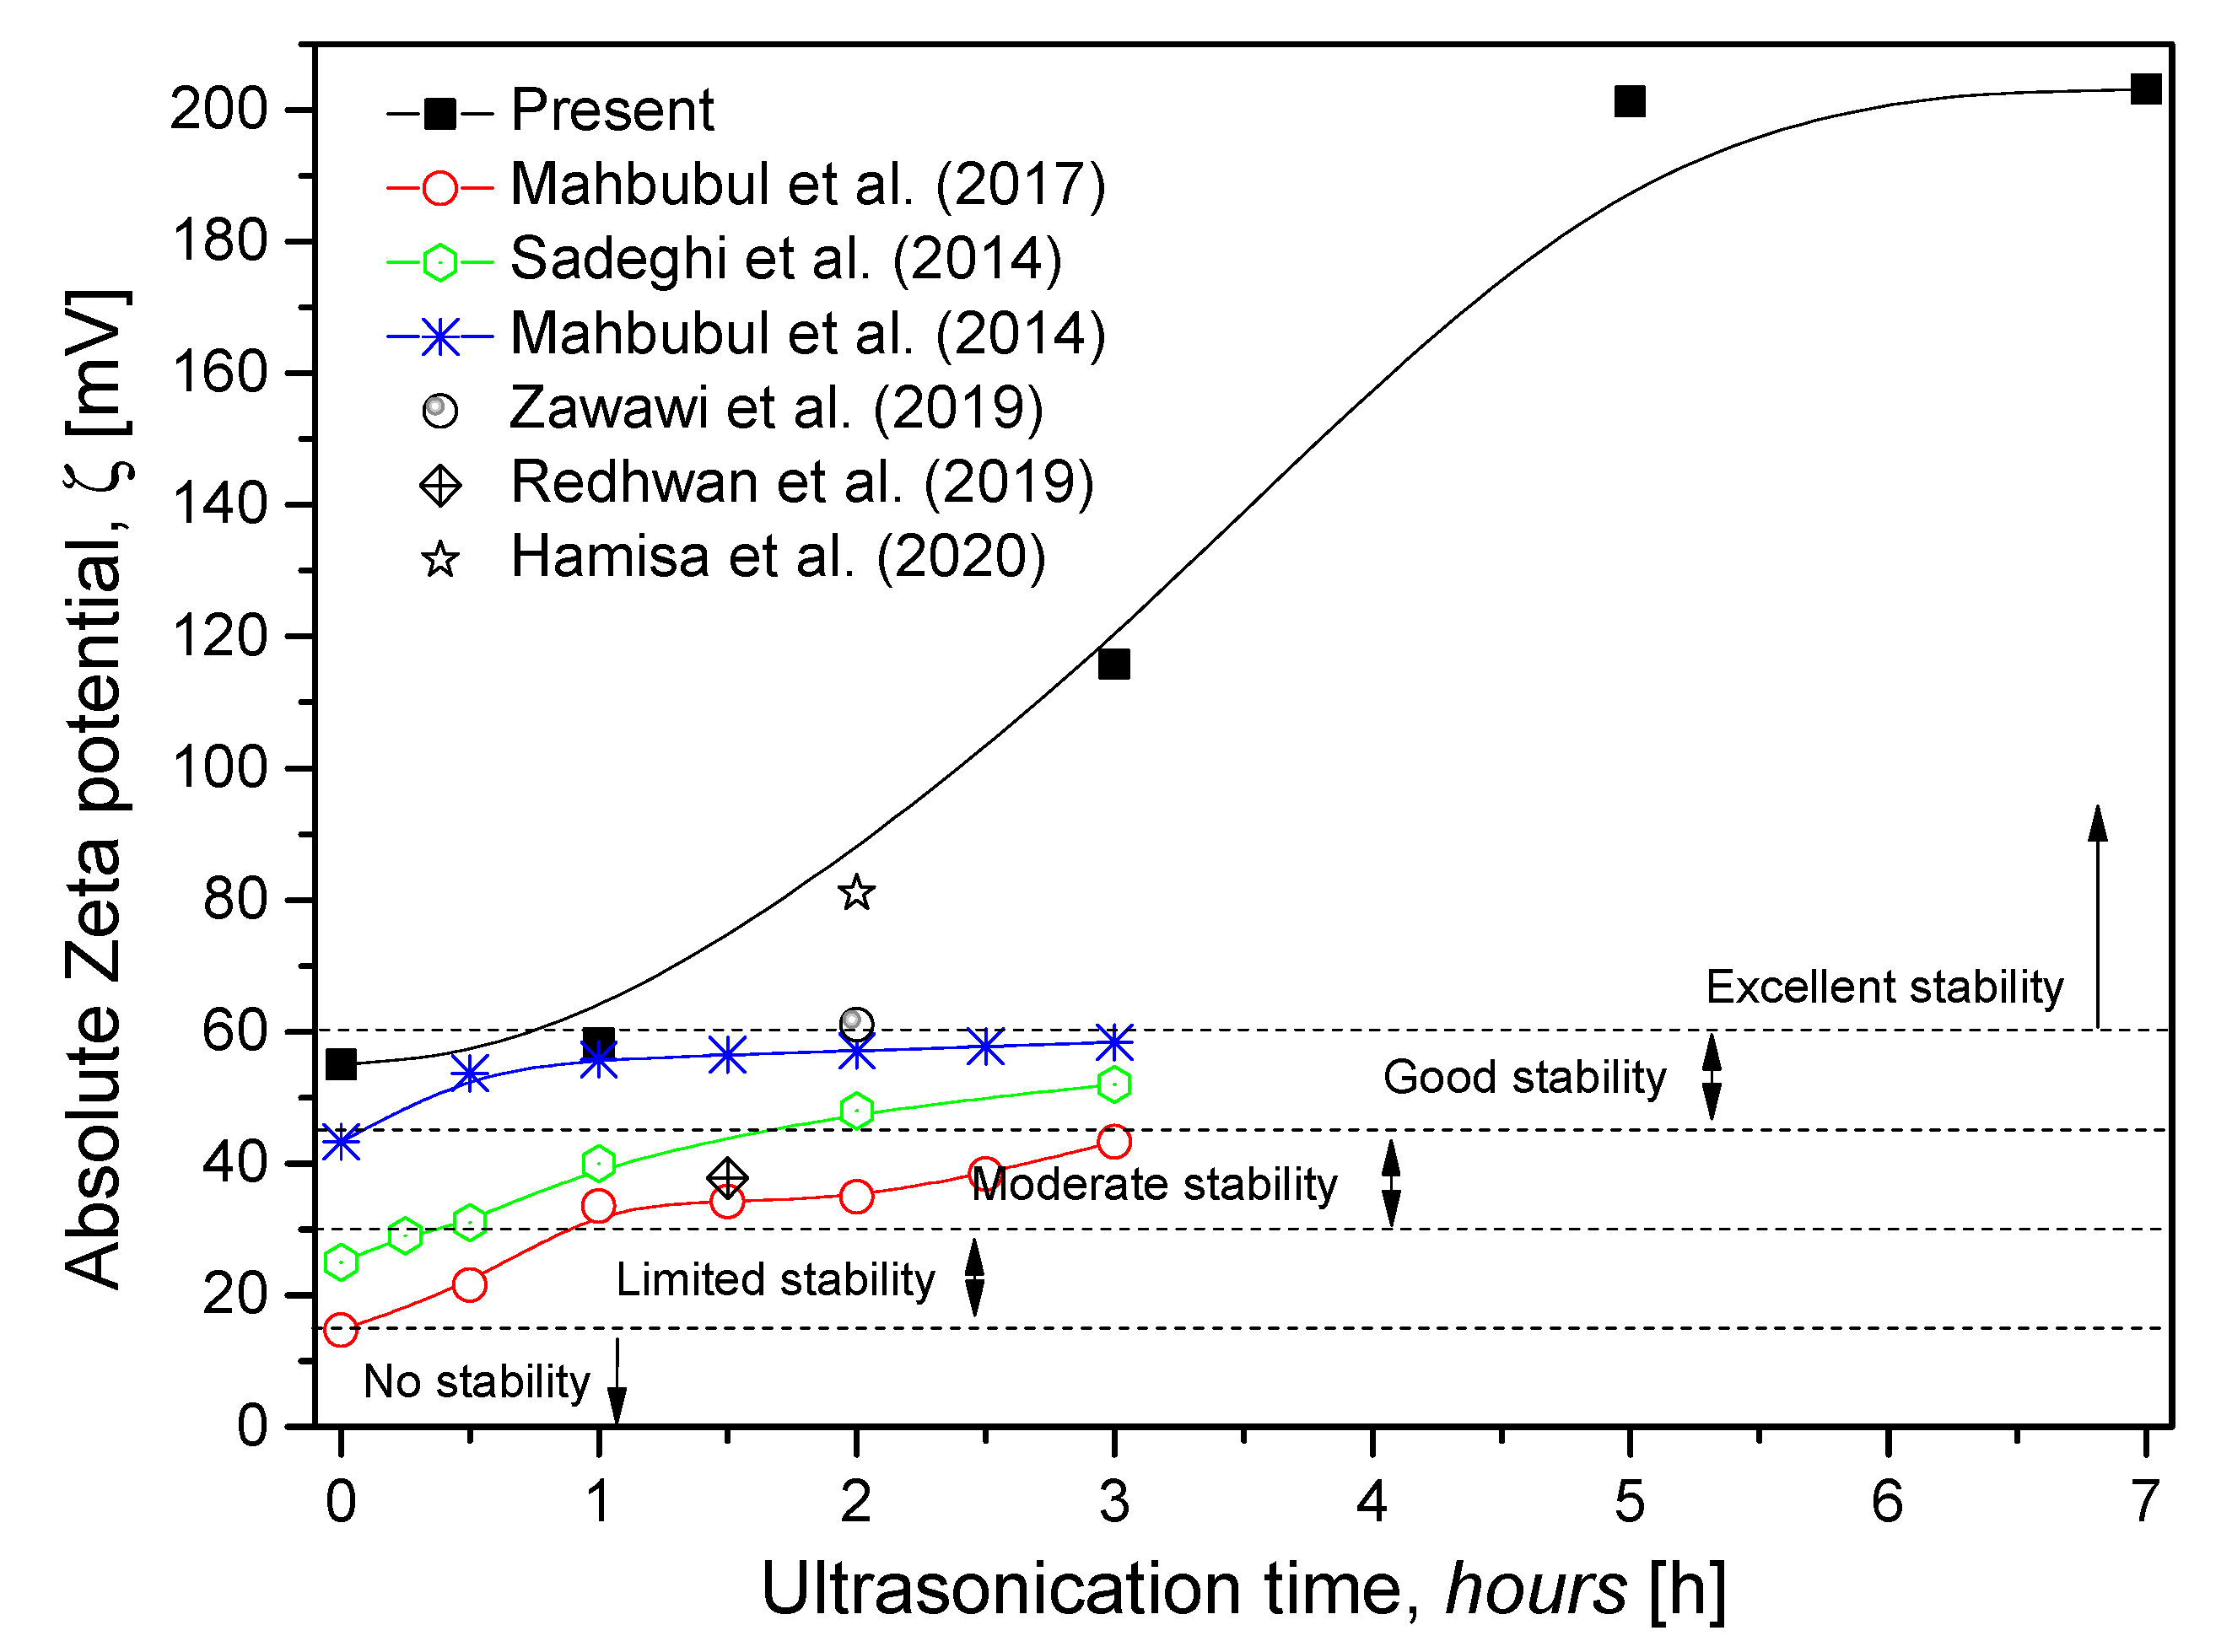
3.3. Zeta Potential and Zeta Sizer Analysis

The final stability evaluation of TiO2/PVE nanolubricant in the present study used the zeta potential and zeta sizer analysis. After considering all the results from visual observation and UV-Vis spectrophotometer, the nanolubricant with the aid of the ultrasonication bath, provided the most stable condition nanolubricant. Therefore, the stability of the sample from the ultrasonication bath was evaluated further by using zeta potential and zeta sizer to confirm the previous findings in Section 3.1 and Section 3.2. Figure 9a shows the zeta potential for various sonication times. According to the figure, the 1 h sample had slightly better stability than the 0 h sample, but the rest maintained excellent stability conditions of more than 60 mV. The stability condition of the nanolubricant was improved further in a linear form from 1 h to 5 h sonication times. However, additional sonication time at 7 h slightly enhanced the zeta potential, hence insignificantly affecting the stability of nanolubricant. This finding also agrees with the absorbance ratio trend in Figure 7b, where the ratio is slowly increased after a 5 h sonication time. According to the zeta potential measurements, the TiO2/PVE nanolubricant behaved with excellent stability conditions with a sonication time higher than 1 h.
Figure 9b shows the average agglomeration size for the same sample of TiO2/PVE nanolubricant. The agglomeration size for all samples treated with the ultrasonication bath were reduced significantly from their initial average size of 1380 nm for reference sample without sonication. The average agglomeration size of the nanolubricant with an ultrasonication bath is reported to be between 900 to 1000 nm. The lower zeta sizer than the reference data confirmed the stability behavior of the present nanolubricants using the ultrasonication bath. The bath can break down particle aggregation to a smaller size with an ultrasonic vibrator. However, the agglomeration size did not change considerably beyond the optimal sonication duration of 5 h, indicating the optimum ultrasonication time for TiO2/PVE nanolubricant. Additionally, the zeta potential and zeta sizer supported the UV-Vis spectrophotometer’s reliability in assessing the stability condition of the nanolubricant. It can be concluded that even without undergoing zeta potential analysis, the UV-Vis spectrophotometer is able to evaluate the nanolubricant stability by evaluating the concentration ratio at the specified time.
Figure 10 compares the present absolute zeta potential to the previous studies in the literature. Most of the previous studies investigated the zeta potential of nanolubricant for up to 3 h of sonication time only. Consequently, the figure presents no zeta potential data for sonication time longer than 3 h. Therefore, the present study extends the zeta potential investigation of nanolubricants with a sonication time of up to 7 h. The previous studies by Zawawi et al. [22], Redhwan et al. [35], and Hamisa et al. [36] measured the zeta potential of their nanolubricants at a particular sample with the best stability observation. The present zeta potential showed a similar trend with Mahbubul et al. [37], Sadeghi et al. [38], and Mahbubul et al. [39] at 0 h and 1 h sonication time. Moreover, the zeta potential of the remaining samples increased significantly up to 190 mV at 5 h and 7 h sonication time, indicating better stability conditions at higher sonication time. Therefore, the optimum sonication time is recommended at 5 h for the preparation of TiO2/PVE nanolubricant and agrees with the findings by visual observation in Figure 3 and UV-Vis absorbance variation in Figure 7. On the other hand, the nanolubricant behaved with excellent stability conditions and reported to have higher zeta potential than nanofluids in the literature.

4. Conclusions

The TiO2/PVE nanolubricant at 0.01% volume concentration was prepared with physical homogenization methods using a high-speed homogenizer (HSH) at various times and an ultrasonic bath homogenizer at different sonication times. The stability of the nanolubricant was analyzed using visual sedimentation photo capturing observation, UV-Vis spectrophotometer, zeta potential, and zeta sizer evaluation. The best stability condition of TiO2/PVE nanolubricant using HSH was performed at 180 s of preparation time; however, it only maintained stability for up to 15 days. Further, the 5 h and 7 h sonication time using an ultrasonication bath homogenizer produced the most stable TiO2/PVE nanolubricant with excellent stability for up to 30 days. Interestingly, the nanolubricants maintained more than 90% UV-Vis concentration ratio without any chemical modification. The zeta potential of the TiO2/PVE nanolubricant was improved significantly up to 190 mV at 5 h sonication time, hence indicating excellent stability conditions. The zeta potential and zeta sizer supported the UV-Vis spectrophotometer’s reliability in assessing the stability conditions of the nanolubricant. Finally, the ultrasonication bath homogenizer is recommended to produce nanolubricant with excellent stability conditions. However, the HSH method is suggested in the preparation of nanolubricants with shorter time homogenization for immediate use in vapor compression refrigeration systems. Further investigations on the thermo-physical properties of the TiO2/PVE nanolubricants and their performance in refrigeration systems are required to extend the present research.

Author Contributions

Conceptualization, M.F.I. and W.H.A.; methodology, M.F.I.; validation, M.F.I., W.H.A., and R.M.; formal analysis, M.F.I.; investigation, M.F.I.; resources, W.H.A. and R.M.; data curation, W.H.A. and R.M.; writing—original draft preparation, M.F.I.; writing—review and editing, W.H.A., H.M.A. and K.V.S.; visualization, M.F.I.; supervision, W.H.A., H.M.A., and R.M.; project administration, W.H.A.; funding acquisition, R.M. and H.M.A. All authors have read and agreed to the published version of the manuscript.

Funding

This research was funded by Universiti Malaysia Pahang and Universitas Muhammadiyah Jakarta, grant number RDU222701 and UIC221513.

Institutional Review Board Statement

Not applicable.

Informed Consent Statement

Not applicable.

Data Availability Statement

The data that support the findings of this study are available from the corresponding author (W.H. Azmi) upon reasonable request.

Acknowledgments

The authors are appreciative for the financial support provided by the Universiti Malaysia Pahang (RDU222701) and Universitas Muhammadiyah Jakarta (UIC221513) under the International Matching Grant. The authors further acknowledge the contributions of the research teams from the Center for Research in Advanced Fluid and Processes (Pusat Bendalir) and the Advanced Automotive Liquids Laboratory (AALL), who provided valuable insight and expertise for the current study.

Conflicts of Interest

No potential conflict of interest were reported by the authors.

References

  1. Ahmed, M.S.; Elsaid, A.M. Effect of hybrid and single nanofluids on the performance characteristics of chilled water air conditioning system. Appl. Therm. Eng. 2019, 163, 114398. [Google Scholar] [CrossRef]
  2. Masuda, H.; Ebata, A.; Teramae, K.; Hishinuma, N. Alteration of thermal conductivity and viscosity of liquid by dispersing ultra-fine particles. Dispersion of Al2O3, SiO2 and TiO2 ultra-fine particles. Netsu Bussei 1993, 7, 227–233. [Google Scholar] [CrossRef]
  3. Choi, S.U.S.; Eastman, J.A. Enhancing thermal conductivity of fluids with nanoparticles. In Proceedings of the ASME International Mechanical Engineering Congress & Exposition, New Orleans, LA, USA, 1 October 1995. [Google Scholar]
  4. Yang, L.; Jiang, W.; Ji, W.; Mahian, O.; Bazri, S.; Sadri, R.; Badruddin, I.A.; Wongwises, S. A review of heating/cooling processes using nanomaterials suspended in refrigerants and lubricants. Int. J. Heat Mass Transf. 2020, 153, 119611. [Google Scholar] [CrossRef]
  5. Park, E.J.; Lee, J.; Jung, D.; Shim, S.E. Dispersion Stability of Fluorinated Multi-Walled Carbon Nanotubes in FC-27 Refrigerant. J. Dispers. Sci. Technol. 2011, 32, 1485–1492. [Google Scholar] [CrossRef]
  6. Alawi, O.A.; Sidik, N.A.C.; Mohammed, H.A. A comprehensive review of fundamentals, preparation and applications of nanorefrigerants. Int. Commun. Heat Mass Transf. 2014, 54, 81–95. [Google Scholar] [CrossRef]
  7. Moreira, T.A.; Moreira, D.C.; Ribatski, G. Nanofluids for heat transfer applications: A review. J. Braz. Soc. Mech. Sci. Eng. 2018, 40, 1–29. [Google Scholar] [CrossRef]
  8. Raghavalu, K.V.; Rasu, N.G. Review on Applications of NanoFluids used in Vapour Compression Refrigeration System for Cop Enhancement. In Proceedings of the IOP Conference Series: Materials Science and Engineering; IOP Publishing: Bristol, UK, 2018; p. 012112. [Google Scholar]
  9. Ismail, M.F.; Wan Hamzah, W.A. Performance Investigation of R32 and R410a Refrigerants with Different Compressor Lubricants. In Proceedings of the 2nd Energy Security and Chemical Engineering Congress, Singapore, 3–5 November 2021; pp. 259–269. [Google Scholar]
  10. Bi, S.; Guo, K.; Liu, Z.; Wu, J. Performance of a domestic refrigerator using TiO2-R600a nano-refrigerant as working fluid. Energy Convers. Manag. 2011, 52, 733–737. [Google Scholar]
  11. Fuskele, V.; Sarviya, R.M. Recent developments in Nanoparticles Synthesis, Preparation and Stability of Nanofluids. Mater. Today Proc. 2017, 4, 4049–4060. [Google Scholar]
  12. Sezer, N.; Atieh, M.A.; Koc, M. A comprehensive review on synthesis, stability, thermophysical properties, and characterization of nanofluids. Powder Technol. 2019, 344, 404–431. [Google Scholar] [CrossRef]
  13. Verwey, E.J.W. Theory of the Stability of Lyophobic Colloids. J. Phys. Colloid Chem. 1947, 51, 631–636. [Google Scholar] [CrossRef]
  14. Wu, D.; Zhu, H.; Wang, L.; Liu, L. Critical issues in nanofluids preparation, characterization and thermal conductivity. Curr. Nanosci. 2009, 5, 103–112. [Google Scholar] [CrossRef]
  15. Khan, A.I.; Valan Arasu, A. A review of influence of nanoparticle synthesis and geometrical parameters on thermophysical properties and stability of nanofluids. Therm. Sci. Eng. Prog. 2019, 11, 334–364. [Google Scholar] [CrossRef]
  16. Che Sidik, N.A.; Mahmud Jamil, M.; Aziz Japar, W.M.A.; Muhammad Adamu, I. A review on preparation methods, stability and applications of hybrid nanofluids. Renew. Sustain. Energy Rev. 2017, 80, 1112–1122. [Google Scholar] [CrossRef]
  17. Heris, S.Z.; Razbani, M.A.; Estelle, P.; Mahian, O. Rheological Behavior of Zinc-Oxide Nanolubricants. J. Dispers. Sci. Technol. 2015, 36, 1073–1079. [Google Scholar] [CrossRef]
  18. Ghadimi, A.; Saidur, R.; Metselaar, H.S.C. A review of nanofluid stability properties and characterization in stationary conditions. Int. J. Heat Mass Transf. 2011, 54, 4051–4068. [Google Scholar] [CrossRef]
  19. Mohammadi, M.; Dadvar, M.; Dabir, B. Application of response surface methodology for optimization of the stability of asphaltene particles in crude oil by TiO2/SiO2 nanofluids under static and dynamic conditions. J. Dispers. Sci. Technol. 2018, 39, 431–442. [Google Scholar] [CrossRef]
  20. Sharif, M.Z.; Azmi, W.H.; Redhwan, A.A.M.; Mamat, R. Investigation of thermal conductivity and viscosity of Al2O3/PAG nanolubricant for application in automotive air conditioning system. Int. J. Refrig. 2016, 70, 93–102. [Google Scholar] [CrossRef]
  21. Redhwan, A.A.M.; Azmi, W.H.; Sharif, M.Z.; Mamat, R.; Zawawi, N.N.M. Comparative study of thermo-physical properties of SiO2 and Al2O3 nanoparticles dispersed in PAG lubricant. Appl. Therm. Eng. 2017, 116, 823–832. [Google Scholar] [CrossRef]
  22. Zawawi, N.N.M.; Azmi, W.H.; Sharif, M.Z.; Najafi, G. Experimental investigation on stability and thermo-physical properties of Al2O3-SiO2/PAG nanolubricants with different nanoparticle ratios. J. Therm. Anal. Calorim. 2019, 135, 1243–1255. [Google Scholar] [CrossRef]
  23. Gill, J.; Singh, J.; Ohunakin, O.S.; Adelekan, D.S. Energy analysis of a domestic refrigerator system with ANN using LPG/TiO2–lubricant as replacement for R134a. J. Therm. Anal. Calorim. 2018, 135, 475–488. [Google Scholar] [CrossRef]
  24. Lanka, S.; Alexandrova, E.; Kozhukhova, M.; Hasan, M.S.; Nosonovsky, M.; Sobolev, K. Tribological and wetting properties of TiO2 based hydrophobic coatings for ceramics. J. Tribol. 2019, 141, 101301. [Google Scholar]
  25. Borras, A.; Lopez, C.; Rico, V.; Gracia, F.; Gonzalez-Elipe, A.R.; Richter, E.; Battiston, G.; Gerbasi, R.; McSporran, N.; Sauthier, G. Effect of visible and UV illumination on the water contact angle of TiO2 thin films with incorporated nitrogen. J. Phys. Chem. C 2007, 111, 1801–1808. [Google Scholar]
  26. Balajka, J.; Hines, M.A.; DeBenedetti, W.J.; Komora, M.; Pavelec, J.; Schmid, M.; Diebold, U. High-affinity adsorption leads to molecularly ordered interfaces on TiO2 in air and solution. Science 2018, 361, 786–789. [Google Scholar] [CrossRef] [PubMed]
  27. Park, J.Y. How titanium dioxide cleans itself. Science 2018, 361, 753. [Google Scholar] [CrossRef] [PubMed]
  28. Ouikhalfan, M.; Labihi, A.; Belaqziz, M.; Chehouani, H.; Benhamou, B.; Sarı, A.; Belfkira, A. Stability and thermal conductivity enhancement of aqueous nanofluid based on surfactant-modified TiO2. J. Dispers. Sci. Technol. 2020, 41, 374–382. [Google Scholar] [CrossRef]
  29. Idemitsu Kosan, C.L. Material Safety Data Sheet -Daphne Hermetic Oil FVC68D. In Material Safety Data Sheet; Idemitsu: Tokyo, Japan, 2010; pp. 1–5. [Google Scholar]
  30. Hongwu International Group Ltd. Anatase Nano TiO2 Titanium Dioxide Powders. Available online: www.hwnanomaterial.com/anatase-nano-tio2-titanium-dioxide-powders_p49.html(accessed on 25 September 2021).
  31. Zawawi, N.N.M.; Azmi, W.H.; Redhwan, A.A.M.; Sharif, M.Z.; Sharma, K.V. Thermo-physical properties of Al2O3-SiO2/PAG composite nanolubricant for refrigeration system. Int. J. Refrig. 2017, 80, 1–10. [Google Scholar] [CrossRef]
  32. Sharif, M.Z.; Azmi, W.H.; Redhwan, A.A.M.; Zawawi, N.N.M. Improvement of nanofluid stability using 4-step UV-vis spectral absorbency analysis. J. Mech. Eng. 2017, 4, 233–247. [Google Scholar]
  33. Yu, W.; Xie, H. A review on nanofluids: Preparation, stability mechanisms, and applications. J. Nanomater. 2012, 2012, 1–17. [Google Scholar] [CrossRef]
  34. Sharif, M.Z.; Azmi, W.H.; Redhwan, A.A.M.; Mamat, R.; Yusof, T.M. Performance analysis of SiO2/PAG nanolubricant in automotive air conditioning system. Int. J. Refrig. 2017, 75, 204–216. [Google Scholar] [CrossRef]
  35. Redhwan, A.A.M.; Azmi, W.H.; Sharif, M.Z.; Mamat, R.; Samykano, M.; Najafi, G. Performance improvement in mobile air conditioning system using Al2O3/PAG nanolubricant. J. Therm. Anal. Calorim. 2019, 135, 1299–1310. [Google Scholar] [CrossRef]
  36. Hamisa, A.H.; Yusof, T.M.; Azmi, W.H.; Mamat, R.; Sharif, M.Z. The stability of TiO2/POE nanolubricant for automotive air-conditioning system of hybrid electric vehicles. In Proceedings of the IOP Conference Series: Materials Science and Engineering; IOP Publishing: Bristol, UK, 2020; p. 012050. [Google Scholar]
  37. Mahbubul, I.M.; Elcioglu, E.B.; Saidur, R.; Amalina, M.A. Optimization of ultrasonication period for better dispersion and stability of TiO2–water nanofluid. Ultrason. Sonochem. 2017, 37, 360–367. [Google Scholar] [CrossRef] [PubMed]
  38. Sadeghi, R.; Etemad, S.G.; Keshavarzi, E.; Haghshenasfard, M. Investigation of alumina nanofluid stability by UV–vis spectrum. Microfluid. Nanofluid. 2014, 18, 1023–1030. [Google Scholar] [CrossRef]
  39. Mahbubul, I.M.; Chong, T.H.; Khaleduzzaman, S.S.; Shahrul, I.M.; Saidur, R.; Long, B.D.; Amalina, M.A. Effect of Ultrasonication Duration on Colloidal Structure and Viscosity of Alumina–Water Nanofluid. Ind. Eng. Chem. Res. 2014, 53, 6677–6684. [Google Scholar] [CrossRef]
Figure 1. TEM image of TiO2 nanoparticles in PVE lubricant.
Lubricants 11 00067 g001
Figure 2. Visual observation for HSH preparation at different homogenization duration(s).
Lubricants 11 00067 g002
Figure 3. Visual observation for ultrasonication bath preparation at different sonication times.
Lubricants 11 00067 g003
Figure 4. Absorbance variation of TiO2/PVE nanolubricants at different wavelengths.
Lubricants 11 00067 g004
Figure 5. Linear relation between concentration and absorbance of TiO2/PVE nanolubricants.
Lubricants 11 00067 g005
Figure 6. Time dependency of UV-Vis evaluation for HSH at different homogenizing times. (a) Absorbance (b) Concentration ratio.
Lubricants 11 00067 g006
Figure 7. Time dependency of UV-Vis evaluation at different sonication times. (a) Absorbance (b) Concentration ratio.
Lubricants 11 00067 g007
Figure 8. Concentration ratio comparison of the best samples from different homogenization methods.
Lubricants 11 00067 g008
Figure 9. Zeta potential and zeta sizer analysis at different sonication times. (a) Absolute zeta potential (b) Average agglomeration size.
Lubricants 11 00067 g009
Figure 10. Comparison of present absolute zeta potential to the previous studies in the literature [22,35,36,37,38,39].
Lubricants 11 00067 g010
Table 1. Properties of PVE lubricants [29].
PropertyPVE
Density, g/cm3 (@ 15 °C)0.9369
Dynamic viscosity, Pa·s @ 40 °C62.37 × 10−3
Dynamic viscosity, Pa·s @ 100 °C7.53 × 10−3
Viscosity index84
Pour point, °C−37.5
Flashpoint, °C204
Total acid number (mg KOH/g)>0.01
Volumetric resistivity (RT) (Ω·cm)6 × 10¹³
Copper corrosion (100 °C, 1 h)1 (1B)
Water content (ppm)>150
Table 2. Properties of TiO2 nanoparticles [30].
PropertyTiO2
Molecular mass, g/mol79.87
Average particle diameter, nm50
Density, kg/m4230
Thermal conductivity, W/m·K8.4
Specific heat, J/kg·K692
Disclaimer/Publisher’s Note: The statements, opinions and data contained in all publications are solely those of the individual author(s) and contributor(s) and not of MDPI and/or the editor(s). MDPI and/or the editor(s) disclaim responsibility for any injury to people or property resulting from any ideas, methods, instructions or products referred to in the content.

