Article

Comparison of Machining Simulations of Aerospace Alloy Al6061-T6 Using Lagrangian and Smoothed Particle Hydrodynamics Techniques

1
Department of Naval Architecture, PNEC, National University of Sciences and Technology, Karachi 75350, Pakistan
2
Department of Mechanical Engineering, Faculty of Engineering, Islamic University of Madinah, Madinah 42351, Saudi Arabia
3
Department of Engineering Sciences, PNEC, National University of Sciences and Technology, Karachi 75350, Pakistan
4
Department of Mechanical Engineering, Hamdard University, Karachi 74600, Pakistan
*
Author to whom correspondence should be addressed.
Lubricants 2022, 10(11), 310; https://doi.org/10.3390/lubricants10110310
Submission received: 21 September 2022 / Revised: 23 October 2022 / Accepted: 31 October 2022 / Published: 15 November 2022
(This article belongs to the Special Issue Friction Stir Processing of Structural Metallic Materials)

Abstract

:
This research focuses on the study of the simulation capabilities of the lagrangian (LAG) model and Smoothed Particle Hydrodynamics (SPH) model for the orthogonal dry machining of aluminum alloy Al6061-T6. A three-dimensional finite element model was developed and verified using experimental data from the published literature. The numerical models were developed using lagrangian boundary conditions via finite element modeling in ABAQUS/Explicit 6.14. The cutting simulations were carried out at low and medium cutting speeds. Johnson–Cook material constitutive law and Johnson–Cook damage law were used in both models. The numerical methodologies are compared based on cutting forces, chip morphology, shear angle, chip separation criterion, and chip thickness. The findings of the present work show that the LAG model is good for predictions regarding cutting forces and chip morphology, while the SPH model is good for predictions regarding the shear angle and chip thickness. The difference between results generated by both models mainly occurred due to the friction coefficient. The comparative study shown here offers a guidance approach for various numerical models for appropriate parameter analysis.

1. Introduction

Machining is a frequently utilized procedure in the manufacture of industrial components. Machining modeling is becoming a more significant tool for analyzing and optimizing machining operations [1,2]. Key cutting practices, which include turning, drilling, and milling, can be modeled using advanced machining codes and high-performance computer systems. Machining processes can be better understood using finite element modelling (FEM) [3]. Technological developments in computers and potent finite element techniques have made modeling complex machining procedures relatively easy. The industrial cutting processes are 3D and complicated, and most prior machining models are based on orthogonal cutting in the 2D regime [4,5].
In orthogonal machining problems, a hard and solid cutting tool passes through a relatively softer workpiece, and the process simulation is carried out using non-linear governing equations [6]. The cutting process is categorized into three deformation zones, as shown in Figure 1 [7]. The primary deformity zone and secondary deformity zone near the cutter edge constitute the principal deformity zones. The workpiece undergoes high deformation with an enormous strain rate in this region. The third deformation zone lies on the clearance face. Deformation happens in this zone when the newly machined surface is rubbed by the clearance face of the tool [8].
Aluminum alloys, specifically 6xxx types, are gaining importance due to being substituted for steel due to their strength, availability, ability to resist corrosion, relatively easy weldability, and relatively low cost. The material removal rate increases with the cutting speed while machining aluminum alloys. At the same time, the “surface integrity” and the “chip formation process” are affected by the cutter speeds [9,10]. It is necessary to have a firm grip on the key parameters of the cutting process. The parameters such as tool geometry, cutting speed, and feed rate directly influence the resulting chip morphology and cutting forces [11,12].
Most researchers use 2D plane strain geometric models [3,13,14,15] to simulate orthogonal metal cutting, as this is less time-consuming, requires fewer resources, and is cost-effective. The current trend has shifted towards 3D geometric models [6,16,17,18,19] due to available resources. These models compensate for the drawbacks of 2D plain strain models, such as the correct estimation of the cutting forces. More realistic modeling can be completed for 3D analysis by avoiding the assumptions which have to be made in the 2D plane strain analysis. A novel method of numerical modeling for high-speed cutting was presented by J. Limido et al. [20]. The outcomes of the 2D SPH-based model developed in LS-DYNA software were compared with the experimental data for Al6061-T6. Continuous to shear-localized chip formation and cutting force predictions using the SPH cutting model were found to be accurate. R. Chieragatti et al. [21] used the SPH method within the framework of high-speed cutting modeling in the 2D regime in LS-DYNA software using Al6061-T6. The estimations of the cutting forces, continuous localized chip formation, and shear localized chip formation were in good agreement with the experimental results. Madaj and Piska [22] used the published experimental results of Al2024-T351 to model the orthogonal machining in which the resulting chip was segmented. The damage model (Johnson–Cook) specifications were varied along with the SPH particle density to observe their effect on “cutting forces” and “chip morphology”.
T. Ozel et al. [23] studied the chip formation mechanism of Inconel 718 using different FE software. The comparison was conducted for v = 30 m/min and 70 m/min with “f” = 0.25 mm/rev and width of cut = 0.15 mm. The rake angle was set as 0 deg., and the clearance angle was set as 7 deg. The predicted simulated results for the cutting forces were overestimated and obtained through DEFORM 3D and ABAQUS/Explicit using the Johnson–Cook material model. Badis Haddag et al. [24] analyzed the impact of cutting variables in the course of machining A2024-T351 using carbide inserts (uncoated). The cutting velocity for the analysis was set to 60 m/min, and the width of the cutting was 4 mm. The feed was varied between 0.05, 1, and 0.3 mm, while the tool rake angle was varied between 0, 15, and 30 deg. It was concluded that the chip is continuous at low feed, i.e., 0.05 and 0.1 mm, and becomes segmented at a feed of 0.3 mm. The forces emerging during cutting have a direct relationship with the feed rate, which constitutes an inverse function with the tool rake angle.
Daochun Xu et al. [25] established a hypothetical orthogonal model for the high-speed machining of Al6061-T6 to estimate chip thickness, shear angle, friction angle, slip shear distance, and cutting and thrust forces at a cutting speed range of 100 m/min to 1900 m/min and a feed rate range of 0.06 mm/r to 0.15 mm/r. The increase in cutting speed results in decreased chip thickness, friction angle, and contact length between the tool and chip, whereas an increased response was seen in the case of the angle of shear and shear slip distance with the increase in speed. Using response surface methods, M. Doud et al. [26] calculated the parameters of the JC constitutive law. The experiments included aluminum alloys such as Al6061-T6 and gave full focus to examining the rake angle effect. Compared with earlier research, the flow stresses, cutting forces, and chip shape predictions were accurate.
Lida Zhu et al. [27] studied a three-dimensional chip design of Al6061-T6, which included chip thickness and chip length at a cutting tool speed of 78 m/min to 312 m/min; the machining speed of the workpiece varied from 1.25 m/min to 5m/min and axial feed velocity varied from 20 mm/min to 80 mm/min. It was concluded that, compared with conventional turning, the reduction in chip length occurs due to an increment in the cutting speed of the tool, while the chip length increases with the increased axial feed velocity.
Sohail Akram et al. [28] completed a numerical study with experimental justification on the chip morphology of Al6061-T6 during 2D orthogonal machining on ABAQUS/Explicit 6.12. The experiments related to orthogonal machining were completed with an uncoated carbide tool in the cutting speed array of 250 m/min to 1000 m/min and a feed rate range of 0.1 mm/rev to 0.4 mm/rev to attain the chip thickness and the shear angles. Badis Haddag et al. [24] analyzed the impact of cutting variables in the course of machining A2024-T351 using carbide inserts (uncoated). The cutting velocity for the analysis was set to 60 m/min, and the width of cutting was set to 4 mm. The feed varied between 0.05, 1, 0.3 mm, while the tool rake angle varied between 0, 15, and 30 deg. It was concluded that the chip is continuous at low feed, i.e., 0.05 and 0.1 mm, and becomes segmented at a feed of 0.3 mm. The forces emerging during cutting have a direct relationship with the feed rate, constituting inverse function with the tool rake angle. The compression ratio has an inverse function with both the “f” and tool rake angle.
Cutting forces and chip formation considerably impact the machinability of the workpiece, such as cutting power, surface quality, and tool wear [29,30,31]. Zhaolong Zhu et al. found that cutting force and temperature are inversely linked to rake angle and positively related to cutting speed and depth [32]. Bashistakumar and Pushkal [33] analyzed the cutting forces during dry machining, obtained through the 3D FE modeling of “AISI 1020 steel” using the “Carbide tool”. The lagrangian approach was utilized with clearance angle = 0.5 deg., rake angle = 0.1 deg., cutting velocity = 100 m/min, and width of cut varying between 0.5 and 1.0 mm. The stress and force contours were in good agreement with the experimental findings. Hatem Soliman et al. [34] performed a 2D comparative study between the lagrangian and ALE approaches using FEM cutting force predictions in ABAQUS/Explicit. The selected materials for machining the piece and cutter were steel ASTM A36 and tungsten carbide. The input variables were: cutting velocity = 60 m/min, tool rake angle = 0 deg., tool clearance angle = 10°, and “f” varied between 0.12, 0.15, 0.18, 0.2, 0.22 and 0.26 mm/rev. The simulated models gave close results to the experimental ones. The maximum error percentage for the cutting force was 18.1% for the LAG model and 9.4% for the case of the ALE model. The ALE model proved more accurate because of the adaptive meshing technique for predicting the simulated cutting forces.
The current research compares the machining simulation capabilities of the FEM and SPH techniques for Al6061-T6 using ABAQUS. The FEM and SPH 3D model results have been compared with the experimental results [28,35,36,37] for cutting forces, shear angle, chip thickness, chip shapes, and chip separation criteria. To the authors’ best knowledge, there is no previous comparison study using FEM and SPH techniques available for Al6061 T6 using ABAQUS in the 3D regime.

2. Finite Element Model Development

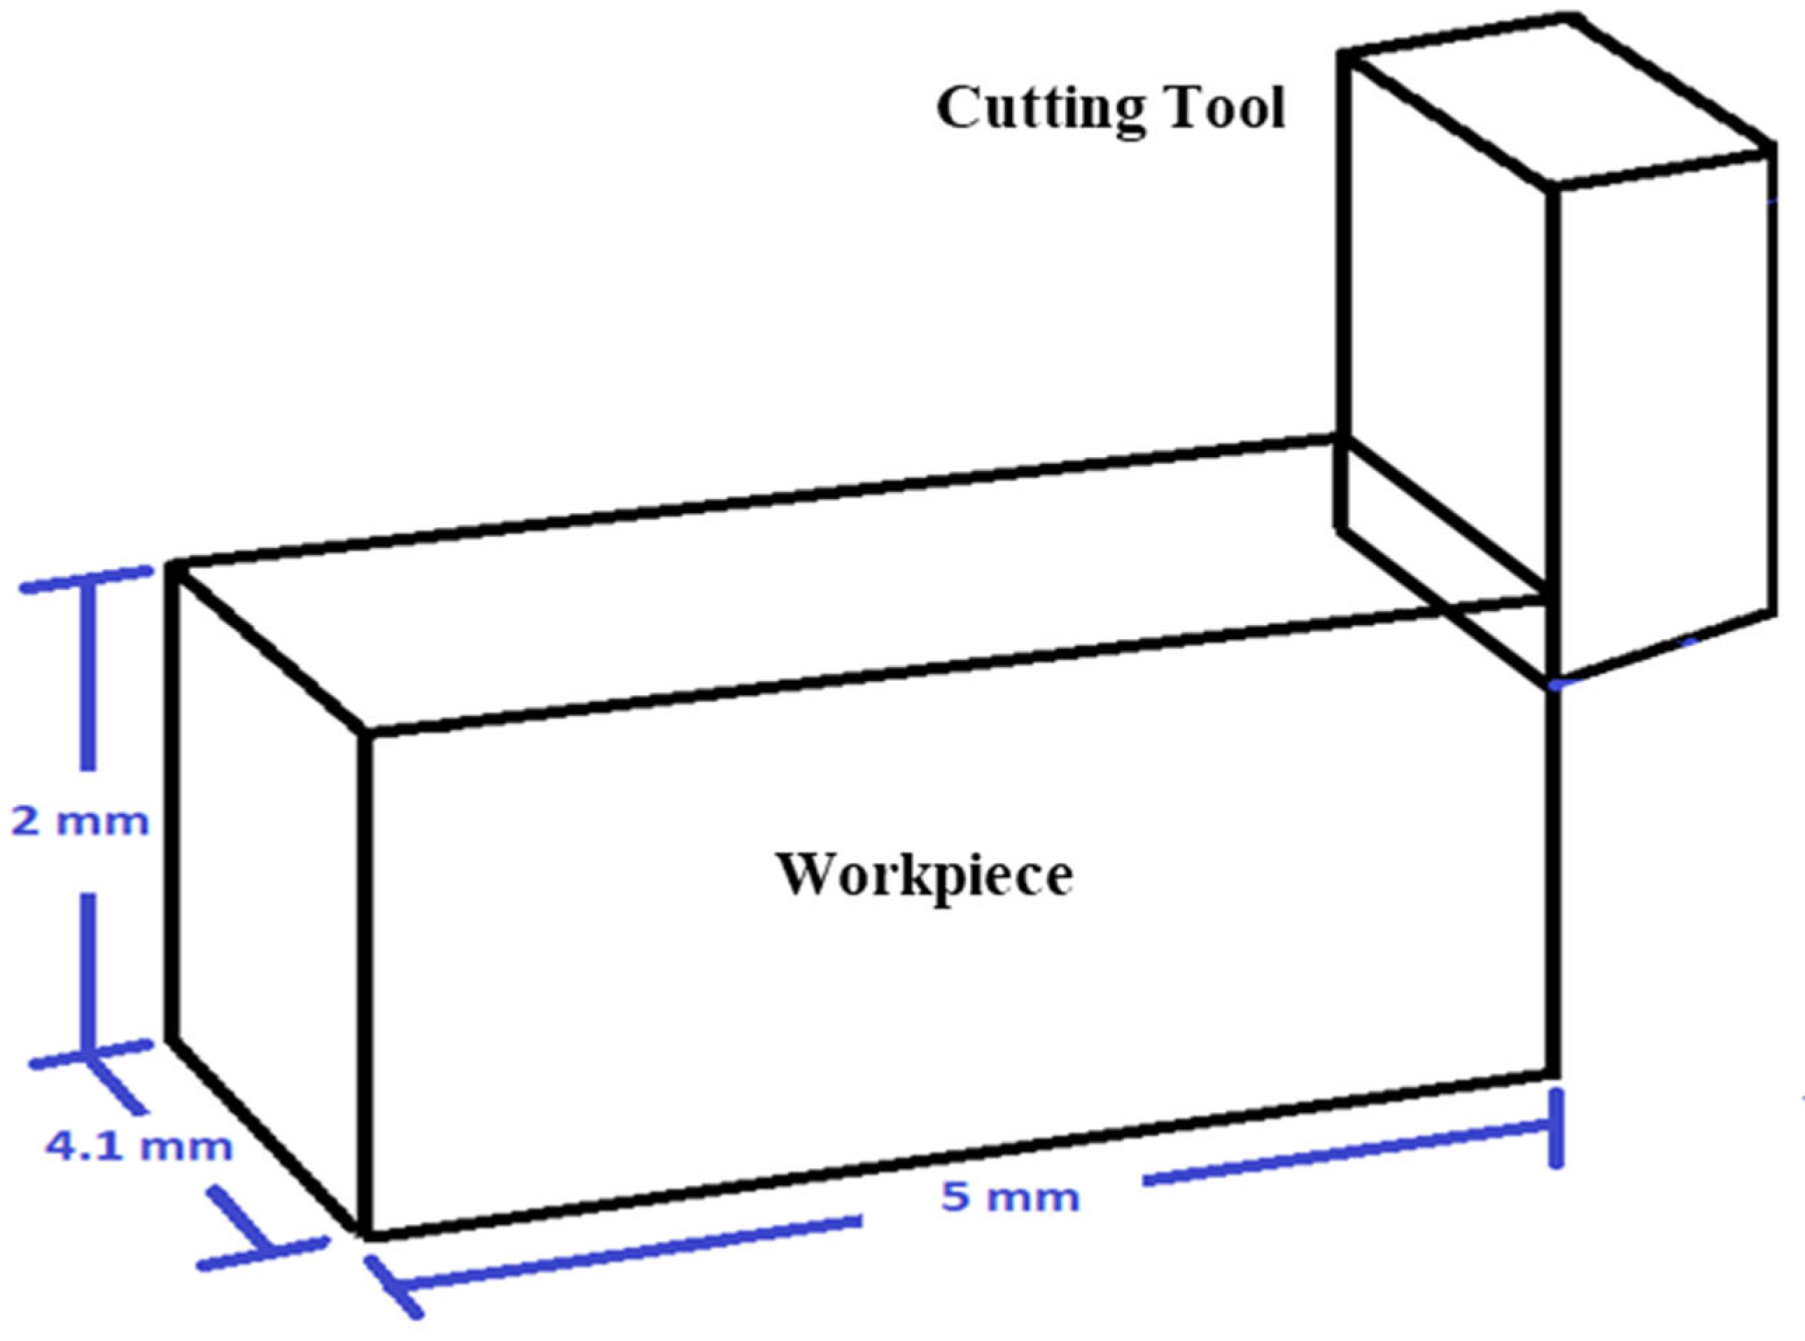
2.1. Model Specifications and Material Model

The workpiece and tool geometry is presented in Figure 2. The workpiece dimensions are set as 5 mm × 2 mm, along with a thickness of 4.1 mm [35,38]. The cutting tool inserts CCMW 09 T3 04-H13A (ISO specification), and has a nose radius of 0.04 mm, and a rake angle and a clearance angle of 0° and 7°, respectively [38,39]. In the current model, the cutting tool is assumed as rigid.
Al6061-T6 is selected for the 3D orthogonal metal cutting. The flow curve for the aforementioned material depends upon strain, strain rate, and temperature [40,41]. The Johnson–Cook material model is utilized for the material behavior characterization of Al6061-T6, as shown in Equation (1) [26,35,42]. The problems where strain rate variation is large are modeled by this visco-plastic material model [10,15,34].
σ ¯ = A + B ε n 1 + C ln ε ¯ ε ¯ 1 T T r o o m T m e l t T r o o m m  
The Johnson–Cook material model parameters are defined as:
σ ¯ = equivalent stress     A = initial yield stress (MPa)
ε ¯ = equivalent plastic strain    B = hardening modulus
ε ¯ = plastic strain rate        n = work hardening exponent
ε ¯ = reference strain rate      C = strain rate dependency coefficient (MPa)
Troom = room temperature     m = thermal softening coefficient
Tmelt = melting temperature
The Johnson–Cook parameter values, with the physical properties of Al6061-T6 used for the material characterization, are mentioned in Table 1.
The physical properties of the workpiece Al6061 and the Johnson–Cook material law parameters are kept the same for the SPH model and the lagrangian model.

2.2. Damage Initiation Criterion

The Johnson–Cook failure model [42,43] is used in Abaqus/Explicit for simulating chip separation. The damage constants are listed in Table 2. Just like the J-C plasticity model, this model also comprises three independent terms representing dynamic fracture strain as a function of pressure, strain, strain rate, and temperature, as shown in Equation (2) [35,44].
ε f ¯ = D 1 + D 2 exp D 3 P σ ¯ 1 + D 4 ln ε ¯ ε o ¯ 1 + D 5 θ θ r o o m θ m e l t θ r o o m
When damage constraint D exceeds the value of 1.0, failure is assumed to occur and is given by:
D = Δ ε ¯ Δ ε f
where D1D5 represents material constants for damage parameters, and Δ ε ¯ is the increment in equivalent plastic strain and the equivalent strain at failure [46]. Chip formation simulation is usually carried out by the JC failure damage model [47].
The same JC failure model has been utilized in SPH with the same damage parameters. The JC failure model has been used in SPH by other researchers as well for the simulation of the machining process [48].

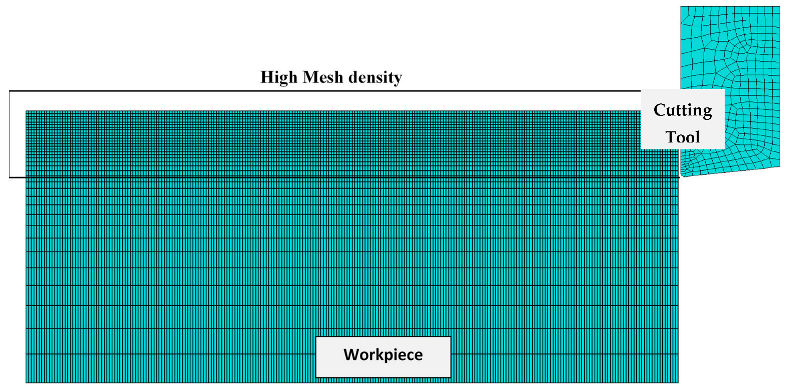
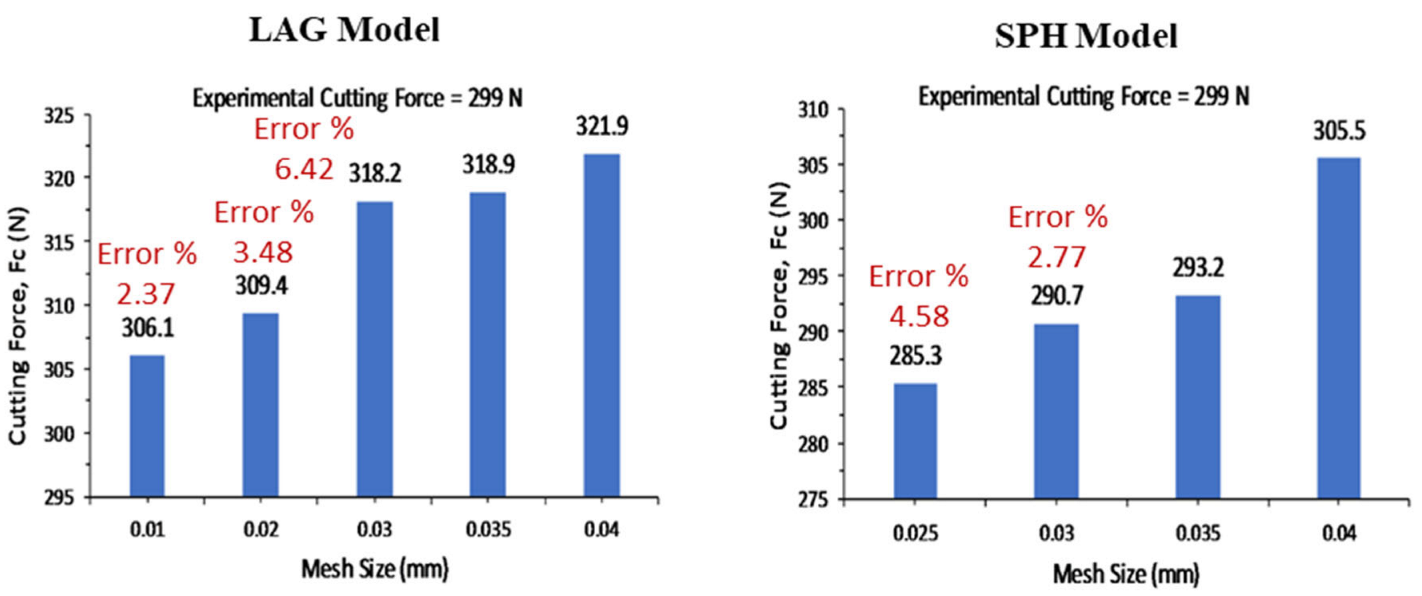
2.3. Meshing and Mesh Convergence

The element type has been set as 3D stress with an explicit time integration scheme in the present case. This resulted in eight-node liner brick elements with ‘reduced integration’ and ‘hourglass control’. The use of distortion control can prevent extreme deformations as it prevents the negative element volumes. However, as per the literature, enhanced hourglass mode has been utilized to prevent the hourglass effect, as the enhanced hourglass control works better for first-order solid elements with reduced integration [49,50]. The total number of elements varies for different feed rates. The total number of elements for the workpiece was 369,237, with an element size of 0.02 mm in the cutting region. The workpiece meshing is shown in Figure 3. The sizing controls have been used along the vertical edges of the workpiece to keep the element count low without affecting the accuracy of the results. The total number of elements for the tool consists of 4108 elements and 4956 nodes.
The whole model is defined with lagrangian finite elements, and only the workpiece section of the model is converted to SPH particles at the start of the analysis [50,51]. The workpiece initially meshes with the C3D8R reduced-integration elements, which are converted into PC3D particles at the start of the analysis. The workpiece consists of 369,237 PC3D particles, and SPH particle spacing is set as 0.03 mm. The visualization for SPH particles in the workpiece section is shown in Figure 4. In the case of the SPH technique, the visualization of the tool and workpiece looks the same, as shown in Figure 3. As soon as the analysis starts, the whole workpiece section consisting of lagrangian finite elements becomes converted into SPH particles, as shown in Figure 4, and the tool section remains the same, as shown in Figure 3.
Mesh convergence is performed for both the LAG and SPH models, as shown in Figure 5. The experimental cutting force obtained at cutting velocity = 250 m/min and at f = 0.1 mm/rev is selected as a criterion for the mesh convergence study. The mesh size is 0.02 mm × 0.02 mm for the LAG model based on the mesh convergence study, as seen in Figure 5. The error percentage for this mesh size is 3.48%, while the error percentages for 0.01 mm and 0.03 mm mesh sizes are 2.37% and 6.42%, respectively. The SPH model’s mesh size is 0.03 mm × 0.03 mm based on the mesh convergence study, as seen in Figure 5. The error percentages for 0.025 mm and 0.03 mm mesh sizes are 4.58% and 2.77%, respectively.

2.4. Friction Model

Coulomb’s friction model simulates cutting phenomena in the lagrangian model [52,53,54]. In the present study, the contact between the cutting tool chip has been defined using the surface-to-node contact model in Abaqus/Explicit 6.14, as shown in Equation (3) [35,52] and Equation (4) [35,52].
τ F = μ σ n , l > l C ( μ σ n < τ Y ) Stick
τ F = τ Y , 0 l l C μ σ n τ Y Slide
Here, “μ” is known as Coulomb’s friction coefficient, and the assumption is made that it is constant for a given interface and “lc” is a part of the contact length characterizing a transitional contact zone [48]. The penalty contact method is used with a friction coefficient equal to 0.15. The value of the friction coefficient matters a lot as it directly controls the value of cutting forces [55].
The same Coulomb’s friction model is utilized for the current SPH simulation of the cutting process with the same value of friction coefficient set to 0.15 to analyze the difference between the values obtained from both techniques [20,22].

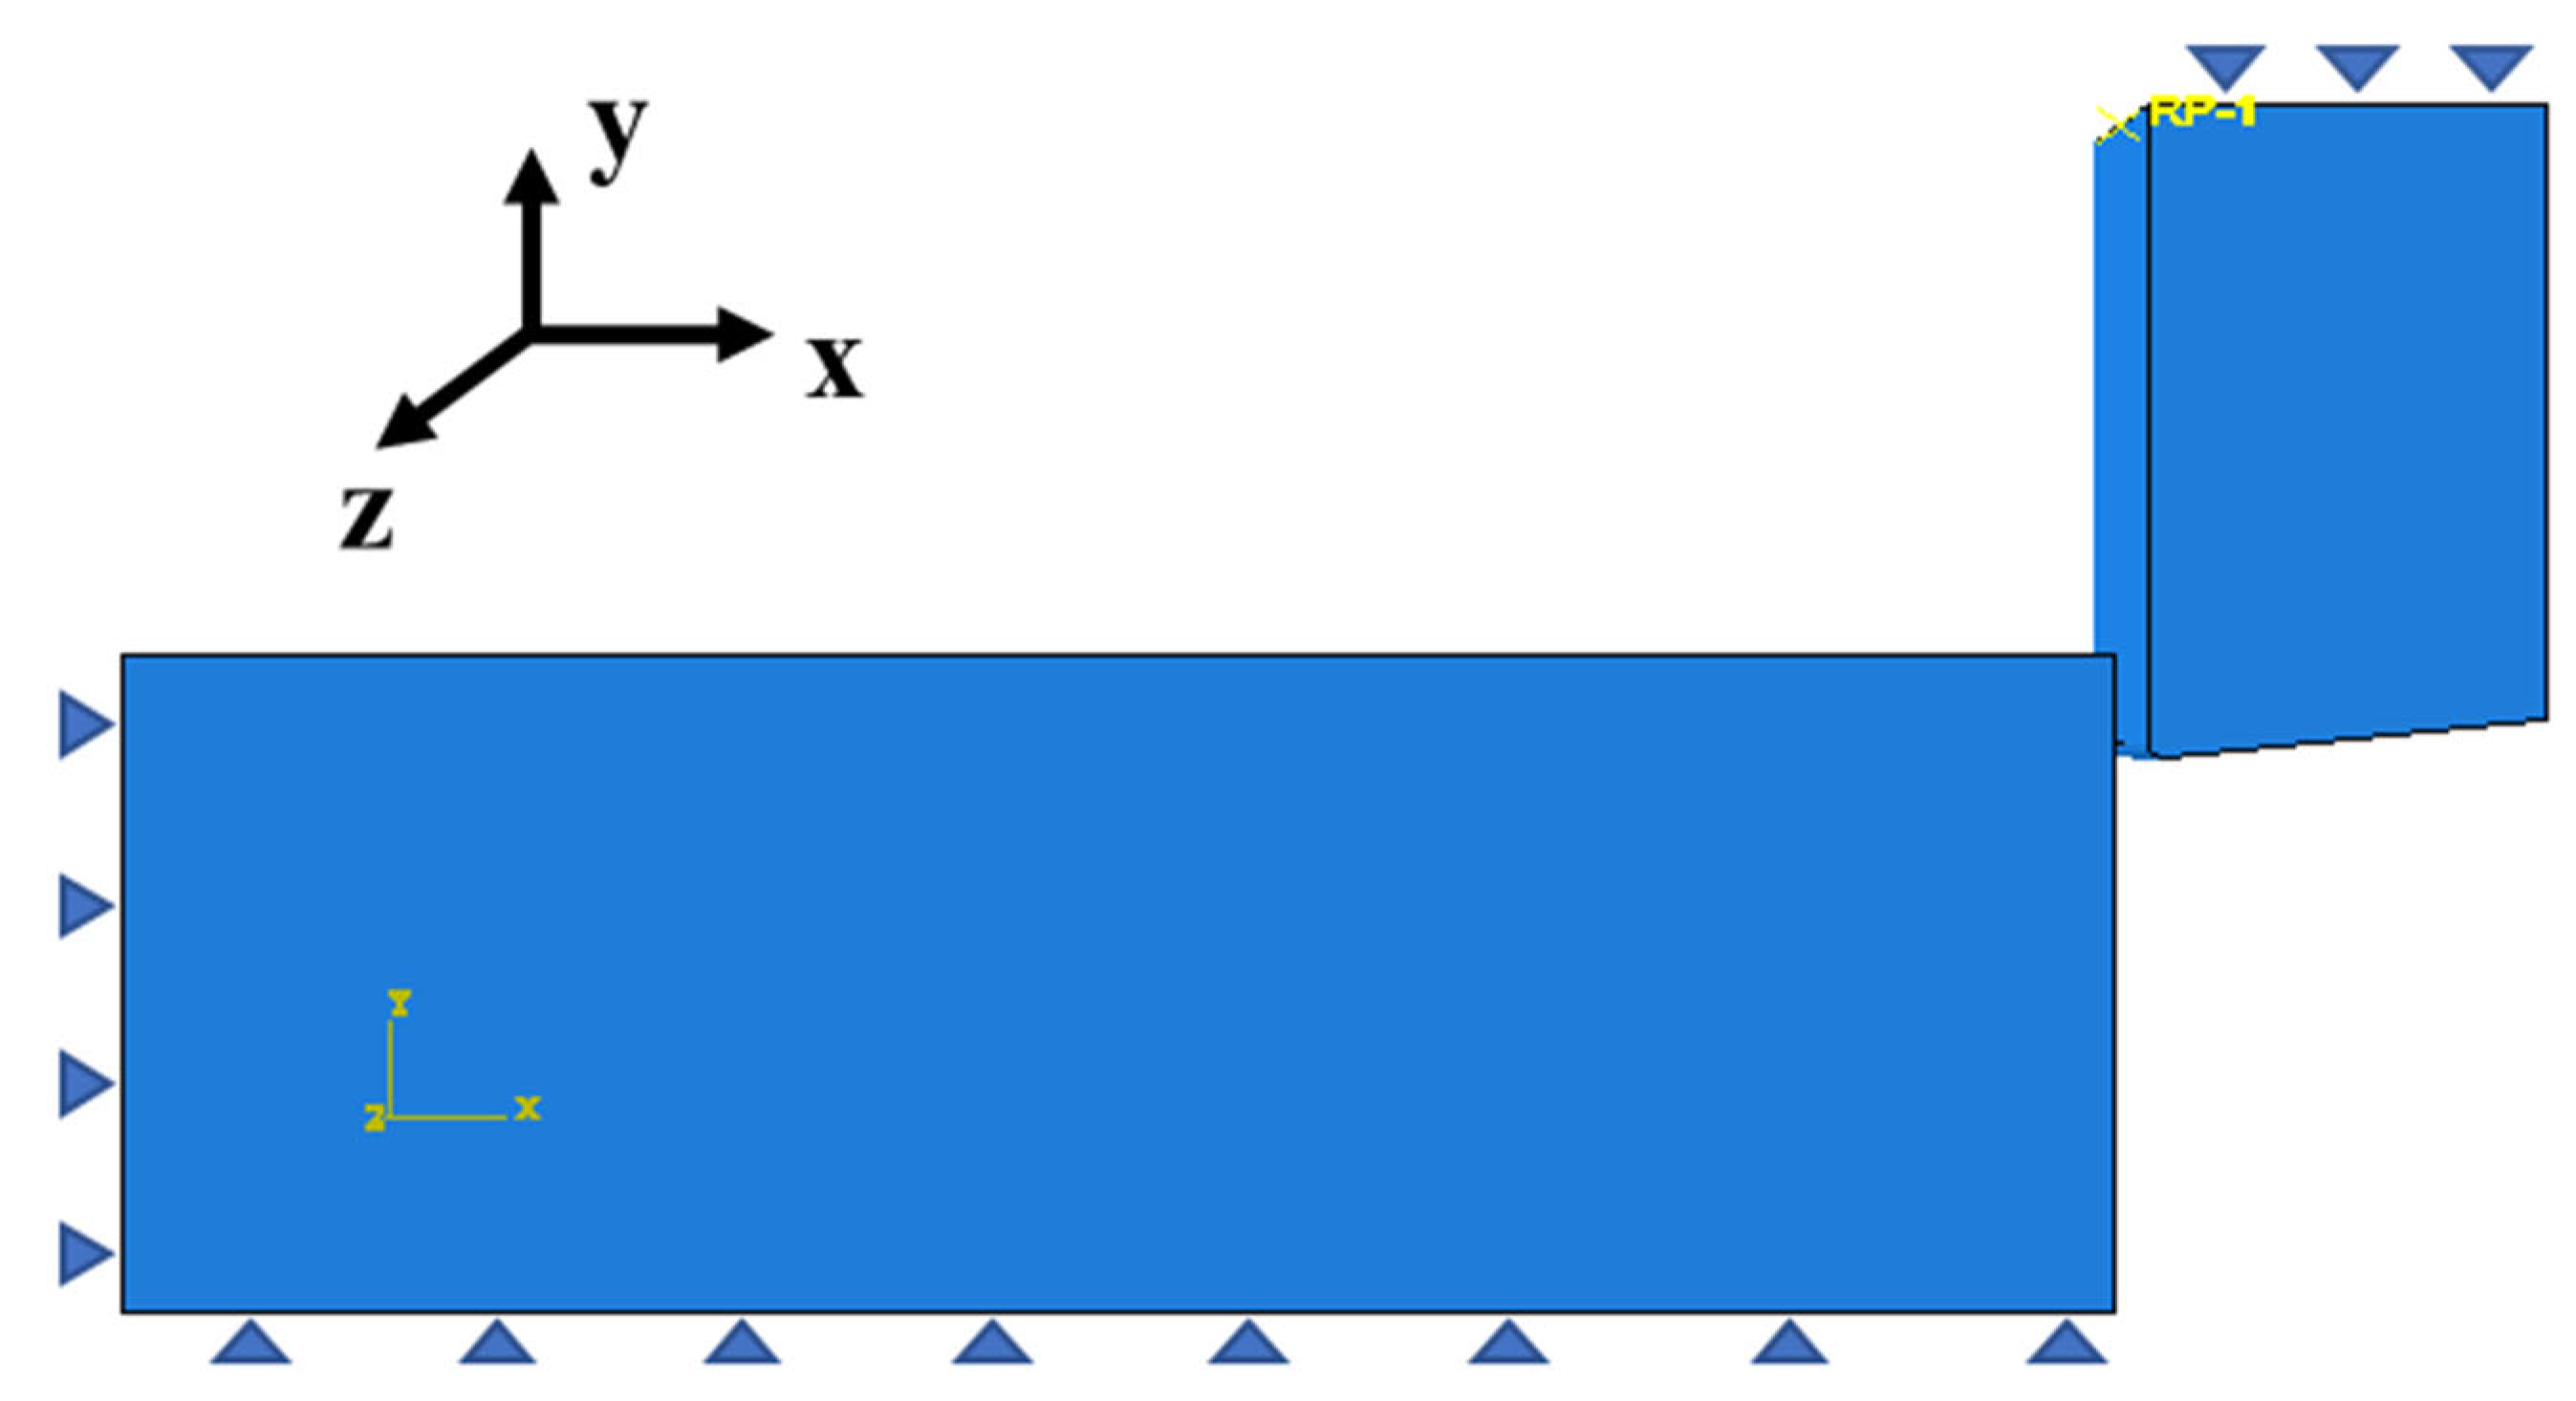
2.5. Boundary Conditions

The lagrangian boundary conditions are applied in the current model in which the mesh follows the material movement to obtain realistic results [56,57]. In the case of 2D machining simulations, mesh distortion has to be controlled via remeshing techniques, while it is an advantage of 3D machining simulations that distortion controls are present to deal with the mesh distortion [58,59].
The tool motion is restricted in the y- and z-directions, and the cutting speed is given to the tool as per the requirement in the x-direction. The workpiece has been restricted from the bottom surface and cannot move in the x- and y-directions [35,36,42]. The node set consisting of all the nodes of the workpiece is given an initial temperature of 20 °C [16]. The boundary conditions for the LAG model are shown in Figure 6.
All the boundary conditions used in the lagrangian model have been kept the same in the SPH model, except for only a single change. The workpiece is constrained in the z-direction to let all the particles participate in the chip formation instead of scattering in the z-direction [1].

3. Results and Discussion

The experimental findings which have been presented belong to other researchers [28,35]. The experimental findings have been included here just for the completeness of the present research work. These data have been used for the validation of the machining simulation results.

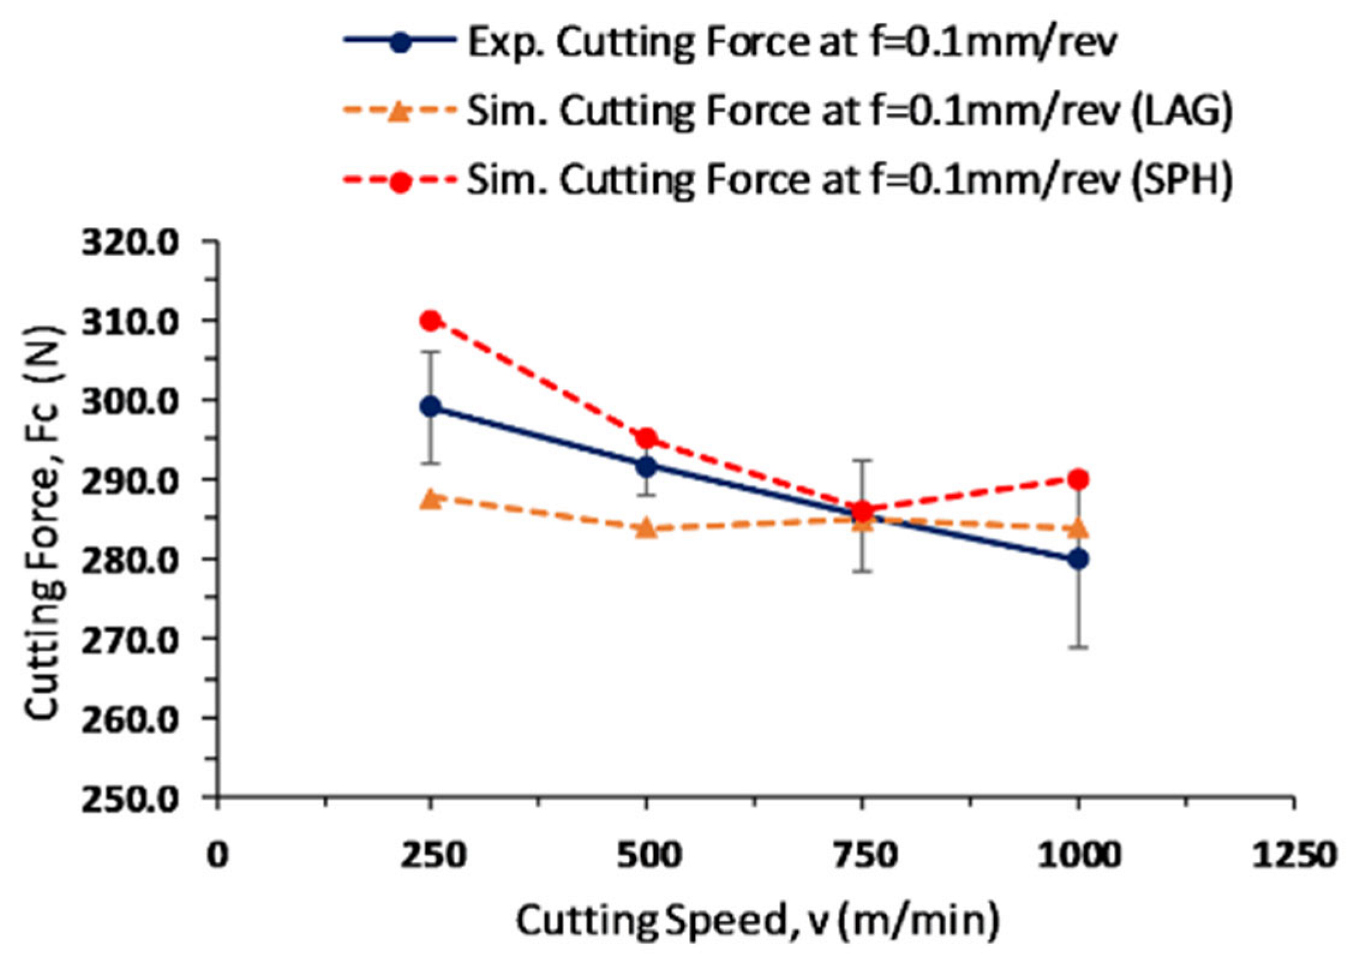
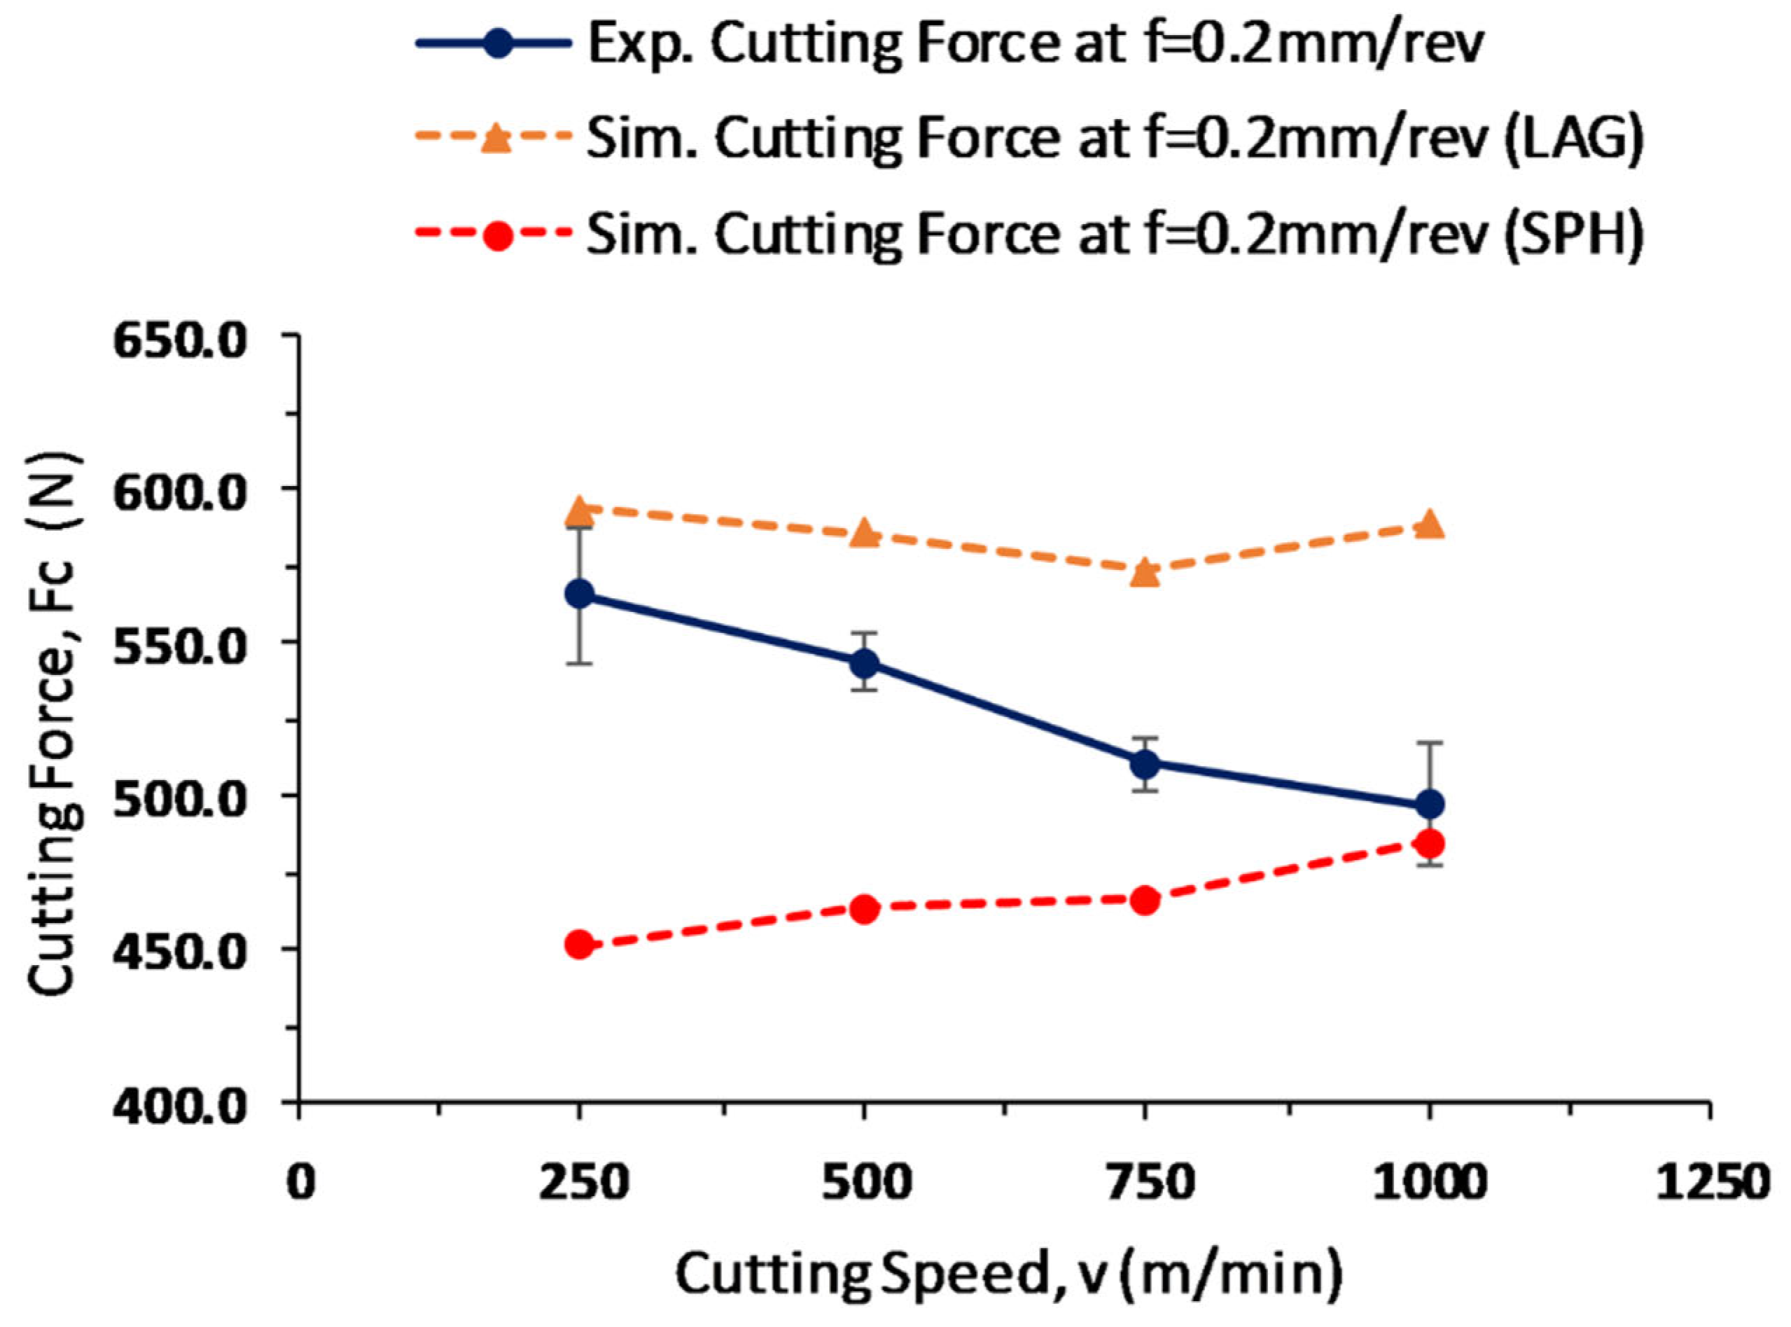
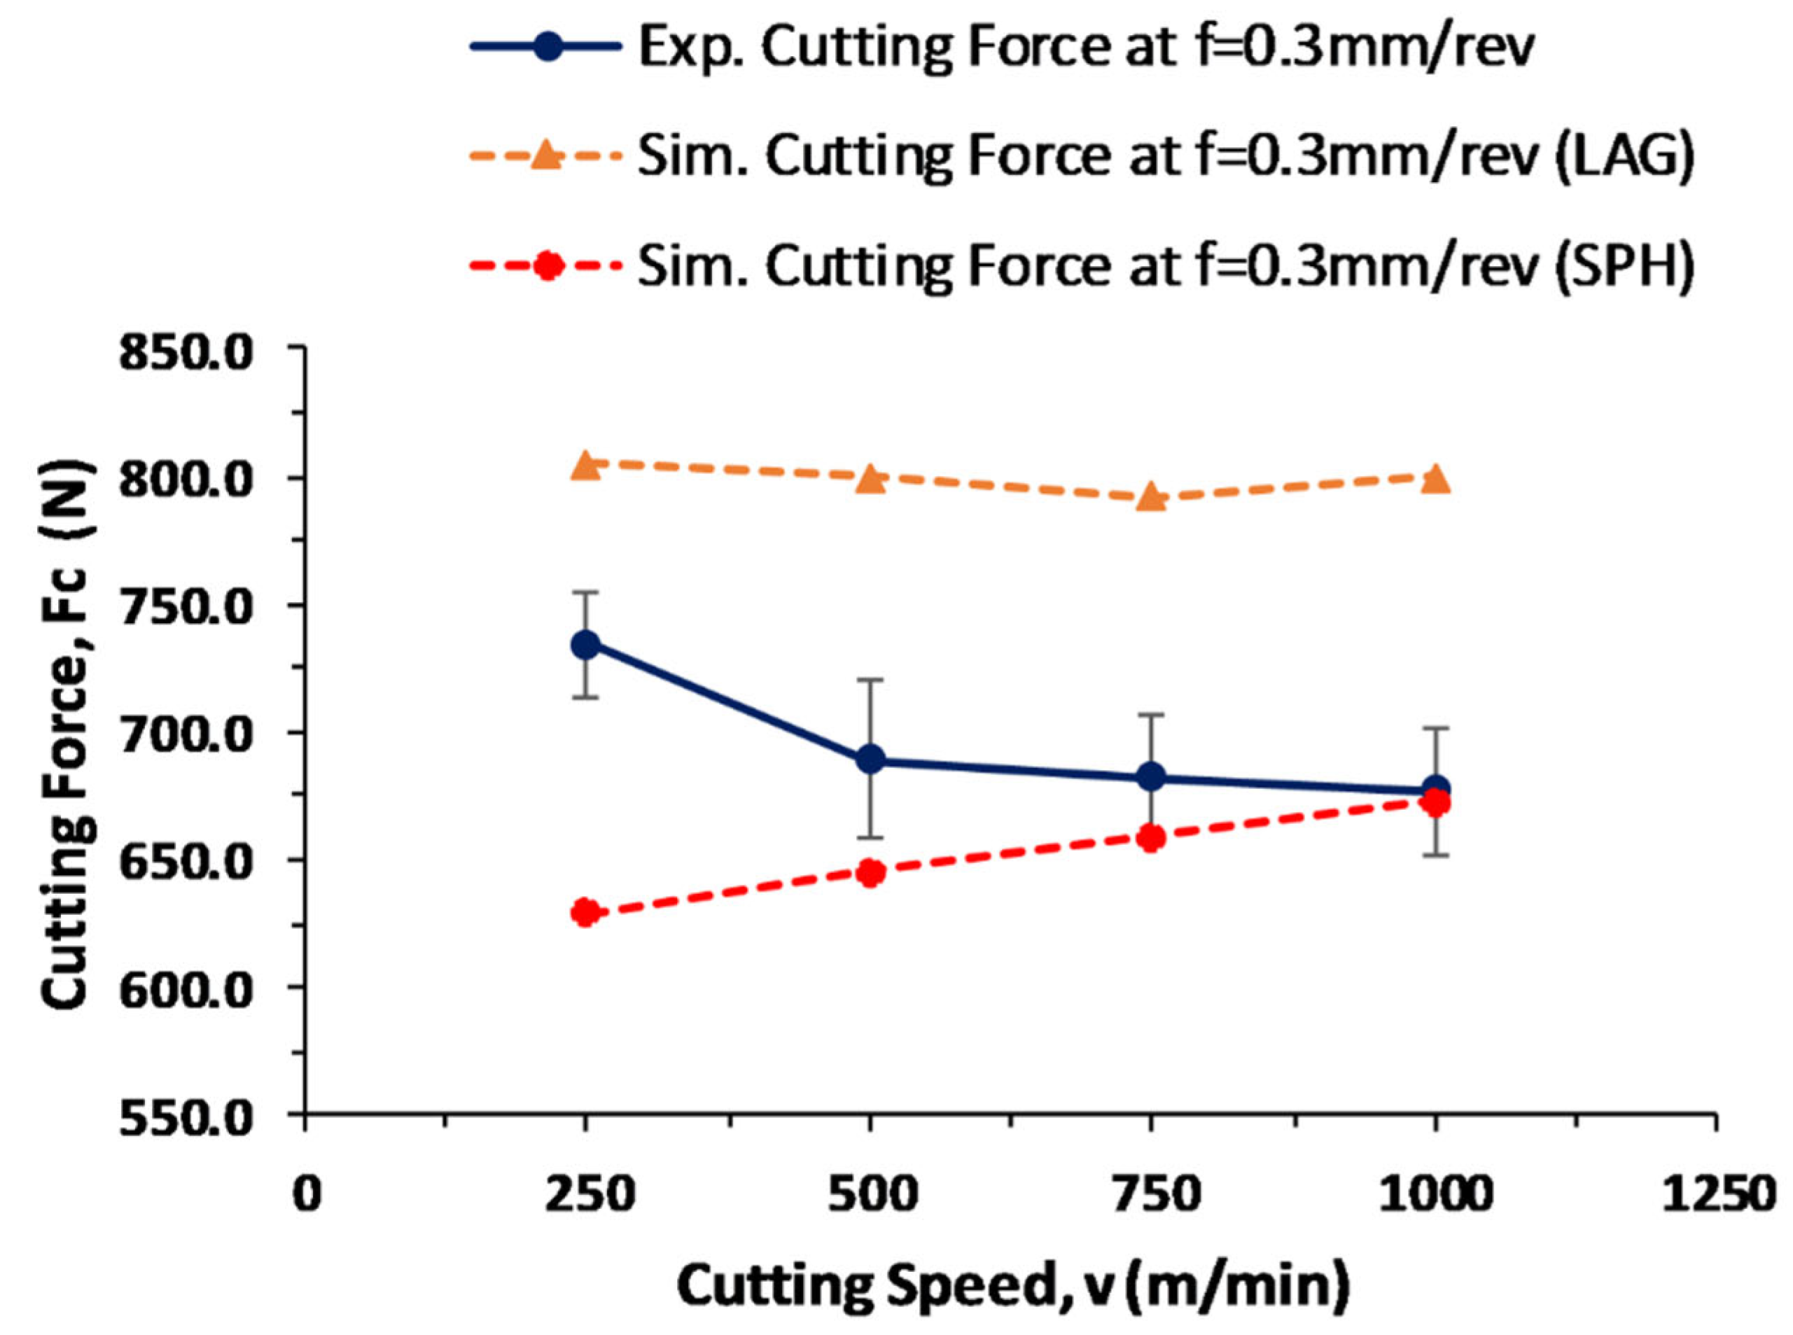
3.1. LAG and SPH Model Results of Cutting Forces

The cutting force values of the experimental work are compared with the simulated cutting forces acquired from the LAG and SPH models, as shown in Figure 7, Figure 8 and Figure 9. The simulated cutting force values are noted when the chip formation reaches a steady state and when the cutting force values deviate less from the mean value. An average value is considered from both models to collect the overall behavior of the cutting forces. The LAG model usually overestimates the cutting force values, which is evident from the current research, and the SPH model underestimates the cutting force values.
The increase in the cutting forces from a feed rate 0.1–0.3 mm/rev is approximately double and triple the magnitude at the feed rate = 0.1 mm/rev [60]. The reason might be the increase in the cutting area and the increase in the material volume with the increased feed, which provides enough resistance to the cutting tool [61]. The cutting forces decrease with the increase in the cutting speed due to the thermal softening effect ahead of the cutting tool, while keeping the feed rate constant [35], and this behavior has been depicted by the LAG model correctly as compared with the SPH model.
The minimum error percentage in the simulated cutting forces generated by the LAG model for all feed rates is 0.2%, and the maximum error percentage is 18.4%. The LAG model’s error percentage in the simulated cutting forces can be minimized by a sensitivity analysis using friction parameters and the chip separation criterion. The minimum error percentage in the simulated cutting forces generated by the SPH model for all feed rates is 0.2%, and the maximum error percentage is 20.3%. The SPH model does not make use of the friction parameter, so the sensitivity analysis cannot be performed to reduce the error percentage in the simulated cutting forces [1,62].

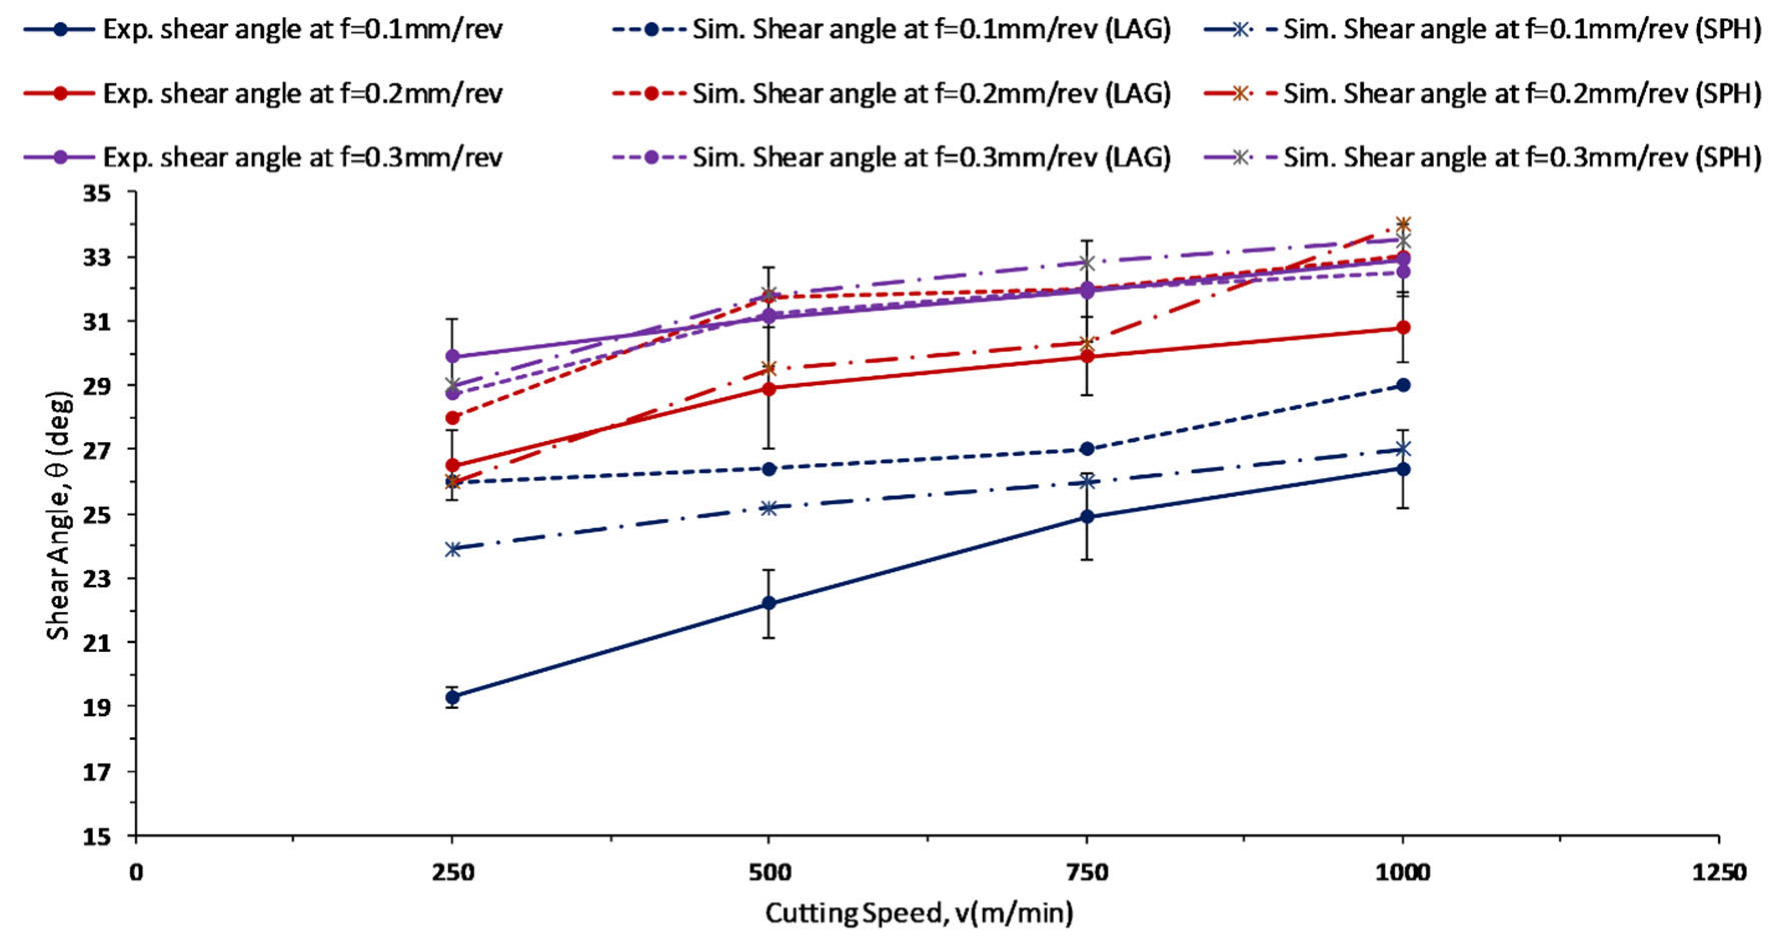
3.2. LAG and SPH Model Results of Shear Angle

The average shear angle values of the experimental work are compared with the simulated shear angle values obtained from the LAG and SPH models, as mentioned in Table 3. The shear angle values in both the LAG and SPH models are obtained as an average of five values from five different places on the chip to measure the average response of the whole chip. The values of the shear angle received from the SPH model agree well with the experimental values at all feed rates, with a minimum error percentage of 1.4% and the maximum error percentage of 23.8% at all feed rates. The difference between the experimental and the simulated shear angle values in the case of the LAG model is more significant at feed rate = 0.1 mm/rev, while it reduces with the increase in feed rate with a minimum error percentage of 0.3% and the maximum error percentage of 34.7%. Moreover, both models have overestimated the shear angle values. However, the gap between the experimental and the simulated results of the LAG and SPH models can be reduced by the appropriate selection of the friction coefficient [63].
The behavior of the shear angle while machining is opposite to that of chip thickness, in that the shear angle values rise with the increase in the cutting speed and the feed rate [25]. The increasing behavior of the shear angle has been predicted well by both LAG and SPH models, as seen in Figure 10.

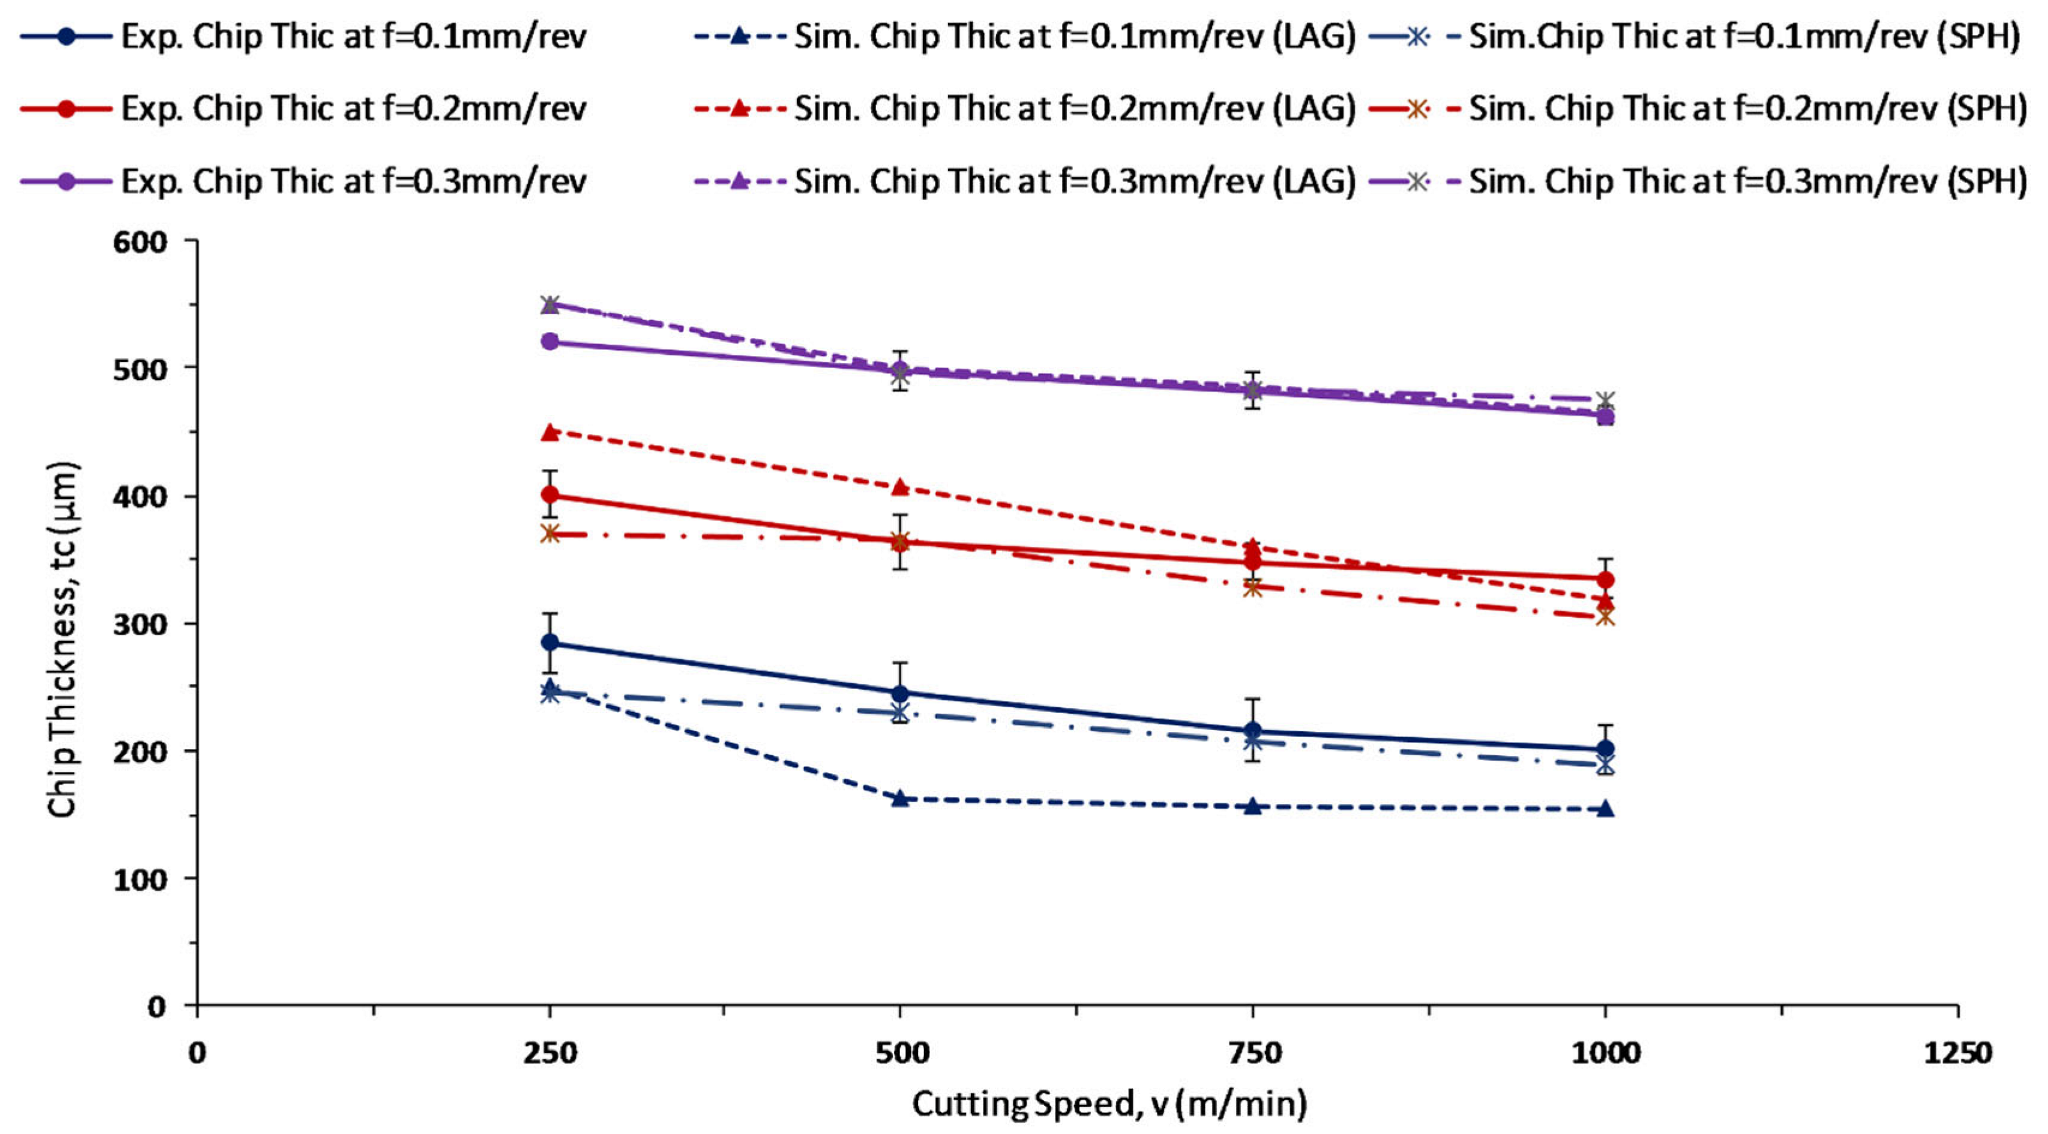
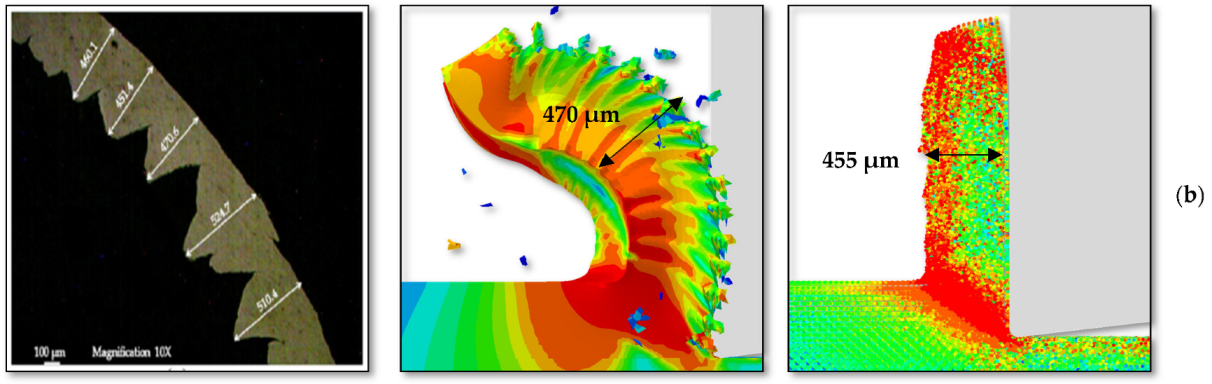
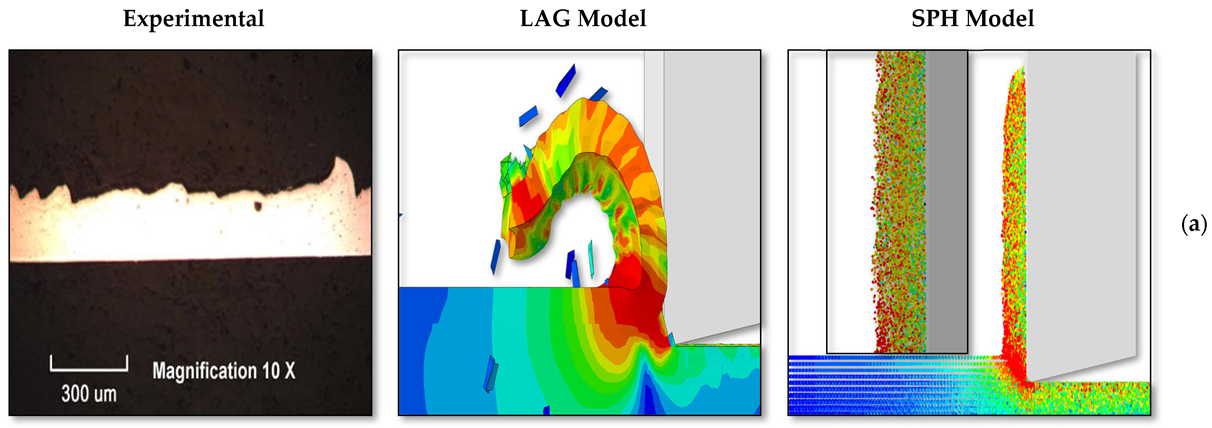
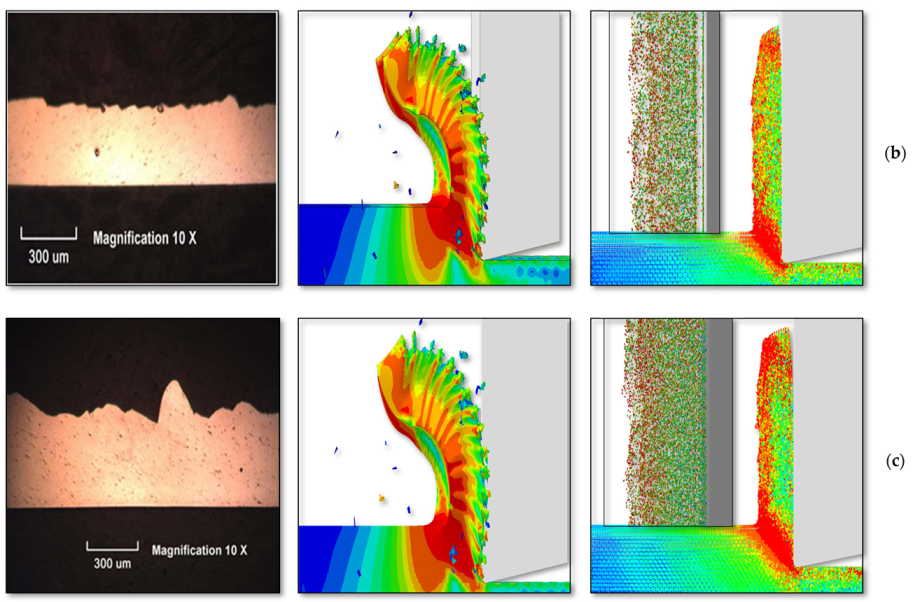
3.3. LAG and SPH Model Results of Chip Thickness

The average chip thickness values of the experimental work are compared with the simulated chip thickness values obtained from LAG and SPH models, mentioned in Table 4. The chip thickness values in both the LAG and SPH models are noted as an average of five values from five different places on the chip to measure the average response of the whole chip. The SPH model predicted the chip thickness values close to the experimental values at all feed rates. The minimum error percentage is 0.1%, and the maximum error percentage is 14.1% in the case of the SPH model. The difference between the experimental and the simulated chip thickness values in the case of the LAG model is more significant at a feed rate of 0.1 mm/rev, while it reduces with the increase in feed rate. The minimum error percentage is 0.6%, and the maximum error percentage is 33.6% in the case of the LAG model. Moreover, the LAG model overestimates the chip thickness values, while the SPH model underestimates the chip thickness values [64]. However, the gap between the experimental and the simulated results of the LAG and SPH models can be reduced by the appropriate selection of the friction coefficient [63].
Moreover, the chip thickness values keep reducing with increased cutting speed [25], as shown by the experimental results in Figure 11. This reducing behavior is predicted correctly by both the LAG and SPH models. The chip thickness comparison at cutting speeds of 250 m/min and 1000 m/min, with feed rates of 0.1 mm/rev and 0.4 mm/rev, respectively, is shown in Figure 12.

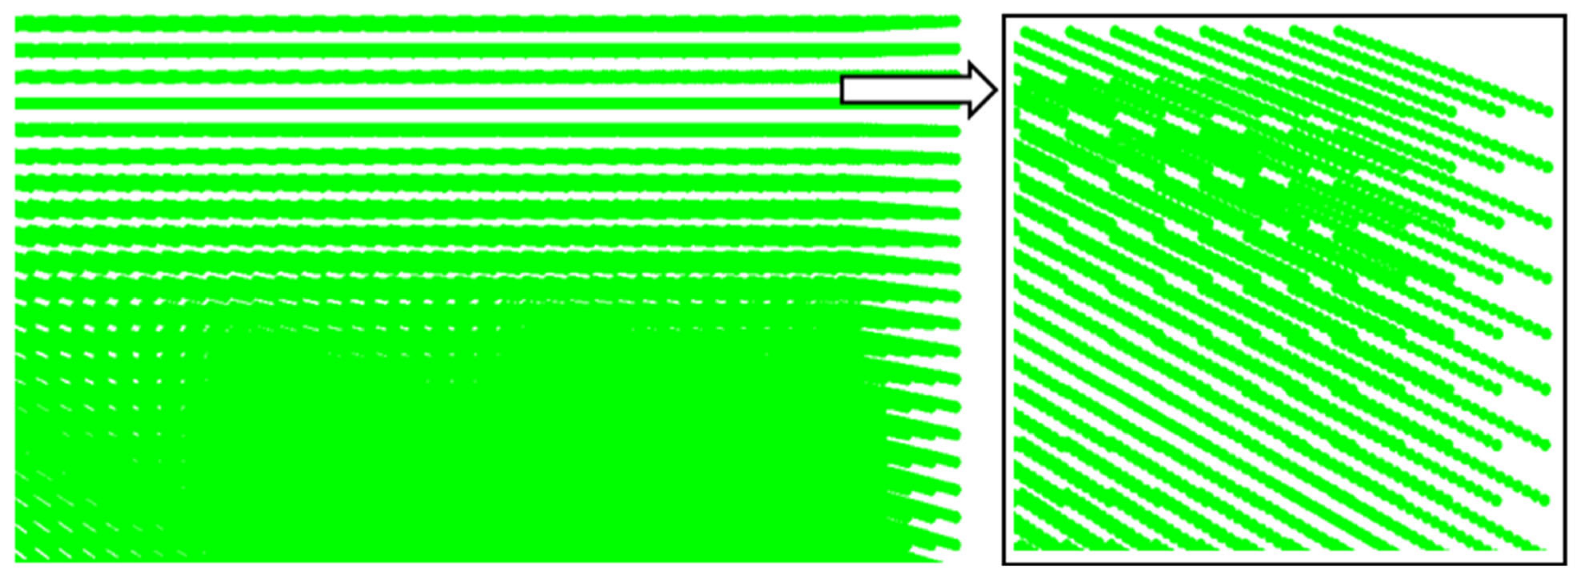
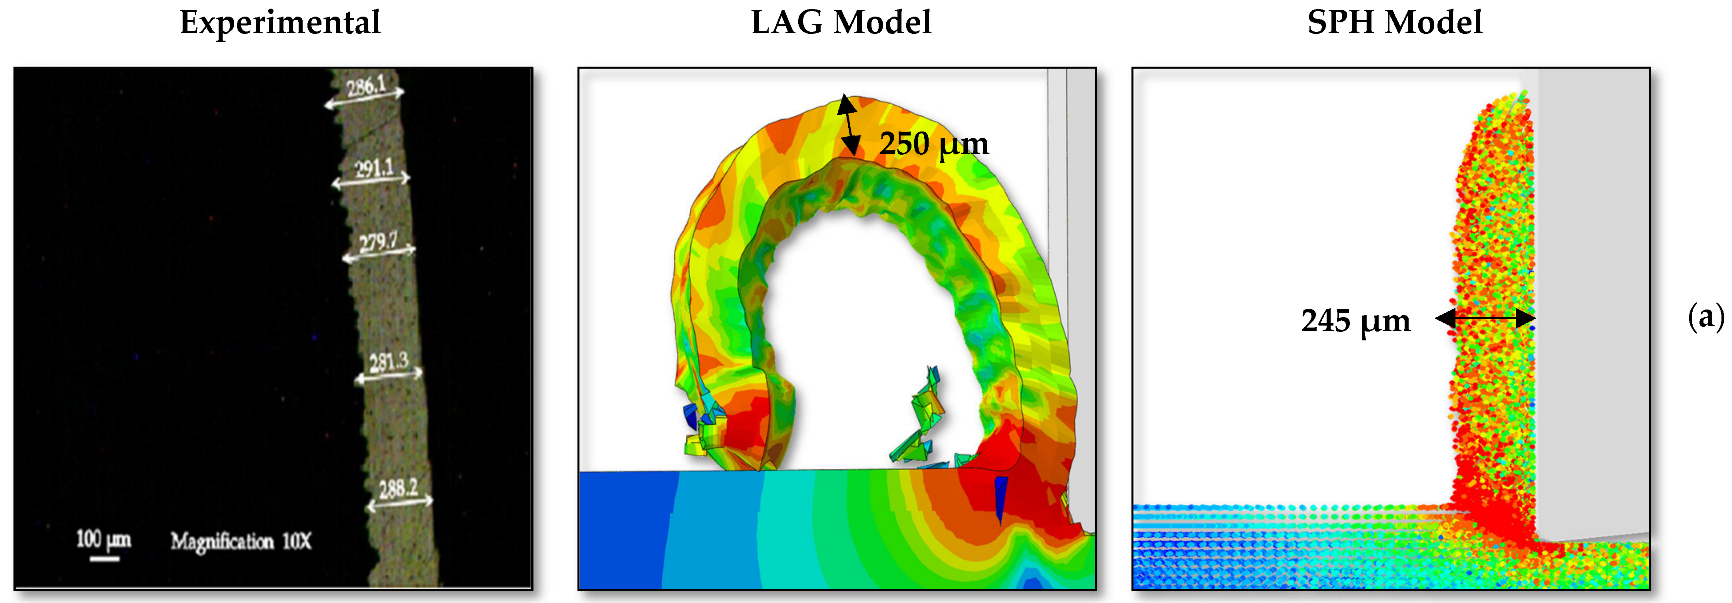
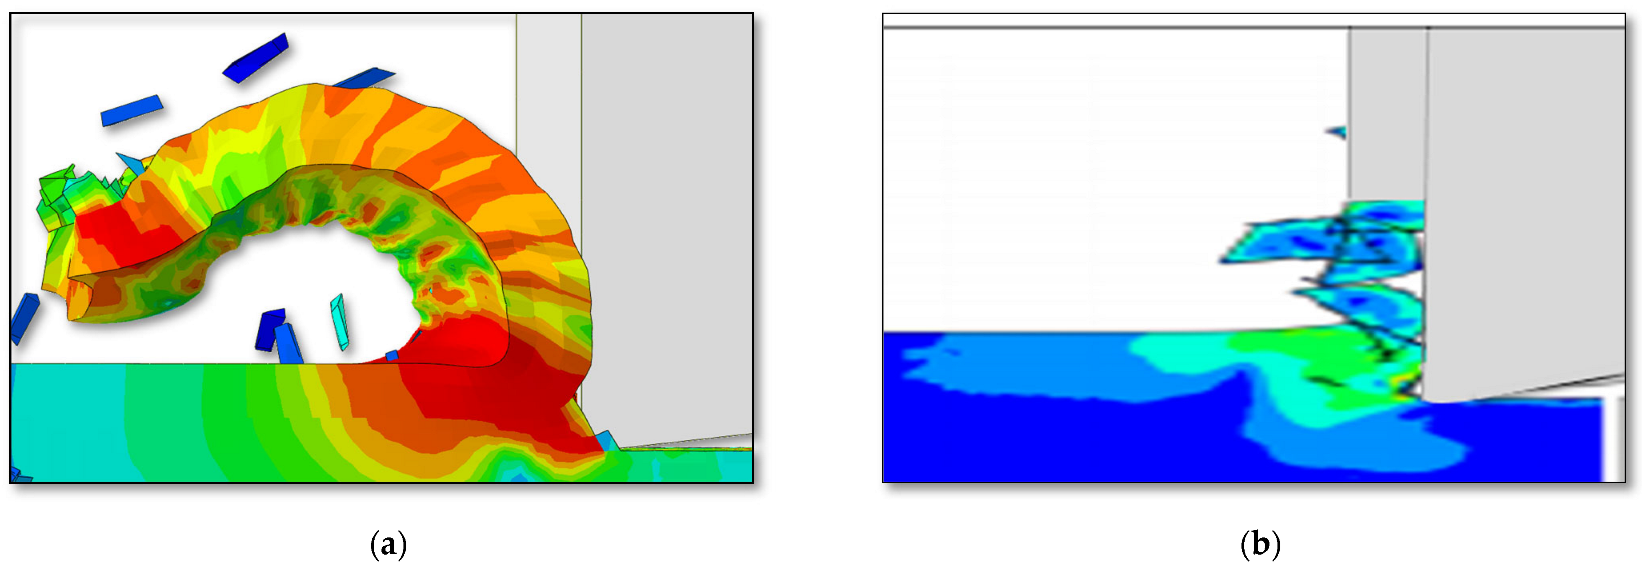
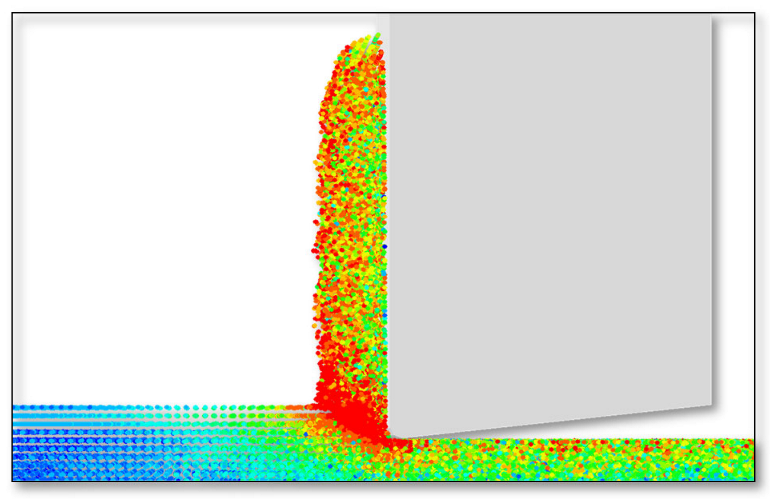
3.4. LAG and SPH Model Results of Chip Morphology

The chip shapes presented in Figure 13 were formed at a cutting speed of 1000 m/min, which is the highest cutting speed in the current research work, and the feed rate varied between 0.1, 0.2, and 0.3 mm/rev. It can be perceived evidently that the lagrangian model prediction for chip shape is quite close to the experimental chip shape, while the chip shape produced through the SPH model fails to produce a curved profile, as in the case of the lagrangian model. The chips produced are continuous, with a shear bands appearing. The continuity of the chips is estimated correctly by both the lagrangian as well as the SPH models, but the SPH model fails to show the shear band effect as prominently as the lagrangian model. The shear band effect is prominent at a feed rate of 0.2 mm/rev and 0.3 mm/rev, but it disappears at a feed rate of 0.1 mm/rev.
The chips obtained through the lagrangian model are curly at a feed rate of 0.1 mm/rev, and become continuous at feed rates of 0.2 and 0.3 mm/rev, as shown in Figure 13a–c. The SPH model fails completely in predicting this behavior.
The effects of tensile instability have also been noticed in the chip obtained through the SPH model, as shown in Figure 14a. The effects of tensile instability dominate at low cutting speeds but reduce at higher ones.

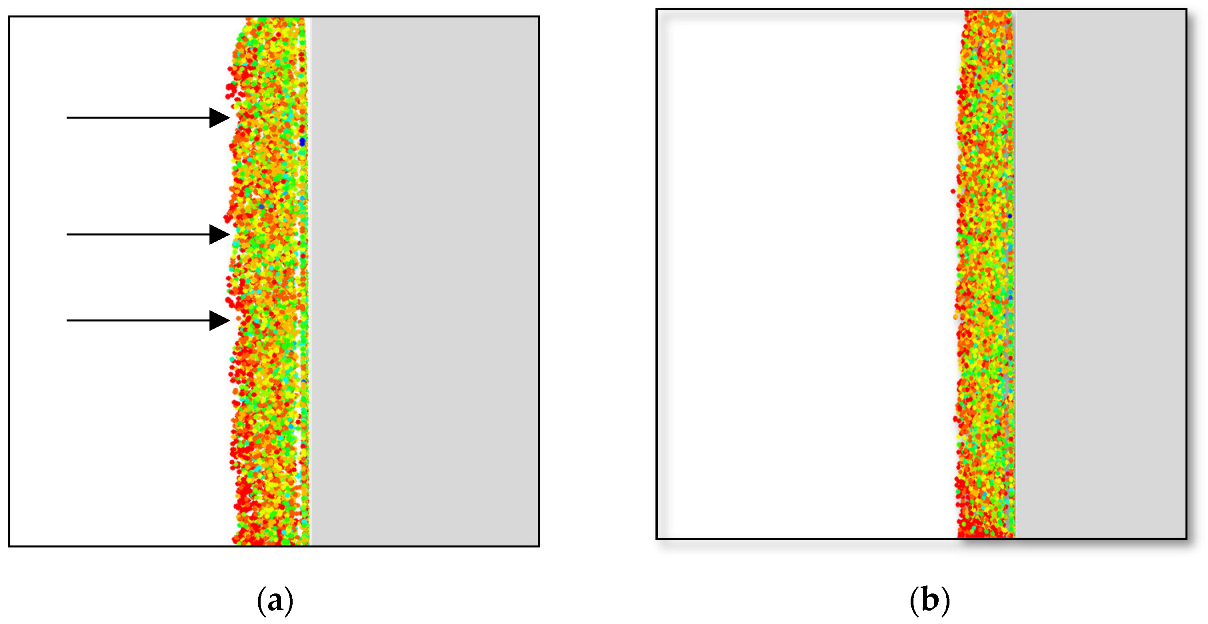
3.5. Chip Separation Criteria

Johnson–Cook’s damage law has been used for both the LAG and SPH models. The damage in the case of the LAG model has been applied only to the sacrificial layer, and the remaining part of the workpiece has been given no damage. The resulting chip is shown in Figure 15a. The results obtained for all primary variables are appropriate for using this technique. The damage law can be applied to the whole workpiece, but that resulted in discontinuous chips [65], which was not the requirement for the current research work, as shown in Figure 15b.
In the case of the SPH model, the damage law was applied on the whole workpiece, which resulted in non-physical simulation results in some cases, such as chip shape, as shown in Figure 16. The results obtained for other primary variables except the chip shape are satisfactory. If the damage parameters are not specified in the SPH model, it results in discontinuous chips [22], which is not the requirement in the present case.

4. Conclusions

The cutting force results obtained through the LAG model are closer to the experimental results at a low feed rate, i.e., at 0.1 mm/rev. As the feed rate increases and the cutting forces’ approximation gets away from the experimental results, the maximum error percentage in the simulated cutting forces generated by the LAG model for all feed rates is 18.4%. The SPH model approximations regarding the cutting forces have the same behavior at all feed rates, which can be attributed to the quality of the SPH to handle large deformations easily. The maximum error percentage in the simulated cutting forces generated by the SPH model for all feed rates is 20.3%. The SPH model predictions about the shear angle are closer to the experimental results at all feed rates than the LAG model predictions. The chip thickness values are closely approximated to the experimental values by the SPH model at all feed rates, compared with the LAG model. Due to the natural movement of the particles in the SPH model during machining, the particles are not bound to each other during the deformation process, and they approximate the chip thickness in a better way. The chip shape is approximated well by the LAG model, compared with the SPH model. The chip shape produced by the LAG model is in close agreement with the experimental result. The downfall of the SPH model in producing an approximate chip shape to that of the experimental shape is attributed to tensile instability phenomena.

Author Contributions

Formal analysis, M.N.N. and M.A.; Funding acquisition, S.Z.K. and A.A.; Methodology, M.N.N. and E.R.I.M.; Project administration, M.A. and A.A.; Resources, M.A., A.A. and A.A.Z.; Software, M.N.N.; Validation, M.N.N., M.A., A.A., A.A.Z. and E.R.I.M.; Visualization, S.Z.K.; Writing—original draft, S.Z.K.; Writing—review & editing, S.Z.K., M.A., A.A.Z. and E.R.I.M. All authors have read and agreed to the published version of the manuscript.

Funding

This research received no external funding.

Institutional Review Board Statement

Not applicable.

Informed Consent Statement

Not applicable.

Data Availability Statement

Not applicable.

Acknowledgments

The authors would like to express their appreciation for the support provided by the Scientific Research Deanship, Islamic University of Madinah, with Tamayyuz-2 grant number 658.

Conflicts of Interest

The authors declare no conflict of interest.

References

  1. Limido, J.; Espinosa, C.; Salaün, M.; Lacome, J.-L. A new approach of high speed cutting modelling: SPH method. In Proceedings of the 8th International Conference on Mechanical and Physical Behaviour of Materials under Dynamic Loading, Dijon, France, 26 July 2006. [Google Scholar]
  2. Wu, Z.; Buck, D.; Jin, D.; Guo, X.; Cao, P.; Zhu, Z. Investigation on Milling Quality of Stone–Plastic Composite Using Response Surface Methodology. JOM 2022, 74, 2063–2070. [Google Scholar] [CrossRef]
  3. Borsos, B.; Csörgő, A.; Hidas, A.; Kotnyek, B.; Szabó, A.; Kossa, A.; Stépán, G. Two-Dimensional Finite Element Analysis of Turning Processes. Period. Polytech. Mech. Eng. 2017, 61, 44–54. [Google Scholar] [CrossRef]
  4. İynen, O.; Ekşi, A.K.; Özdemir, M.; Akyıldız, H.K. Experimental and numerical investigation of cutting forces during turning of cylindrical AISI 4340 steel specimens. Mater. Test. 2021, 63, 402–410. [Google Scholar] [CrossRef]
  5. Niu, Z.; Jiao, F.; Cheng, K. Investigation on Innovative Dynamic Cutting Force Modelling in Micro-milling and Its Experimental Validation. Nanomanufacturing Metrol. 2018, 1, 82–95. [Google Scholar] [CrossRef]
  6. Rajashekhar Reddy, S.; Kumar, M.S.; Vasu, V. Temperature study in Turning Inconel-718: 3D Simulation and Experimentation. Mater. Today Proc. 2017, 4, 9946–9950. [Google Scholar] [CrossRef]
  7. Korkmaz, M.E.; Yaşar, N.; Günay, M. Finite Element Modeling of Residual Stresses and Cutting Temperature in Hard Turning. In Proceedings of the International Conference on Engineering and Natural Sciences, Sarajevo, Bosnia and Herzegovina, 24–28 May 2016. [Google Scholar]
  8. Elkaseer, A.; Abdelaziz, A.; Saber, M.; Nassef, A. FEM-Based Study of Precision Hard Turning of Stainless Steel 316L. Materials 2019, 12, 2522. [Google Scholar] [CrossRef] [Green Version]
  9. Silva, T.F.d.; Soares, R.B.; Jesus, A.M.P.; Rosa, P.A.R.; Reis, A. Simulation Studies of Turning of Aluminium Cast Alloy Using PCD Tools. Procedia CIRP 2017, 58, 555–560. [Google Scholar] [CrossRef]
  10. Sekhar, C.G.; Sarika, N.; Marimuthu, K.P. Numerical Simulation of Sequential orthogonal cutting of Aluminium 6061 Alloy. IOP Conf. Ser. Mater. Sci. Eng. 2018, 377, 012016. [Google Scholar] [CrossRef] [Green Version]
  11. Liu, L.; Wu, M.; Li, L.; Cheng, Y. FEM Simulation and Experiment of High-Pressure Cooling Effect on Cutting Force and Machined Surface Quality During Turning Inconel 718. Integr. Ferroelectr. 2020, 206, 160–172. [Google Scholar] [CrossRef]
  12. Ebrahimi, S.; Araee, A.; Hadad, M. Investigation of the effects of constitutive law on numerical analysis of turning processes to predict the chip morphology, tool temperature, and cutting force. Int. J. Adv. Manuf. Technol. 2019, 105, 4245–4264. [Google Scholar] [CrossRef]
  13. Asad, M.; Mabrouki, T. On the turning modeling and simulation: 2D and 3D FEM approaches. Mech. Ind. 2014, 15, 427–434. [Google Scholar] [CrossRef]
  14. Segebade, E.; Gerstenmeyer, M.; Zanger, F.; Schulze, V. Cutting Simulations Using a Commercially Available 2D/3D FEM Software for Forming. Procedia CIRP 2017, 58, 73–78. [Google Scholar] [CrossRef]
  15. Xiong, Y.; Wang, W.; Jiang, R.; Lin, K.; Shao, M. Mechanisms and FEM simulation of chip formation in orthogonal cutting in-situ TiB2/7050Al MMC. Materials 2018, 11, 606. [Google Scholar] [CrossRef] [Green Version]
  16. Hardt, M.; Bergs, T. Three Dimensional Numerical Modeling of Face Turning Using the Coupled-Eulerian-Lagrangian Formulation. Procedia CIRP 2021, 102, 162–167. [Google Scholar] [CrossRef]
  17. İynen, O.; Ekşi, A.K.; Akyıldız, H.K.; Özdemir, M. Real 3D turning simulation of materials with cylindrical shapes using ABAQUS/Explicit. J. Braz. Soc. Mech. Sci. Eng. 2021, 43, 374. [Google Scholar] [CrossRef]
  18. Sadeghifar, M.; Sedaghati, R.; Jomaa, W.; Songmene, V. Finite element analysis and response surface method for robust multi-performance optimization of radial turning of hard 300M steel. Int. J. Adv. Manuf. Technol. 2018, 94, 2457–2474. [Google Scholar] [CrossRef]
  19. Asad, M.; Ijaz, H.; Saleem, W.; Mahfouz, A.S.B.; Ahmad, Z.; Mabrouki, T. Finite Element Analysis and Statistical Optimization of End-Burr in Turning AA2024. Metals 2019, 9, 276. [Google Scholar] [CrossRef] [Green Version]
  20. Limido, J.; Espinosa, C.; Salaün, M.; Lacome, J.L. SPH method applied to high speed cutting modelling. Int. J. Mech. Sci. 2007, 49, 898–908. [Google Scholar] [CrossRef] [Green Version]
  21. Espinosaa, C.; Lacomeb, J.L.; Limidoc, J.; Salauna, M.; Mabrua, C.; Chieragattia, R. Modeling High Speed Machining with the SPH Method. In Proceedings of the 10th International LS-DYNA® Users Conference, Detroit, MI, USA, 8–10 June 2008. [Google Scholar]
  22. Madaj, M.; Píška, M. On the SPH Orthogonal Cutting Simulation of A2024-T351 Alloy. Procedia CIRP 2013, 8, 152–157. [Google Scholar] [CrossRef] [Green Version]
  23. Ozel, T.; Llanos, I.; Soriano, J.; Arrazola, P.J. 3D Finite Element Modelling of Chip Formation Process for Machining Inconel 718: Comparison of Fe Software Predictions. Mach. Sci. Technol. 2011, 15, 21–46. [Google Scholar] [CrossRef]
  24. Haddag, B.; Atlati, S.; Nouari, M.; Barlier, C.; Zenasni, M. Analysis of the cutting parameters influence during machining aluminium alloy a2024-t351 with uncoated carbide inserts. Eng. Trans. 2012, 60, 31–39. [Google Scholar]
  25. Xu, D.; Feng, P.; Li, W.; Ma, Y.; Liu, B. Research on chip formation parameters of aluminum alloy 6061-T6 based on high-speed orthogonal cutting model. Int. J. Adv. Manuf. Technol. 2014, 72, 955–962. [Google Scholar] [CrossRef]
  26. Daoud, M.; Jomaa, W.; Chatelain, J.F.; Bouzid, A. A machining-based methodology to identify material constitutive law for finite element simulation. Int. J. Adv. Manuf. Technol. 2015, 77, 2019–2033. [Google Scholar] [CrossRef]
  27. Zhu, L.; Jin, X.; Liu, C. Experimental investigation on 3D chip morphology properties of rotary surface during orthogonal turn-milling of aluminum alloy. Int. J. Adv. Manuf. Technol. 2016, 84, 1253–1268. [Google Scholar] [CrossRef]
  28. Akram, S.; Imran, H.; Khan, M.; Mubashar, A.; Warsi, S.; Riaz, U. A numerical investigation and experimental validation on chip morphology of Aluminum Alloy 6061 during orthogonal machining. In Proceedings of the 2016 Moratuwa Engineering Research Conference (MERCon), Moratuwa, Sri Lanka, 5–6 April 2016. [Google Scholar]
  29. Zhu, Z.; Buck, D.; Wu, Z.; Yu, Y.; Guo, X. Frictional behaviour of wood-Plastic composites against cemented carbide during sliding contact. Wood Mater. Sci. Eng. 2022, 1–7. [Google Scholar] [CrossRef]
  30. Xu, W.; Wu, Z.; Lu, W.; Yu, Y.; Wang, J.; Zhu, Z.; Wang, X. Investigation on Cutting Power of Wood–Plastic Composite Using Response Surface Methodology. Forests 2022, 13, 1397. [Google Scholar] [CrossRef]
  31. Zhu, Z.; Jin, D.; Wu, Z.; Xu, W.; Yu, Y.; Guo, X.; Wang, X. Assessment of Surface Roughness in Milling of Beech Using a Response Surface Methodology and an Adaptive Network-Based Fuzzy Inference System. Machines 2022, 10, 567. [Google Scholar] [CrossRef]
  32. Zhu, Z.; Buck, D.; Wu, Z.; Wang, J.; Guo, X.; Zhu, M. Built-up edge formation mechanisms in orthogonal cutting of wood-plastic composite. Wood Mater. Sci. Eng. 2022, 17, 388–396. [Google Scholar] [CrossRef]
  33. Bashistakumar, M.; Pushkal, B. Finite Element Analysis of Orthogonal Cutting Forces in Machining AISI 1020 Steel Using a Carbide Tip Tool. J. Eng. Sci. 2018, 5, A1–A10. [Google Scholar] [CrossRef]
  34. Soliman, H.; El-Hossainy, T.; Abdrabou, M. Finite Element Method Based Modeling for Cutting Force Predication in Orthogonal Cutting Process. SAST 2017, 11, 1–14. [Google Scholar]
  35. Akram, S.; Jaffery, S.H.I.; Khan, M.; Fahad, M.; Mubashar, A.; Ali, L. Numerical and experimental investigation of Johnson–Cook material models for aluminum (Al 6061-T6) alloy using orthogonal machining approach. Adv. Mech. Eng. 2018, 10, 298–316. [Google Scholar] [CrossRef] [Green Version]
  36. Akram, S.; Uddin, S.; Kazmi, S.W.H.; Jaffery, S.H.I.; Jalil, M.A. Numerical modeling and experimental validation in orthogonal machining of aluminum al 6061-t6 alloy. Mehran Univ. Res. J. Eng. Technol. 2020, 39, 179–194. [Google Scholar] [CrossRef]
  37. Andhare, A.B.; Kannathsan, K.; Funde, M. Finite Element Simulation for Turning of Haynes 25 Super Alloy. In Advances in Mechanical, Engineering; Kalamkar, V.R., Monkova, K., Eds.; Springer: Singapore, 2021. [Google Scholar]
  38. Akram, S.; Jaffery, S.; Khan, M.; Mubashar, A.; Ali, L. A Numerical Investigation of Effects of Cutting Velocity and Feed Rate on Residual Stresses in Aluminum Alloy Al-6061. Int. J. Mater. Mech. Manuf. 2015, 3, 26–30. [Google Scholar] [CrossRef] [Green Version]
  39. Valiorgue, F.; Rech, J. Numerical Modeling of Residual Stresses in Turning of a 27MnCr5 Steel. Procedia CIRP 2016, 45, 331–334. [Google Scholar] [CrossRef] [Green Version]
  40. Boldyrev, I.; Shchurov, I.; Nikonov, A.V. Numerical Simulation of the Aluminum 6061-T6 Cutting and the Effect of the Constitutive Material Model and Failure Criteria on Cutting Forces’ Prediction. Procedia Eng. 2016, 150, 866–870. [Google Scholar] [CrossRef] [Green Version]
  41. Warsi, S.S.; Agha, M.H.; Ahmad, R.; Jaffery, S.H.I.; Khan, M. Sustainable turning using multi-objective optimization: A study of Al 6061 T6 at high cutting speeds. Int. J. Adv. Manuf. Technol. 2019, 100, 843–855. [Google Scholar] [CrossRef]
  42. Murugesan, M.; Jung, W.D. Johnson Cook Material and Failure Model Parameters Estimation of AISI-1045 Medium Carbon Steel for Metal Forming Applications. Materials 2019, 12, 609. [Google Scholar] [CrossRef] [Green Version]
  43. Ijaz, H.; Zain-ul-abdein, M.; Saleem, W.; Asad, M.; Mabrouki, T. Modified Johnson-Cook Plasticity Model with Damage Evolution: Application to Turning Simulation of 2XXX Aluminium Alloy. J. Mech. 2017, 33, 777–788. [Google Scholar] [CrossRef] [Green Version]
  44. Sumesh, C.S.; Ramesh, A. Numerical Modelling and Optimization of Dry Orthogonal Turning of Al6061 T6 Alloy. Period. Polytech. Mech. Eng. 2018, 62, 196–202. [Google Scholar] [CrossRef] [Green Version]
  45. Lesuer, D.; Kay, G.; LeBlanc, M. Modeling Large-Strain, High-Rate Deformation in Metals. In Proceedings of the Third Biennial Tri-Laboratory Engineering Conference on Modeling and Simulation, Pleasanton, CA, USA, 3–5 November 1999. [Google Scholar]
  46. Akbar, F.; Mativenga, P.T.; Sheikh, M.A. An experimental and coupled thermo-mechanical finite element study of heat partition effects in machining. Int. J. Adv. Manuf. Technol. 2009, 46, 491–507. [Google Scholar] [CrossRef]
  47. Zhang, Y. Numerical Simulation Approaches and Methodologies for Multi-Physic Comprehensions of Titanium Alloy (Ti–6Al–4V) Cutting. Ph.D. Thesis, Institut National des Sciences Appliquées, Lyon, France, September 2011. [Google Scholar]
  48. Umer, U.; Qudeiri, J.A.; Ashfaq, M.; AL-Ahmari, A.J.J.o.Z.U.-S.A. Chip morphology predictions while machining hardened tool steel using finite element and smoothed particles hydrodynamics methods. J. Zhejiang Univ. Sci. A 2016, 17, 873–885. [Google Scholar] [CrossRef] [Green Version]
  49. Zhao, W.; Ji, S. Mesh Convergence Behavior and the Effect of Element Integration of a Human Head Injury Model. Ann. Biomed. Eng. 2019, 47, 475–486. [Google Scholar] [CrossRef]
  50. Mohseni-Mofidi, S.; Bierwisch, C. Application of hourglass control to Eulerian smoothed particle hydrodynamics. Comput. Part. Mech. 2021, 8, 51–67. [Google Scholar] [CrossRef]
  51. Shishova, E.; Spreng, F.; Hamann, D.; Eberhard, P. Tracking of material orientation in updated Lagrangian SPH. Comput. Part. Mech. 2019, 6, 449–460. [Google Scholar] [CrossRef]
  52. Laakso, S.V.A.; Agmell, M.; Ståhl, J.-E. The mystery of missing feed force—The effect of friction models, flank wear and ploughing on feed force in metal cutting simulations. J. Manuf. Process. 2018, 33, 268–277. [Google Scholar] [CrossRef]
  53. Saleem, W.; Asad, M.; Zain-ul-abdein, M.; Ijaz, H.; Mabrouki, T. Numerical investigations of optimum turning parameters—AA2024-T351 aluminum alloy. Mach. Sci. Technol. 2016, 20, 634–654. [Google Scholar] [CrossRef]
  54. Lotfi, M.; Amini, S.; Sajjady, S.A. Development of a friction model based on oblique cutting theory. Int. J. Mech. Sci. 2019, 160, 241–254. [Google Scholar] [CrossRef]
  55. Filice, L.; Micari, F.; Rizzuti, S.; Umbrello, D. A critical analysis on the friction modelling in orthogonal machining. Int. J. Mach. Tools Manuf. 2007, 47, 709–714. [Google Scholar] [CrossRef]
  56. Miguélez, M.H.; Muñoz-Sánchez, A.; Cantero, J.L.; Loya, J.A. An efficient implementation of boundary conditions in an ALE model for orthogonal cutting. J. Theor. Appl. Mech. 2009, 47, 599–616. [Google Scholar]
  57. Rivero-Rodríguez, J.; Pérez-Saborid, M.; Scheid, B. An alternative choice of the boundary condition for the arbitrary Lagrangian-Eulerian method. J. Comput. Phys. 2021, 443, 110494. [Google Scholar] [CrossRef]
  58. Lotfi, M.; Amini, S.; Aghaei, M. 3D FEM simulation of tool wear in ultrasonic assisted rotary turning. Ultrasonics 2018, 88, 106–114. [Google Scholar] [CrossRef] [PubMed]
  59. Liu, G.; Huang, C.; Su, R.; Özel, T.; Liu, Y.; Xu, L. 3D FEM simulation of the turning process of stainless steel 17-4PH with differently texturized cutting tools. Int. J. Mech. Sci. 2019, 155, 417–429. [Google Scholar] [CrossRef]
  60. Sivaramakrishnaiah, M.; Nandakumar, P.; Rangajanardhana, G. Numerical and Experimental Validation of Chip Morphology. Int. J. Adv. Res. Eng. Technol. 2019, 10, 503–508. [Google Scholar] [CrossRef]
  61. Xiong, Y.; Wang, W.; Jiang, R.; Lin, K. A Study on Cutting Force of Machining In Situ TiB2 Particle-Reinforced 7050Al Alloy Matrix Composites. Metals 2017, 7, 197. [Google Scholar] [CrossRef] [Green Version]
  62. Rodríguez, J.M.; Carbonell, J.M.; Jonsén, P. Numerical Methods for the Modelling of Chip Formation. Arch. Comput. Methods Eng. 2018, 27, 387–412. [Google Scholar] [CrossRef] [Green Version]
  63. Bil, H.; Kılıç, S.E.; Tekkaya, A.E. A comparison of orthogonal cutting data from experiments with three different finite element models. Int. J. Mach. Tools Manuf. 2004, 44, 933–944. [Google Scholar] [CrossRef]
  64. Jomaa, W.; Mechri, O.; Lévesque, J.; Songmene, V.; Bocher, P.; Gakwaya, A. Finite element simulation and analysis of serrated chip formation during high–speed machining of AA7075–T651 alloy. J. Manuf. Process. 2017, 26, 446–458. [Google Scholar] [CrossRef]
  65. Opoz, T.; Chen, X. Chip Formation Mechanism Using Finite Element Simulation. Stroj. Vestn. J. Mech. Eng. 2016, 62, 636–646. [Google Scholar] [CrossRef]
Figure 1. Primary and secondary deformation zones (sticking and sliding region).
Lubricants 10 00310 g001
Figure 2. Workpiece and cutting tool dimensions.
Lubricants 10 00310 g002
Figure 3. Workpiece mesh.
Lubricants 10 00310 g003
Figure 4. SPH particles visualization.
Lubricants 10 00310 g004
Figure 5. Mesh independence for LAG and SPH model.
Lubricants 10 00310 g005
Figure 6. Displacement boundary conditions were applied to the cutting system.
Lubricants 10 00310 g006
Figure 7. Comparison of experimental cutting force values for Al6061-T6 with the simulated cutting force values of LAG model and SPH model at f = 0.1 mm/rev and v = 250, 500, 750, 1000 m/min.
Lubricants 10 00310 g007
Figure 8. Comparison of experimental cutting force values for Al6061-T6 with the simulated cutting force values of LAG model and SPH model at f = 0.3 mm/rev and v = 250, 500, 750, 1000 m/min.
Lubricants 10 00310 g008
Figure 9. Comparison of experimental cutting force values for Al6061-T6 with the simulated cutting force values of LAG model and SPH model at f = 0.3 mm/rev and v = 250, 500, 750, 1000 m/min.
Lubricants 10 00310 g009
Figure 10. Comparison of experimental average shear angle values with the simulated shear angle values of the LAG and SPH models.
Lubricants 10 00310 g010
Figure 11. Comparison of experimental average chip thickness values with the simulated chip thickness values of the LAG and SPH models.
Lubricants 10 00310 g011
Figure 12. (a) Chip thickness comparison at v = 250 m/min and f = 0.1 mm/rev. (b) Chip thickness comparison at v = 2000 m/min and f = 0.4 mm/rev.
Lubricants 10 00310 g012aLubricants 10 00310 g012b
Figure 13. Comparison of chip shapes (a) v = 1000 m/min and f = 0.1 mm/rev; (b) v = 1000 m/min and f = 0.2 mm/rev; (c) v = 1000 m/min and f = 0.3 mm/rev.
Lubricants 10 00310 g013aLubricants 10 00310 g013b
Figure 14. Tensile instability effect in SPH machining. (a) Tensile instability effect at v = 500 m/min. (b) No tensile instability effect at v = 1000 m/min.
Lubricants 10 00310 g014
Figure 15. (a) Johnson–Cook damage law applied on sacrificial layer in LAG model. (b) Johnson–Cook damage law applied on whole workpiece in LAG model.
Lubricants 10 00310 g015
Figure 16. Johnson–Cook damage parameters applied to the entire workpiece.
Lubricants 10 00310 g016
Table 1. Johnson–Cook material model parameters and physical properties of workpiece Al-6061 [26,42].
Physical Properties of Al6061-T6 (Workpiece Material)
Density 27,000 kg/m3 = 2.7 × 10⁻⁹ T/mm3
Young’s modulus68.9 GPa = 68,900 MPa
Poisson ratio0.33
Transition temperature20 °C
Thermal conductivity61–148 W/m·K = 61–148 mW/mm·K
Thermal expansion coefficient2.34 × 10−5/°C
Specific heat1765 × 106–900 × 106 J/kg·K = 175 × 106–900 × 106 mJ/T·C
Inelastic heat fraction0.9
Tmelt650 °C
A324 MPa
B114 MPa
n0.42
C0.002
m1.34
ε ¯ 1 s−1
Table 2. Johnson–Cook damage model parameters [44,45].
Damage Model Parameters
Initial Failure Strain, D1−0.77
Exponential Factor, D21.45
Triaxiality Factor, D3−0.47
Strain Rate Factor, D40.0
Temperature Factor, D51.60
Table 3. Comparison of experimental average shear angle values with the simulated average shear angle values of the LAG model and SPH model.
Sr. No.Speed
(m/min)
Feed Rate
(mm/rev)
Avg. Shear
Angle, Deg
Shear Angle, Deg
LAG Model, (Sim.)
Error %Shear Angle, Deg
SPH Model, (Sim.)
Error %
12500.119.326.034.723.923.8
25000.122.226.418.125.213.5
37500.124.927.08.426.04.4
410000.126.429.09.827.02.3
52500.226.528.05.726.01.8
65000.228.931.812.829.51.4
77500.229.932.010.030.34.8
810000.230.833.07.134.010.4
92500.329.928.83.729.03.0
105000.331.131.20.331.82.3
117500.331.932.00.332.82.8
1210000.332.932.51.233.51.8
Table 4. Comparison of experimental average chip thickness with the simulated average chip thickness of the LAG model and SPH model.
Sr. No.Speed
(m/min)
Feed Rate
(mm/rev)
Avg. Chip
Thickness, µm
Chip Thickness, µM
LAG Model, (Sim.)
Error %Chip Thickness, µm
SPH Model, (Sim.)
Error %
12500.128525012.424514.1
25000.124516333.62306.4
37500.121615727.52083.9
410000.120115523.11896.2
52500.240145112.43707.8
65000.2363407123650.5
77500.23483603.33295.6
810000.23353185.23059
92500.35215505.55505.5
105000.34985000.34950.7
117500.34824850.64830.1
1210000.34634650.34752.5
Publisher’s Note: MDPI stays neutral with regard to jurisdictional claims in published maps and institutional affiliations.

