

The Immune Landscape and Molecular Subtypes of Pediatric Crohn’s Disease: Results from In Silico Analysis

Abstract
:1. Introduction
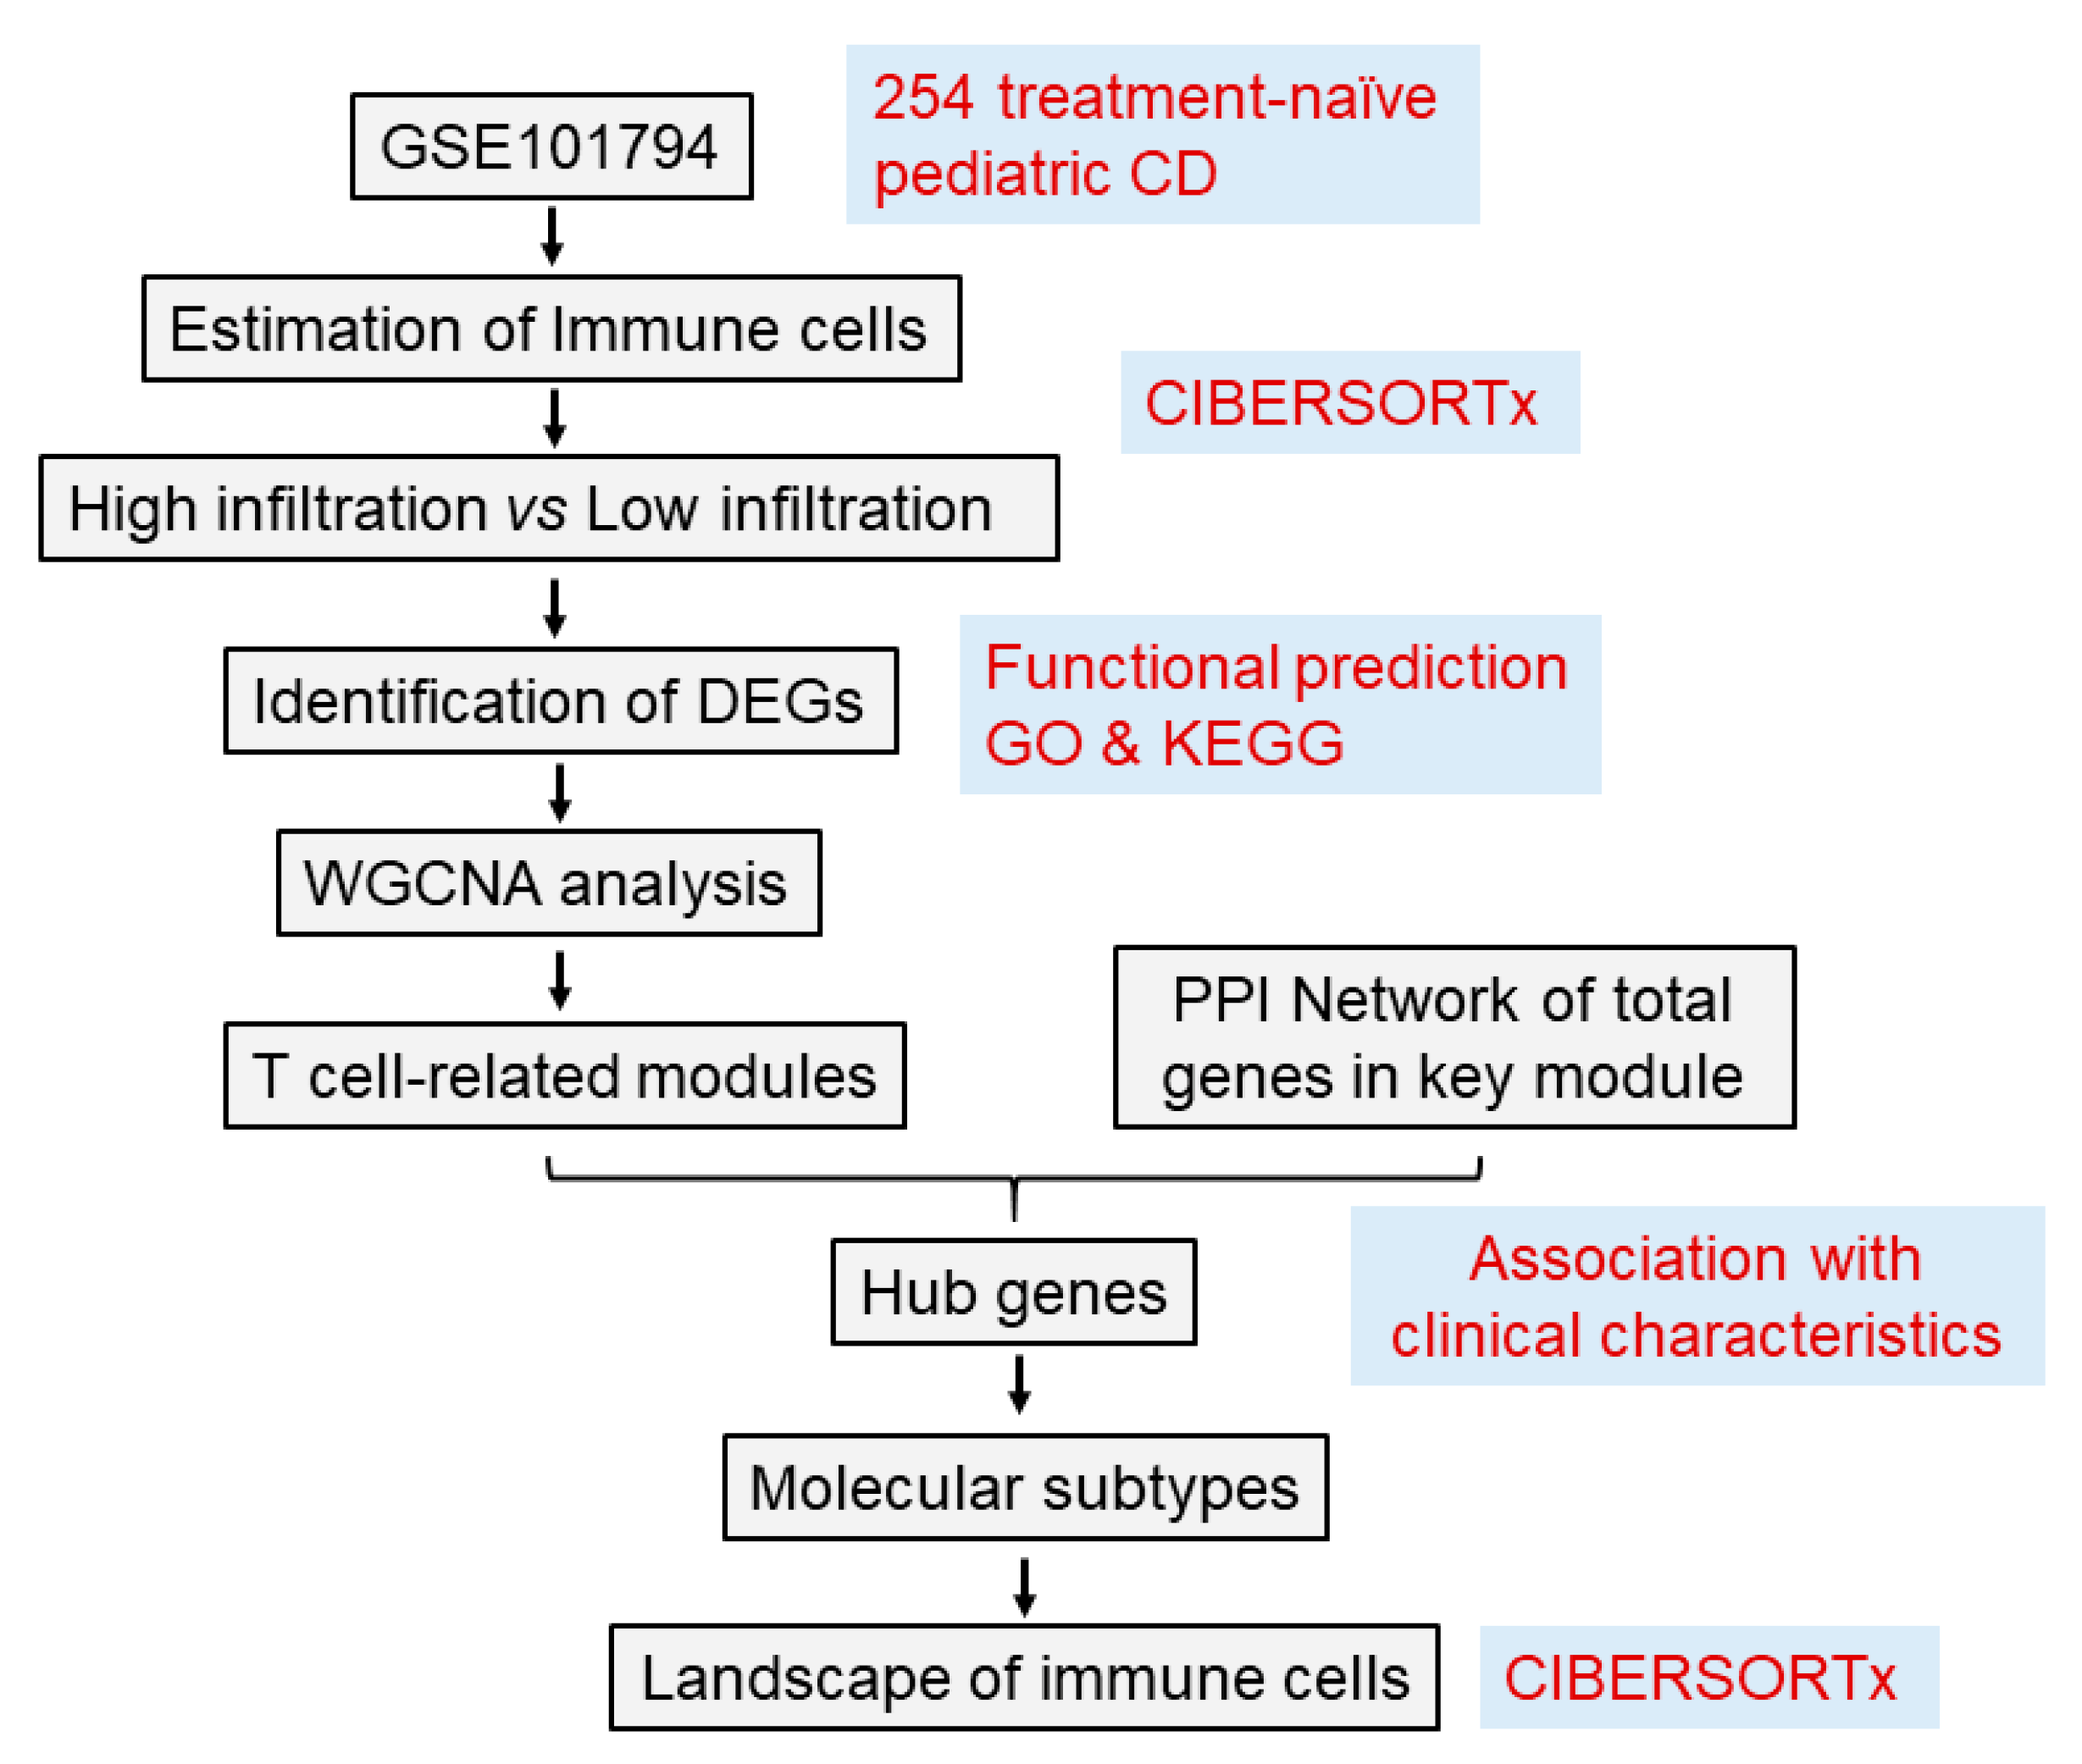
2. Methods
2.1. RNA Expression Dataset
2.2. Evaluation of Tissue-Infiltrating Immune Cells Based on the RNA-Seq Data
2.3. Identification of Differentially Exprssed Genes from Highversus Low-Immune Cell Infiltration
2.4. Construction of Gene Co-Expression Network and Identification of Hub Modules
2.5. Hub Gene Identification and Their Associations with Clinical Parameters
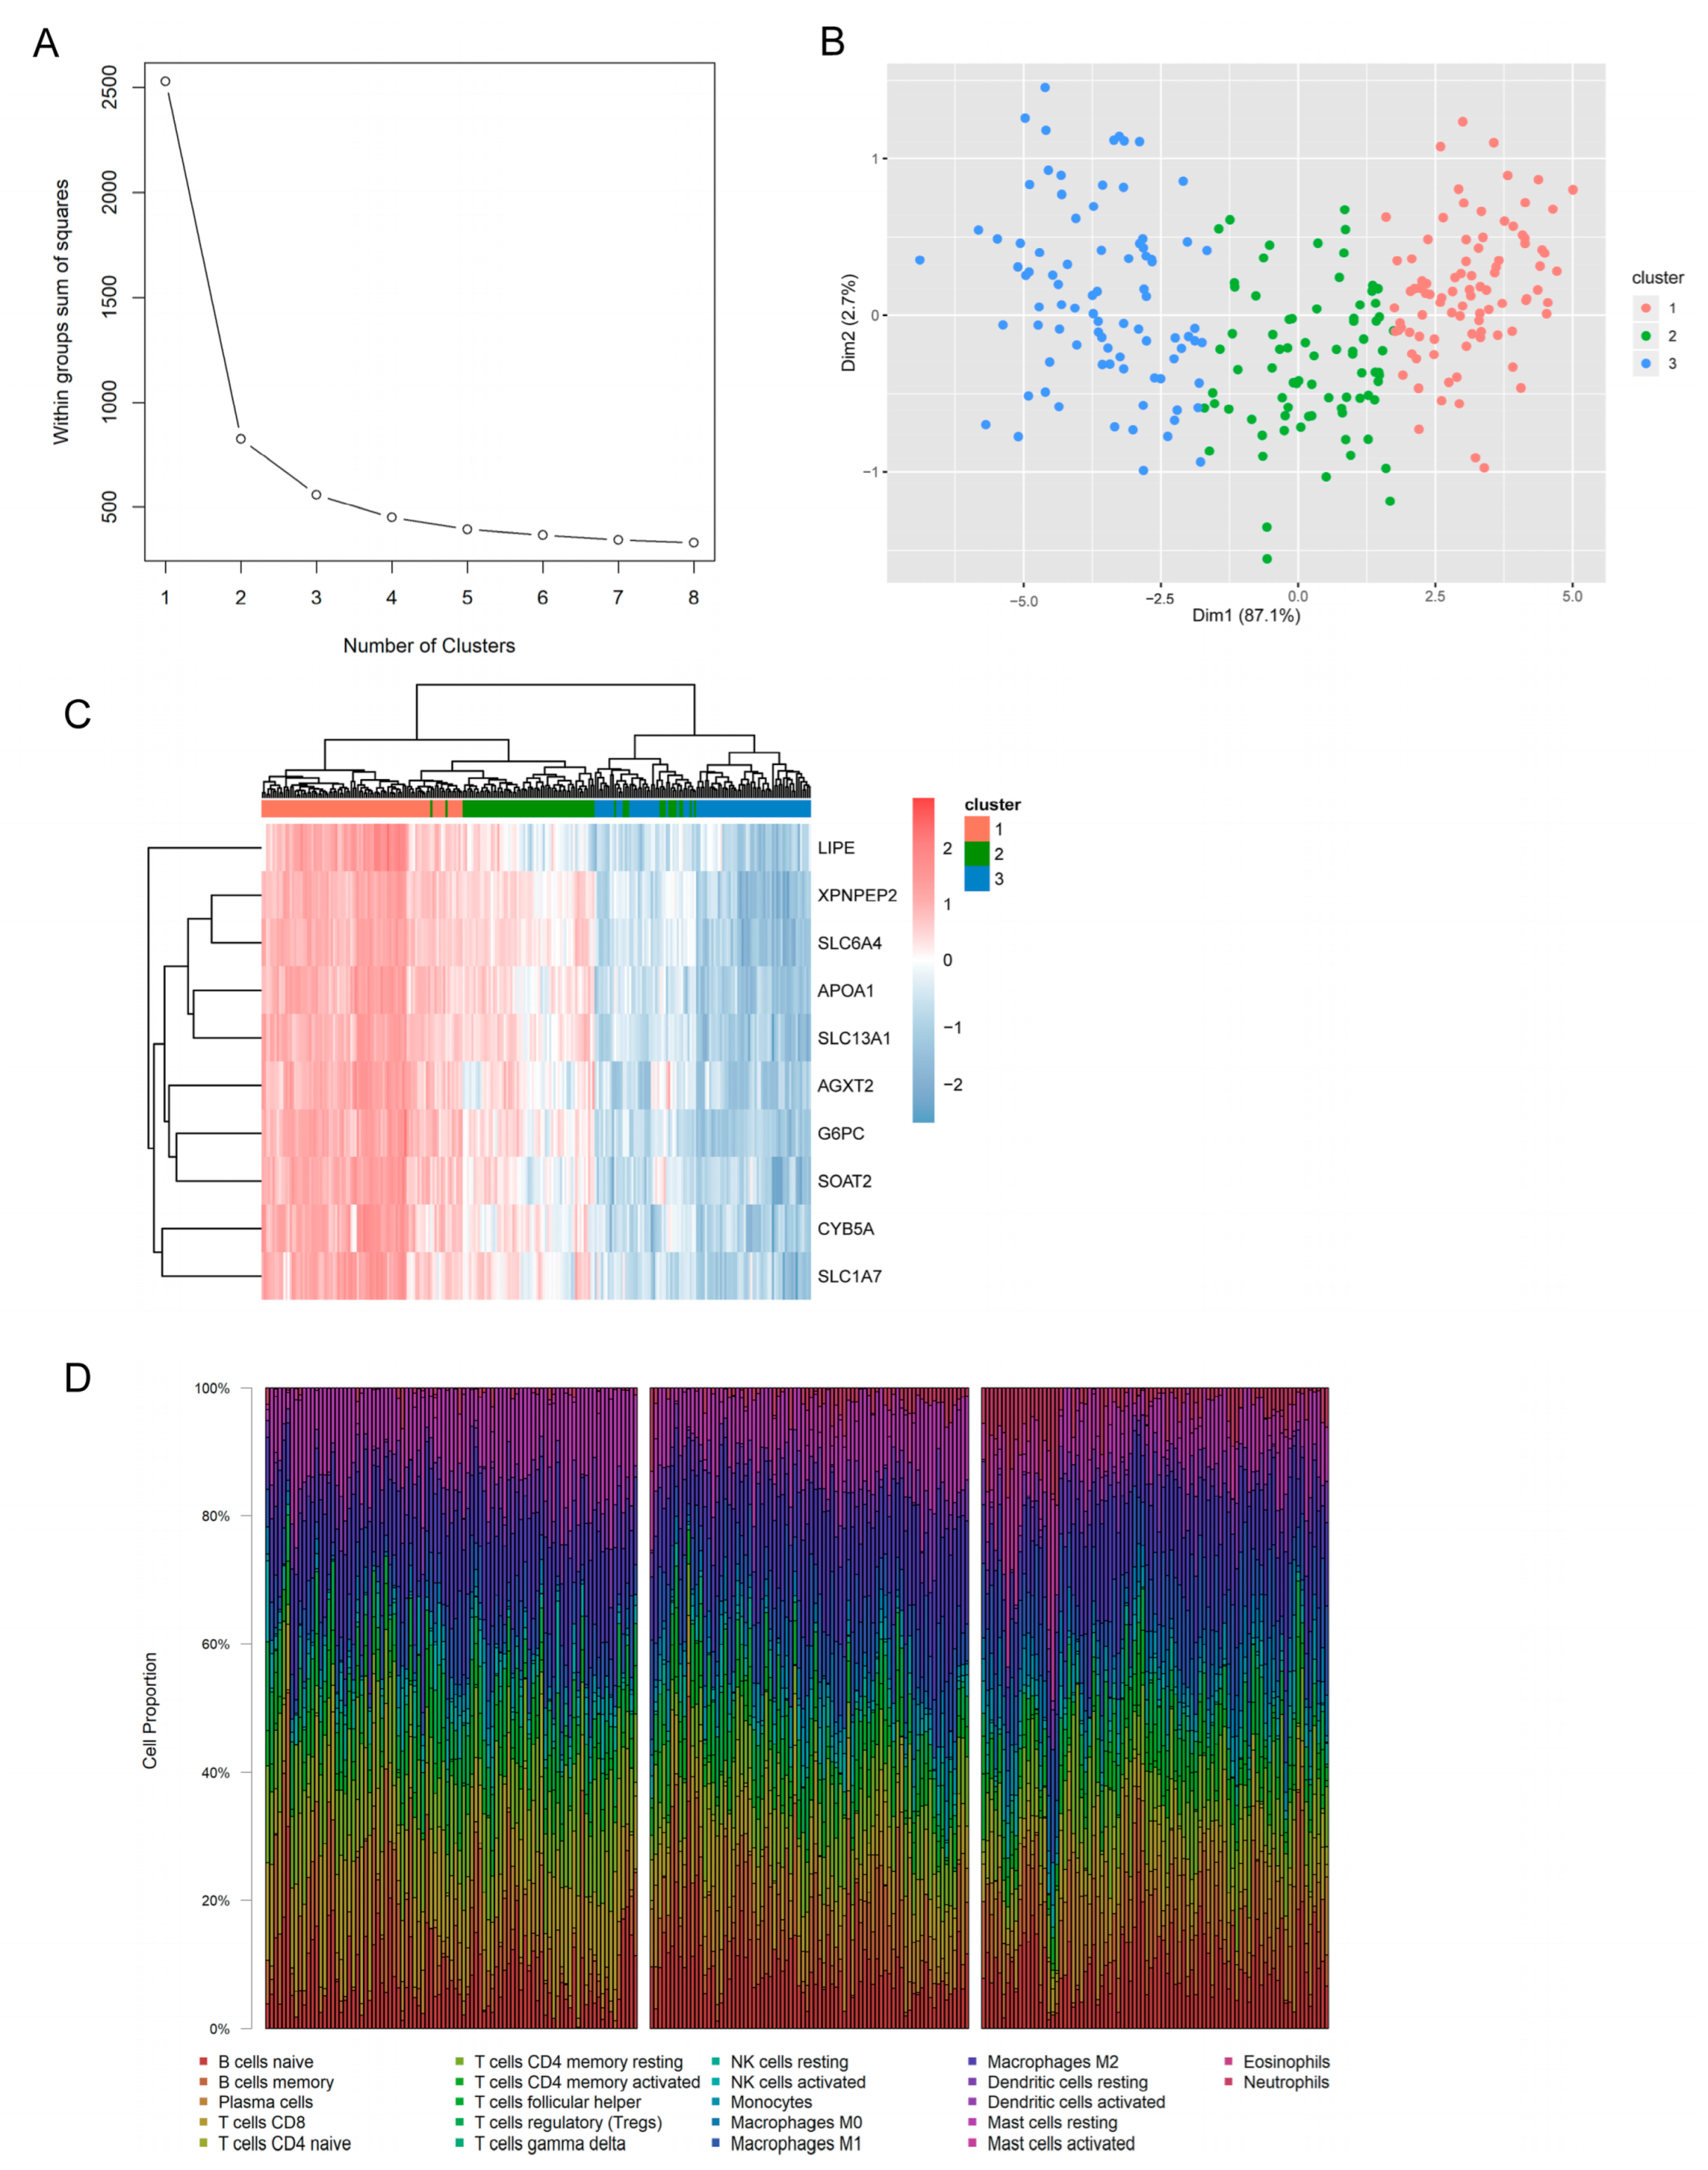
2.6. Determination of Molecular Subtypes and Immune Characteristics
3. Results
3.1. Immune Landscapes of Treatment-Naïve Pediatric CD
3.2. DEGs Derived from High Immune Infiltration versus Low Immune Infiltration and Functional Analysis
3.3. Identification of Hub Modules in Relation to T Cells
3.4. Hub Genes Related to CD8+ T Cell Infiltration in Pediatric CD
3.5. Associations between Hub Gene Expression and Clinical Traits
3.6. Identification of Molecular Subtypes and Immune Characteristics Based on Hub Genes
4. Discussion
Supplementary Materials
Author Contributions
Funding
Institutional Review Board Statement
Informed Consent Statement
Data Availability Statement
Acknowledgments
Conflicts of Interest
References
- Benchimol, E.I.; Fortinsky, K.J.; Gozdyra, P.; Van den Heuvel, M.; Van Limbergen, J.; Griffiths, A.M. Epidemiology of pediatric inflammatory bowel disease: A systematic review of international trends. Inflamm. Bowel Dis. 2011, 17, 423–439. [Google Scholar] [CrossRef] [PubMed]
- Duricova, D.; Fumery, M.; Annese, V.; Lakatos, P.L.; Peyrin-Biroulet, L.; Gower-Rousseau, C. The natural history of Crohn’s disease in children: A review of population-based studies. Eur. J. Gastroenterol. Hepatol. 2017, 29, 125–134. [Google Scholar] [CrossRef] [PubMed]
- De Souza, H.S.; Fiocchi, C. Immunopathogenesis of IBD: Current state of the art. Nat. Rev. Gastroenterol. Hepatol. 2016, 13, 13–27. [Google Scholar] [CrossRef] [PubMed]
- Medzhitov, R. Recognition of microorganisms and activation of the immune response. Nature 2007, 449, 819–826. [Google Scholar] [CrossRef] [PubMed]
- Boland, B.S.; He, Z.; Tsai, M.S.; Olvera, J.G.; Omilusik, K.D.; Duong, H.G.; Kim, E.S.; Limary, A.E.; Jin, W.; Milner, J.J.; et al. Heterogeneity and clonal relationships of adaptive immune cells in ulcerative colitis revealed by single-cell analyses. Sci. Immunol. 2020, 5, eabb4432. [Google Scholar] [CrossRef]
- Devlin, J.C.; Axelrad, J.; Hine, A.M.; Chang, S.; Sarkar, S.; Lin, J.D.; Ruggles, K.V.; Hudesman, D.; Cadwell, K.; Loke, P. Single-Cell Transcriptional Survey of Ileal-Anal Pouch Immune Cells From Ulcerative Colitis Patients. Gastroenterology 2021, 160, 1679–1693. [Google Scholar] [CrossRef]
- Hu, S.; Uniken Venema, W.T.; Westra, H.J.; Vich Vila, A.; Barbieri, R.; Voskuil, M.D.; Blokzijl, T.; Jansen, B.H.; Li, Y.; Daly, M.J.; et al. Inflammation status modulates the effect of host genetic variation on intestinal gene expression in inflammatory bowel disease. Nat. Commun. 2021, 12, 1122. [Google Scholar] [CrossRef]
- Salvador-Martín, S.; Kaczmarczyk, B.; Álvarez, R.; Navas-López, V.M.; Gallego-Fernández, C.; Moreno-Álvarez, A.; Solar-Boga, A.; Sánchez, C.; Tolin, M.; Velasco, M.; et al. Whole Transcription Profile of Responders to Anti-TNF Drugs in Pediatric Inflammatory Bowel Disease. Pharmaceutics 2021, 13, 77. [Google Scholar] [CrossRef]
- Newman, A.M.; Steen, C.B.; Liu, C.L.; Gentles, A.J.; Chaudhuri, A.A.; Scherer, F.; Khodadoust, M.S.; Esfahani, M.S.; Luca, B.A.; Steiner, D.; et al. Determining cell type abundance and expression from bulk tissues with digital cytometry. Nat. Biotechnol. 2019, 37, 773–782. [Google Scholar] [CrossRef]
- Sturm, G.; Finotello, F.; Petitprez, F.; Zhang, J.D.; Baumbach, J.; Fridman, W.H.; List, M.; Aneichyk, T. Comprehensive evaluation of transcriptome-based cell-type quantification methods for immuno-oncology. Bioinformatics 2019, 35, i436–i445. [Google Scholar] [CrossRef]
- Furey, T.S.; Sethupathy, P.; Sheikh, S.Z. Redefining the IBDs using genome-scale molecular phenotyping. Nat. Rev. Gastroenterol. Hepatol. 2019, 16, 296–311. [Google Scholar] [CrossRef] [PubMed]
- Prat, A.; Perou, C.M. Deconstructing the molecular portraits of breast cancer. Mol. Oncol. 2011, 5, 5–23. [Google Scholar] [CrossRef] [PubMed]
- Guinney, J.; Dienstmann, R.; Wang, X.; de Reyniès, A.; Schlicker, A.; Soneson, C.; Marisa, L.; Roepman, P.; Nyamundanda, G.; Angelino, P.; et al. The consensus molecular subtypes of colorectal cancer. Nat. Med. 2015, 21, 1350–1356. [Google Scholar] [CrossRef]
- Tan, P.; Yeoh, K.G. Genetics and Molecular Pathogenesis of Gastric Adenocarcinoma. Gastroenterology 2015, 149, 1153–1162.e1153. [Google Scholar] [CrossRef] [PubMed] [Green Version]
- Haberman, Y.; Schirmer, M.; Dexheimer, P.J.; Karns, R.; Braun, T.; Kim, M.-O.; Walters, T.D.; Baldassano, R.N.; Noe, J.D.; Rosh, J.; et al. Age-of-diagnosis dependent ileal immune intensification and reduced alpha-defensin in older versus younger pediatric Crohn Disease patients despite already established dysbiosis. Mucosal Immunol. 2019, 12, 491–502. [Google Scholar] [CrossRef] [PubMed]
- Langfelder, P.; Horvath, S. WGCNA: An R package for weighted correlation network analysis. BMC Bioinform. 2008, 9, 559. [Google Scholar] [CrossRef] [Green Version]
- Giannoudaki, E.; Gargan, S.; Hussey, S.; Long, A.; Walsh, P.T. Opportunities to Target T Cell Trafficking in Pediatric Inflammatory Bowel Disease. Front. Pediatr. 2021, 9, 640497. [Google Scholar] [CrossRef]
- Torres, J.; Mehandru, S.; Colombel, J.F.; Peyrin-Biroulet, L. Crohn’s disease. Lancet 2017, 389, 1741–1755. [Google Scholar] [CrossRef]
- Elmentaite, R.; Ross, A.D.B.; Roberts, K.; James, K.R.; Ortmann, D.; Gomes, T.; Nayak, K.; Tuck, L.; Pritchard, S.; Bayraktar, O.A.; et al. Single-Cell Sequencing of Developing Human Gut Reveals Transcriptional Links to Childhood Crohn’s Disease. Dev. Cell 2020, 55, 771–783.e775. [Google Scholar] [CrossRef]
- Wynn, T.A.; Chawla, A.; Pollard, J.W. Macrophage biology in development, homeostasis and disease. Nature 2013, 496, 445–455. [Google Scholar] [CrossRef] [Green Version]
- Dharmasiri, S.; Garrido-Martin, E.M.; Harris, R.J.; Bateman, A.C.; Collins, J.E.; Cummings, J.R.F.; Sanchez-Elsner, T. Human Intestinal Macrophages Are Involved in the Pathology of Both Ulcerative Colitis and Crohn Disease. Inflamm. Bowel. Dis. 2021, 27, 1641–1652. [Google Scholar] [CrossRef] [PubMed]
- Watanabe, N.; Ikuta, K.; Okazaki, K.; Nakase, H.; Tabata, Y.; Matsuura, M.; Tamaki, H.; Kawanami, C.; Honjo, T.; Chiba, T. Elimination of local macrophages in intestine prevents chronic colitis in interleukin-10-deficient mice. Dig. Dis. Sci. 2003, 48, 408–414. [Google Scholar] [CrossRef] [PubMed]
- Nancey, S.; Holvöet, S.; Graber, I.; Joubert, G.; Philippe, D.; Martin, S.; Nicolas, J.F.; Desreumaux, P.; Flourié, B.; Kaiserlian, D. CD8+ cytotoxic T cells induce relapsing colitis in normal mice. Gastroenterology 2006, 131, 485–496. [Google Scholar] [CrossRef] [PubMed]
- Westendorf, A.M.; Fleissner, D.; Deppenmeier, S.; Gruber, A.D.; Bruder, D.; Hansen, W.; Liblau, R.; Buer, J. Autoimmune-mediated intestinal inflammation-impact and regulation of antigen-specific CD8+ T cells. Gastroenterology 2006, 131, 510–524. [Google Scholar] [CrossRef] [PubMed]
- Funderburg, N.T.; Stubblefield Park, S.R.; Sung, H.C.; Hardy, G.; Clagett, B.; Ignatz-Hoover, J.; Harding, C.V.; Fu, P.; Katz, J.A.; Lederman, M.M.; et al. Circulating CD4(+) and CD8(+) T cells are activated in inflammatory bowel disease and are associated with plasma markers of inflammation. Immunology 2013, 140, 87–97. [Google Scholar] [CrossRef]
- Lee, J.C.; Lyons, P.A.; McKinney, E.F.; Sowerby, J.M.; Carr, E.J.; Bredin, F.; Rickman, H.M.; Ratlamwala, H.; Hatton, A.; Rayner, T.F.; et al. Gene expression profiling of CD8+ T cells predicts prognosis in patients with Crohn disease and ulcerative colitis. J. Clin. Investig. 2011, 121, 4170–4179. [Google Scholar] [CrossRef] [PubMed] [Green Version]
- Boschetti, G.; Nancey, S.; Moussata, D.; Cotte, E.; Francois, Y.; Flourié, B.; Kaiserlian, D. Enrichment of Circulating and Mucosal Cytotoxic CD8+ T Cells Is Associated with Postoperative Endoscopic Recurrence in Patients with Crohn’s Disease. J. Crohn’s Colitis 2016, 10, 338–345. [Google Scholar] [CrossRef] [Green Version]
- Aloi, M.; Tromba, L.; Di Nardo, G.; Dilillo, A.; Del Giudice, E.; Marocchi, E.; Viola, F.; Civitelli, F.; Berni, A.; Cucchiara, S. Premature subclinical atherosclerosis in pediatric inflammatory bowel disease. J. Pediatr. 2012, 161, 589–594.e581. [Google Scholar] [CrossRef]
- Norata, G.D.; Pirillo, A.; Ammirati, E.; Catapano, A.L. Emerging role of high density lipoproteins as a player in the immune system. Atherosclerosis 2012, 220, 11–21. [Google Scholar] [CrossRef]
- Noble, C.L.; Abbas, A.R.; Lees, C.W.; Cornelius, J.; Toy, K.; Modrusan, Z.; Clark, H.F.; Arnott, I.D.; Penman, I.D.; Satsangi, J.; et al. Characterization of intestinal gene expression profiles in Crohn’s disease by genome-wide microarray analysis. Inflamm. Bowel. Dis. 2010, 16, 1717–1728. [Google Scholar] [CrossRef]
- Haberman, Y.; Tickle, T.L.; Dexheimer, P.J.; Kim, M.O.; Tang, D.; Karns, R.; Baldassano, R.N.; Noe, J.D.; Rosh, J.; Markowitz, J.; et al. Pediatric Crohn disease patients exhibit specific ileal transcriptome and microbiome signature. J. Clin. Investig. 2014, 124, 3617–3633. [Google Scholar] [CrossRef] [PubMed] [Green Version]
- Meriwether, D.; Sulaiman, D.; Volpe, C.; Dorfman, A.; Grijalva, V.; Dorreh, N.; Solorzano-Vargas, R.S.; Wang, J.; O’Connor, E.; Papesh, J.; et al. Apolipoprotein A-I mimetics mitigate intestinal inflammation in COX2-dependent inflammatory bowel disease model. J. Clin. Investig. 2019, 129, 3670–3685. [Google Scholar] [CrossRef] [PubMed]
- Mawe, G.M.; Hoffman, J.M. Serotonin signalling in the gut--functions, dysfunctions and therapeutic targets. Nat. Rev. Gastroenterol. Hepatol. 2013, 10, 473–486. [Google Scholar] [CrossRef] [PubMed] [Green Version]
- Granlund, A.; Flatberg, A.; Østvik, A.E.; Drozdov, I.; Gustafsson, B.I.; Kidd, M.; Beisvag, V.; Torp, S.H.; Waldum, H.L.; Martinsen, T.C.; et al. Whole genome gene expression meta-analysis of inflammatory bowel disease colon mucosa demonstrates lack of major differences between Crohn’s disease and ulcerative colitis. PLoS ONE 2013, 8, e56818. [Google Scholar] [CrossRef] [Green Version]
- Tada, Y.; Ishihara, S.; Kawashima, K.; Fukuba, N.; Sonoyama, H.; Kusunoki, R.; Oka, A.; Mishima, Y.; Oshima, N.; Moriyama, I.; et al. Downregulation of serotonin reuptake transporter gene expression in healing colonic mucosa in presence of remaining low-grade inflammation in ulcerative colitis. J. Gastroenterol. Hepatol. 2016, 31, 1443–1452. [Google Scholar] [CrossRef] [PubMed]
- Jørandli, J.W.; Thorsvik, S.; Skovdahl, H.K.; Kornfeld, B.; Sæterstad, S.; Gustafsson, B.I.; Sandvik, A.K.; van Beelen Granlund, A. The serotonin reuptake transporter is reduced in the epithelium of active Crohn’s disease and ulcerative colitis. Am. J. Physiol. Gastrointest. Liver Physiol. 2020, 319, G761–G768. [Google Scholar] [CrossRef] [PubMed]
- Manzella, C.R.; Jayawardena, D.; Pagani, W.; Li, Y.; Alrefai, W.A.; Bauer, J.; Jung, B.; Weber, C.R.; Gill, R.K. Serum Serotonin Differentiates Between Disease Activity States in Crohn’s Patients. Inflamm. Bowel. Dis. 2020, 26, 1607–1618. [Google Scholar] [CrossRef]
- Linden, D.R.; Chen, J.X.; Gershon, M.D.; Sharkey, K.A.; Mawe, G.M. Serotonin availability is increased in mucosa of guinea pigs with TNBS-induced colitis. Am. J. Physiol. Gastrointest. Liver Physiol. 2003, 285, G207–G216. [Google Scholar] [CrossRef] [Green Version]
- Linden, D.R.; Foley, K.F.; McQuoid, C.; Simpson, J.; Sharkey, K.A.; Mawe, G.M. Serotonin transporter function and expression are reduced in mice with TNBS-induced colitis. Neurogastroenterol. Motil. Off. J. Eur. Gastrointest. Motil. Soc. 2005, 17, 565–574. [Google Scholar] [CrossRef]
- Stavely, R.; Fraser, S.; Sharma, S.; Rahman, A.A.; Stojanovska, V.; Sakkal, S.; Apostolopoulos, V.; Bertrand, P.; Nurgali, K. The Onset and Progression of Chronic Colitis Parallels Increased Mucosal Serotonin Release via Enterochromaffin Cell Hyperplasia and Downregulation of the Serotonin Reuptake Transporter. Inflamm. Bowel. Dis. 2018, 24, 1021–1034. [Google Scholar] [CrossRef]
- Grubelic Ravić, K.; Paić, F.; Vucelić, B.; Brinar, M.; Čuković-Čavka, S.; Božina, N.; Krznarić, Ž.; Kalauz, M.; Bešić, D.; Nikuševa Martić, T. Association of polymorphic variants in serotonin re-uptake transporter gene with Crohn’s disease: A retrospective case-control study. Croat. Med. J. 2018, 59, 232–243. [Google Scholar] [CrossRef] [PubMed] [Green Version]
- Yang, F.M.; Shen, L.; Fan, D.D.; Chen, K.H.; Lee, J. DMGV Is a Rheostat of T Cell Survival and a Potential Therapeutic for Inflammatory Diseases and Cancers. Front. Immunol. 2022, 13, 918241. [Google Scholar] [CrossRef]
- Lee, R.G.; Willingham, M.C.; Davis, M.A.; Skinner, K.A.; Rudel, L.L. Differential expression of ACAT1 and ACAT2 among cells within liver, intestine, kidney, and adrenal of nonhuman primates. J. Lipid Res. 2000, 41, 1991–2001. [Google Scholar] [CrossRef] [PubMed]
- Börtlein, C.; Schumacher, F.; Kleuser, B.; Dölken, L.; Avota, E. Role of Neutral Sphingomyelinase-2 (NSM 2) in the Control of T Cell Plasma Membrane Lipid Composition and Cholesterol Homeostasis. Front. Cell Dev. Biol. 2019, 7, 226. [Google Scholar] [CrossRef] [Green Version]
- Walfish, A.; Sachar, D. Phenotype classification in IBD: Is there an impact on therapy? Inflamm. Bowel. Dis. 2007, 13, 1573–1575. [Google Scholar] [CrossRef] [PubMed]
- Weiser, M.; Simon, J.M.; Kochar, B.; Tovar, A.; Israel, J.W.; Robinson, A.; Gipson, G.R.; Schaner, M.S.; Herfarth, H.H.; Sartor, R.B.; et al. Molecular classification of Crohn’s disease reveals two clinically relevant subtypes. Gut 2018, 67, 36–42. [Google Scholar] [CrossRef] [Green Version]
- Martin, J.C.; Chang, C.; Boschetti, G.; Ungaro, R.; Giri, M.; Grout, J.A.; Gettler, K.; Chuang, L.S.; Nayar, S.; Greenstein, A.J.; et al. Single-Cell Analysis of Crohn’s Disease Lesions Identifies a Pathogenic Cellular Module Associated with Resistance to Anti-TNF Therapy. Cell 2019, 178, 1493–1508.e1420. [Google Scholar] [CrossRef]


| Gene | Degree | Full Name |
|---|---|---|
| XPNPEP2 | 23 | X-prolyl aminopeptidase 2 |
| APOA1 | 22 | apolipoprotein A1 |
| G6PC | 21 | glucose-6-phosphatase catalytic subunit 1 |
| LIPE | 15 | lipase E |
| CYB5A | 13 | cytochrome b5 type A |
| SLC13A1 | 12 | solute carrier family 13 member 1 |
| SLC1A7 | 11 | solute carrier family 1 member 7 |
| SLC6A4 | 11 | solute carrier family 6 member 4 |
| AGXT2 | 11 | alanine-glyoxylate aminotransferase 2 |
| SOAT2 | 11 | sterol O-acyltransferase 2 |
| Total | Cluster 1 | Cluster 2 | Cluster 3 | Chi-Square | p Value | ||
|---|---|---|---|---|---|---|---|
| n = 254 | n = 91 | n = 78 | n = 85 | ||||
| Sex | Male | 149 | 52 | 45 | 52 | 0.338 | 0.844 |
| Female | 105 | 39 | 33 | 33 | |||
| Age | A1a | 61 | 28 | 23 | 10 | 10.545 | 0.005 |
| A1b | 193 | 63 | 55 | 75 | |||
| Location | L1 | 56 | 16 | 20 | 20 | 12.380 | 0.015 |
| L2 | 56 | 31 | 13 | 12 | |||
| L3 | 142 | 44 | 45 | 53 | |||
Disclaimer/Publisher’s Note: The statements, opinions and data contained in all publications are solely those of the individual author(s) and contributor(s) and not of MDPI and/or the editor(s). MDPI and/or the editor(s) disclaim responsibility for any injury to people or property resulting from any ideas, methods, instructions or products referred to in the content. |
© 2023 by the authors. Licensee MDPI, Basel, Switzerland. This article is an open access article distributed under the terms and conditions of the Creative Commons Attribution (CC BY) license (https://creativecommons.org/licenses/by/4.0/).
Share and Cite
Xiao, S.; Xie, W.; Zhang, Y.; Pan, Y.; Lei, L. The Immune Landscape and Molecular Subtypes of Pediatric Crohn’s Disease: Results from In Silico Analysis. J. Pers. Med. 2023, 13, 571. https://doi.org/10.3390/jpm13040571
Xiao S, Xie W, Zhang Y, Pan Y, Lei L. The Immune Landscape and Molecular Subtypes of Pediatric Crohn’s Disease: Results from In Silico Analysis. Journal of Personalized Medicine. 2023; 13(4):571. https://doi.org/10.3390/jpm13040571
Chicago/Turabian StyleXiao, Shiyu, Wenhui Xie, Yinghui Zhang, Yan Pan, and Lei Lei. 2023. "The Immune Landscape and Molecular Subtypes of Pediatric Crohn’s Disease: Results from In Silico Analysis" Journal of Personalized Medicine 13, no. 4: 571. https://doi.org/10.3390/jpm13040571