
From Croatian Roma to 1000 Genomes: The Story of the CYP2D6 Gene Promoter and Enhancer SNPs

 ,
,  , , , and
Abstract
:1. Introduction
2. Materials and Methods
3. Results
4. Discussion
5. Conclusions
Supplementary Materials
Author Contributions
Funding
Institutional Review Board Statement
Informed Consent Statement
Data Availability Statement
Acknowledgments
Conflicts of Interest
References
- Saravanakumar, A.; Sadighi, A.; Ryu, R.; Akhlaghi, F. Physicochemical properties, biotransformation, and transport pathways of established and newly approved medications: A systematic review of the top 200 most prescribed drugs vs. the FDA-approved drugs between 2005 and 2016. Clin. Pharmacokinet. 2019, 58, 1281–1294. [Google Scholar] [CrossRef] [PubMed]
- Hicks, J.K.; Swen, J.J.; Gaedigk, A. Challenges in CYP2D6 phenotype assignment from genotype data: A critical assessment and call for standardization. Curr. Drug Metab. 2014, 15, 218–232. [Google Scholar] [CrossRef] [PubMed]
- Caudle, K.E.; Sangkuhl, K.; Whirl-Carrillo, M.; Swen, J.J.; Haidar, C.E.; Klein, T.E.; Gammal, R.S.; Relling, M.V.; Scott, S.A.; Hertz, D.L.; et al. Standardizing CYP2D6 genotype to phenotype translation: Consensus recommendations from the clinical pharmacogenetics implementation consortium and Dutch pharmacogenetics working group. Clin. Transl. Sci. 2019, 13, 116–124. [Google Scholar] [CrossRef] [PubMed] [Green Version]
- PHARMGKB. Available online: https://www.pharmgkb.org/ (accessed on 15 April 2022).
- The Human Cythchrome P450 (CYP) Allele Nomenclature Database. Available online: http://cypalleles.ki.se/ (accessed on 15 April 2022).
- Gaedigk, A.; Simon, S.D.; Pearce, R.E.; Bradford, L.D.; Kennedy, M.J.; Leeder, J.S. The CYP2D6 activity score: Translating genotype information into a qualitative measure of phenotype. Clin. Pharmacol. Ther. 2008, 83, 234–242. [Google Scholar] [CrossRef]
- Gaedigk, A.; Dinh, J.C.; Jeong, H.; Prasad, B.; Leeder, J.S. Ten years’ experience with the CYP2D6 activity score: A perspective on future investigations to improve clinical predictions for precision therapeutics. J. Pers. Med. 2018, 8, 15. [Google Scholar] [CrossRef] [Green Version]
- Fang, Y.; Gao, J.; Wang, T.; Tian, X.; Gao, N.; Zhou, J.; Zhang, H.F.; Wen, Q.; Jin, H.; Xing, Y.R.; et al. Intraindividual variation and correlation of cytochrome P450 activities in human liver microsomes. Mol. Pharm. 2018, 15, 5312–5318. [Google Scholar] [CrossRef]
- Dalton, R.; Lee, S.B.; Claw, K.G.; Prasad, B.; Phillips, B.R.; Shen, D.D.; Wong, L.H.; Fade, M.; McDonald, M.G.; Dunham, M.J.; et al. Interrogation of CYP2D6 structural variant alleles improves the correlation between CYP2D6 genotype and CYP2D6-mediated metabolic activity. Clin. Transl. Sci. 2020, 13, 147–156. [Google Scholar] [CrossRef] [Green Version]
- Ning, M.; Duarte, J.D.; Rubin, L.H.; Jeong, H. CYP2D6 protein level is the major contributor to interindividual variability in CYP2D6-mediated drug metabolism in healthy human liver tissue. Clin. Pharmacol. Ther. 2018, 104, 974–982. [Google Scholar] [CrossRef]
- Pan, X.; Ning, M.; Jeong, H. Transcriptional regulation of CYP2D6 expression. Drug. Metab. Dispos. 2017, 45, 42–48. [Google Scholar] [CrossRef] [Green Version]
- GeneCards (RRID:SCR_002773). Database of Human Genes that Provides Concise Genomic, Proteomic, Transcriptomic, Genetic and Functional Information on All Known and Predicted Human Genes. Information featured in Genecards Includes Orthologies, Disease Relationships, Mutations And SNPS, Gene Expression, Gene Function, Pathways, Protein-Protein Interactions, Related Drugs and Com-pounds and Direct Links to Cutting Edge Research Reagents and Tools Such as Antibodies, Recombinant Proteins, Clones, Expression Assays and RNAi Reagents. Available online: http://genecards.org (accessed on 15 April 2022).
- Wang, D.; Poi, M.J.; Sun, X.; Gaedigk, A.; Leeder, J.S.; Sadee, W. Common CYP2D6 polymorphisms affecting alternative splicing and transcription: Long-range haplotypes with two regulatory variants modulate CYP2D6 activity. Hum. Mol. Genet. 2014, 23, 268–278. [Google Scholar] [CrossRef] [Green Version]
- Gaedigk, A.; Casey, S.T.; Whirl-Carrillo, M.; Miller, N.A.; Klein, T.E. Pharmacogene variation consortium: A global resource and repository for pharmacogene variation. Clin. Pharmacol. Ther. 2021, 110, 542–545. [Google Scholar] [CrossRef] [PubMed]
- Gaedigk, A.; Ingelman-Sundberg, M.; Miller, N.A.; Leeder, J.S.; Whirl-Carrillo, M.; Klein, T.E. The pharmacogene variation (PharmVar) consortium: Incorporation of the human cytochrome P450 (CYP) allele nomenclature database. Clin. Pharmacol. Ther. 2018, 103, 399–401. [Google Scholar] [CrossRef] [PubMed] [Green Version]
- Gaedigk, A.; Whirl-Carrillo, M.; Pratt, V.M.; Miller, N.A.; Klein, T.E. PharmVar and the landscape of pharmacogenetic resources. Clin. Pharmacol. Ther. 2020, 107, 43–46. [Google Scholar] [CrossRef] [PubMed]
- Gong, X.; Liu, Y.; Zhang, X.; Wei, Z.; Huo, R.; Shen, L.; He, L.; Qin, S. Systematic functional study of cytochrome P450 2D6 promoter polymorphisms in the Chinese Han population. PLoS ONE 2013, 8, e57764. [Google Scholar] [CrossRef] [Green Version]
- Fraser, A. The Gypsies; Blackwell Publishers: Oxford, UK, 1992. [Google Scholar]
- Gresham, D.; Morar, B.; Underhill, P.A.; Passarino, G.; Lin, A.A.; Wise, C.; Angelicheva, D.; Calafell, F.; Oefner, P.J.; Shen, P.; et al. Origins and divergence of the Roma (gypsies). Am. J. Hum. Genet. 2001, 69, 1314–1331. [Google Scholar] [CrossRef] [Green Version]
- Chaix, R.; Austerlitz, F.; Morar, B.; Kalaydjieva, L.; Heyer, E. Vlax Roma history: What do coalescent-based methods tell us? Eur. J. Hum. Genet. 2004, 12, 285–292. [Google Scholar] [CrossRef] [Green Version]
- Škarić-Jurić, T.; Tomas, Ž.; Zajc Petranović, M.; Božina, N.; Smolej Narančić, N.; Janićijević, B.; Salihović, M.P. Characterization of ADME genes variation in Roma and 20 populations worldwide. PLoS ONE 2018, 13, e0207671. [Google Scholar] [CrossRef]
- Miller, S.A.; Dykes, D.D.; Polesky, H.F. A simple salting out procedure for extracting DNA from human nucleated cells. Nucleic Acids Res. 1988, 16, 1215. [Google Scholar] [CrossRef] [Green Version]
- Semagn, K.; Babu, R.; Hearne, S.; Olsen, M. Single nucleotide polymorphism genotyping using kompetitive allele specific PCR (KASP): Overview of the technology and its application in crop improvement. Mol. Breed. 2014, 33, 1–14. [Google Scholar] [CrossRef]
- Stojanović Marković, A.; Zajc Petranović, M.; Tomas, Ž.; Puljko, B.; Šetinc, M.; Škarić-Jurić, T.; Peričić Salihović, M. Untangling SNP variations within CYP2D6 gene in Croatian Roma. J. Pers. Med. 2022, 12, 374. [Google Scholar] [CrossRef]
- Excoffier, L.; Lischer, H.E. Arlequin suite ver 3.5: A new series of programs to perform population genetics analyses under Linux and Windows. Mol. Ecol. Resour. 2010, 10, 564–567. [Google Scholar] [CrossRef]
- R Core Team. R: A Language and Environment for Statistical Computing; R Foundation for Statistical Computing: Vienna, Austria, 2021; Available online: https://www.R-project.org/ (accessed on 22 January 2022).
- Barrett, J.C.; Fry, B.; Maller, J.; Daly, M.J. Haploview: Analysis and visualization of LD and haplotype maps. Bioinformatics 2005, 21, 263–265. [Google Scholar] [CrossRef] [Green Version]
- Ahsan, T.; Urmi, N.J.; Sajib, A.A. Heterogeneity in the distribution of 159 drug-response related SNPs in world populations and their genetic relatedness. PLoS ONE 2020, 15, e0228000. [Google Scholar] [CrossRef] [PubMed] [Green Version]
- Evans, D.M.; Cardon, L.R. A comparison of linkage disequilibrium patterns and estimated population recombination rates across multiple populations. Am. J. Hum. Genet. 2005, 76, 681–687. [Google Scholar] [CrossRef] [Green Version]
- Howe, K.L.; Achuthan, P.; Allen, J.; Allen, J.; Alvarez-Jarreta, J.; Amode, M.R.; Armean, I.M.; Azov, A.G.; Bennett, R.; Bhai, J.; et al. Ensembl 2021. Nucleic Acids Res. 2021, 49, D884–D891. [Google Scholar] [CrossRef] [PubMed]
- Wickham, H. ggplot2: Elegant Graphics for Data Analysis; Springer: New York, NY, USA, 2016; Available online: https://ggplot2.tidyverse.org (accessed on 25 January 2022).
- Nagaraj, S.H.; Toombs, M. The gene-drug duality: Exploring the pharmacogenomics of indigenous populations. Front. Genet. 2021, 12, 687116. [Google Scholar] [CrossRef]
- Font-Porterias, N.; Giménez, A.; Carballo-Mesa, A.; Calafell, F.; Comas, D. Admixture has shaped romani genetic diversity in clinically relevant variants. Front. Genet. 2021, 12, 683880. [Google Scholar] [CrossRef] [PubMed]
- Zajc Petranovic, M.; Tomas, Z.; Skaric-Juric, T.; Smolej Narancic, N.; Janicijevic, B.; Stojanovic Markovic, A.; Pericic Salihovic, M. The variability of multi-drug resistance ABCB1 gene in the Roma population from Croatia. Mol. Exp. Biol. Med. 2019, 2, 10–18. [Google Scholar] [CrossRef]
- Sipeky, C.; Csongei, V.; Jaromi, L.; Safrany, E.; Maasz, A.; Takacs, I.; Beres, J.; Fodor, L.; Szabo, M.; Melegh, B. Genetic variability and haplotype profile of MDR1 (ABCB1) in Roma and Hungarian population samples with a review of the literature. Drug Metab. Pharmacokinet. 2011, 26, 206–215. [Google Scholar] [CrossRef] [Green Version]
- Tomas, Z.; Kuhanec, A.; Skaric-Juric, T.; Zajc Petranovic, M.; Smolej Narancic, N.; Janicijevic, B.; Pericic Salihovic, M. Distinctiveness of the Roma population within CYP2B6 worldwide variation. Pharmacogenomics 2017, 18, 1575–1587. [Google Scholar] [CrossRef]
- Weber, A.; Szalai, R.; Sipeky, C.; Magyari, L.; Melegh, M.; Jaromi, L.; Matyas, P.; Duga, B.; Kovesdi, E.; Hadzsiev, K.; et al. Increased prevalence of functional minor allele variants of drug metabolizing CYP2B6 and CYP2D6 genes in Roma population samples. Pharmacol. Rep. 2015, 67, 460–464. [Google Scholar] [CrossRef] [PubMed]
- Dlouhá, L.; Adámková, V.; Šedová, L.; Olišarová, V.; Hubáček, J.A.; Tóthová, V. Five genetic polymorphisms of cytochrome P450 enzymes in the Czech non-Roma and Czech Roma population samples. Drug Metab. Pers. Ther. 2020, 35, 20200103. [Google Scholar] [CrossRef] [PubMed]
- Zajc Petranovic, M.; Tomas, Z.; Skaric-Juric, T.; Smolej Narancic, N.; Janicicjevic, B.; Pericic Salihovic, M. The variation of CYP2C19 gene in the Roma population from Croatia. Mol. Exp. Biol. Med. 2018, 1, 32–37. [Google Scholar]
- Sipeky, C.; Weber, A.; Szabo, M.; Melegh, B.I.; Janicsek, I.; Tarlos, G.; Szabo, I.; Sumegi, K.; Melegh, B. High prevalence of CYP2C19*2 allele in Roma samples: Study on Roma and Hungarian population samples with review of the literature. Mol. Biol. Rep. 2013, 40, 4727–4735. [Google Scholar] [CrossRef]
- Petrović, J.; Pešić, V.; Lauschke, V.M. Frequencies of clinically important CYP2C19 and CYP2D6 alleles are graded across Europe. Eur. J. Hum. Genet. 2019, 28, 88–94. [Google Scholar] [CrossRef] [Green Version]
- Teixeira, J.; Amorim, A.; Prata, M.J.; Quental, S. Pharmacogenetic polymorphisms in a Portuguese gypsy population. Curr. Pharm. Person. Med. 2015, 13, 36–40. [Google Scholar] [CrossRef]
- Stojanović Marković, A.; Zajc Petranović, M.; Škobalj, M.; Poloni, E.S.; Pichler Oberški, L.; Škarić-Jurić, T.; Pericic Salihović, M. From dietary adaptation in the past to drug metabolism of today: An example of NAT genes in the Croatian Roma. Am. J. Biol. Anthropol. 2022, 178, 140–153. [Google Scholar] [CrossRef]
- Elias, A.B.R.; Araújo, G.S.; de Souza, S.J.; Suarez-Kurtz, G. Distribution and linkage disequilibrium of the enhancer SNP rs5758550 among Latin American populations: Influence of continental ancestry. Pharm. Genom. 2020, 30, 67–72. [Google Scholar] [CrossRef]
- Wang, D.; Papp, A.C.; Sun, X. Functional characterization of CYP2D6 enhancer polymorphisms. Hum. Mol. Genet. 2015, 24, 1556–1562. [Google Scholar] [CrossRef] [Green Version]
- Raimundo, S.; Fischer, J.; Eichelbaum, M.; Griese, E.U.; Schwab, M.; Zanger, U.M. Elucidation of the genetic basis of the common ‘intermediate metabolizer’ phenotype for drug oxidation by CYP2D6. Pharmacogenetics 2000, 10, 577–581. [Google Scholar] [CrossRef]
- Zanger, U.M.; Fischer, J.; Raimundo, S.; Stüven, T.; Evert, B.O.; Schwab, M.; Eichelbaum, M. Comprehensive analysis of the genetic factors determining expression and function of hepatic CYP2D6. Pharmacogenetics 2011, 11, 573–585. [Google Scholar] [CrossRef] [PubMed]
- Pratt, V.M.; Cavallari, L.H.; Del Tredici, A.L.; Gaedigk, A.; Hachad, H.; Ji, Y.; Kalman, L.V.; Ly, R.C.; Moyer, A.M.; Scott, S.A.; et al. Recommendations for clinical CYP2D6 genotyping allele selection. J. Mol. Diagn. 2021, 23, 1047–1064. [Google Scholar] [CrossRef] [PubMed]
- Gaedigk, A.; Sangkuhl, K.; Whirl-Carrillo, M.; Klein, T.; Leeder, J.S. Prediction of CYP2D6 phenotype from genotype across world populations. Genet. Med. 2017, 19, 69–76. [Google Scholar] [CrossRef] [PubMed] [Green Version]
- Li, J.; Zhang, L.; Zhou, H.; Stoneking, M.; Tang, K. Global patterns of genetic diversity and signals of natural selection for human ADME genes. Hum. Mol. Genet. 2011, 20, 528–540. [Google Scholar] [CrossRef] [Green Version]


| Polymorphisms | Genotypes and Alleles | Baranja | Medjimurje | Balkan | Total | Chi Square | p | HWE Baranja | HWE Medjimurje | HWE Balkan | |
|---|---|---|---|---|---|---|---|---|---|---|---|
| rs133333 | genotypes | A/A | 78 | 53 | 56 | 187 | 8.298 | 0.081 | 0.038 | 0.739 | 0.303 |
| A/G | 24 | 39 | 30 | 93 | |||||||
| G/G | 6 | 6 | 7 | 19 | |||||||
| alleles | A | 180 | 145 | 142 | 467 | 5.738 | 0.057 | ||||
| G | 36 | 51 | 44 | 131 | |||||||
| rs5758550 | genotypes | A/A | 78 | 54 | 56 | 188 | 8.186 | 0.085 | 0.092 | 0.499 | 0.491 |
| A/G | 27 | 43 | 33 | 103 | |||||||
| G/G | 6 | 6 | 7 | 19 | |||||||
| alleles | A | 183 | 151 | 145 | 479 | 5.549 | 0.062 | ||||
| G | 39 | 55 | 47 | 141 | |||||||
| rs1080993 | genotypes | C/C | 113 | 107 | 93 | 313 | |||||
| alleles | C | 226 | 214 | 186 | 626 | ||||||
| rs34894147 | genotypes | CC/CC | 112 | 104 | 96 | 312 | |||||
| alleles | CC | 224 | 208 | 192 | 624 | ||||||
| rs1376235338 | genotypes | C/C | 114 | 104 | 96 | 314 | |||||
| alleles | C | 228 | 208 | 192 | 628 | ||||||
| rs35046171 | genotypes | G/G | 113 | 104 | 95 | 312 | 1.019 | 0.601 | 0.963 | 0.959 | |
| A/G | 1 | 0 | 1 | 2 | |||||||
| alleles | G | 227 | 208 | 191 | 626 | 1.016 | 0.602 | ||||
| A | 1 | 0 | 1 | 2 | |||||||
| rs1224722684 | genotypes | G/G | 114 | 105 | 96 | 315 | |||||
| alleles | G | 228 | 210 | 192 | 630 | ||||||
| rs34167214 | genotypes | A/A | 113 | 105 | 94 | 312 | 0.864 | 0.649 | 0.963 | 0.961 | |
| C/A | 1 | 1 | 0 | 2 | |||||||
| alleles | A | 227 | 211 | 188 | 626 | 0.861 | 0.650 | ||||
| C | 1 | 1 | 0 | 2 | |||||||
| rs1409156443 | genotypes | C/C | 113 | 106 | 96 | 315 | |||||
| alleles | C | 226 | 212 | 192 | 630 | ||||||
| rs28624811 | genotypes | G/G | 45 | 40 | 34 | 119 | 3.573 | 0.467 | 0.123 | 0.598 | 0.251 |
| G/A | 44 | 51 | 41 | 136 | |||||||
| A/A | 20 | 13 | 20 | 53 | |||||||
| alleles | G | 134 | 131 | 109 | 374 | 1.392 | 0.499 | ||||
| A | 84 | 77 | 81 | 242 | |||||||
| rs536645539 | genotypes | TC/TC | 112 | 106 | 93 | 311 | |||||
| alleles | TC | 224 | 212 | 186 | 622 | ||||||
| rs1080990 | genotypes | C/C | 114 | 104 | 94 | 312 | |||||
| alleles | C | 228 | 208 | 188 | 624 | ||||||
| rs1080989 | genotypes | C/C | 60 | 58 | 47 | 165 | 1.335 | 0.855 | 0.912 | 0.181 | 0.515 |
| C/T | 45 | 35 | 35 | 115 | |||||||
| T/T | 8 | 10 | 9 | 27 | |||||||
| alleles | C | 165 | 151 | 129 | 445 | 0.335 | 0.846 | ||||
| T | 61 | 55 | 53 | 169 | |||||||
| rs28735595 | genotypes | C/C | 46 | 39 | 45 | 130 | 3.900 | 0.420 | 0.981 | 0.517 | 0.913 |
| C/T | 51 | 45 | 39 | 135 | |||||||
| T/T | 14 | 17 | 8 | 39 | |||||||
| alleles | C | 143 | 123 | 129 | 395 | 3.642 | 0.162 | ||||
| T | 79 | 79 | 55 | 213 | |||||||
| rs28588594 | genotypes | G/G | 60 | 60 | 49 | 169 | 1.074 | 0.898 | 0.890 | 0.158 | 0.461 |
| G/A | 45 | 35 | 35 | 115 | |||||||
| A/A | 9 | 10 | 9 | 28 | |||||||
| alleles | G | 165 | 155 | 133 | 453 | 0.273 | 0.873 | ||||
| A | 63 | 55 | 53 | 171 | |||||||
| rs1080985 | genotypes | G/G | 75 | 55 | 53 | 183 | 5.757 | 0.218 | 0.085 | 0.523 | 0.697 |
| C/G | 29 | 43 | 32 | 104 | |||||||
| C/C | 7 | 6 | 6 | 19 | |||||||
| alleles | G | 179 | 153 | 138 | 470 | 3.153 | 0.207 | ||||
| C | 43 | 55 | 44 | 142 | |||||||
| rs58188898 | genotypes | G/G | 111 | 106 | 96 | 313 | |||||
| alleles | G | 222 | 212 | 192 | 626 | ||||||
| rs1080983 | genotypes | C/C | 49 | 42 | 35 | 126 | 3.769 | 0.438 | 0.096 | 0.619 | 0.277 |
| T/C | 45 | 50 | 41 | 136 | |||||||
| T/T | 20 | 12 | 19 | 51 | |||||||
| alleles | C | 143 | 134 | 111 | 388 | 1.601 | 0.449 | ||||
| T | 85 | 74 | 79 | 238 |
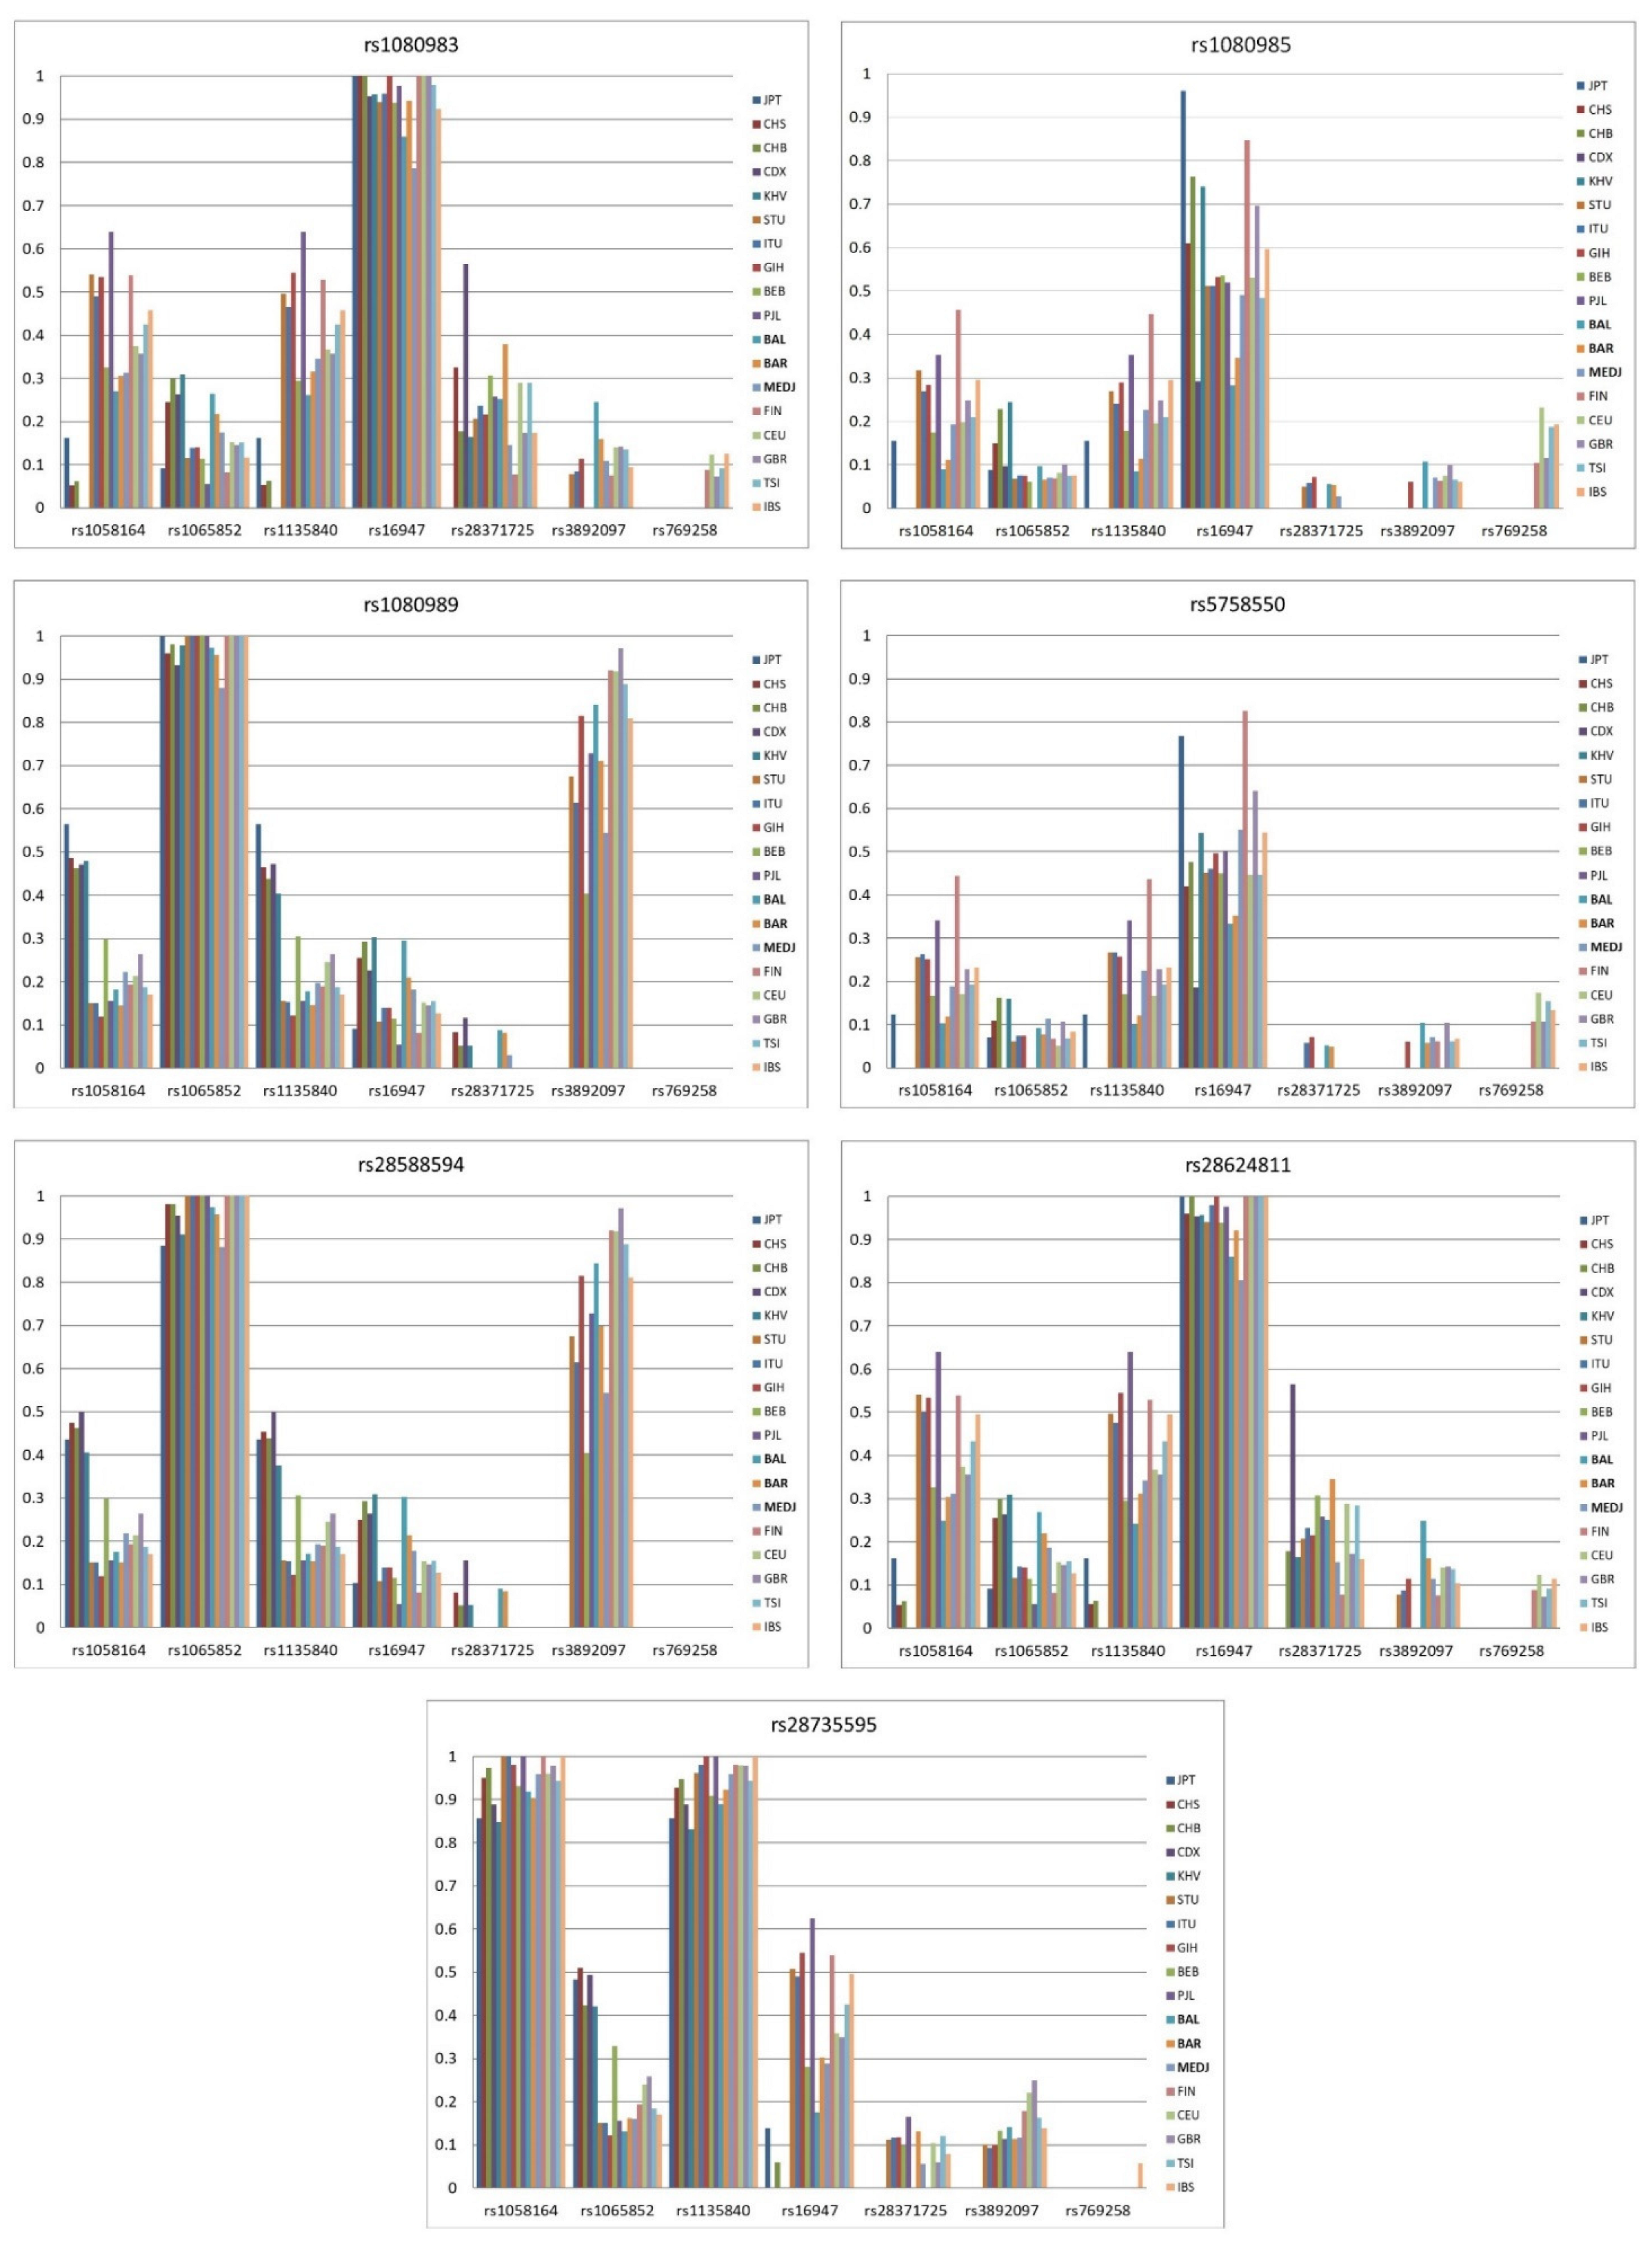
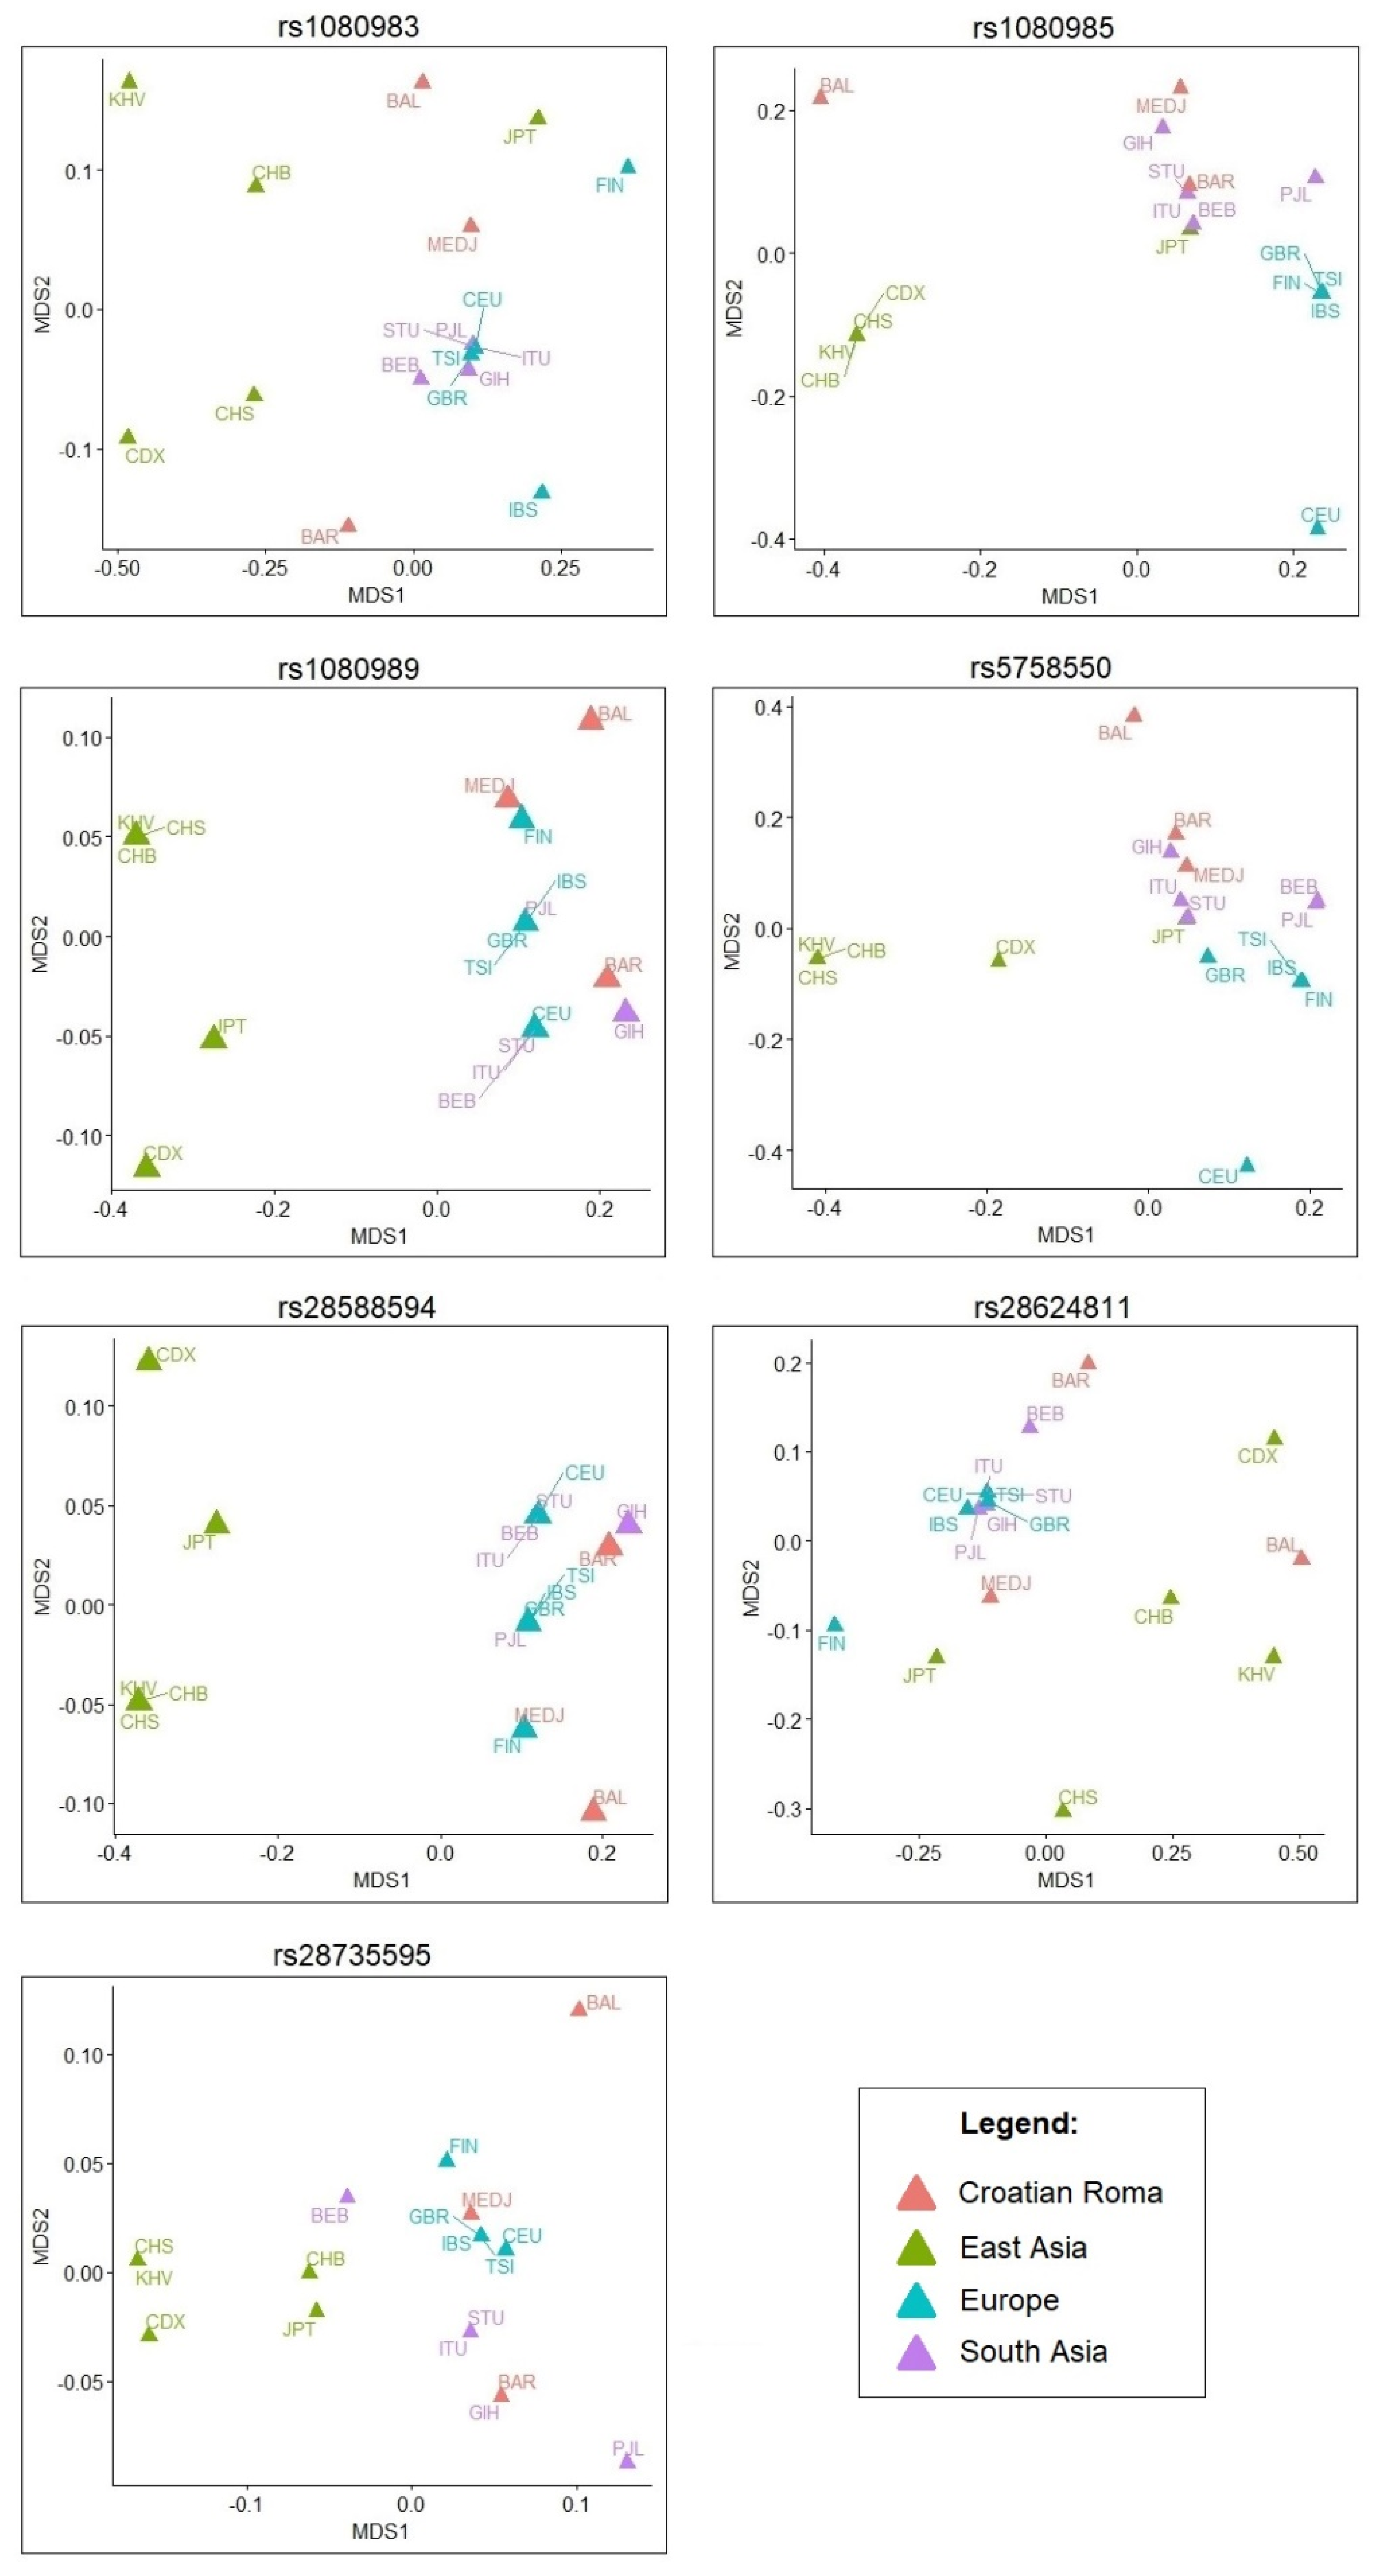
| Baranja | Medjimurje | Balkan | ||
|---|---|---|---|---|
| L1 | L2 | r2 | r2 | r2 |
| rs133333 | rs5758550 | 1 | 1 | 1 |
| rs133333 | rs1135840 | 0.116 | 0.210 | 0.094 |
| rs133333 | rs28371725 | 0.046 | 0.030 | 0.051 |
| rs133333 | rs16947 | 0.350 | 0.527 | 0.322 |
| rs133333 | rs3892097 | 0.056 | 0.071 | 0.104 |
| rs133333 | rs1058164 | 0.113 | 0.175 | 0.098 |
| rs133333 | rs1065852 | 0.075 | 0.114 | 0.089 |
| rs133333 | rs769258 | 0.047 | 0.039 | |
| rs133333 | rs28624811 | 0.344 | 0.618 | 0.437 |
| rs133333 | rs1080989 | 0.077 | 0.131 | 0.119 |
| rs133333 | rs28735595 | 0.111 | 0.218 | 0.123 |
| rs133333 | rs28588594 | 0.079 | 0.131 | 0.123 |
| rs133333 | rs1080985 | 0.877 | 0.920 | 0.937 |
| rs133333 | rs1080983 | 0.347 | 0.642 | 0.430 |
| rs5758550 | rs1135840 | 0.121 | 0.224 | 0.100 |
| rs5758550 | rs28371725 | 0.050 | 0.029 | 0.052 |
| rs5758550 | rs16947 | 0.353 | 0.551 | 0.333 |
| rs5758550 | rs3892097 | 0.057 | 0.072 | 0.105 |
| rs5758550 | rs1058164 | 0.118 | 0.188 | 0.103 |
| rs5758550 | rs1065852 | 0.077 | 0.114 | 0.092 |
| rs5758550 | rs769258 | 0.043 | 0.036 | |
| rs5758550 | rs28624811 | 0.353 | 0.635 | 0.442 |
| rs5758550 | rs1080989 | 0.079 | 0.130 | 0.119 |
| rs5758550 | rs28735595 | 0.115 | 0.232 | 0.130 |
| rs5758550 | rs28588594 | 0.081 | 0.130 | 0.123 |
| rs5758550 | rs1080985 | 0.884 | 0.925 | 0.941 |
| rs5758550 | rs1080983 | 0.350 | 0.659 | 0.436 |
| rs1135840 | rs28624811 | 0.312 | 0.342 | 0.241 |
| rs1135840 | rs1080989 | 0.147 | 0.197 | 0.178 |
| rs1135840 | rs28735595 | 0.922 | 0.958 | 0.890 |
| rs1135840 | rs28588594 | 0.153 | 0.194 | 0.171 |
| rs1135840 | rs1080985 | 0.114 | 0.227 | 0.086 |
| rs1135840 | rs1080983 | 0.315 | 0.345 | 0.262 |
| rs28371725 | rs28624811 | 0.345 | 0.153 | 0.251 |
| rs28371725 | rs1080989 | 0.082 | 0.031 | 0.089 |
| rs28371725 | rs28735595 | 0.132 | 0.056 | 0.043 |
| rs28371725 | rs28588594 | 0.084 | 0.030 | 0.090 |
| rs28371725 | rs1080985 | 0.054 | 0.028 | 0.056 |
| rs28371725 | rs1080983 | 0.379 | 0.146 | 0.252 |
| rs16947 | rs28624811 | 0.921 | 0.807 | 0.861 |
| rs16947 | rs1080989 | 0.210 | 0.183 | 0.296 |
| rs16947 | rs28735595 | 0.303 | 0.289 | 0.175 |
| rs16947 | rs28588594 | 0.214 | 0.178 | 0.303 |
| rs16947 | rs1080985 | 0.346 | 0.491 | 0.283 |
| rs16947 | rs1080983 | 0.943 | 0.787 | 0.860 |
| rs3892097 | rs28624811 | 0.161 | 0.115 | 0.249 |
| rs3892097 | rs1080989 | 0.710 | 0.543 | 0.842 |
| rs3892097 | rs28735595 | 0.114 | 0.116 | 0.141 |
| rs3892097 | rs28588594 | 0.698 | 0.544 | 0.844 |
| rs3892097 | rs1080985 | 0.043 | 0.070 | 0.107 |
| rs3892097 | rs1080983 | 0.159 | 0.108 | 0.245 |
| rs1058164 | rs28624811 | 0.303 | 0.312 | 0.248 |
| rs1058164 | rs1080989 | 0.145 | 0.222 | 0.183 |
| rs1058164 | rs28735595 | 0.903 | 0.959 | 0.918 |
| rs1058164 | rs28588594 | 0.151 | 0.218 | 0.176 |
| rs1058164 | rs1080985 | 0.111 | 0.192 | 0.090 |
| rs1058164 | rs1080983 | 0.306 | 0.312 | 0.270 |
| rs1065852 | rs28624811 | 0.219 | 0.186 | 0.269 |
| rs1065852 | rs1080989 | 0.956 | 0.880 | 0.973 |
| rs1065852 | rs28735595 | 0.162 | 0.160 | 0.132 |
| rs1065852 | rs28588594 | 0.957 | 0.881 | 0.973 |
| rs1065852 | rs1080985 | 0.066 | 0.070 | 0.096 |
| rs1065852 | rs1080983 | 0.217 | 0.175 | 0.264 |
| rs769258 | rs28624811 | 0.015 | 0.015 | |
| rs769258 | rs1080989 | 0.003 | 0.002 | |
| rs769258 | rs28735595 | 0.005 | 0.001 | |
| rs769258 | rs28588594 | 0.003 | 0.001 | |
| rs769258 | rs1080985 | 0.038 | 0.039 | |
| rs769258 | rs1080983 | 0.015 | 0.016 | |
| rs28624811 | rs1080989 | 0.226 | 0.210 | 0.284 |
| rs28624811 | rs28735595 | 0.332 | 0.360 | 0.309 |
| rs28624811 | rs28588594 | 0.230 | 0.213 | 0.290 |
| rs28624811 | rs1080985 | 0.371 | 0.567 | 0.401 |
| rs28624811 | rs1080983 | 0.981 | 1 | 1 |
| rs1080989 | rs28735595 | 0.167 | 0.190 | 0.181 |
| rs1080989 | rs28588594 | 1 | 1 | 1 |
| rs1080989 | rs1080985 | 0.068 | 0.095 | 0.127 |
| rs1080989 | rs1080983 | 0.223 | 0.206 | 0.282 |
| rs28735595 | rs28588594 | 0.172 | 0.190 | 0.170 |
| rs28735595 | rs1080985 | 0.134 | 0.231 | 0.096 |
| rs28735595 | rs1080983 | 0.336 | 0.360 | 0.307 |
| rs28588594 | rs1080985 | 0.071 | 0.091 | 0.127 |
| rs28588594 | rs1080983 | 0.227 | 0.200 | 0.285 |
| rs1080985 | rs1080983 | 0.376 | 0.582 | 0.404 |
Publisher’s Note: MDPI stays neutral with regard to jurisdictional claims in published maps and institutional affiliations. |
© 2022 by the authors. Licensee MDPI, Basel, Switzerland. This article is an open access article distributed under the terms and conditions of the Creative Commons Attribution (CC BY) license (https://creativecommons.org/licenses/by/4.0/).
Share and Cite
Stojanović Marković, A.; Celinšćak, Ž.; Šetinc, M.; Škarić-Jurić, T.; Peričić Salihović, M.; Zajc Petranović, M. From Croatian Roma to 1000 Genomes: The Story of the CYP2D6 Gene Promoter and Enhancer SNPs. J. Pers. Med. 2022, 12, 1353. https://doi.org/10.3390/jpm12081353
Stojanović Marković A, Celinšćak Ž, Šetinc M, Škarić-Jurić T, Peričić Salihović M, Zajc Petranović M. From Croatian Roma to 1000 Genomes: The Story of the CYP2D6 Gene Promoter and Enhancer SNPs. Journal of Personalized Medicine. 2022; 12(8):1353. https://doi.org/10.3390/jpm12081353
Chicago/Turabian StyleStojanović Marković, Anita, Željka Celinšćak, Maja Šetinc, Tatjana Škarić-Jurić, Marijana Peričić Salihović, and Matea Zajc Petranović. 2022. "From Croatian Roma to 1000 Genomes: The Story of the CYP2D6 Gene Promoter and Enhancer SNPs" Journal of Personalized Medicine 12, no. 8: 1353. https://doi.org/10.3390/jpm12081353