Transcript Levels of Aldo-Keto Reductase Family 1 Subfamily C (AKR1C) Are Increased in Prostate Tissue of Patients with Type 2 Diabetes

 , , , ,
Abstract
:1. Introduction
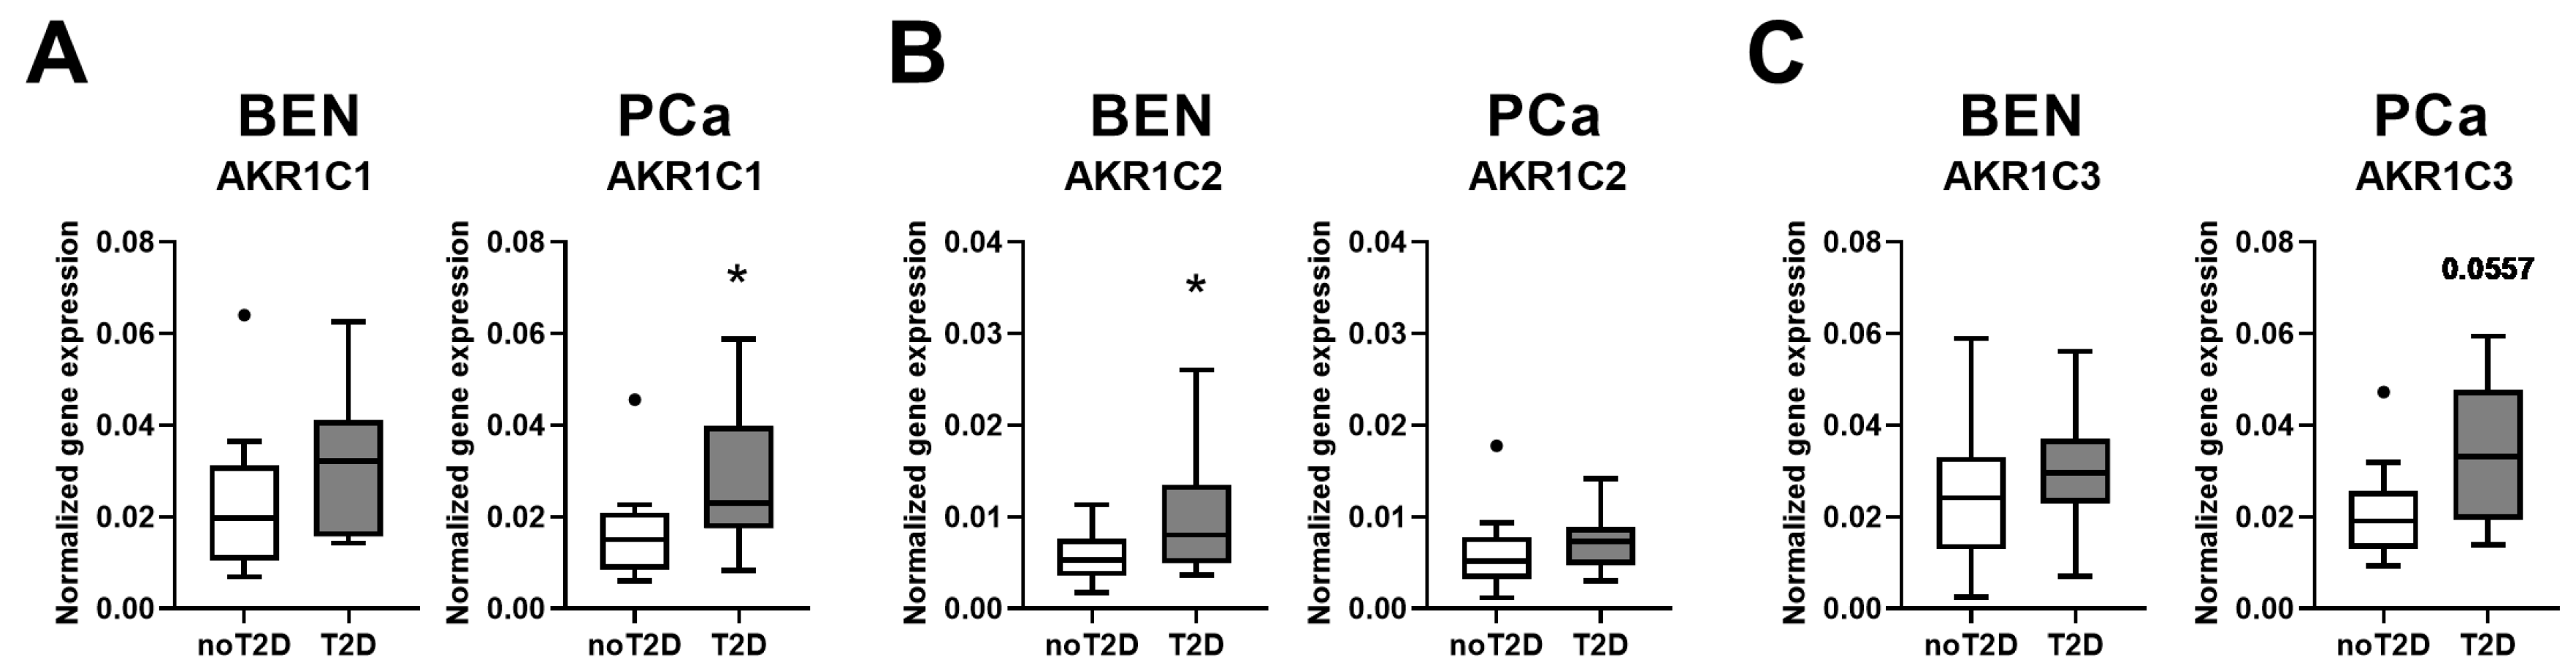
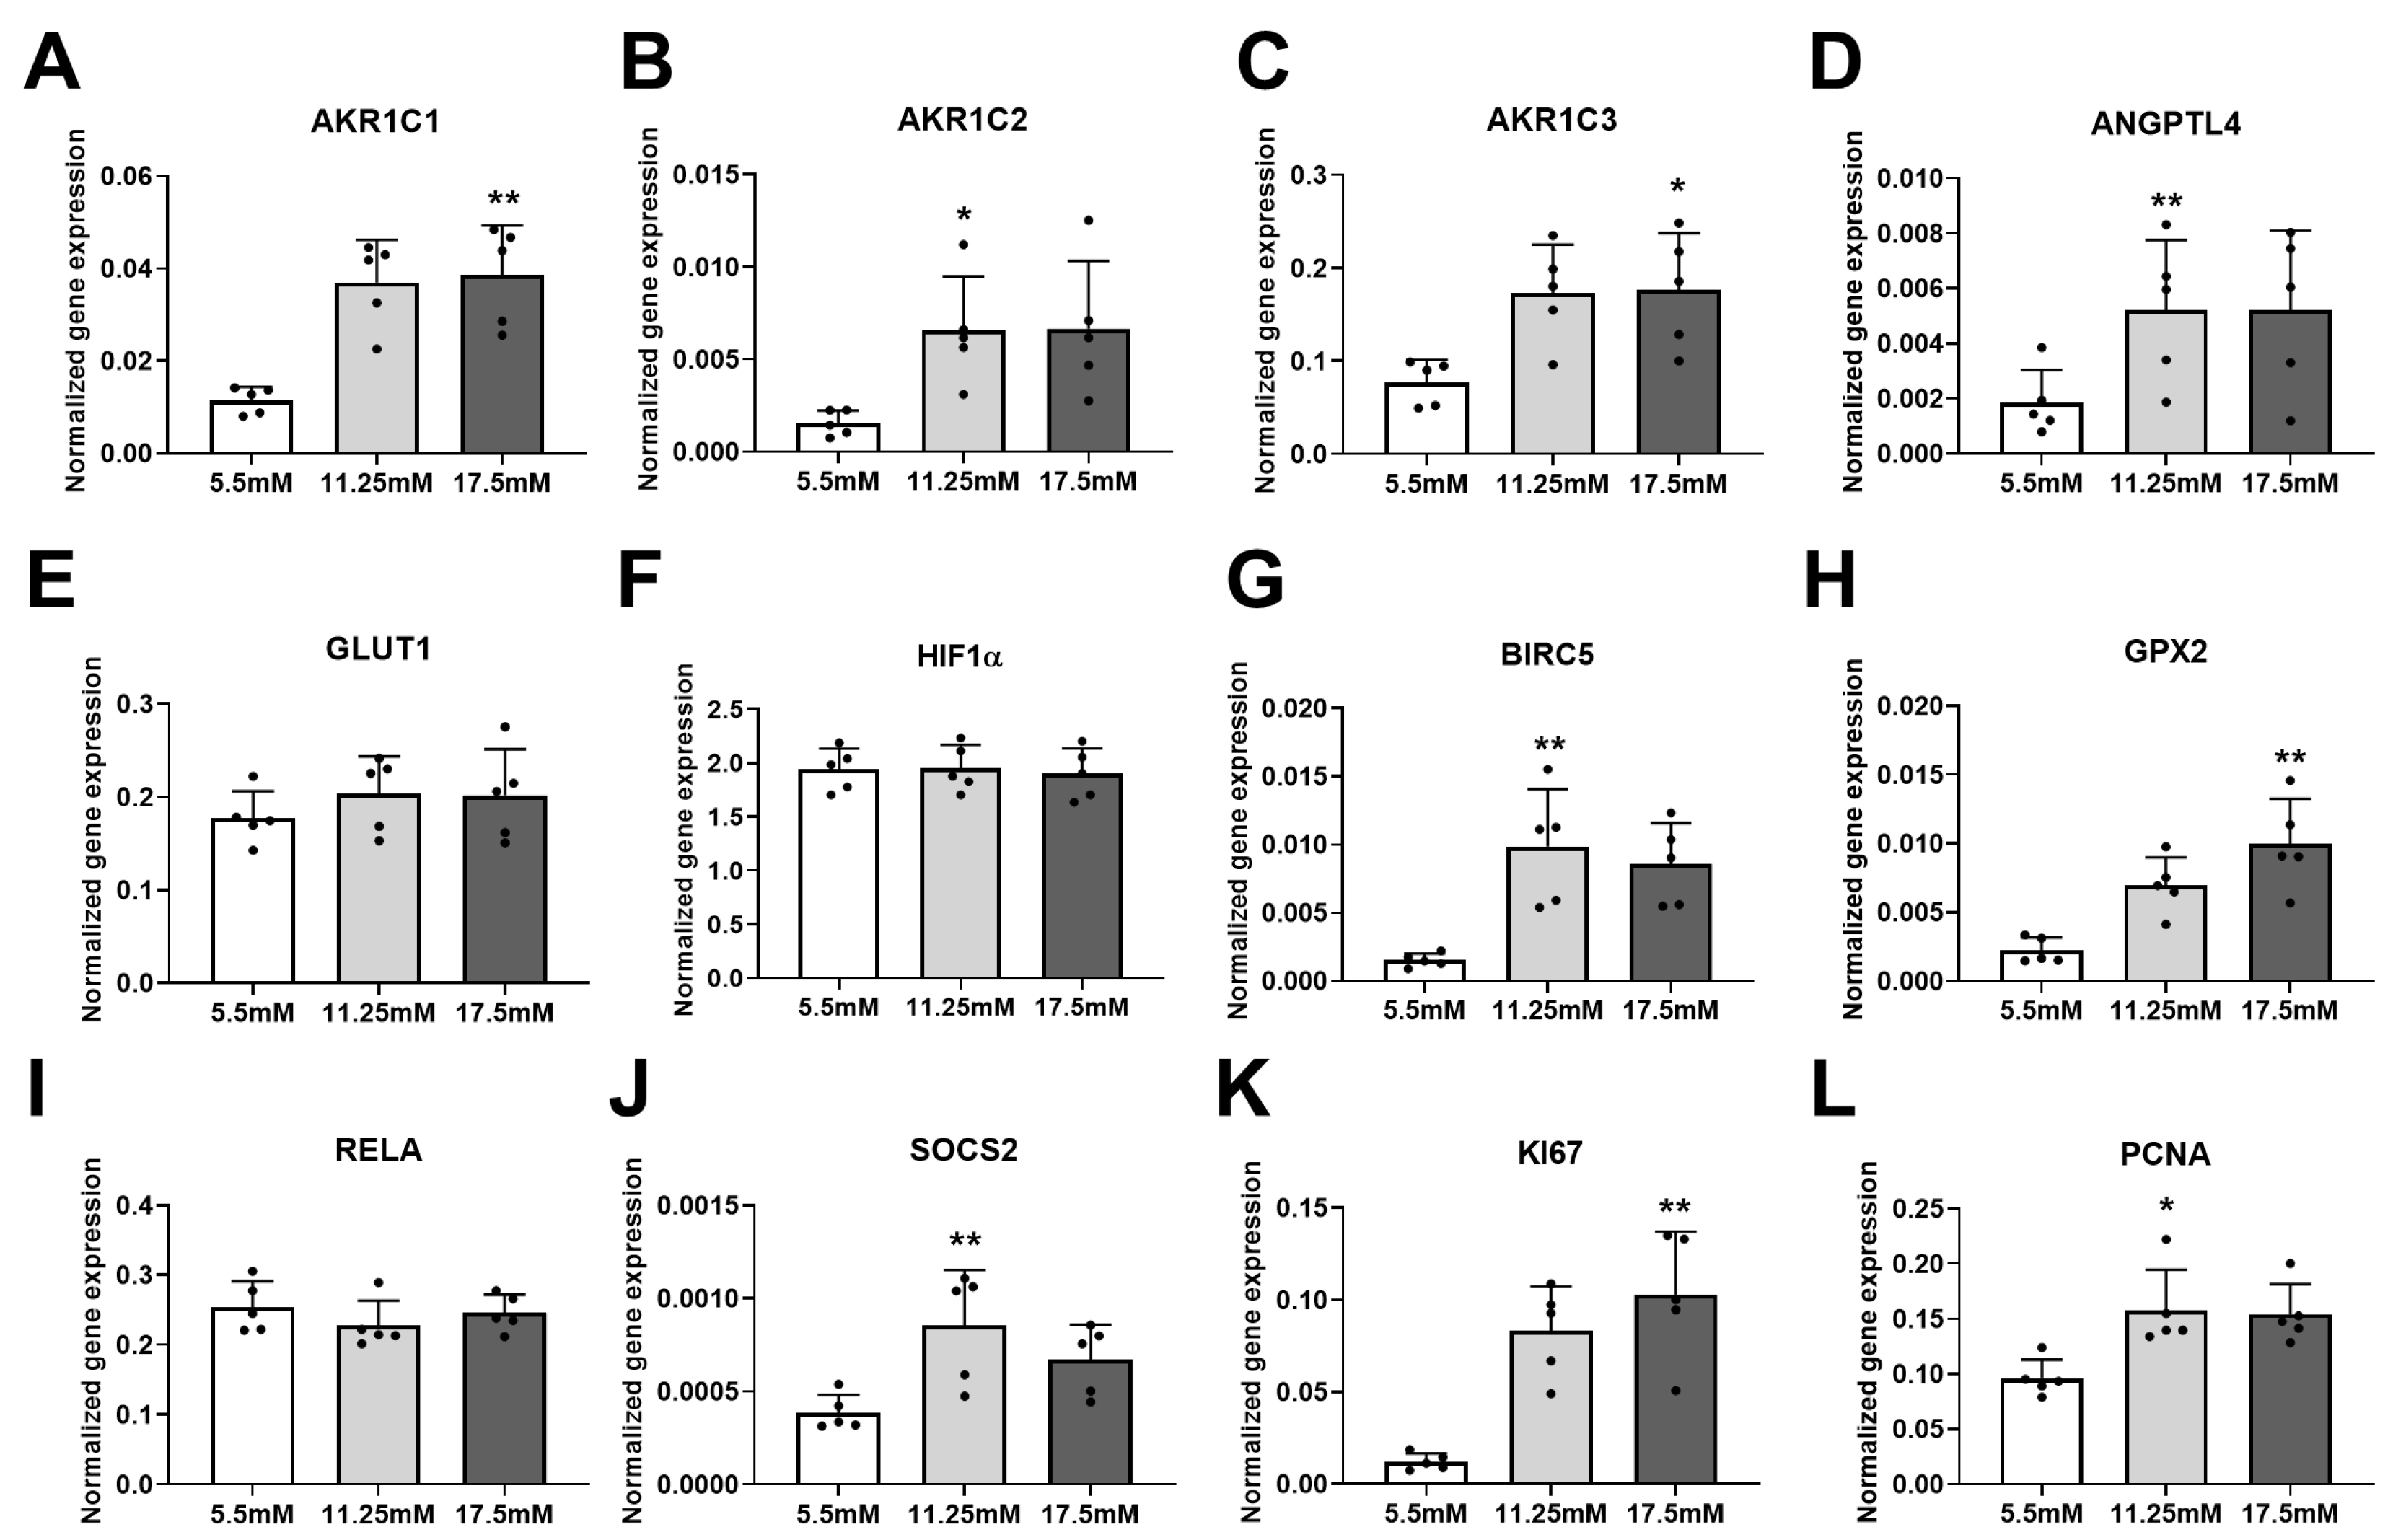
2. Results
3. Discussion
4. Materials and Methods
- Human samples
- Cell culture
- Real-time PCR
- Statistical analysis
5. Conclusions
Supplementary Materials
Author Contributions
Funding
Acknowledgments
Conflicts of Interest
Abbreviations
| ADT | Androgen deprivation therapy |
| AKR1 | Aldo-keto reductase superfamily 1 |
| BEN | Benign |
| BMI | Body mass index |
| CRPCa | Castrate-resistant prostate cancer |
| DHT | Dihydrotestosterone |
| HIF1α | Hypoxia-inducible factor 1 subunit alpha |
| NFκB | Nuclear factor of kappa light chain gene enhancer in B-cells |
| PCa | Prostate cancer |
| PGF2α | Prostaglandin 2 alpha |
| T | Testosterone |
| T2D | Type 2 diabetes |
References
- Kirchain, W.R.; Rendell, M.S. Aldose reductase inhibitors. Pharmacotherapy 1990, 10, 326–336. [Google Scholar] [PubMed]
- Maccari, R.; Ottanà, R. Targeting aldose reductase for the treatment of diabetes complications and inflammatory diseases: New insights and future directions. J. Med. Chem. 2015, 58, 2047–2067. [Google Scholar] [CrossRef] [PubMed]
- Penning, T.M.; Wangtrakuldee, P.; Auchus, R.J. Structural and Functional Biology of Aldo-Keto Reductase Steroid-Transforming Enzymes. Endocr. Rev. 2019, 40, 447–475. [Google Scholar] [CrossRef] [PubMed]
- Chang, K.C.; Petrash, J.M. Aldo-Keto Reductases: Multifunctional Proteins as Therapeutic Targets in Diabetes and Inflammatory Disease. Adv. Exp. Med. Biol. 2018, 1032, 173–202. [Google Scholar] [CrossRef]
- Dowarah, J.; Singh, V.P. Anti-diabetic drugs recent approaches and advancements. Bioorg. Med. Chem. 2020, 28, 115263. [Google Scholar] [CrossRef]
- Hussain, S.; Chowdhury, T.A. The Impact of Comorbidities on the Pharmacological Management of Type 2 Diabetes Mellitus. Drugs 2019, 79, 231–242. [Google Scholar] [CrossRef]
- Crawley, D.; Chamberlain, F.; Garmo, H.; Rudman, S.; Zethelius, B.; Holmberg, L.; Adolfsson, J.; Stattin, P.; Carroll, P.; Van Hemelrijck, M. A systematic review of the literature exploring the interplay between prostate cancer and type two diabetes mellitus. Ecancermedicalscience 2018, 12, 802. [Google Scholar] [CrossRef] [Green Version]
- Lutz, S.Z.; Todenhofer, T.; Wagner, R.; Hennenlotter, J.; Ferchl, J.M.; Scharpf, M.O.; Martus, P.; Staiger, H.; Fritsche, A.; Stenzl, A.; et al. Higher prevalence of lymph node metastasis in prostate cancer in patients with diabetes. Endocr. Relat. Cancer 2018, 25, L19–L22. [Google Scholar] [CrossRef] [Green Version]
- Bensimon, L.; Yin, H.; Suissa, S.; Pollak, M.N.; Azoulay, L. Type 2 diabetes and the risk of mortality among patients with prostate cancer. Cancer Causes Control. 2014, 25, 329–338. [Google Scholar] [CrossRef]
- Rižner, T.L.; Penning, T.M. Role of aldo-keto reductase family 1 (AKR1) enzymes in human steroid metabolism. Steroids 2014, 79, 49–63. [Google Scholar] [CrossRef] [Green Version]
- Zeng, C.M.; Chang, L.L.; Ying, M.D.; Cao, J.; He, Q.J.; Zhu, H.; Yang, B. Aldo-Keto Reductase AKR1C1-AKR1C4: Functions, Regulation, and Intervention for Anti-cancer Therapy. Front. Pharmacol. 2017, 8, 119. [Google Scholar] [CrossRef] [PubMed]
- Häggström, C.; Van Hemelrijck, M.; Garmo, H.; Robinson, D.; Stattin, P.; Rowley, M.; Coolen, A.C.C.; Holmberg, L. Heterogeneity in risk of prostate cancer: A Swedish population-based cohort study of competing risks and Type 2 diabetes mellitus. Int. J. Cancer 2018, 143, 1868–1875. [Google Scholar] [CrossRef] [PubMed]
- Velaer, K.N.; Leppert, J.T. Diabetes Medications, Prostate-Specific Antigen Values, and the Chemoprevention of Prostate Cancer. JAMA Netw. Open 2019, 2, e1914644. [Google Scholar] [CrossRef] [PubMed]
- Cai, H.; Xu, Z.; Xu, T.; Yu, B.; Zou, Q. Diabetes mellitus is associated with elevated risk of mortality amongst patients with prostate cancer: A meta-analysis of 11 cohort studies. Diabetes Metab. Res. Rev. 2015, 31, 336–343. [Google Scholar] [CrossRef]
- Di Sebastiano, K.M.; Pinthus, J.H.; Duivenvoorden, W.C.M.; Mourtzakis, M. Glucose impairments and insulin resistance in prostate cancer: The role of obesity, nutrition and exercise. Obes. Rev. Off. J. Int. Assoc. Study Obes. 2018, 19, 1008–1016. [Google Scholar] [CrossRef]
- Jhan, J.H.; Yeh, H.C.; Chang, Y.H.; Guu, S.J.; Wu, W.J.; Chou, Y.H.; Li, C.C. New-onset diabetes after androgen-deprivation therapy for prostate cancer: A nationwide propensity score-matched four-year longitudinal cohort study. J. Diabetes Complicat. 2018, 32, 688–692. [Google Scholar] [CrossRef]
- Gunter, J.H.; Sarkar, P.L.; Lubik, A.A.; Nelson, C.C. New players for advanced prostate cancer and the rationalisation of insulin-sensitising medication. Int. J. Cell Biol. 2013, 2013, 834684. [Google Scholar] [CrossRef] [Green Version]
- Saraswat, M.; Mrudula, T.; Kumar, P.U.; Suneetha, A.; Rao Rao, T.S.; Srinivasulu, M.; Reddy, B. Overexpression of aldose reductase in human cancer tissues. Med. Sci. Monit. Int. Med. J. Exp. Clin. Res. 2006, 12, CR525–CR529. [Google Scholar]
- Baba, S.P.; Barski, O.A.; Ahmed, Y.; O’Toole, T.E.; Conklin, D.J.; Bhatnagar, A.; Srivastava, S. Reductive metabolism of AGE precursors: A metabolic route for preventing AGE accumulation in cardiovascular tissue. Diabetes 2009, 58, 2486–2497. [Google Scholar] [CrossRef] [Green Version]
- Stefan, N.; Schick, F.; Häring, H.U. Causes, Characteristics, and Consequences of Metabolically Unhealthy Normal Weight in Humans. Cell Metab. 2017, 26, 292–300. [Google Scholar] [CrossRef]
- Sarkar, P.L.; Lee, W.; Williams, E.D.; Lubik, A.A.; Stylianou, N.; Shokoohmand, A.; Lehman, M.L.; Hollier, B.G.; Gunter, J.H.; Nelson, C.C. Insulin Enhances Migration and Invasion in Prostate Cancer Cells by Up-Regulation of FOXC2. Front. Endocrinol. 2019, 10, 481. [Google Scholar] [CrossRef] [Green Version]
- Yang, T.; Zhou, Y.; Wang, H.; Chen, S.; Shen, M.; Hu, Y.; Wang, T.; Liu, J.; Jiang, Z.; Wang, Z.; et al. Insulin exacerbated high glucose-induced epithelial-mesenchymal transition in prostatic epithelial cells BPH-1 and prostate cancer cells PC-3 via MEK/ERK signaling pathway. Exp. Cell Res. 2020, 394, 112145. [Google Scholar] [CrossRef] [PubMed]
- Russo, M.A.; Ravenna, L.; Pellegrini, L.; Petrangeli, E.; Salvatori, L.; Magrone, T.; Fini, M.; Tafani, M. Hypoxia and Inflammation in Prostate Cancer Progression. Cross-talk with Androgen and Estrogen Receptors and Cancer Stem Cells. Endocr. Metab. Immune Disord. Drug. Targets 2016, 16, 235–248. [Google Scholar] [CrossRef] [PubMed]
- Zhang, T.; Kastrenopoulou, A.; Larrouture, Q.; Athanasou, N.A.; Knowles, H.J. Angiopoietin-like 4 promotes osteosarcoma cell proliferation and migration and stimulates osteoclastogenesis. BMC Cancer 2018, 18, 536. [Google Scholar] [CrossRef] [PubMed] [Green Version]
- Debelec-Butuner, B.; Alapinar, C.; Varisli, L.; Erbaykent-Tepedelen, B.; Hamid, S.M.; Gonen-Korkmaz, C.; Korkmaz, K.S. Inflammation-mediated abrogation of androgen signaling: An in vitro model of prostate cell inflammation. Mol. Carcinog. 2014, 53, 85–97. [Google Scholar] [CrossRef] [Green Version]
- McIlwain, D.W.; Fishel, M.L.; Boos, A.; Kelley, M.R.; Jerde, T.J. APE1/Ref-1 redox-specific inhibition decreases survivin protein levels and induces cell cycle arrest in prostate cancer cells. Oncotarget 2018, 9, 10962–10977. [Google Scholar] [CrossRef] [Green Version]
- Zhao, Y.; Zheng, X.; Zhang, H.; Zhai, J.; Zhang, L.; Li, C.; Zeng, K.; Chen, Y.; Li, Q.; Hu, X. In vitro inhibition of AKR1Cs by sulphonylureas and the structural basis. Chem. Biol. Interact. 2015, 240, 310–315. [Google Scholar] [CrossRef]
- Jernberg, E.; Thysell, E.; Bovinder Ylitalo, E.; Rudolfsson, S.; Crnalic, S.; Widmark, A.; Bergh, A.; Wikström, P. Characterization of prostate cancer bone metastases according to expression levels of steroidogenic enzymes and androgen receptor splice variants. PLoS ONE 2013, 8, e77407. [Google Scholar] [CrossRef] [Green Version]
- Stanbrough, M.; Bubley, G.J.; Ross, K.; Golub, T.R.; Rubin, M.A.; Penning, T.M.; Febbo, P.G.; Balk, S.P. Increased expression of genes converting adrenal androgens to testosterone in androgen-independent prostate cancer. Cancer Res. 2006, 66, 2815–2825. [Google Scholar] [CrossRef] [Green Version]
- Zhang, A.; Zhang, J.; Plymate, S.; Mostaghel, E.A. Classical and Non-Classical Roles for Pre-Receptor Control of DHT Metabolism in Prostate Cancer Progression. Horm. Cancer 2016, 7, 104–113. [Google Scholar] [CrossRef] [Green Version]
- Yun, H.; Xie, J.; Olumi, A.F.; Ghosh, R.; Kumar, A.P. Activation of AKR1C1/ERβ induces apoptosis by downregulation of c-FLIP in prostate cancer cells: A prospective therapeutic opportunity. Oncotarget 2015, 6, 11600–11613. [Google Scholar] [CrossRef] [PubMed] [Green Version]
- Ji, Q.; Chang, L.; VanDenBerg, D.; Stanczyk, F.Z.; Stolz, A. Selective reduction of AKR1C2 in prostate cancer and its role in DHT metabolism. Prostate 2003, 54, 275–289. [Google Scholar] [CrossRef] [PubMed]
- Khvostova, E.P.; Otpuschennikov, A.A.; Pustylnyak, V.O.; Gulyaeva, L.F. Gene expression of androgen metabolising enzymes in benign and malignant prostatic tissues. Horm. Metab. Res. 2015, 47, 119–124. [Google Scholar] [CrossRef] [PubMed] [Green Version]
- Auchus, M.L.; Auchus, R.J. Human steroid biosynthesis for the oncologist. J. Investig. Med. Off. Publ. Am. Fed. Clin. Res. 2012, 60, 495–503. [Google Scholar] [CrossRef] [PubMed] [Green Version]
- Adeniji, A.O.; Chen, M.; Penning, T.M. AKR1C3 as a target in castrate resistant prostate cancer. J. Steroid. Biochem. Mol. Biol 2013, 137, 136–149. [Google Scholar] [CrossRef] [Green Version]
- Yepuru, M.; Wu, Z.; Kulkarni, A.; Yin, F.; Barrett, C.M.; Kim, J.; Steiner, M.S.; Miller, D.D.; Dalton, J.T.; Narayanan, R. Steroidogenic enzyme AKR1C3 is a novel androgen receptor-selective coactivator that promotes prostate cancer growth. Clin. Cancer Res. 2013, 19, 5613–5625. [Google Scholar] [CrossRef] [Green Version]
- Lutz, S.Z.; Hennenlotter, J.; Scharpf, M.O.; Sailer, C.; Fritsche, L.; Schmid, V.; Kantartzis, K.; Wagner, R.; Lehmann, R.; Berti, L.; et al. Androgen receptor overexpression in prostate cancer in type 2 diabetes. Mol. Metab. 2018, 8, 158–166. [Google Scholar] [CrossRef]
- Reuter, S.; Gupta, S.C.; Chaturvedi, M.M.; Aggarwal, B.B. Oxidative stress, inflammation, and cancer: How are they linked? Free Radic. Biol. Med. 2010, 49, 1603–1616. [Google Scholar] [CrossRef] [Green Version]
- Burczynski, M.E.; Sridhar, G.R.; Palackal, N.T.; Penning, T.M. The reactive oxygen species--and Michael acceptor-inducible human aldo-keto reductase AKR1C1 reduces the alpha,beta-unsaturated aldehyde 4-hydroxy-2-nonenal to 1,4-dihydroxy-2-nonene. J. Biol. Chem. 2001, 276, 2890–2897. [Google Scholar] [CrossRef] [Green Version]
- Chiang, Y.Y. Hepatocyte growth factor induces hypoxia-related interleukin-8 expression in lung adenocarcinoma cells. Mol. Carcinog. 2009, 48, 662–670. [Google Scholar] [CrossRef]
- Rižner, T.L. Enzymes of the AKR1B and AKR1C Subfamilies and Uterine Diseases. Front. Pharmacol. 2012, 3, 34. [Google Scholar] [CrossRef] [PubMed] [Green Version]
- Wang, S.; Yang, Q.; Fung, K.M.; Lin, H.K. AKR1C2 and AKR1C3 mediated prostaglandin D2 metabolism augments the PI3K/Akt proliferative signaling pathway in human prostate cancer cells. Mol. Cell Endocrinol. 2008, 289, 60–66. [Google Scholar] [CrossRef] [PubMed]
- Huang, K.H.; Chiou, S.H.; Chow, K.C.; Lin, T.Y.; Chang, H.W.; Chiang, I.P.; Lee, M.C. Overexpression of aldo-keto reductase 1C2 is associated with disease progression in patients with prostatic cancer. Histopathology 2010, 57, 384–394. [Google Scholar] [CrossRef]
- Kikuchi, A.; Furutani, T.; Azami, H.; Watanabe, K.; Niimi, T.; Kamiyama, Y.; Kuromitsu, S.; Baskin-Bey, E.; Heeringa, M.; Ouatas, T.; et al. In vitro and in vivo characterisation of ASP9521: A novel, selective, orally bioavailable inhibitor of 17β-hydroxysteroid dehydrogenase type 5 (17βHSD5; AKR1C3). Investig. New Drugs 2014, 32, 860–870. [Google Scholar] [CrossRef] [PubMed]
- Dankner, R.; Roth, J. More recent, better designed studies have weakened links between antidiabetes medications and cancer risk. Diabet. Med. 2020, 37, 194–202. [Google Scholar] [CrossRef] [Green Version]
- Yang, X.; So, W.Y.; Ma, R.C.; Yu, L.W.; Ko, G.T.; Kong, A.P.; Ng, V.W.; Luk, A.O.; Ozaki, R.; Tong, P.C.; et al. Use of sulphonylurea and cancer in type 2 diabetes-The Hong Kong Diabetes Registry. Diabetes Res. Clin. Pract. 2010, 90, 343–351. [Google Scholar] [CrossRef] [PubMed]
- Heni, M.; Hennenlotter, J.; Scharpf, M.; Lutz, S.Z.; Schwentner, C.; Todenhofer, T.; Schilling, D.; Kuhs, U.; Gerber, V.; Machicao, F.; et al. Insulin receptor isoforms A and B as well as insulin receptor substrates-1 and -2 are differentially expressed in prostate cancer. PLoS ONE 2012, 7, e50953. [Google Scholar] [CrossRef] [Green Version]
- Franko, A.; Berti, L.; Guirguis, A.; Hennenlotter, J.; Scharpf, M.O.; Hrabe De Angelis, M.; Stenzl, A.; Birkenfeld, A.L.; Peter, A.; Häring, H.U.; et al. Characterization of hormone-dependent pathways in seven human prostate cancer cell lines: A gene expression study. 2020. In preparation (This manuscript is currently under revision by the MDPI journal GENES, which is hopefully accepted soon). [Google Scholar]
- Franko, A.; Kovarova, M.; Feil, S.; Feil, R.; Wagner, R.; Heni, M.; Königsrainer, A.; Ruoss, M.; Nüssler, A.K.; Weigert, C.; et al. cGMP-dependent protein kinase I (cGKI) modulates human hepatic stellate cell activation. Metab. Clin. Exp. 2018, 88, 22–30. [Google Scholar] [CrossRef] [Green Version]
- Franko, A.; Shao, Y.; Heni, M.; Hennenlotter, J.; Hoene, M.; Hu, C.; Liu, X.; Zhao, X.; Wang, Q.; Birkenfeld, A.L.; et al. Human Prostate Cancer is Characterized by an Increase in Urea Cycle Metabolites. Cancers 2020, 12, E1814. [Google Scholar] [CrossRef]


| Linear Regression | AKR1C1 | AKR1C2 | AKR1C3 | ||||
|---|---|---|---|---|---|---|---|
| Pathway | Gene | Standard β | p-Value | Standard β | p-Value | Standard β | p-Value |
| AKR1C | AKR1C1 | 0.5122 | <0.0001 | 0.6021 | <0.0001 | ||
| AKR1C2 | 0.5524 | <0.0001 | 0.4702 | 0.0003 | |||
| AKR1C3 | 0.6554 | <0.0001 | 0.4746 | 0.0003 | |||
| HIF1α | ANGPTL4 | 0.2586 | 0.0683 | 0.2176 | 0.1125 | 0.0550 | 0.6903 |
| GLUT1 | 0.1761 | 0.2108 | 0.1155 | 0.3958 | 0.0790 | 0.5601 | |
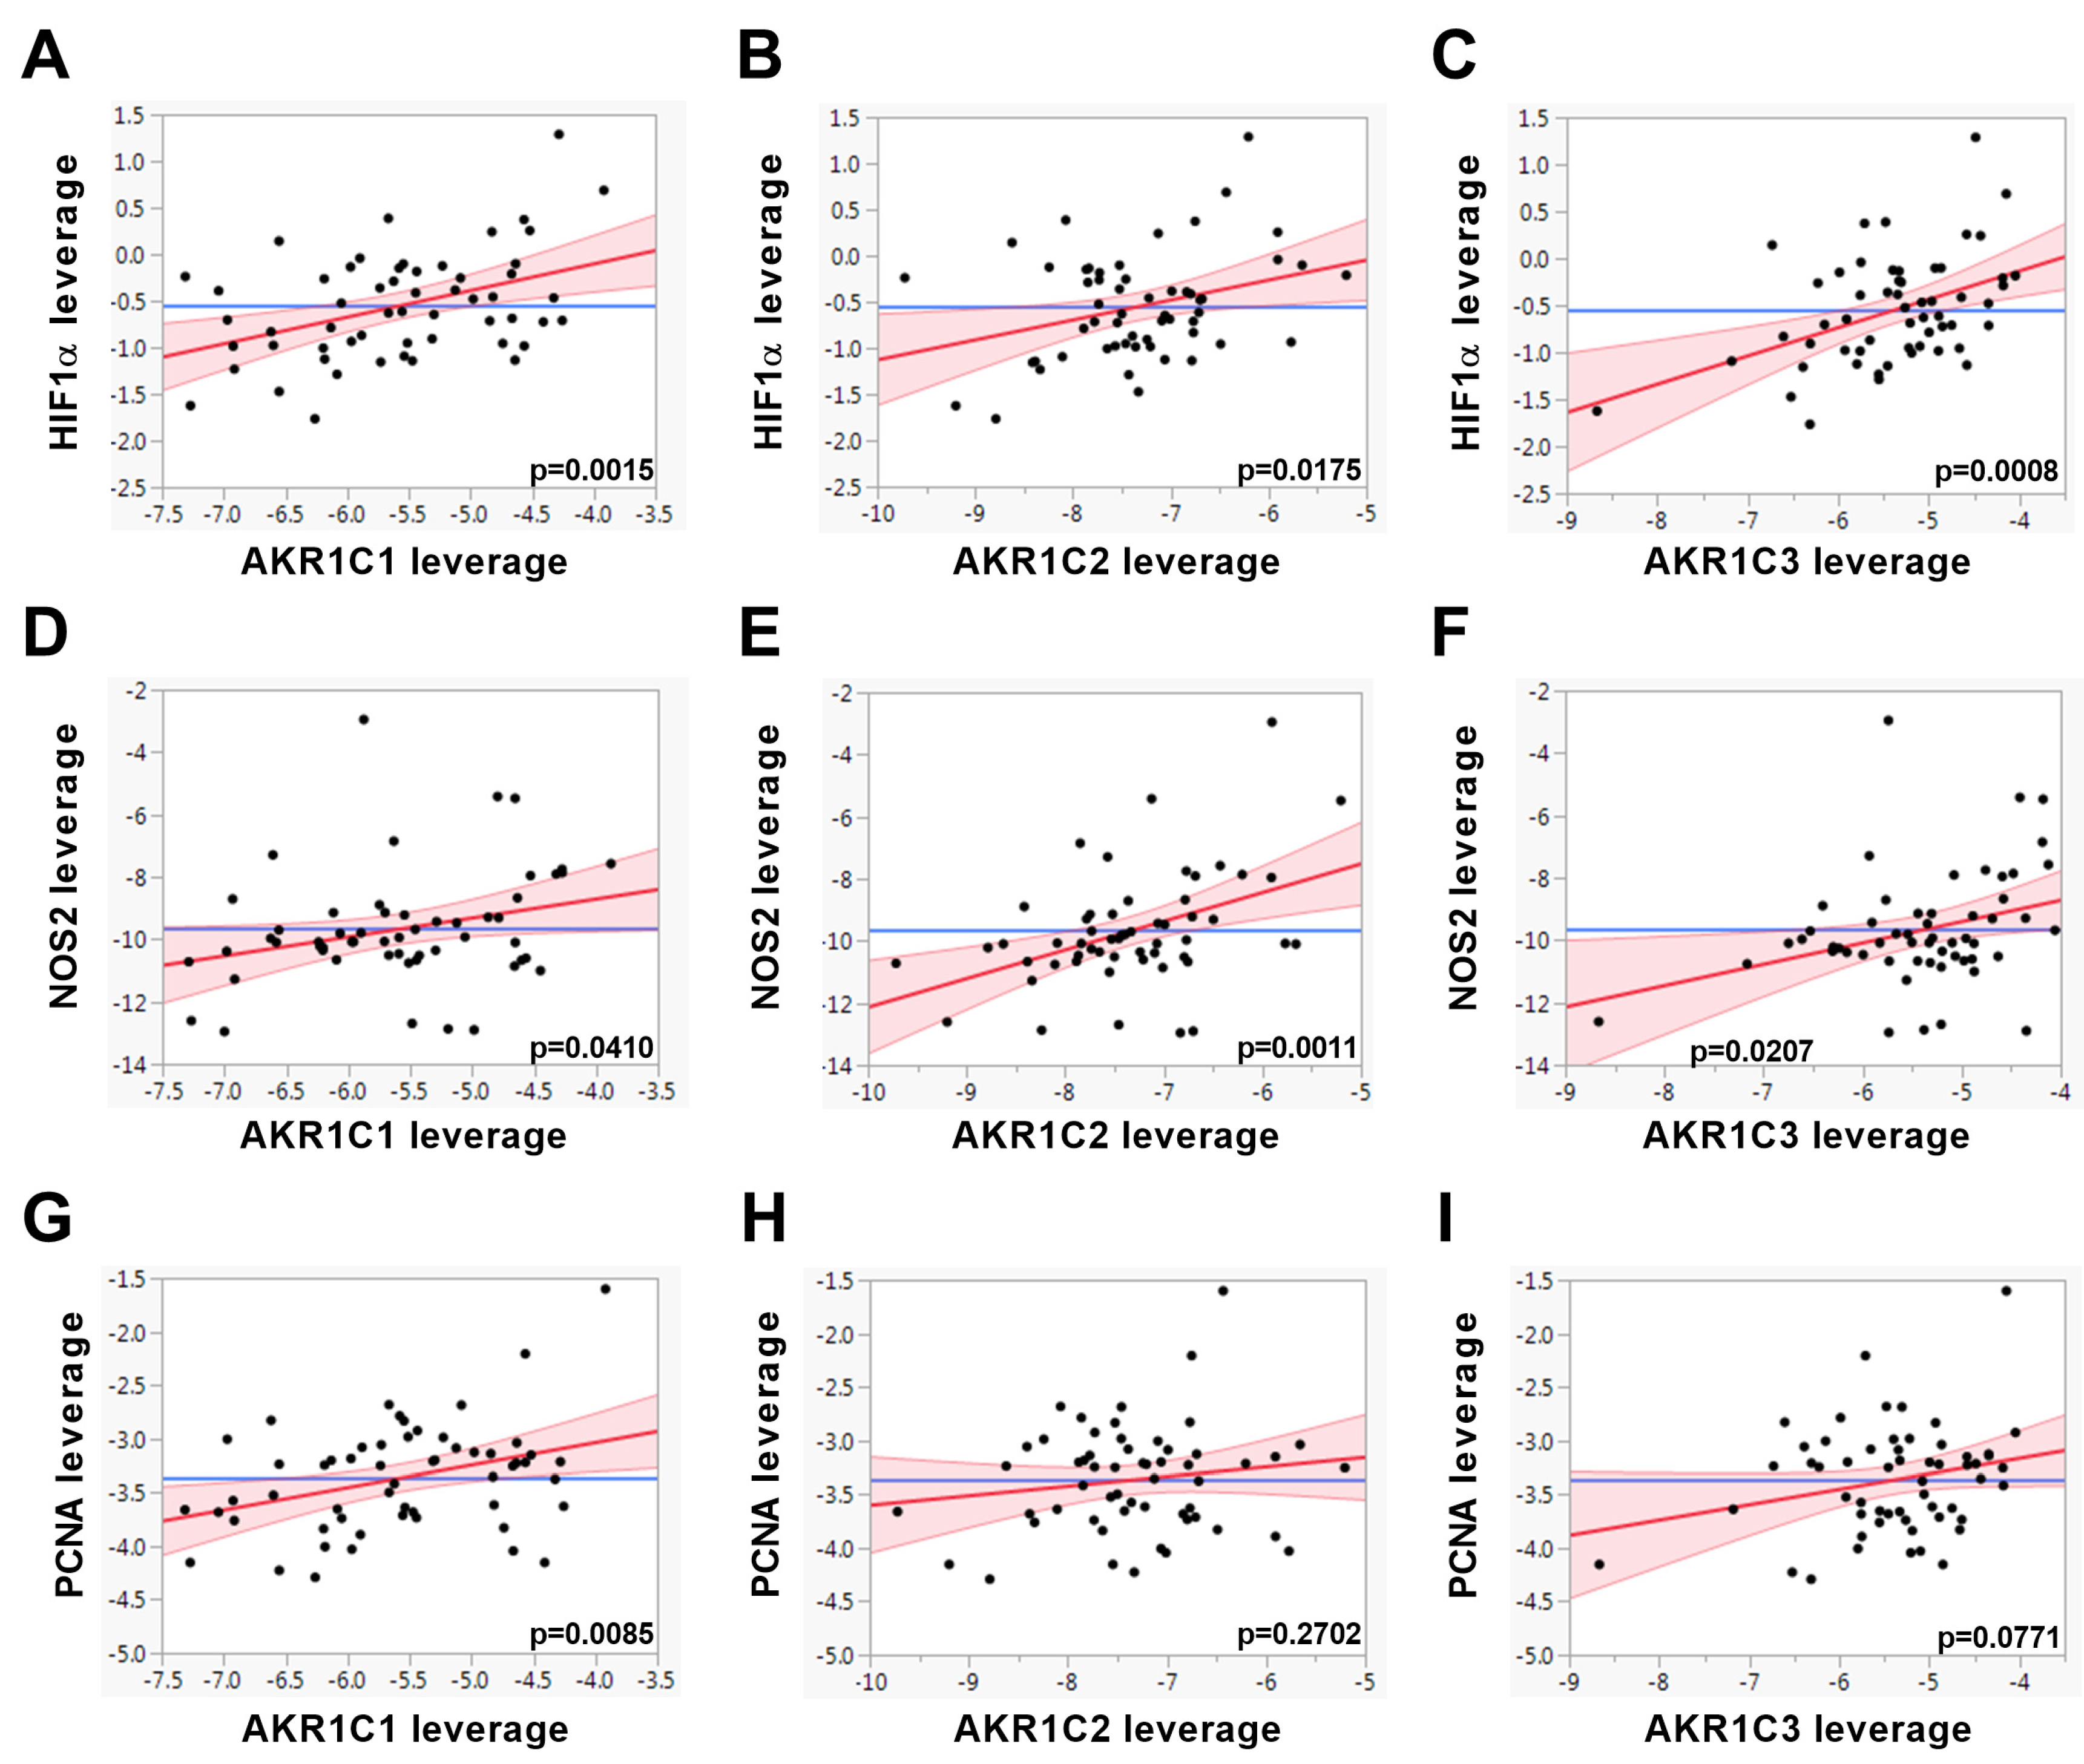
| HIF1α | 0.4168 | 0.0015 | 0.3059 | 0.0175 | 0.4182 | 0.0008 | |
| NFκB | BIRC5 | 0.0548 | 0.6973 | −0.0054 | 0.9683 | 0.2577 | 0.0522 |
| GPX2 | 0.3629 | 0.0086 | 0.2861 | 0.0334 | 0.0225 | 0.8693 | |
| NOS2 | 0.2843 | 0.0410 | 0.4239 | 0.0011 | 0.3070 | 0.0207 | |
| RELA | 0.3817 | 0.0042 | 0.2190 | 0.0963 | 0.3734 | 0.0034 | |
| SOCS2 | −0.0692 | 0.6319 | −0.0281 | 0.8399 | −0.1760 | 0.2008 | |
| proliferation | MKI67 | 0.1604 | 0.2341 | 0.0340 | 0.7944 | 0.2485 | 0.0517 |
| PCNA | 0.3425 | 0.0085 | 0.1419 | 0.2702 | 0.2245 | 0.0771 | |
| Linear Regression | AKR1C1 | AKR1C2 | AKR1C3 | ||||
|---|---|---|---|---|---|---|---|
| Pathway | Gene | Standard β | p-Value | Standard β | p-Value | Standard β | p-Value |
| AKR1C | AKR1C1 | 0.9654 | <0.0001 | 0.9582 | <0.0001 | ||
| AKR1C2 | 0.9654 | <0.0001 | 0.9773 | <0.0001 | |||
| AKR1C3 | 0.9582 | <0.0001 | 0.9773 | <0.0001 | |||
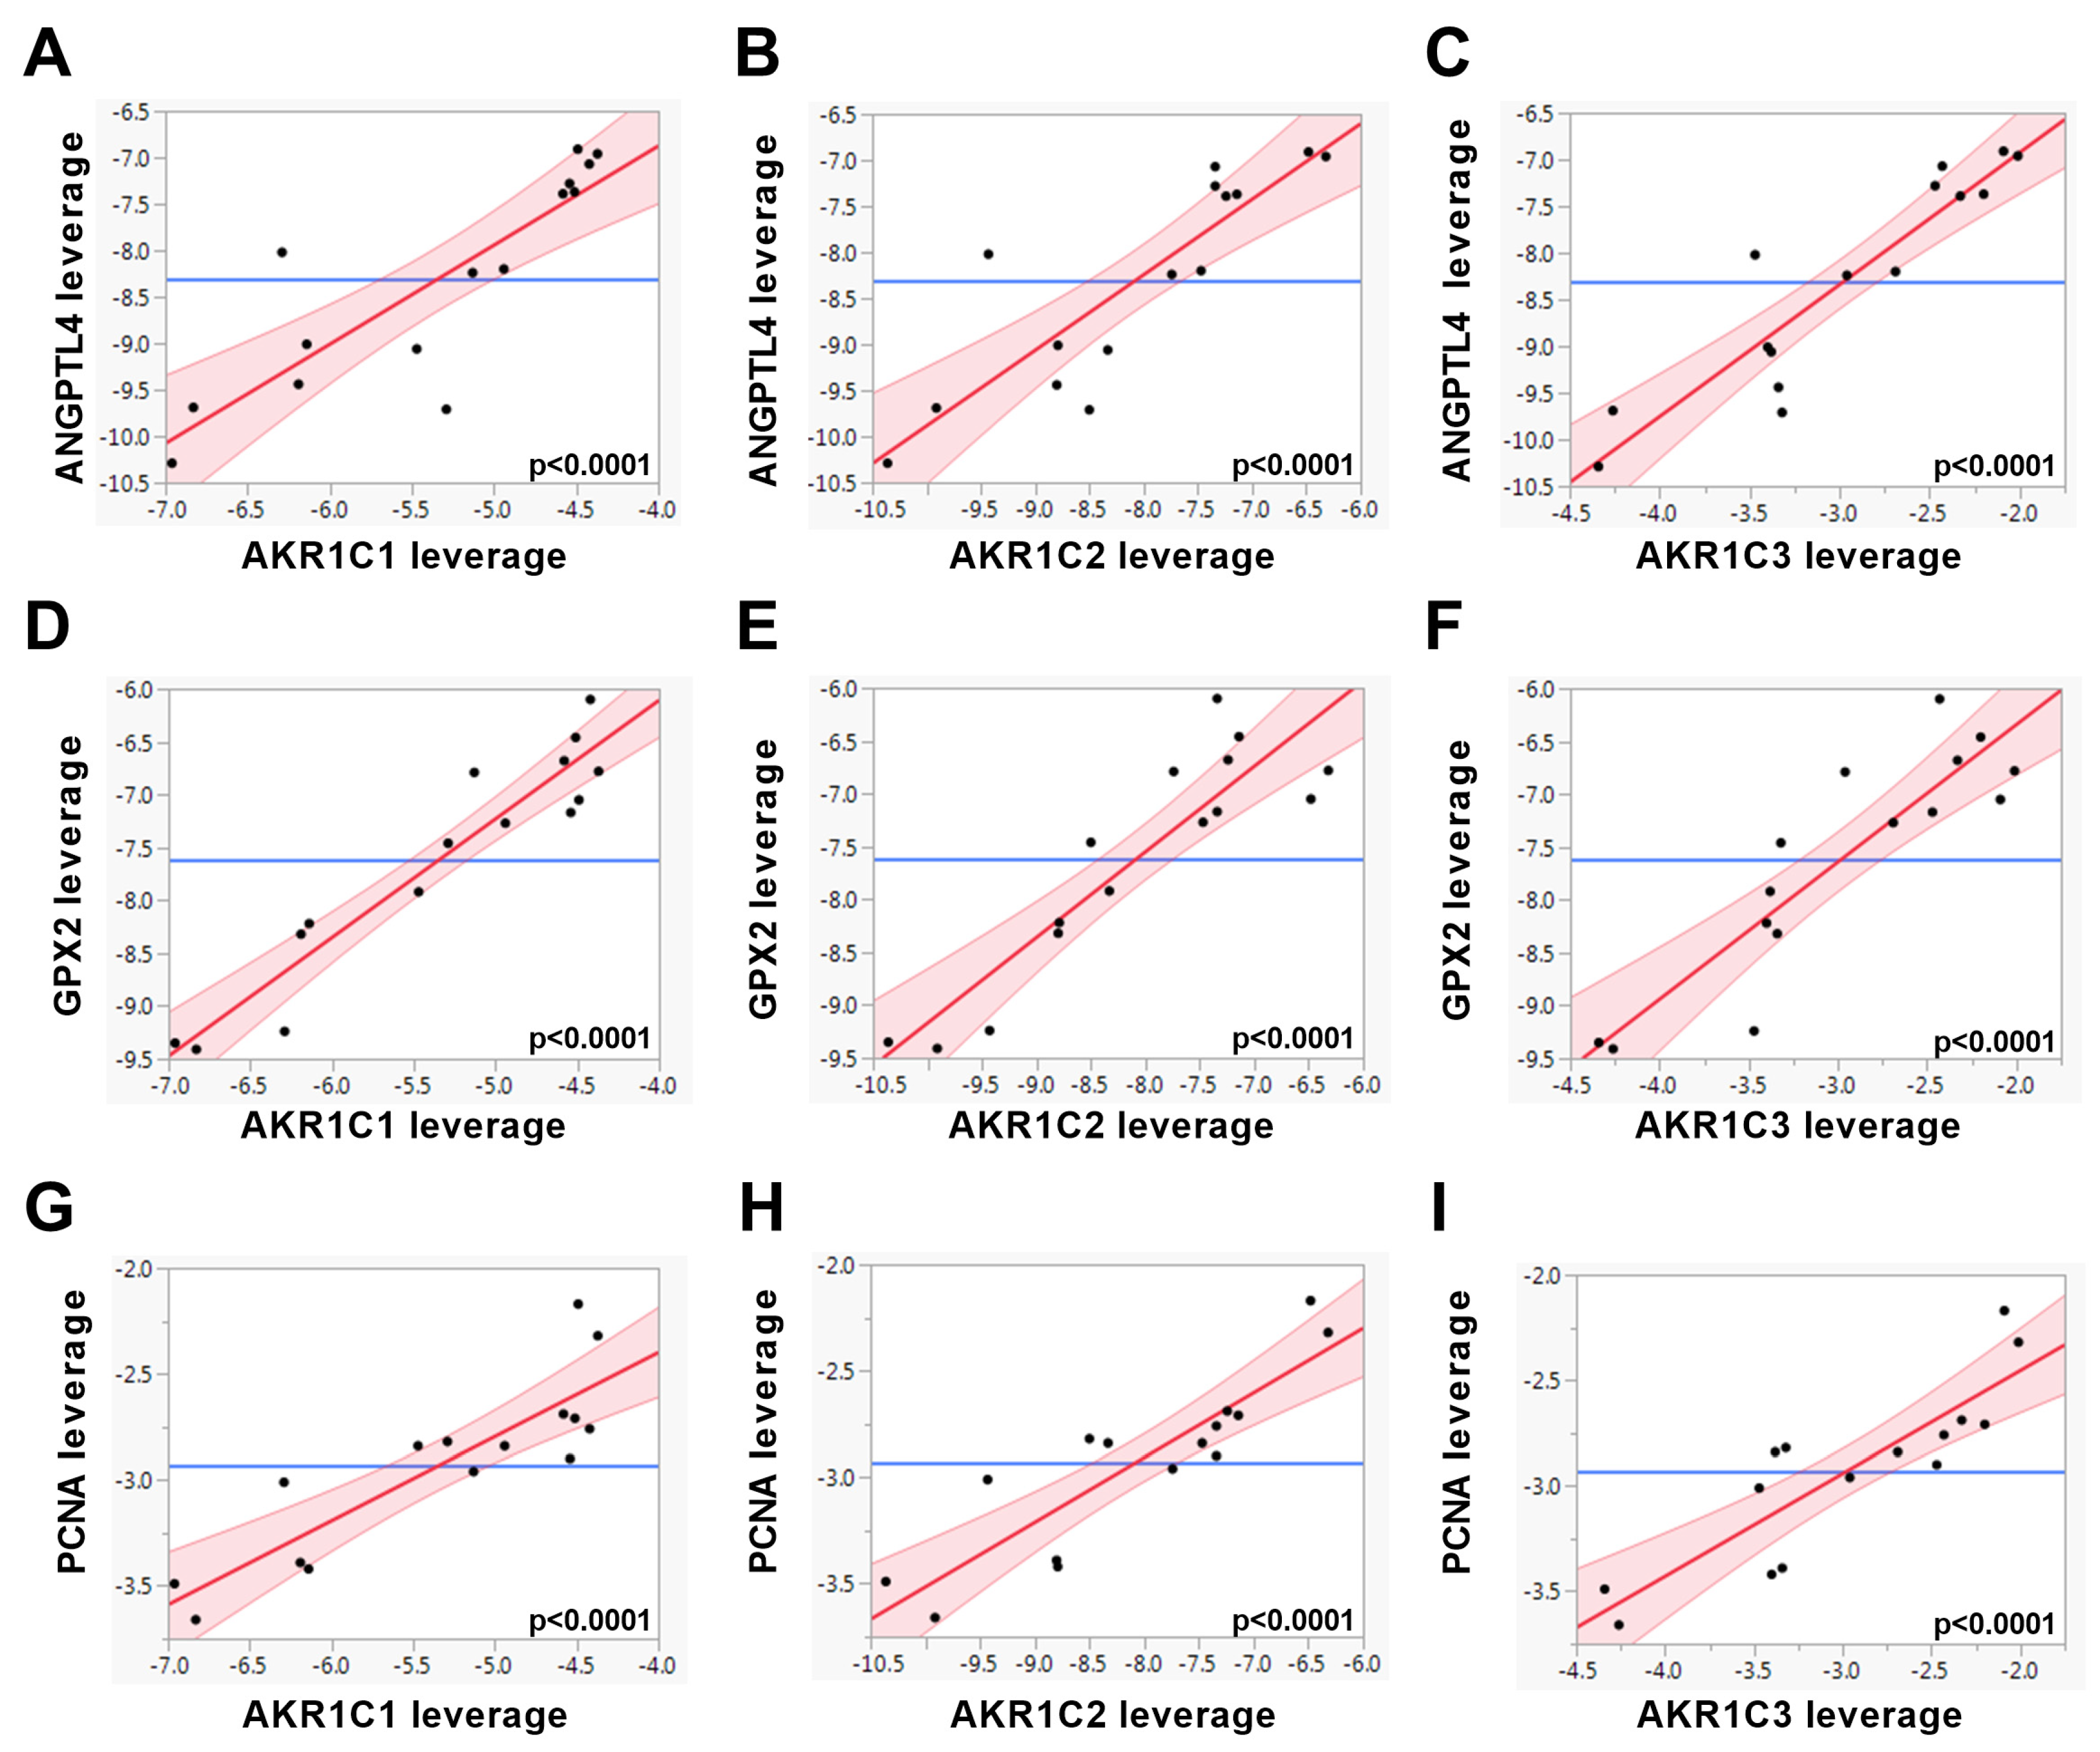
| HIF1α | ANGPTL4 | 0.8545 | <0.0001 | 0.8664 | <0.0001 | 0.9181 | <0.0001 |
| GLUT1 | 0.5896 | 0.0207 | 0.5393 | 0.0380 | 0.6683 | 0.0065 | |
| HIF1α | 0.1941 | 0.4883 | 0.2478 | 0.3732 | 0.3230 | 0.2403 | |
| NFκB | BIRC5 | 0.9595 | <0.0001 | 0.9233 | <0.0001 | 0.8979 | <0.0001 |
| GPX2 | 0.9504 | <0.0001 | 0.9053 | <0.0001 | 0.8921 | <0.0001 | |
| NOS2 | n.d. | n.d. | n.d. | ||||
| RELA | −0.4090 | 0.1300 | −0.5069 | 0.0538 | −0.4840 | 0.0676 | |
| SOCS2 | 0.6367 | 0.0107 | 0.5781 | 0.0240 | 0.5334 | 0.0406 | |
| proliferation | MKI67 | 0.9236 | <0.0001 | 0.8583 | <0.0001 | 0.8205 | 0.0002 |
| PCNA | 0.8741 | <0.0001 | 0.8843 | <0.0001 | 0.8707 | <0.0001 | |
© 2020 by the authors. Licensee MDPI, Basel, Switzerland. This article is an open access article distributed under the terms and conditions of the Creative Commons Attribution (CC BY) license (http://creativecommons.org/licenses/by/4.0/).
Share and Cite
Franko, A.; Berti, L.; Hennenlotter, J.; Rausch, S.; Scharpf, M.O.; de Angelis, M.H.; Stenzl, A.; Birkenfeld, A.L.; Peter, A.; Lutz, S.Z.; et al. Transcript Levels of Aldo-Keto Reductase Family 1 Subfamily C (AKR1C) Are Increased in Prostate Tissue of Patients with Type 2 Diabetes. J. Pers. Med. 2020, 10, 124. https://doi.org/10.3390/jpm10030124
Franko A, Berti L, Hennenlotter J, Rausch S, Scharpf MO, de Angelis MH, Stenzl A, Birkenfeld AL, Peter A, Lutz SZ, et al. Transcript Levels of Aldo-Keto Reductase Family 1 Subfamily C (AKR1C) Are Increased in Prostate Tissue of Patients with Type 2 Diabetes. Journal of Personalized Medicine. 2020; 10(3):124. https://doi.org/10.3390/jpm10030124
Chicago/Turabian StyleFranko, Andras, Lucia Berti, Jörg Hennenlotter, Steffen Rausch, Marcus O. Scharpf, Martin Hrabĕ de Angelis, Arnulf Stenzl, Andreas L. Birkenfeld, Andreas Peter, Stefan Z. Lutz, and et al. 2020. "Transcript Levels of Aldo-Keto Reductase Family 1 Subfamily C (AKR1C) Are Increased in Prostate Tissue of Patients with Type 2 Diabetes" Journal of Personalized Medicine 10, no. 3: 124. https://doi.org/10.3390/jpm10030124