Measuring IGF-1 and IGFBP-3 Profiles in Women Seeking Assisted Reproduction; Relationship to Clinical Parameters (Study 1)


Abstract
:1. Introduction
2. Materials and Methods
2.1. IGF-1 and IGFBP-3 Assays
2.2. IGFBP-3/IGF-1 (IGF Ratio)
2.3. Statistical Analysis
2.4. Ethical Considerations
3. Results
3.1. IGF Profile
3.2. IGF Profile vs. Age
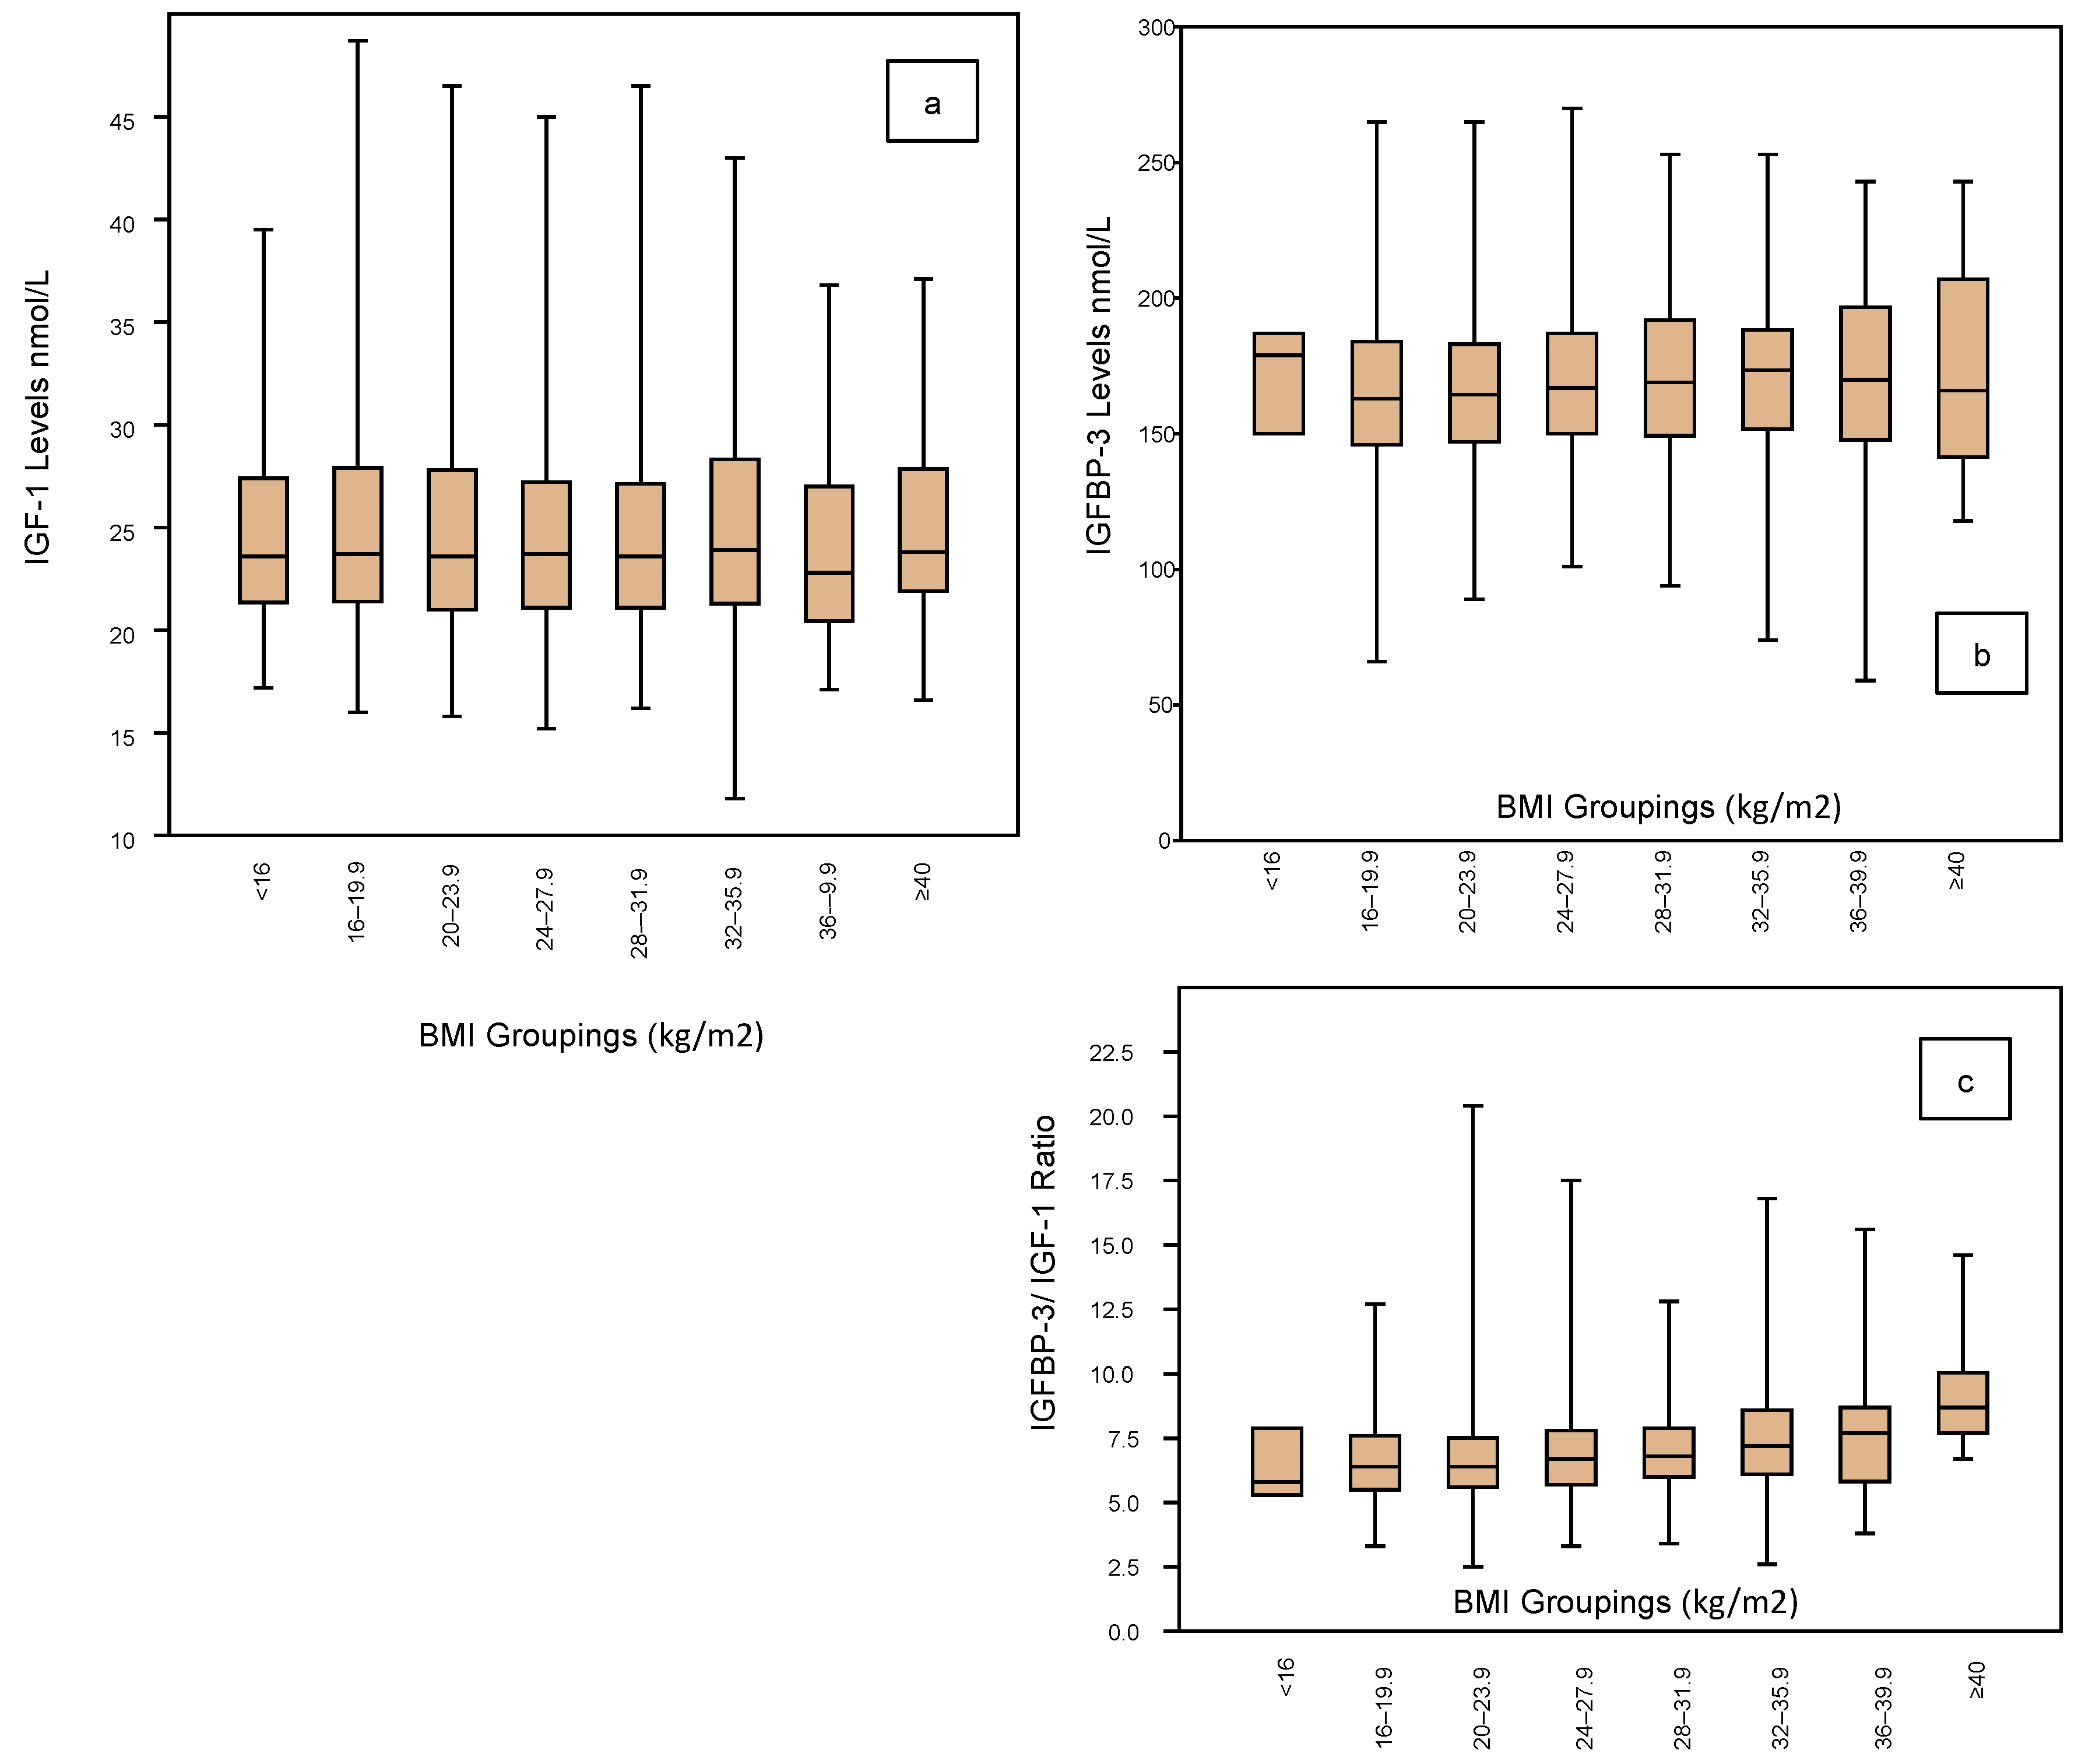
3.3. IGF Profile vs. BMI
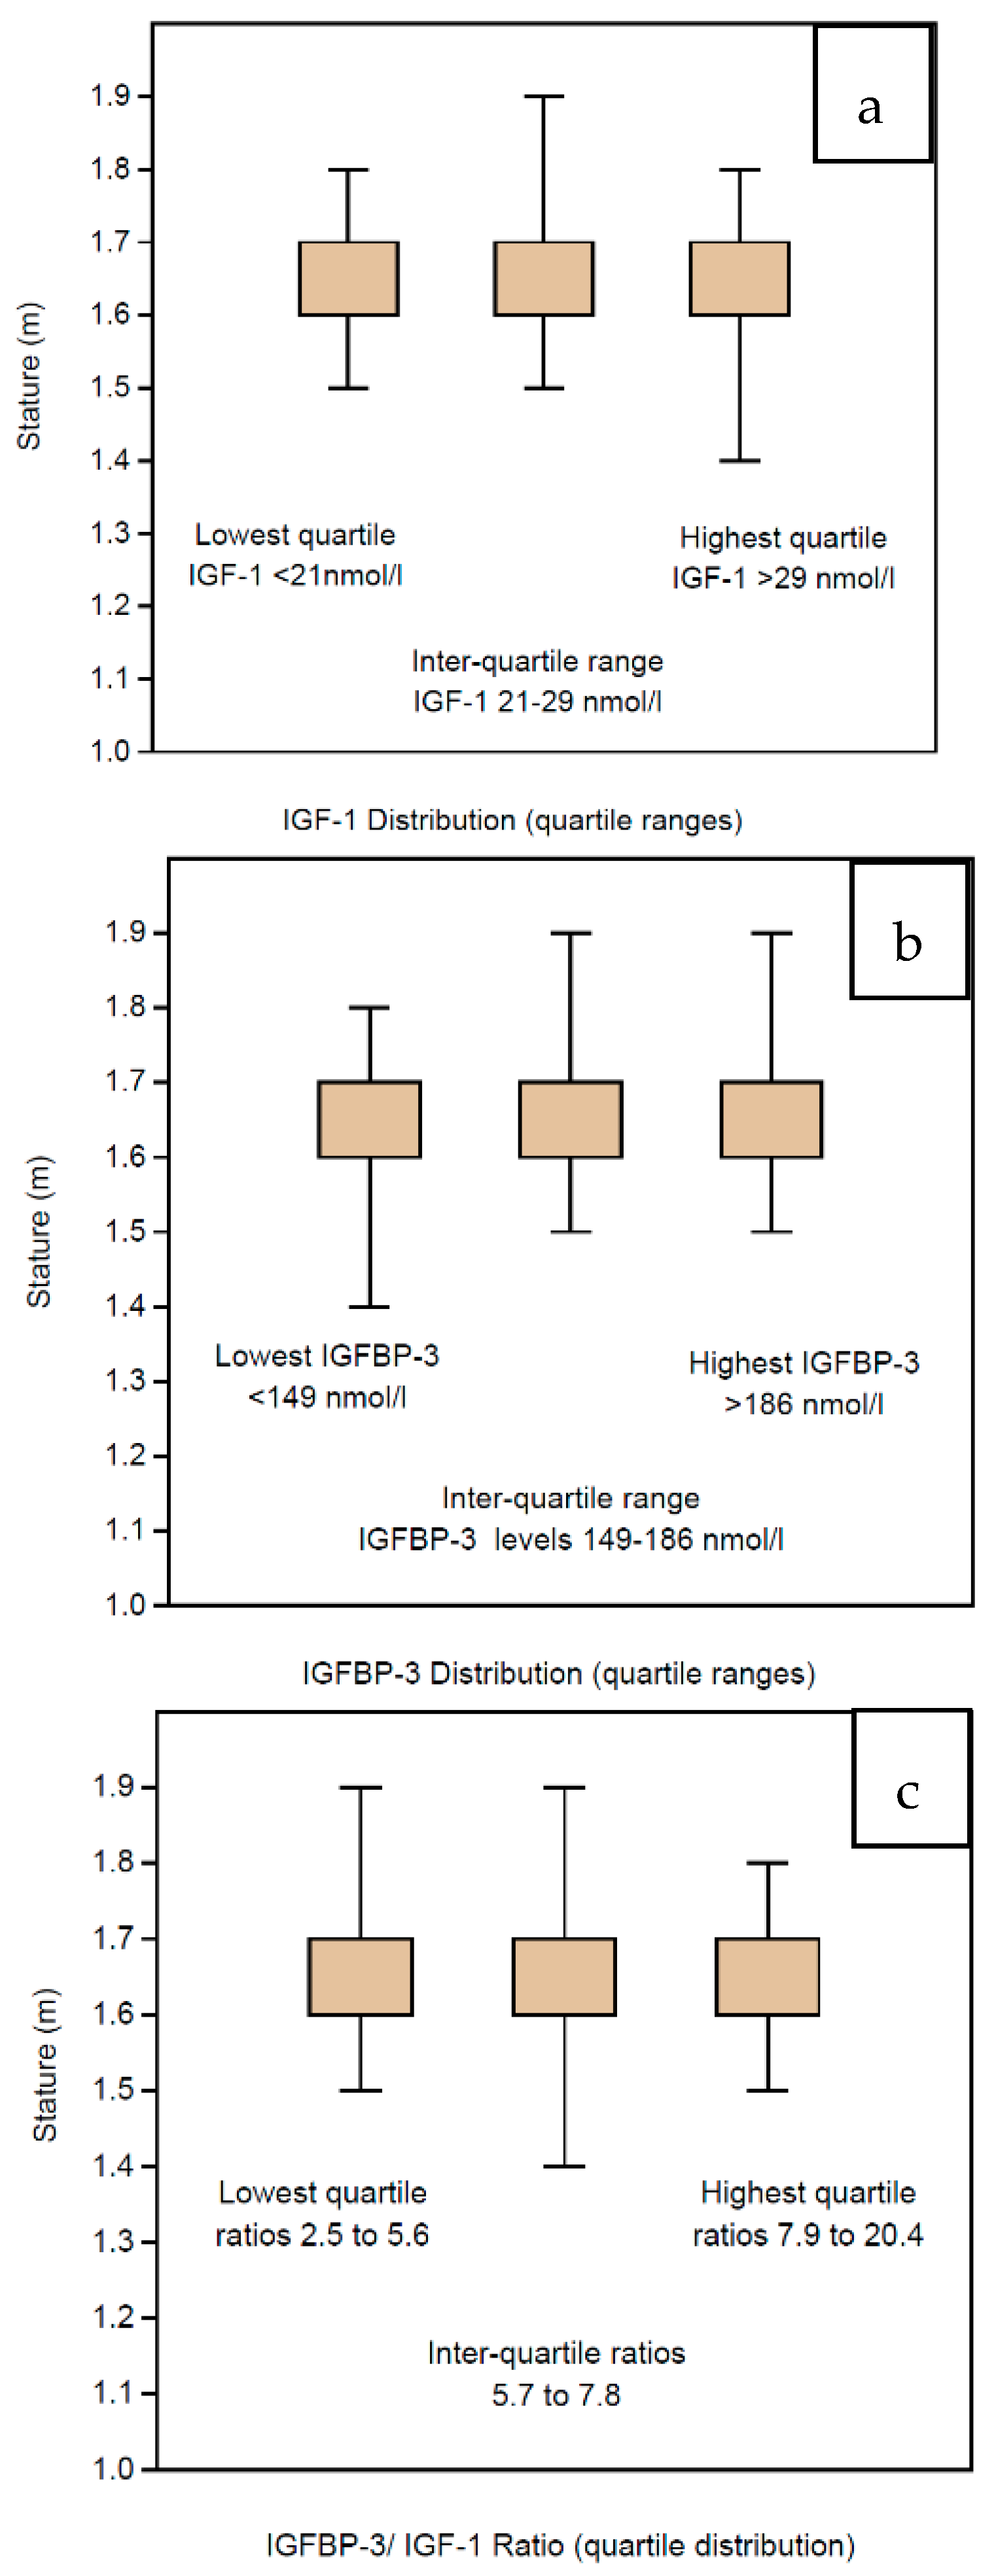
3.4. IGF Profile vs. Stature
4. Discussion
5. Conclusions
Author Contributions
Funding
Acknowledgments
Conflicts of Interest
References
- Yovich, J.; Craft, I.L. Founding Pioneers of IVF: Independent innovative researchers generating livebirths within 4 years of the first birth. Reprod. Biol. 2018, 18, 317–323. [Google Scholar] [CrossRef] [PubMed]
- Yovich, J. Founding pioneers of IVF update: Innovative researchers generating livebirths by 1982. Reprod. Biol. 2020, 20, 111–113. [Google Scholar] [CrossRef] [PubMed]
- Duncan, W.C.; Picton, H.M.; Nelson, S.M.; Tal, R.; Seifer, D.; Ho, J.; Paulson, R.J.; Griesinger, G.; Kolibianakis, E.; Howles, C.M.; et al. How to Prepare the Egg and Embryo to Maximize IVF Success; Cambridge University Press (CUP): Cambridge, UK, 2019; pp. 94–120. [Google Scholar]
- Yovich, J.; Stanger, J.D.; Keane, K.N. Cumulative Live Birth Rate: An Outmoded Term. JFIV Reprod. Med. Genet. 2016, 4, 10-4172. [Google Scholar] [CrossRef] [Green Version]
- Yovich, J.; Alsbjerg, B.; Conceicao, J.L.; Hinchliffe, P.M.; Keane, K.N. PIVET rFSH dosing algorithms for individualized controlled ovarian stimulation enables optimized pregnancy productivity rates and avoidance of ovarian hyperstimulation syndrome. Drug Des. Dev. Ther. 2016, 10, 2561–2573. [Google Scholar] [CrossRef] [PubMed] [Green Version]
- Yovich, J.; Regan, S.L.P.; Zaidi, S.; Keane, K.N. The Concept of Growth Hormone Deficiency Affecting Clinical Prognosis in IVF. Front. Endocrinol. 2019, 10, 650. [Google Scholar] [CrossRef] [PubMed]
- Stanley, T.L. Diagnosis of growth hormone deficiency in childhood. Curr. Opin. Endocrinol. Diabetes Obes. 2012, 19, 47–52. [Google Scholar] [CrossRef] [PubMed] [Green Version]
- Hammer, Ø.; Harper, D.A.T.; Ryan, P.D. PAST: Paleontological Statistics software package for education and data analysis. Palaeontol. Electron. 2001, 4, 9. [Google Scholar]
- Ipsa, E.; Cruzat, V.F.; Kagize, J.N.; Yovich, J.L.; Keane, K.N. Growth Hormone and Insulin-Like Growth Factor Action in Reproductive Tissues. Front. Endocrinol. 2019, 10, 777. [Google Scholar] [CrossRef] [PubMed]
- Regan, S.L.P.; Knight, P.G.; Yovich, J.; Arfuso, F.; Dharmarajan, A. Growth hormone during in vitro fertilization in older women modulates the density of receptors in granulosa cells, with improved pregnancy outcomes. Fertil. Steril. 2018, 110, 1298–1310. [Google Scholar] [CrossRef] [PubMed]
- Braverman, E.; Oscar-Berman, M.; Lohmann, R.; Kennedy, R.; Kerner, M.; Dushaj, K.; Blum, K. Low and Normal IGF-1 Levels in Patients with Chronic Medical Disorders(CMD) is Independent of Anterior Pituitary Hormone Deficiencies: Implications for Treating IGF-1 Abnormal Deficiencies with CMD. J. Genet. Syndr. Gene Ther. 2013, 4, 5. [Google Scholar] [CrossRef] [Green Version]
- Genc, G.; Yılmaz, N.; Uygur, D.; Dogan, M.; Mollamahmutoglu, L. The effect of intrafollicular IGF 1 and IGFBP 3 on IVF outcome in patients using different gonadotropins: A prospective study. J. Assist. Reprod. Genet. 2011, 28, 405–410. [Google Scholar] [CrossRef] [PubMed] [Green Version]
- Man, L.; Lekovich, J.; Canon, C.; Rosenwaks, Z.; James, D. Cycle day 2 insulin-like growth factor-1 serum levels as a prognostic tool to predict controlled ovarian hyperstimulation outcomes in poor responders. Fertil. Steril. 2020, 113, 1205–1214. [Google Scholar] [CrossRef] [PubMed]


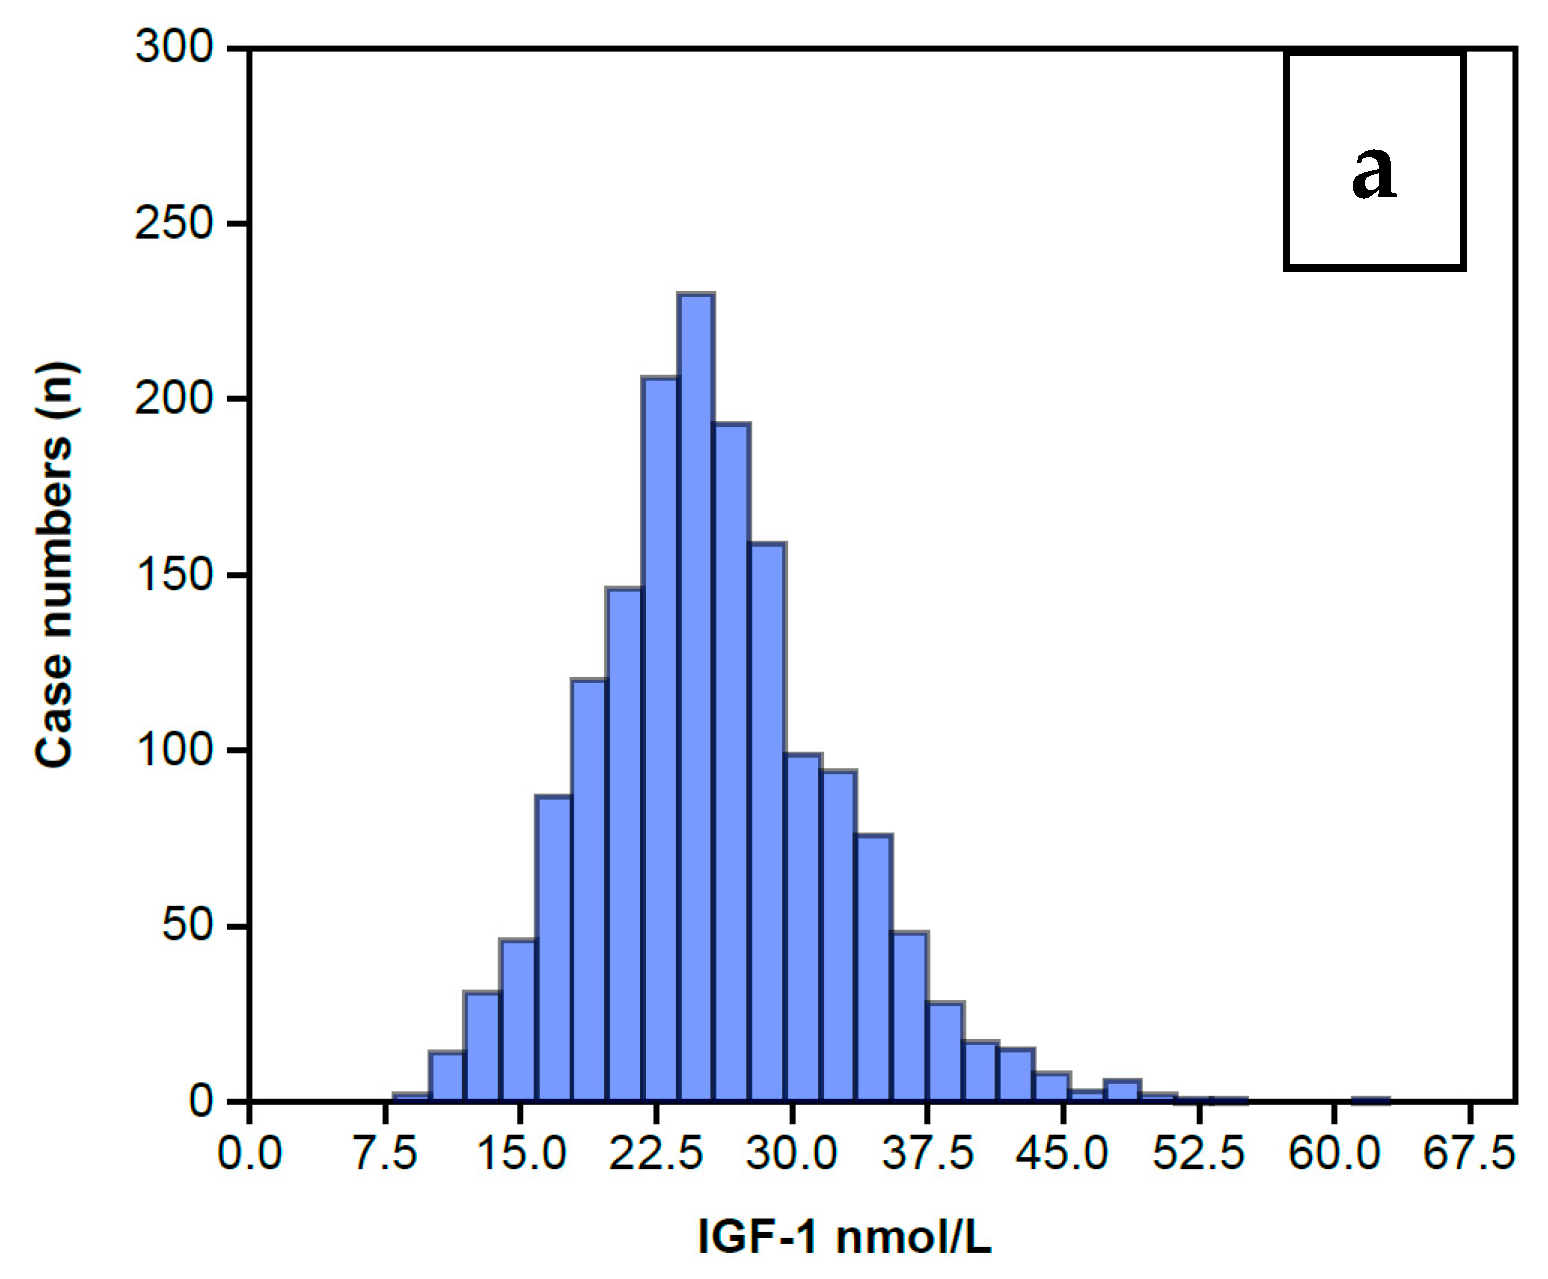
| Complete IGF-1 Profile—Summary Statistics | |||
|---|---|---|---|
| IGF Profile | IGF-1 nmol/L | IGFBP-3 nmol/L | IGFBP-3/IGF-1 Ratio |
| N | 1633 | 1633 | 1633 |
| Min | 8 | 59 | 2.5 |
| Max | 63 | 270 | 20.4 |
| Sum | 41,707 | 273,729 | 11,287.5 |
| Mean | 25.54 | 167.6 | 6.91 |
| Std. error | 0.17 | 0.73 | 0.04 |
| Variance | 47.67 | 865.72 | 3.20 |
| Stand. dev | 6.9 | 29.42 | 1.79 |
| Median | 25 | 166 | 6.6 |
| 25th centile | 21 | 148.5 | 5.7 |
| 75th centile | 29 | 186 | 7.8 |
| Skewness | 0.58 | 0.23 | 1.41 |
| Kurtosis | 390.92 | 334.53 | 747.58 |
| Geom. mean | 24.61 | 164.99 | 6.71 |
| Coeff. var | 27.03 | 17.55 | 25.89 |
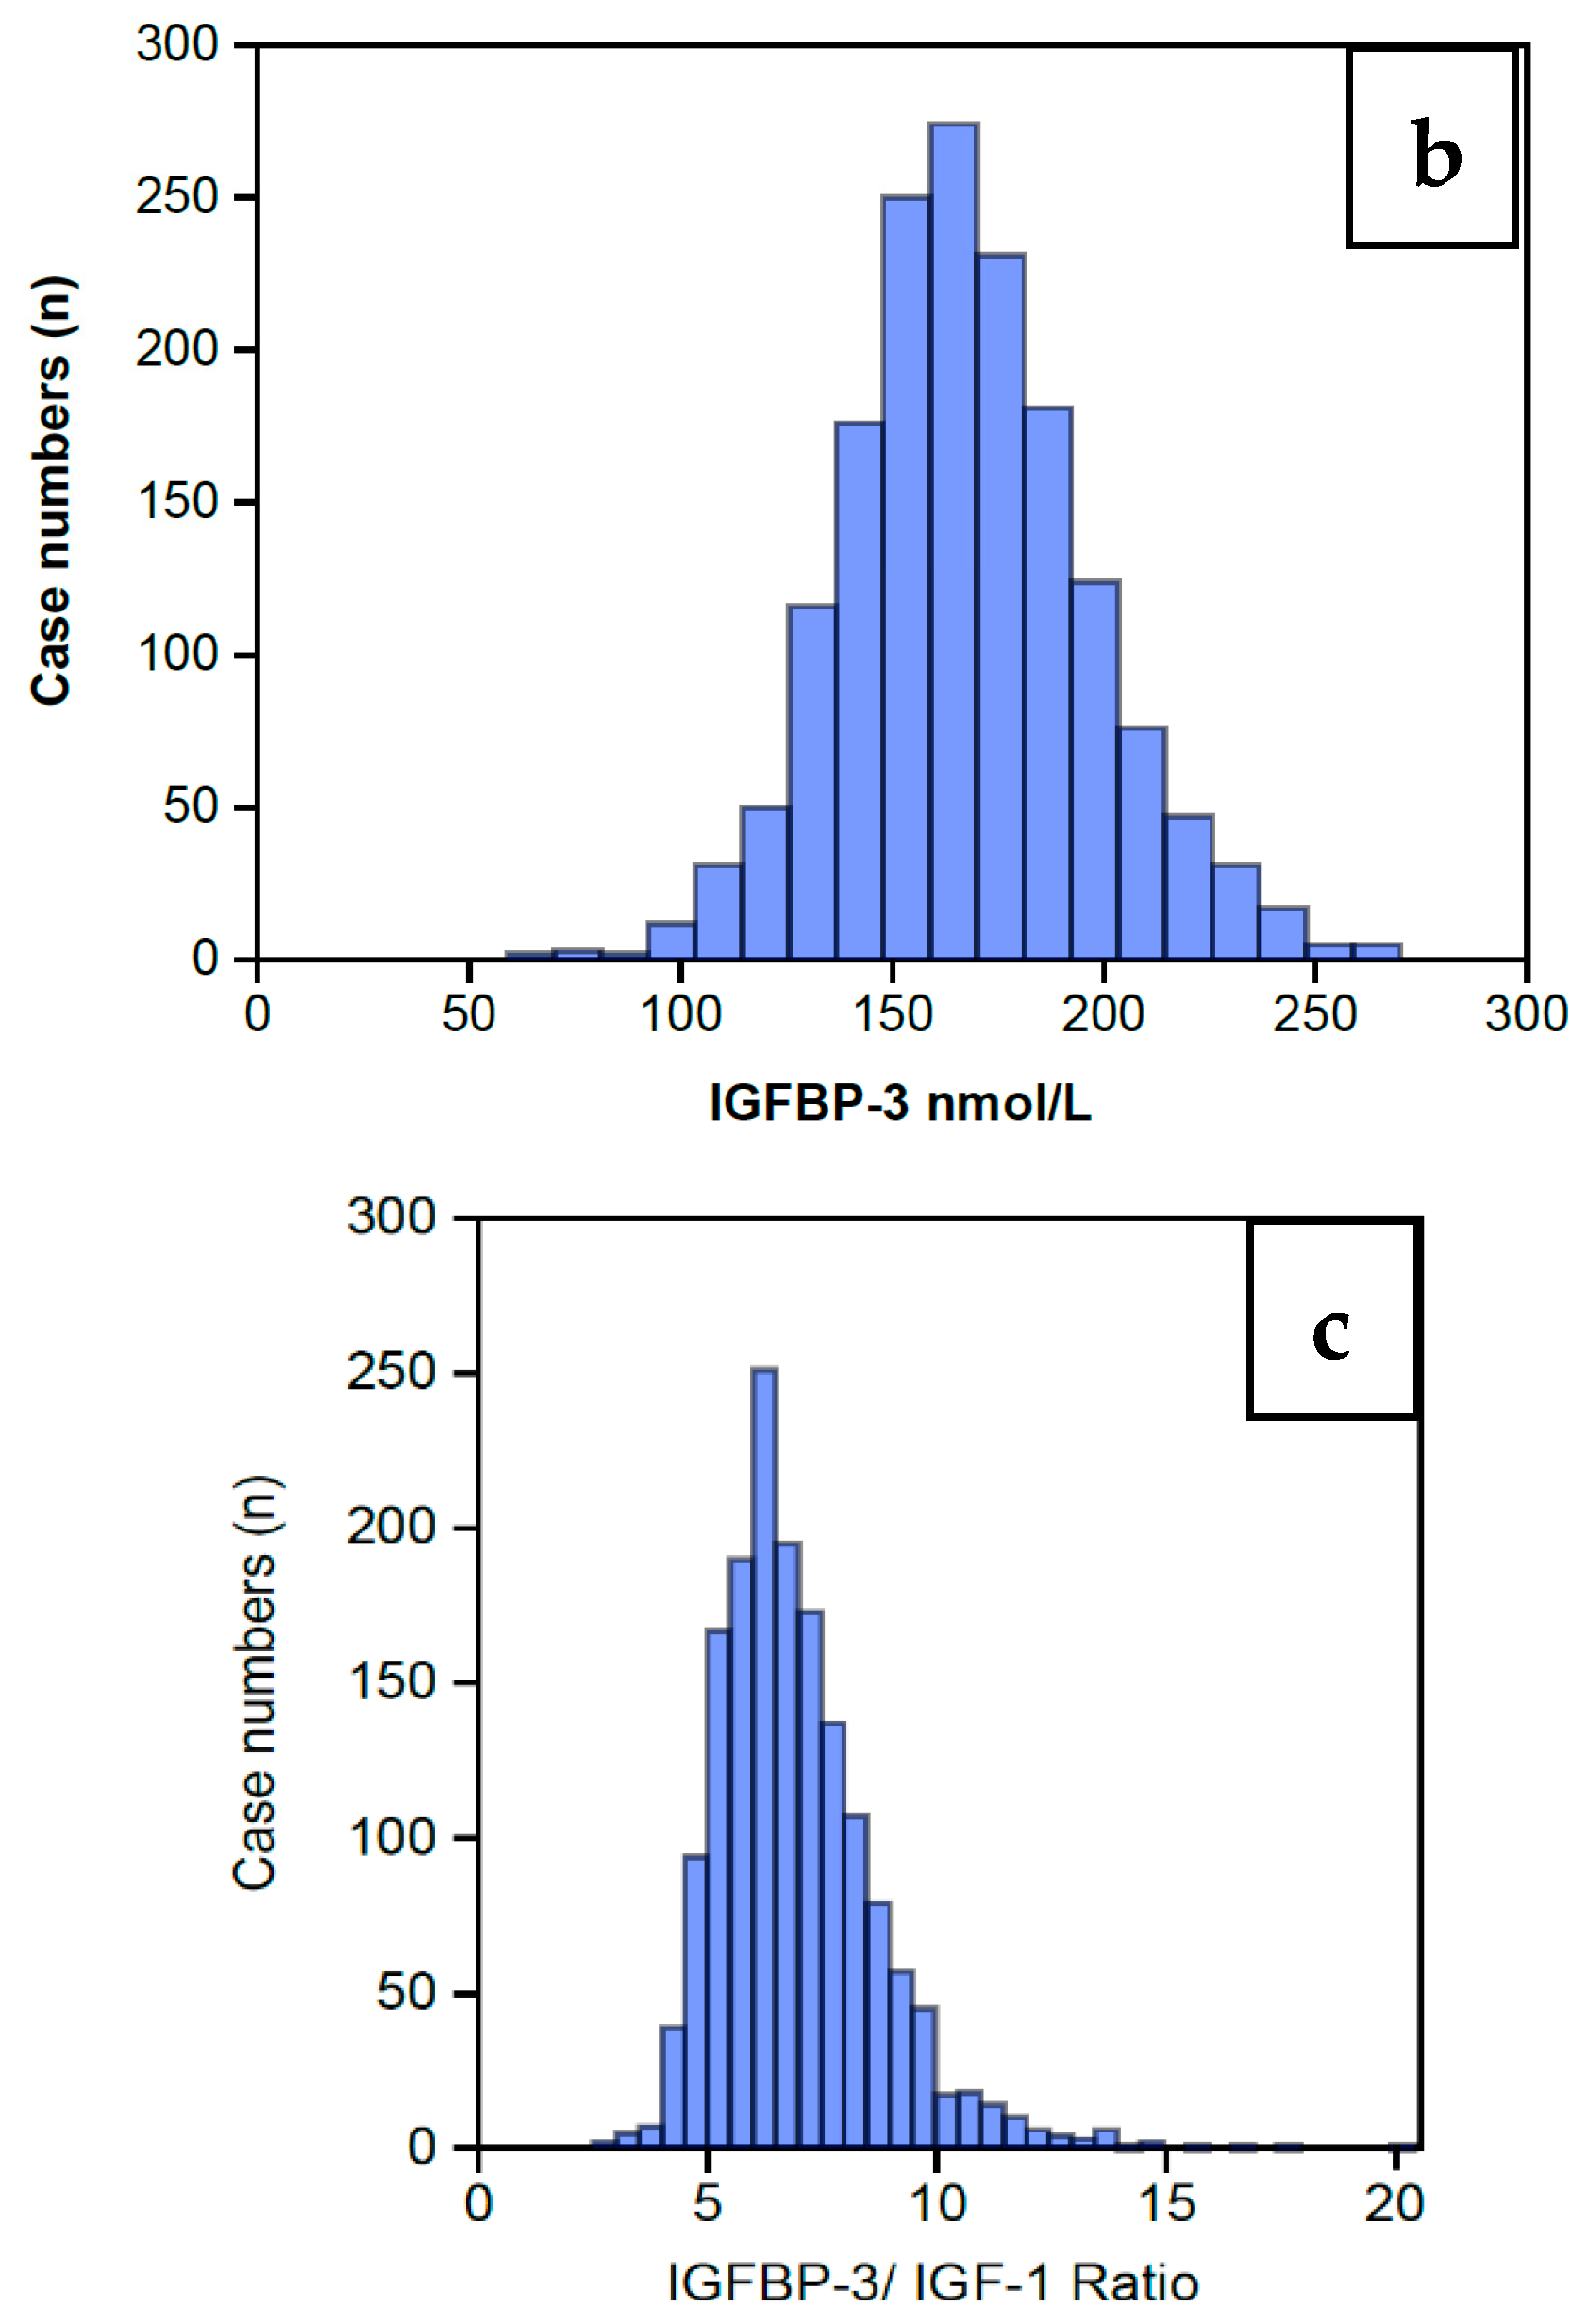
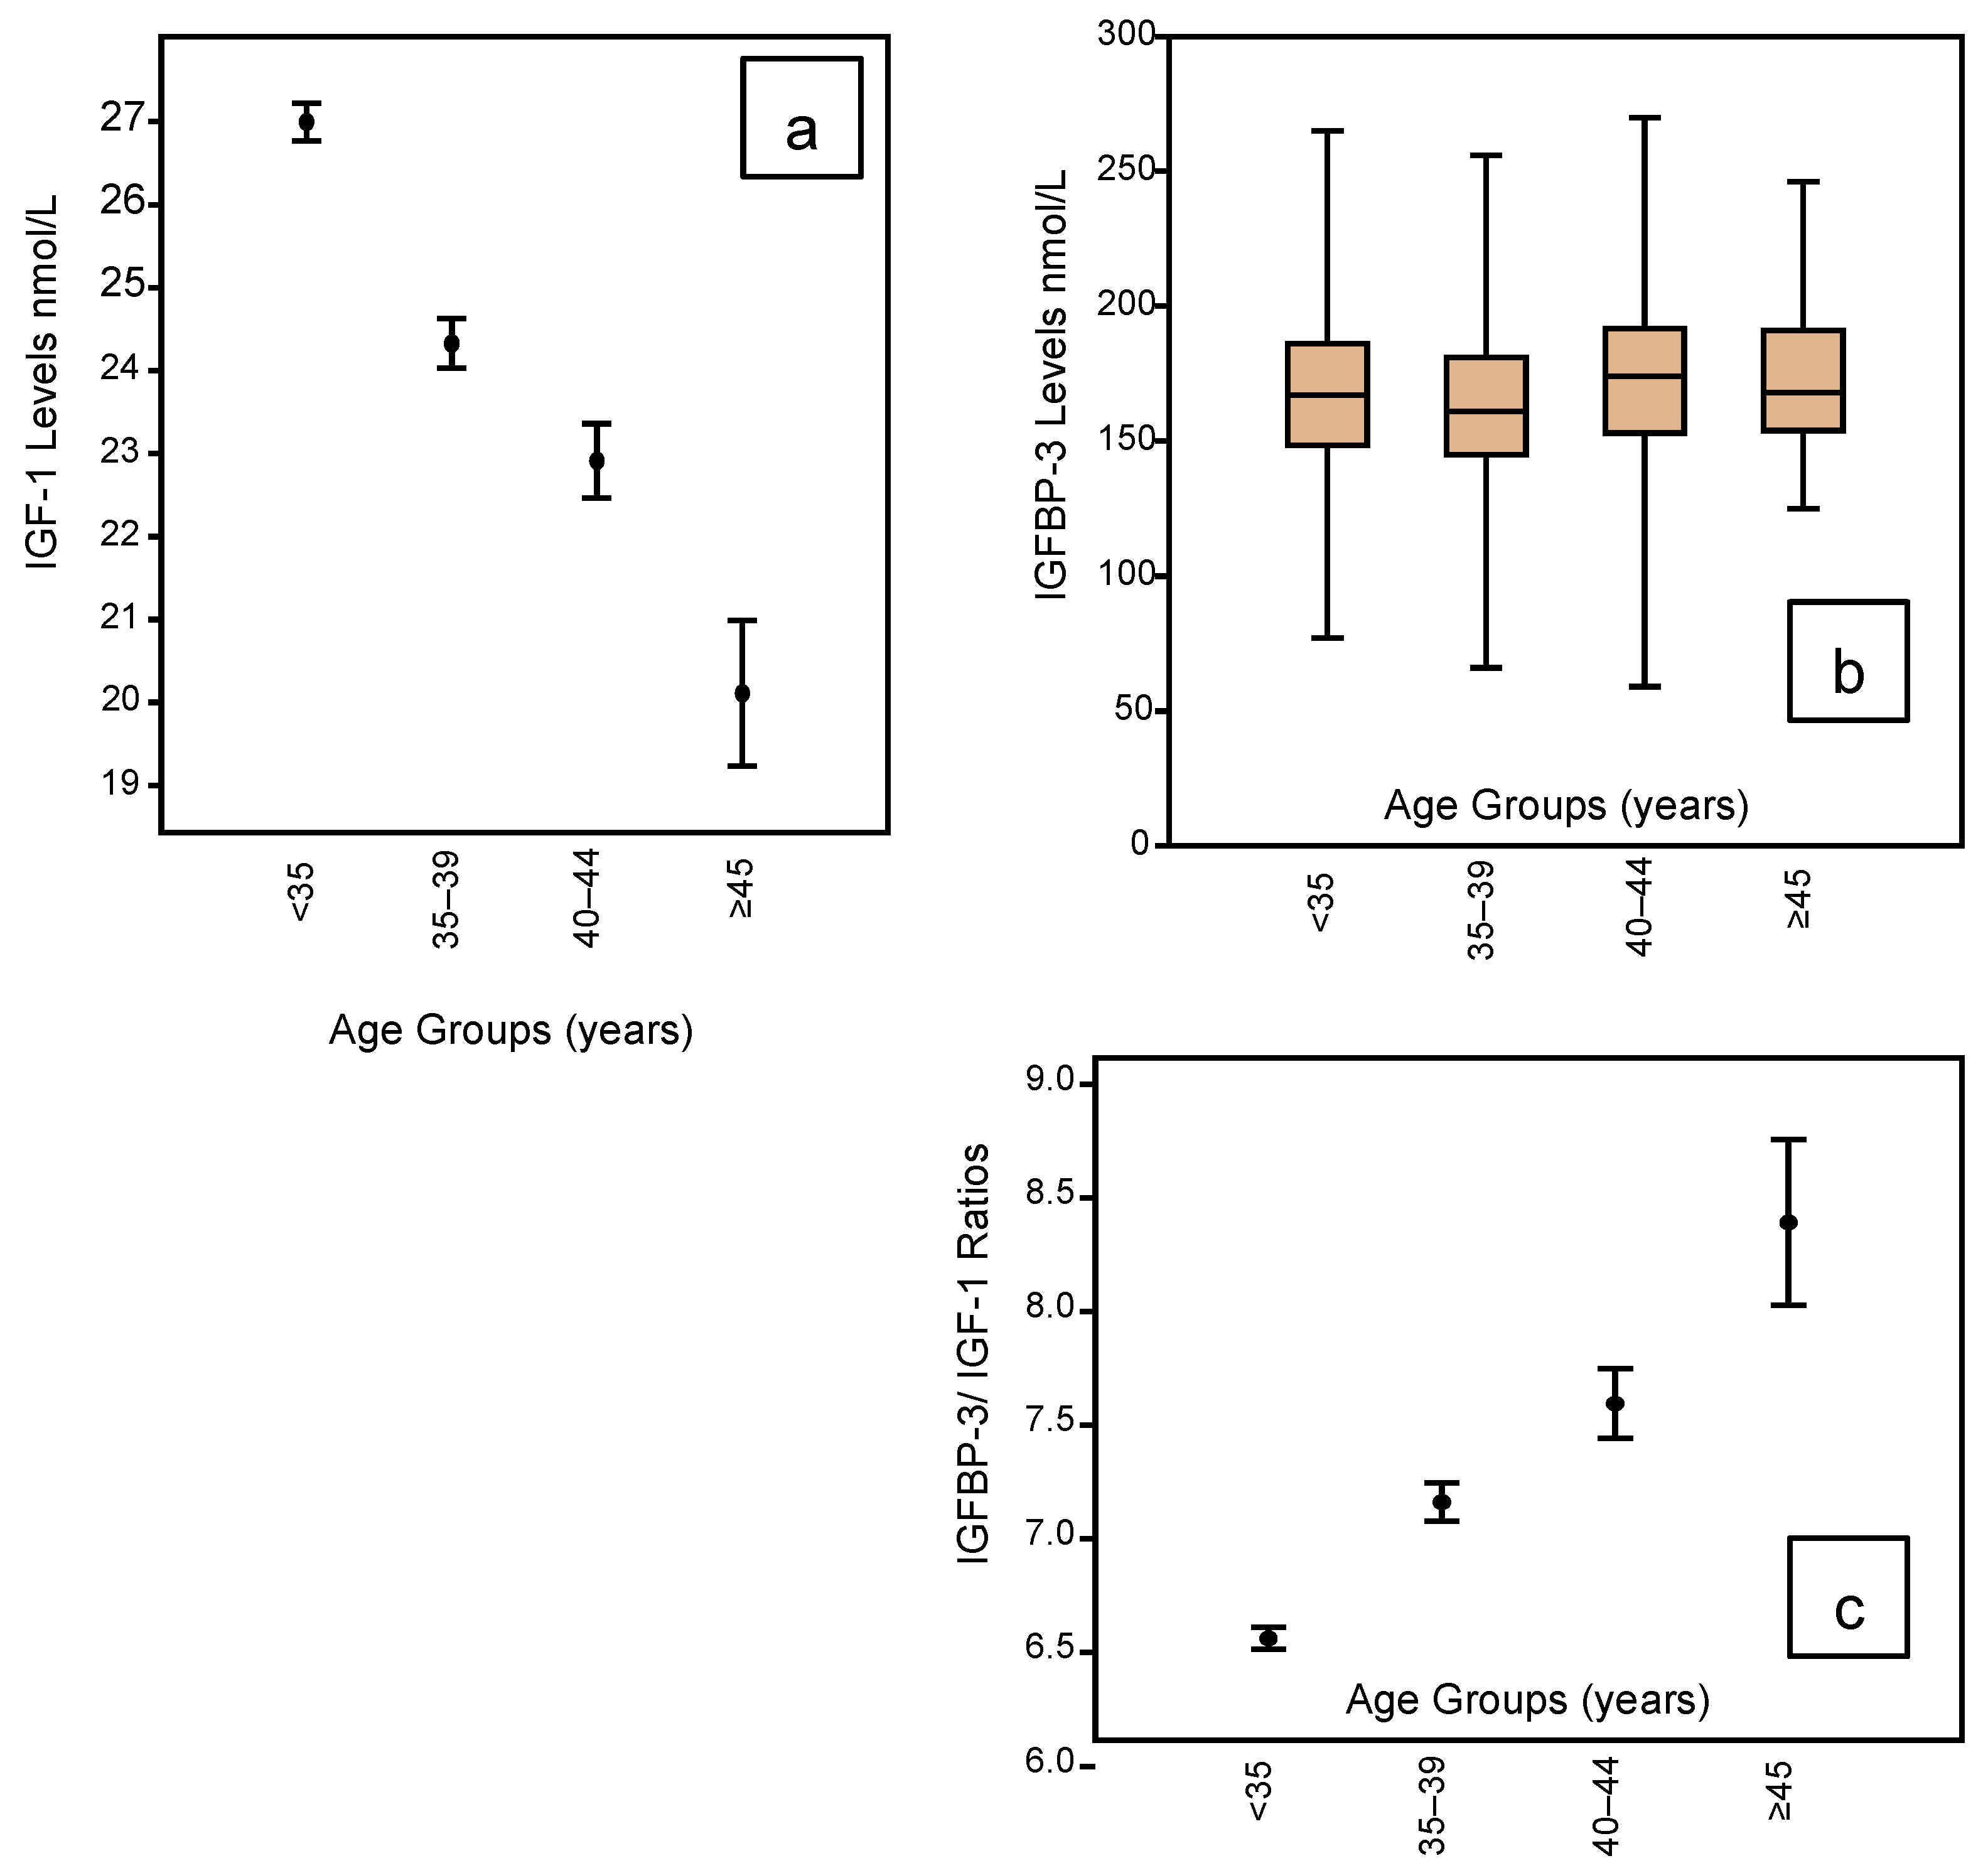
| Age Groups | <35 Years | 35–39 Years | 40–44 Years | ≥45 Years | |
|---|---|---|---|---|---|
| IGF-1 Levels vs. Age Groups—Summary Statistics | N | 929 | 439 | 220 | 45 |
| Min | 10 | 10 | 8 | 11 | |
| Max | 63 | 49 | 52 | 35 | |
| Sum | 25,081 | 10,680 | 5041 | 905 | |
| Mean | 27.00 | 24.33 | 22.91 | 20.11 | |
| Std. error | 0.23 | 0.30 | 0.45 | 0.88 | |
| Variance | 47.44 | 39.02 | 44.29 | 34.74 | |
| Std. dev | 6.89 | 6.25 | 6.66 | 5.90 | |
| Median | 26 | 24 | 23 | 19 | |
| 25th centile | 22 | 20 | 18 | 16 | |
| 75th centile | 31 | 28 | 26 | 25 | |
| Skewness | 0.59 | 0.54 | 0.85 | 0.48 | |
| Kurtosis | 0.99 | 0.83 | 2.19 | −0.26 | |
| Geom. mean | 26.13 | 23.53 | 21.98 | 19.28 | |
| Coeff. var | 25.51 | 25.68 | 29.04 | 29.31 | |
| Age Groups | <35 Years | 35–39 Years | 40–44 Years | ≥45 Years | |
| IGFBP-3 (nmol/L) vs. Age Groups—Summary Statistics | N | 929 | 439 | 220 | 45 |
| Min | 59 | 77 | 59 | 90 | |
| Max | 265 | 270 | 270 | 240 | |
| Sum | 157,784 | 72,994 | 38,136 | 7198 | |
| Mean | 169.84 | 166.27 | 173.35 | 159.96 | |
| Std. error | 0.98 | 1.36 | 2.23 | 5.22 | |
| Variance | 900.28 | 812.71 | 1092.96 | 1228.00 | |
| Std. dev | 30.01 | 28.51 | 33.06 | 35.04 | |
| Median | 168 | 165 | 174 | 154 | |
| 25th centile | 150 | 148 | 153 | 136 | |
| 75th centile | 188 | 187 | 191.75 | 188 | |
| Skewness | 0.23 | 0.17 | −0.01 | 0.31 | |
| Kurtosis | 0.56 | 0.11 | 0.56 | −0.10 | |
| Geom. mean | 167.13 | 163.79 | 169.99 | 156.16 | |
| Coeff. var | 17.67 | 17.15 | 19.07 | 21.91 | |
| Age Groups | <35 Years | 35–39 Years | 40–44 Years | ≥45 Years | |
| c. IGFBP-3/IGF-1 Ratio vs. Age Groups—Summary Statistics | N | 929 | 439 | 220 | 45 |
| Min | 2.5 | 3.3 | 3.6 | 4.7 | |
| Max | 13.5 | 16.8 | 20.4 | 17.5 | |
| Sum | 6095.3 | 3143.8 | 1670.8 | 377.6 | |
| Mean | 6.56 | 7.16 | 7.60 | 8.39 | |
| Std. error | 0.05 | 0.08 | 0.15 | 0.36 | |
| Variance | 2.28 | 3.16 | 5.13 | 5.96 | |
| Std. dev | 1.51 | 1.78 | 2.27 | 2.44 | |
| Median | 6.3 | 6.9 | 7.3 | 7.8 | |
| 25th centile | 5.5 | 6 | 6.1 | 6.9 | |
| 75th centile | 7.4 | 8 | 8.5 | 9.6 | |
| Skewness | 0.88 | 1.29 | 1.56 | 1.45 | |
| Kurtosis | 1.25 | 3.41 | 5.02 | 3.21 | |
| Geom. mean | 6.40 | 6.96 | 7.30 | 8.09 | |
| Coeff. var | 23.00 | 24.84 | 29.83 | 29.08 |
| BMI Groups kg/m2 | <16 | 16–19.9 | 20–23.9 | 24–27.9 | 28–31.9 | 32–35.9 | 36–39.9 | ≥40 | ||
|---|---|---|---|---|---|---|---|---|---|---|
| IGF-1 vs. BMI Summary Statistics | N | 93 | 207 | 352 | 423 | 258 | 170 | 76 | 54 | |
| Min | 17.2 | 16 | 15.8 | 15.2 | 16.2 | 11.8 | 17.1 | 16.6 | ||
| Max | 39.5 | 48.7 | 46.5 | 45 | 46.5 | 43 | 36.8 | 37.1 | ||
| Sum | 2318.1 | 5195.5 | 8721.2 | 10,455 | 6363.8 | 4303.6 | 1823.8 | 1344.2 | ||
| Mean | 24.93 | 25.10 | 24.78 | 24.72 | 24.67 | 25.32 | 24.00 | 24.89 | ||
| Std. error | 0.53 | 0.39 | 0.27 | 0.24 | 0.32 | 0.41 | 0.55 | 0.60 | ||
| Variance | 26.21 | 32.09 | 25.34 | 24.41 | 25.65 | 28.96 | 23.09 | 19.26 | ||
| Std. dev | 5.12 | 5.66 | 5.03 | 4.94 | 5.06 | 5.38 | 4.81 | 4.39 | ||
| Median | 23.6 | 23.7 | 23.6 | 23.7 | 23.6 | 23.9 | 22.8 | 23.8 | ||
| 25th centile | 21.35 | 21.4 | 21 | 21.1 | 21.1 | 21.3 | 20.45 | 21.9 | ||
| 75th centile | 27.4 | 27.9 | 27.8 | 27.2 | 27.125 | 28.325 | 27 | 27.85 | ||
| Skewness | 0.87 | 1.48 | 0.99 | 1.04 | 1.22 | 0.80 | 0.78 | 0.70 | ||
| Kurtosis | 0.04 | 2.87 | 1.15 | 1.16 | 2.00 | 0.51 | −0.05 | 0.16 | ||
| Geom. mean | 24.44 | 24.55 | 24.31 | 24.27 | 24.20 | 24.78 | 23.55 | 24.53 | ||
| Coeff. Var | 20.54 | 22.57 | 20.32 | 19.99 | 20.53 | 21.26 | 20.02 | 17.63 | ||
| BMI Groups kg/m2 | <16 | 16–19.9 | 20–23.9 | 24–27.9 | 28–31.9 | 32–35.9 | 36–39.9 | ≥40 | ||
| IGFBP-3 vs. BMI Summary Statistics | N | 3 | 235 | 614 | 410 | 196 | 118 | 40 | 17 | |
| Min | 150 | 66 | 89 | 101 | 94 | 74 | 59 | 118 | ||
| Max | 187 | 265 | 265 | 270 | 253 | 253 | 243 | 243 | ||
| Sum | 516 | 38,984 | 101,786 | 69,417 | 33,358 | 20,086 | 6650 | 2955 | ||
| Mean | 172.00 | 165.89 | 165.78 | 169.31 | 170.19 | 170.22 | 166.25 | 173.82 | ||
| Std. error | 11.24 | 1.89 | 1.15 | 1.39 | 2.26 | 2.74 | 6.34 | 9.78 | ||
| Variance | 379.00 | 842.57 | 810.32 | 792.53 | 1002.33 | 885.27 | 1606.81 | 1626.03 | ||
| Std. dev | 19.47 | 29.03 | 28.47 | 28.15 | 31.66 | 29.75 | 40.09 | 40.32 | ||
| Median | 179 | 163 | 164.5 | 167 | 169 | 173.5 | 170 | 166 | ||
| 25th centile | 150 | 146 | 147 | 150 | 149.25 | 151.75 | 147.75 | 141.5 | ||
| 75th centile | 187 | 184 | 183 | 187 | 192 | 188.25 | 196.75 | 207 | ||
| Skewness | −1.41 | 0.33 | 0.32 | 0.43 | 0.15 | −0.29 | −0.70 | 0.46 | ||
| Kurtosis | −2.33 | 0.96 | 0.31 | 0.35 | −0.14 | 0.47 | 0.69 | −0.80 | ||
| Geom. mean | 171.24 | 163.31 | 163.33 | 167.00 | 167.19 | 167.41 | 160.37 | 169.53 | ||
| Coeff. var | 11.32 | 17.50 | 17.17 | 16.63 | 18.60 | 17.48 | 24.11 | 23.20 | ||
| BMI kg/m2 | <16 | 16–19.9 | 20–23.9 | 24–27.9 | 28–31.9 | 32–35.9 | 36–39.9 | ≥40 | ||
| IGFBP-3/IGF-1 Ratio vs. BMI Summary Statistics | N | 3 | 235 | 614 | 410 | 196 | 118 | 40 | 17 | |
| Min | 5.3 | 3.3 | 2.5 | 3.3 | 3.4 | 2.6 | 3.8 | 6.7 | ||
| Max | 7.9 | 12.7 | 20.4 | 17.5 | 12.8 | 16.8 | 15.6 | 14.6 | ||
| Sum | 19 | 1570.4 | 4114.9 | 2839.7 | 1384.1 | 895.3 | 308.1 | 156 | ||
| Mean | 6.33 | 6.68 | 6.70 | 6.93 | 7.06 | 7.59 | 7.70 | 9.18 | ||
| Std. error | 0.80 | 0.10 | 0.07 | 0.09 | 0.12 | 0.21 | 0.37 | 0.51 | ||
| Variance | 1.90 | 2.56 | 2.72 | 3.17 | 2.93 | 5.06 | 5.52 | 4.50 | ||
| Std. dev | 1.38 | 1.60 | 1.65 | 1.78 | 1.71 | 2.25 | 2.35 | 2.12 | ||
| Median | 5.8 | 6.4 | 6.4 | 6.7 | 6.8 | 7.2 | 7.7 | 8.7 | ||
| 25th centile | 5.3 | 5.5 | 5.6 | 5.7 | 6 | 6.1 | 5.825 | 7.7 | ||
| 75th centile | 7.9 | 7.6 | 7.525 | 7.8 | 7.9 | 8.6 | 8.7 | 10.05 | ||
| Skewness | 1.48 | 1.03 | 1.68 | 1.44 | 0.81 | 1.13 | 1.24 | 1.39 | ||
| Kurtosis | −2.33 | 1.63 | 8.32 | 4.32 | 0.99 | 2.42 | 2.66 | 1.87 | ||
| Geom. mean | 6.24 | 6.51 | 6.52 | 6.72 | 6.87 | 7.28 | 7.39 | 8.97 | ||
| Coeff. var | 21.78 | 23.95 | 24.59 | 25.71 | 24.25 | 29.64 | 30.50 | 23.13 | ||
| 1.4–1.49 | 1.5–1.59 | 1.6–1.69 | 1.7–1.79 | 1.8–1.89 | 1.9–2.0 | ||
|---|---|---|---|---|---|---|---|
| IGF-1 nmol/L vs. Stature—Summary Statistics | 21 | 105 | 668 | 698 | 139 | 2 | |
| 14 | 10 | 10 | 8 | 10 | 23 | ||
| 40 | 43 | 54 | 63 | 43 | 23 | ||
| 525 | 2530 | 17,015 | 18,092 | 3499 | 46 | ||
| 25.00 | 24.10 | 25.47 | 25.92 | 25.17 | 23.00 | ||
| 1.40 | 0.66 | 0.26 | 0.27 | 0.54 | 0.00 | ||
| 41.10 | 45.07 | 44.99 | 52.09 | 40.68 | 0.00 | ||
| 6.41 | 6.71 | 6.71 | 7.22 | 6.38 | 0.00 | ||
| 24 | 23 | 25 | 25 | 25 | 23 | ||
| 20.5 | 19 | 21 | 21 | 21 | 23 | ||
| 28.5 | 29 | 29 | 30 | 29 | 23 | ||
| 0.68 | 0.40 | 0.58 | 0.63 | 0.32 | 0.00 | ||
| 0.35 | −0.31 | 0.97 | 1.12 | 0.28 | 0.00 | ||
| 24.25 | 23.16 | 24.59 | 24.92 | 24.34 | 23.00 | ||
| 25.64 | 27.86 | 26.33 | 27.85 | 25.34 | 0.00 | ||
| Height Quartiles (m) | Lowest Quartile IGF <21nmol/L | Inter-Quartile Range IGF 21–29 nmol/L | Highest Quartile >29 nmol/L | ||||
| IGF-1 nmol/L vs. Stature—Summary statistics | N | 365 | 869 | 399 | |||
| Minimum | 1.5 | 1.5 | 1.4 | ||||
| Maximum | 1.8 | 1.9 | 1.8 | ||||
| Sum | 600.6 | 1438.5 | 659.2 | ||||
| Mean | 1.65 | 1.66 | 1.65 | ||||
| Standard error | 0.00 | 0.00 | 0.00 | ||||
| Variance | 0.01 | 0.01 | 0.01 | ||||
| Standard deviation | 0.08 | 0.08 | 0.07 | ||||
| Median | 1.6 | 1.7 | 1.7 | ||||
| 25th percentile | 1.6 | 1.6 | 1.6 | ||||
| 75th percentile | 1.7 | 1.7 | 1.7 | ||||
| Skewness | −0.03 | 0.10 | −0.19 | ||||
| Kurtosis | −0.45 | −0.24 | −0.04 | ||||
| Geometric mean | 1.64 | 1.65 | 1.65 | ||||
| Coefficient variation | 4.82 | 4.63 | 4.41 | ||||
| Height (m) | 1.41.49 | 1.5–1.59 | 1.6–1.69 | 1.7–1.79 | 1.8–1.89 | 1.9–2.0 | |
| IGFBP-3 nmol/L vs. Stature—Summary Statistics | N | 21 | 105 | 668 | 698 | 139 | 2 |
| Min | 107 | 103 | 66 | 59 | 109 | 173 | |
| Max | 206 | 244 | 270 | 265 | 259 | 221 | |
| Sum | 3216 | 17,146 | 110,246 | 118,544 | 24,206 | 394 | |
| Mean | 153.14 | 163.30 | 165.04 | 169.83 | 174.14 | 197.00 | |
| Std. error | 5.95 | 2.75 | 1.14 | 1.11 | 2.38 | 24.00 | |
| Variance | 742.33 | 793.86 | 872.80 | 863.49 | 789.20 | 1152.00 | |
| Std. dev | 27.25 | 28.18 | 29.54 | 29.39 | 28.09 | 33.94 | |
| Median | 150 | 158 | 163 | 168 | 173 | 197 | |
| 25th centile | 130 | 143 | 146 | 150 | 153 | 173 | |
| 75th centile | 179 | 185 | 184 | 188 | 190 | 221 | |
| Skewness | 0.12 | 0.46 | 0.17 | 0.23 | 0.47 | 0.00 | |
| Kurtosis | −0.88 | −0.13 | 0.52 | 0.41 | 0.22 | −2.75 | |
| Geom. mean | 150.81 | 160.94 | 162.31 | 167.24 | 171.94 | 195.53 | |
| Coeff. var | 17.79 | 17.25 | 17.90 | 17.30 | 16.13 | 17.23 | |
| Height Quartiles (m) | Lowest Quartile IGFBP-3 <149 nmol/L | Inter-Quartile Range IGFBP-1 149 to 186 nmol/L | Highest Quartile IGFBP-3 >186 nmol/L | ||||
| IGFBP-3 nmol/L vs. Stature—Summary Statistics | N | 416 | 869 | 399 | |||
| Min | 1.5 | 1.4 | 1.5 | ||||
| Max | 1.8 | 1.8 | 1.9 | ||||
| Sum | 682.3 | 1436.35 | 663.2 | ||||
| Mean | 1.64 | 1.65 | 1.66 | ||||
| Std. error | 0.00 | 0.00 | 0.00 | ||||
| Variance | 0.01 | 0.01 | 0.01 | ||||
| Std. dev | 0.07 | 0.08 | 0.08 | ||||
| Median | 1.6 | 1.7 | 1.7 | ||||
| 25th centile | 1.6 | 1.6 | 1.6 | ||||
| 75th centile | 1.7 | 1.7 | 1.7 | ||||
| Skewness | 0.08 | −0.06 | 0.08 | ||||
| Kurtosis | −0.27 | −0.28 | −0.03 | ||||
| Geom. mean | 1.64 | 1.65 | 1.66 | ||||
| Coeff. var | 4.53 | 4.65 | 4.53 | ||||
| Height (m) | 1.4–1.49 | 1.5–1.59 | 1.6–1.69 | 1.7–1.79 | 1.8–1.89 | 1.9–2.0 | |
| IGFBP-3/IGF-1 Ratio vs. Stature—Summary Statistics | N | 21 | 105 | 668 | 698 | 139 | 2 |
| Min | 6.6 | 3.3 | 2.5 | 3.3 | 4 | 5.6 | |
| Max | 8.7 | 14.8 | 20.4 | 15.6 | 10.8 | 5.8 | |
| Sum | 22 | 884.5 | 4902.3 | 4525.3 | 942 | 11.4 | |
| Mean | 7.33 | 7.08 | 6.97 | 6.85 | 6.78 | 5.70 | |
| Std. error | 0.68 | 0.17 | 0.07 | 0.07 | 0.13 | 0.10 | |
| Variance | 1.40 | 3.73 | 3.70 | 2.80 | 2.20 | 0.02 | |
| Std. dev | 1.18 | 1.93 | 1.92 | 1.67 | 1.48 | 0.14 | |
| Median | 6.7 | 6.7 | 6.6 | 6.6 | 6.6 | 5.7 | |
| 25th centile | 6.6 | 5.7 | 5.7 | 5.7 | 5.6 | 5.6 | |
| 75th centile | 8.7 | 8.3 | 7.9 | 7.6 | 7.9 | 5.8 | |
| Skewness | 1.72 | 1.33 | 1.65 | 1.12 | 0.41 | 0.00 | |
| Kurtosis | −2.33 | 3.12 | 5.94 | 2.27 | −0.41 | −2.75 | |
| Geom. mean | 7.27 | 6.84 | 6.74 | 6.66 | 6.62 | 5.70 | |
| Coeff. var | 16.15 | 27.28 | 27.59 | 24.43 | 21.90 | 2.48 | |
| Heights (m) within Ratio Ranges | Lowest Quartile Ratios 2.5 to 5.6 | Inter-Quartile Range Ratios 5.7 to 7.8 | Highest Quartile Ratios 7.8 to 20.4 | ||||
| IGFBP-3/IGF-1 Ratio vs. Stature—Summary Statistics | N | 392 | 845 | 396 | |||
| Min | 1.5 | 1.4 | 1.5 | ||||
| Max | 1.9 | 1.9 | 1.8 | ||||
| Sum | 648.1 | 1398.7 | 651.5 | ||||
| Mean | 1.65 | 1.66 | 1.65 | ||||
| Std. error | 0.00 | 0.00 | 0.00 | ||||
| Variance | 0.01 | 0.01 | 0.01 | ||||
| Std. dev | 0.08 | 0.07 | 0.08 | ||||
| Median | 1.7 | 1.7 | 1.6 | ||||
| 25th centile | 1.6 | 1.6 | 1.6 | ||||
| 75th centile | 1.7 | 1.7 | 1.7 | ||||
| Skewness | 0.09 | −0.08 | 0.08 | ||||
| Kurtosis | −0.20 | −0.12 | −0.44 | ||||
| Geom. mean | 1.65 | 1.65 | 1.64 | ||||
| Coeff. var | 4.63 | 4.50 | 4.86 | ||||
© 2020 by the authors. Licensee MDPI, Basel, Switzerland. This article is an open access article distributed under the terms and conditions of the Creative Commons Attribution (CC BY) license (http://creativecommons.org/licenses/by/4.0/).
Share and Cite
Yovich, J.L.; Zaidi, S.; Nguyen, M.D.K.; Hinchliffe, P.M. Measuring IGF-1 and IGFBP-3 Profiles in Women Seeking Assisted Reproduction; Relationship to Clinical Parameters (Study 1). J. Pers. Med. 2020, 10, 122. https://doi.org/10.3390/jpm10030122
Yovich JL, Zaidi S, Nguyen MDK, Hinchliffe PM. Measuring IGF-1 and IGFBP-3 Profiles in Women Seeking Assisted Reproduction; Relationship to Clinical Parameters (Study 1). Journal of Personalized Medicine. 2020; 10(3):122. https://doi.org/10.3390/jpm10030122
Chicago/Turabian StyleYovich, John L., Syeda Zaidi, Minh D. K. Nguyen, and Peter M. Hinchliffe. 2020. "Measuring IGF-1 and IGFBP-3 Profiles in Women Seeking Assisted Reproduction; Relationship to Clinical Parameters (Study 1)" Journal of Personalized Medicine 10, no. 3: 122. https://doi.org/10.3390/jpm10030122