Implementation and Continuous Monitoring of an Electronic Health Record Embedded Readmissions Clinical Decision Support Tool

 ,
,  , , and
Abstract
:1. Introduction
2. Materials and Methods
2.1. Study Environment
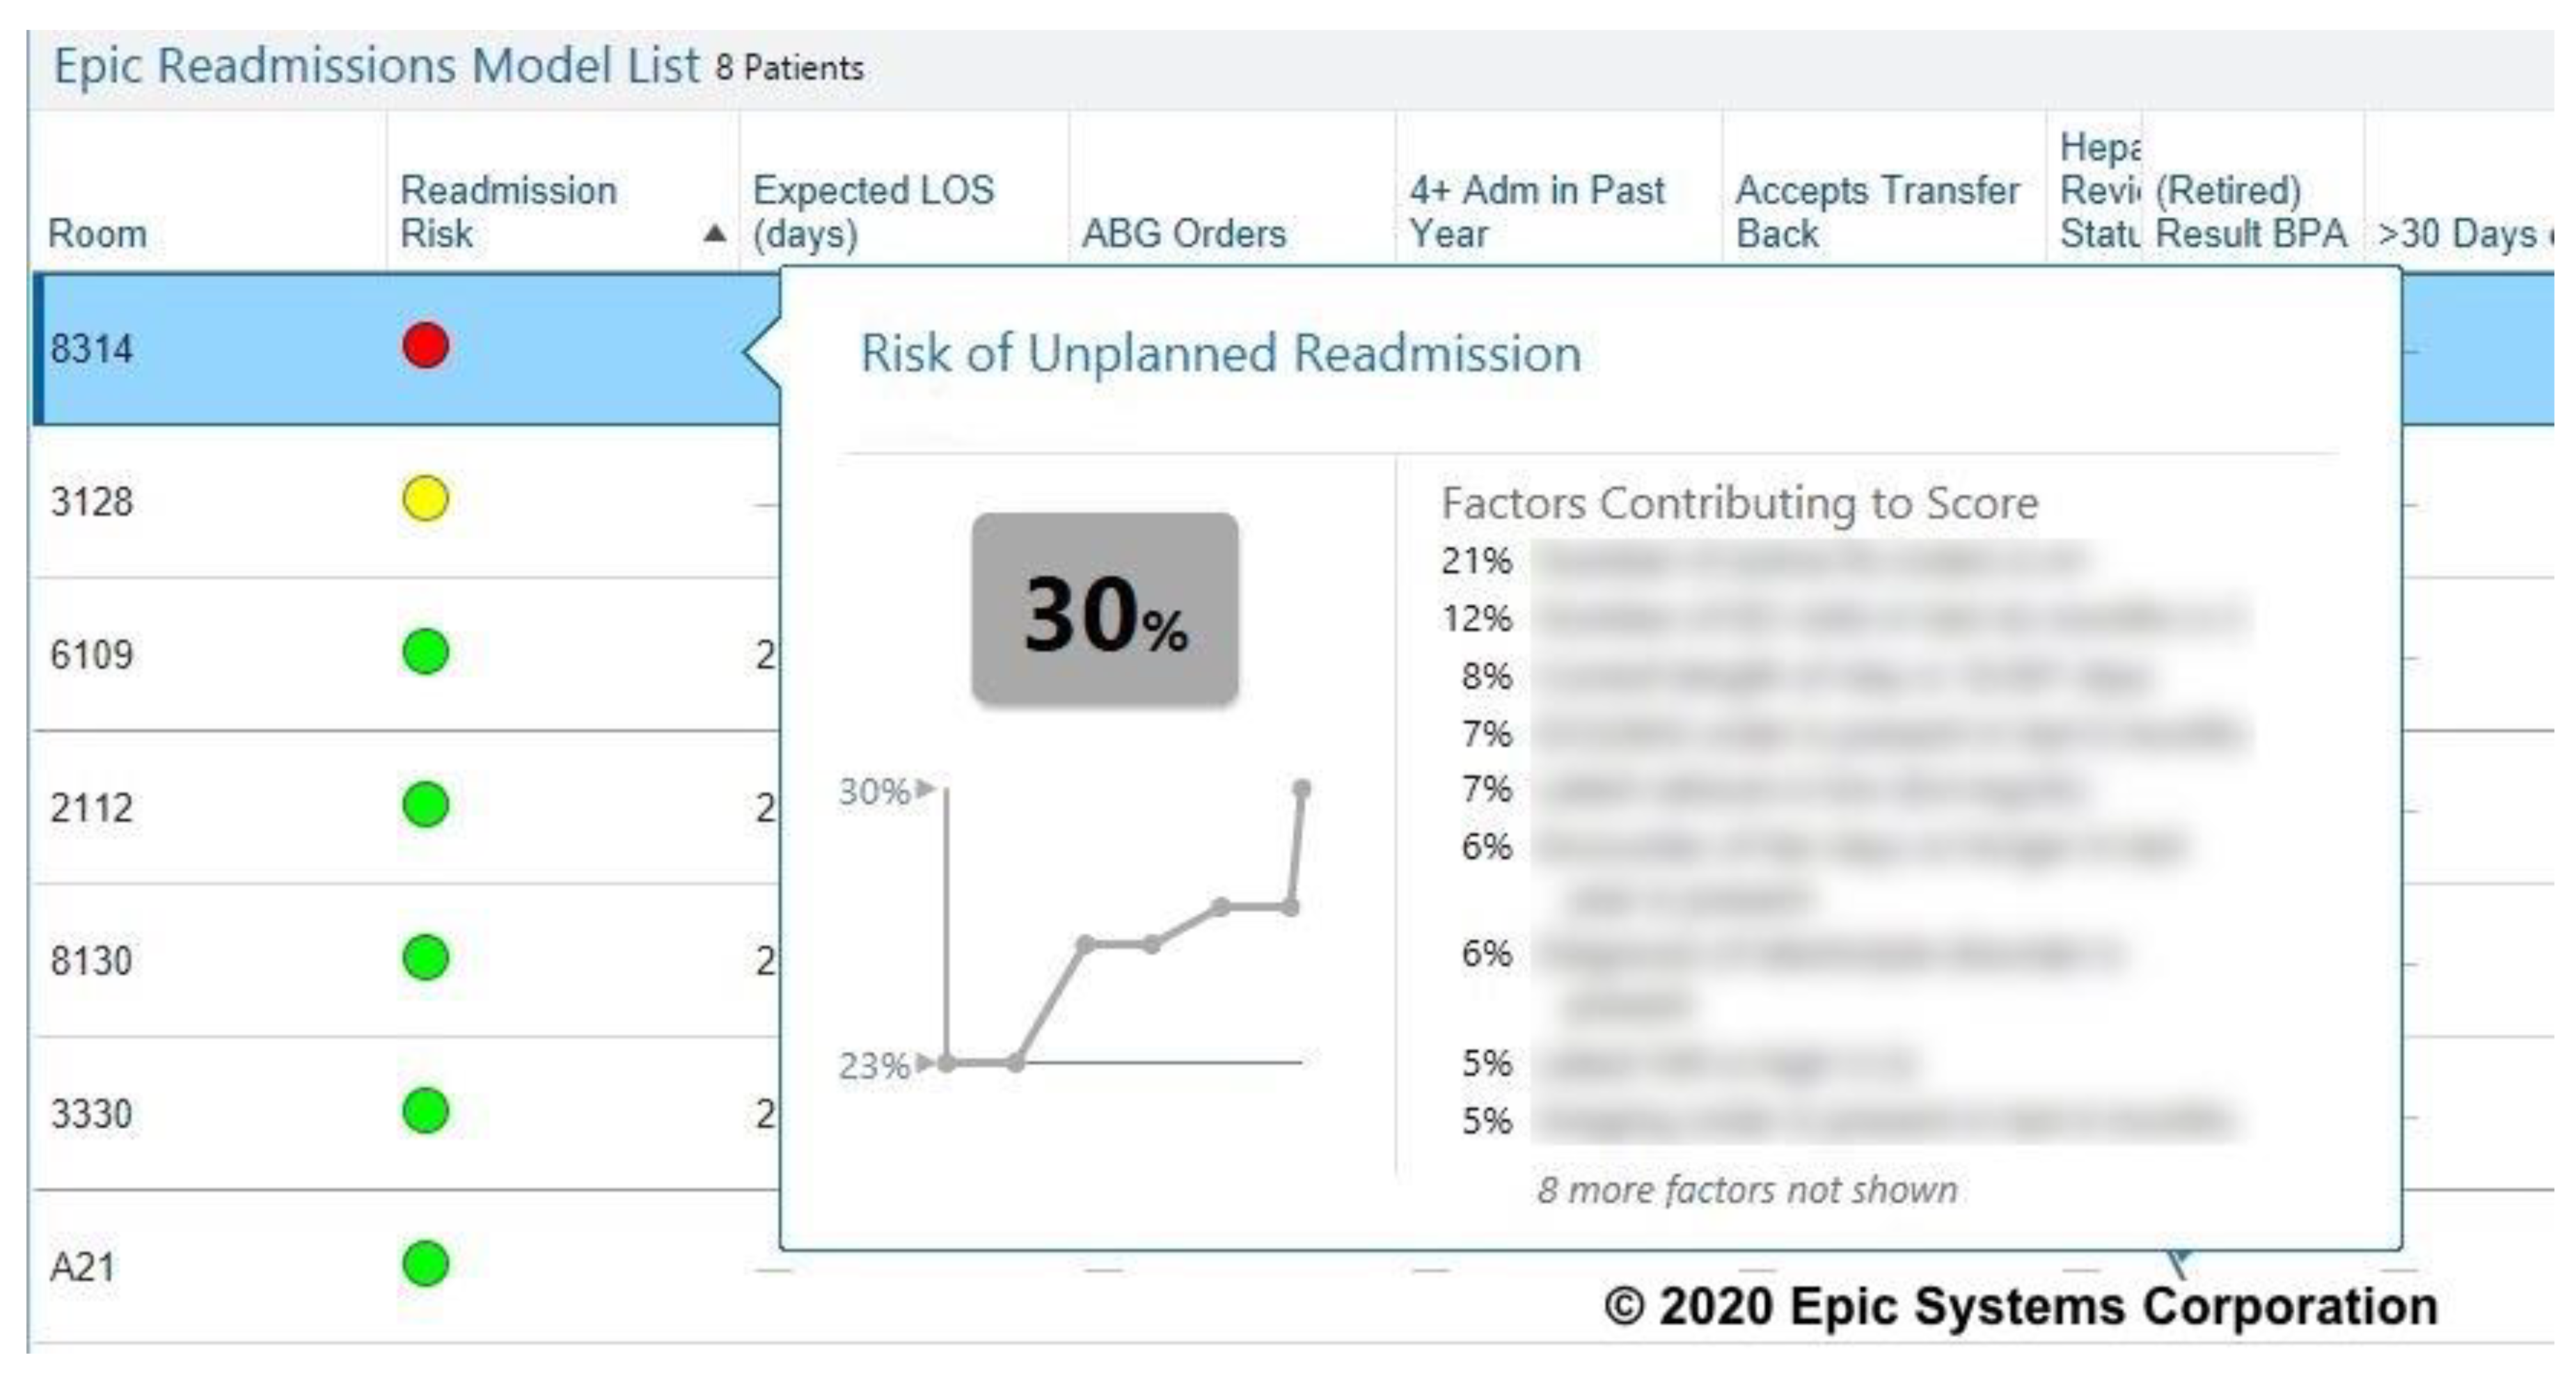
2.2. Readmissions Risk Score
2.3. Implementation Process
2.4. Evaluation
- Both index hospitalization and readmission are to any DUHS facility. Readmissions occurred within 30 days of the index hospitalization’s discharge date.
- Index hospitalization was between dates 1 January 2018–31 December 2019 and included all patients that were inpatient status, and ages 18 and older, admitted to any of the three DUHS hospitals. We excluded patients whose index admissions were based on psychiatric diagnoses, rehabilitation care, non-surgical cancer MSDRGs (Medicare Severity Diagnosis Related Groups), or admitted for inpatient hospice. Patients who were transferred to other acute facilities, died during index hospitalization, or left against medical advice were also excluded.
- Readmissions are hospitalization within 30 days of discharge from an index hospitalization and included patients age 18 and older with inpatient status. We excluded patients whose readmission was based on psychiatric diagnoses, rehabilitation care, or who had a planned readmissions (based on the CMS algorithm) [16].
2.5. Institutional Review Statement
3. Results
4. Discussion
- Case management discussion with clinical providers to refer patient to intensive case management referral services after discharge.
- Clinical team obtaining a hospital follow-up visit scheduled within 7 days of discharge.
- Pharmacist collaboration with discharging team to perform medication reconciliation prior to discharge.
- Duke Resource Center calls patient within 48 h of discharge and performs a post-discharge phone call.
Author Contributions
Funding
Acknowledgments
Conflicts of Interest
References
- Jencks, S.F. Defragmenting care. Ann. Intern. Med. 2010, 153, 757–758. [Google Scholar] [CrossRef] [PubMed]
- Siddiqui, Z.; Berry, S.; Bertram, A.; Allen, L.; Hoyer, E.; Durkin, N.; Qayyum, R.; Wick, E.; Pronovost, P.; Brotman, D.J. Does Patient Experience Predict 30-Day Readmission? A Patient-Level Analysis of HCAHPS Data. J. Hosp. Med. 2018, 10, 681–687. [Google Scholar] [CrossRef] [PubMed] [Green Version]
- Burke, R.E.; Jones, C.D.; Hosokawa, P.; Glorioso, T.J.; Coleman, E.A.; Ginde, A.A. Influence of Nonindex Hospital Readmission on Length of Stay and Mortality. Med. Care Res. Rev. 2018, 56, 85–90. [Google Scholar] [CrossRef]
- Jencks, S.F.; Williams, M.V.; Coleman, E.A. Rehospitalizations among patients in the Medicare fee-for-service program. N. Engl. J. Med. 2009, 360, 1418–1428. [Google Scholar] [CrossRef] [PubMed]
- Center for Medicare and Medicaid Services (CMS). Hospital Readmissions Reduction Program (HRRP). Available online: https://www.cms.gov/Medicare/Medicare-Fee-for-Service-Payment/AcuteInpatientPPS/Readmissions-Reduction-Program (accessed on 16 June 2020).
- Centers for Medicare and Medicaid Services. Hospital Compare. Available online: https://www.medicare.gov/hospitalcompare/search.html (accessed on 16 June 2020).
- Van Walraven, C.; Bennett, C.; Jennings, A.; Austin, P.C.; Forster, A.J. Proportion of hospital readmissions deemed avoidable: A systematic review. CMAJ 2011, 183, E391–E402. [Google Scholar] [CrossRef] [Green Version]
- Auerbach, A.D.; Kripalani, S.; Vasilevskis, E.E.; Sehgal, N.; Lindenauer, P.K.; Metlay, J.P.; Fletcher, G.; Ruhnke, G.W.; Flanders, S.A.; Kim, C.; et al. Preventability and Causes of Readmissions in a National Cohort of General Medicine Patients. JAMA Intern. Med. 2016, 176, 484–493. [Google Scholar] [CrossRef]
- Hasan, O.; Meltzer, D.O.; Shaykevich, S.A.; Bell, C.M.; Kaboli, P.J.; Auerbach, A.D.; Wetterneck, T.B.; Arora, V.M.; Zhang, J.; Schnipper, J.L. Hospital readmission in general medicine patients: A prediction model. J. Gen. Intern. Med. 2010, 25, 211–219. [Google Scholar] [CrossRef] [Green Version]
- Allaudeen, N.; Vidyarthi, A.; Maselli, J.; Auerbach, A. Redefining readmission risk factors for general medicine patients. J. Hosp. Med. 2011, 6, 54–60. [Google Scholar] [CrossRef] [Green Version]
- Kansagara, D.; Englander, H.; Salanitro, A.; Kagen, D.; Theobald, C.; Freeman, M.; Kripalani, S. Risk prediction models for hospital readmission: A systematic review. JAMA 2011, 306, 1688–1698. [Google Scholar] [CrossRef] [Green Version]
- Yu, S.; Farooq, F.; van Esbroeck, A.; Fung, G.; Anand, V.; Krishnapuram, B. Predicting readmission risk with institution-specific prediction models. Artif. Intell. Med. 2015, 65, 89–96. [Google Scholar] [CrossRef]
- Pencina, M.J.; Goldstein, B.A.; D’Agostino, R.B. Prediction Models—Development, Evaluation, and Clinical Application. N. Engl. J. Med. 2020, 382, 1583–1586. [Google Scholar] [CrossRef] [PubMed]
- Epic. Cognitive Computing Model Brief: Risk of Unplanned Readmission (Version 1). 2016, pp. 1–13. Available online: www.epic.com (accessed on 12 June 2020).
- Van Walraven, C.; Dhalla, I.A.; Bell, C.; Etchells, E.; Stiell, I.G.; Zarnke, K.; Austin, P.C.; Forster, A.J. Derivation and validation of an index to predict early death or unplanned readmission after discharge from hospital to the community. CMAJ 2010, 182, 551–557. [Google Scholar] [CrossRef] [PubMed] [Green Version]
- Centers for Medicare & Medicaid Services. Planned Readmission Algorithm—Version 2.1 Prepared. Available online: https://www.cms.gov/Medicare/Quality-Initiatives-Patient-Assessment-Instruments/HospitalQualityInits/Measure-Methodology (accessed on 8 October 2019).
- Steyerberg, E.W.; Vickers, A.J.; Cook, N.R.; Gerds, T.; Gonen, M.; Obuchowski, N.; Pencina, M.J.; Kattan, M.W. Assessing the performance of prediction models: A framework for traditional and novel measures. Epidemiology 2010, 21, 128–138. [Google Scholar] [CrossRef] [Green Version]
- Makam, A.N.; Nguyen, O.K.; Clark, C.; Zhang, S.; Xie, B.; Weinreich, M.; Mortensen, E.M.; Halm, E.A. Predicting 30-Day Pneumonia Readmissions Using Electronic Health Record Data. J. Hosp. Med. 2017, 12, 209–216. [Google Scholar] [CrossRef] [Green Version]
- Bradley, E.H.; Yakusheva, O.; Horwitz, L.I.; Sipsma, H.; Fletcher, J. Identifying patients at increased risk for unplanned readmission. Med. Care 2013, 51, 761–766. [Google Scholar] [CrossRef] [Green Version]
- Choudhry, S.A.; Li, J.; Davis, D.; Erdmann, C.; Sikka, R.; Sutariya, B. A public-private partnership develops and externally validates a 30-day hospital readmission risk prediction model. Online J. Public Health Inform. 2013, 5, 219. [Google Scholar] [CrossRef]
- Donze, J.; Aujesky, D.; Williams, D.; Schnipper, J.L. Potentially avoidable 30-day hospital readmissions in medical patients: Derivation and validation of a prediction model. JAMA Intern. Med. 2013, 173, 632–638. [Google Scholar] [CrossRef]
- Rana, S.; Tran, T.; Luo, W.; Phung, D.; Kennedy, R.L.; Venkatesh, S. Predicting unplanned readmission after myocardial infarction from routinely collected administrative hospital data. Aust. Health Rev. 2014, 38, 377–382. [Google Scholar] [CrossRef] [Green Version]
- Low, L.L.; Lee, K.H.; Hock Ong, M.E.; Wang, S.; Tan, S.Y.; Thumboo, J.; Liu, N. Predicting 30-Day Readmissions: Performance of the LACE Index Compared with a Regression Model among General Medicine Patients in Singapore. Biomed Res. Int. 2015, 2015, 169870. [Google Scholar] [CrossRef] [Green Version]
- Shams, I.; Ajorlou, S.; Yang, K. A predictive analytics approach to reducing 30-day avoidable readmissions among patients with heart failure, acute myocardial infarction, pneumonia, or COPD. Health Care Manag. Sci. 2015, 18, 19–34. [Google Scholar] [CrossRef]
- Tong, L.; Erdmann, C.; Daldalian, M.; Li, J.; Esposito, T. Comparison of predictive modeling approaches for 30-day all-cause non-elective readmission risk. BMC Med. Res. Methodol. 2016, 16, 26. [Google Scholar] [CrossRef] [PubMed] [Green Version]
- Nguyen, O.K.; Makam, A.N.; Clark, C.; Zhang, S.; Xie, B.; Velasco, F.; Amarasingham, R.; Halm, E.A. Predicting all-cause readmissions using electronic health record data from the entire hospitalization: Model development and comparison. J. Hosp. Med. 2016, 11, 473–480. [Google Scholar] [CrossRef] [PubMed] [Green Version]
- Horne, B.D.; Budge, D.; Masica, A.L.; Savitz, L.A.; Benuzillo, J.; Cantu, G.; Bradshaw, A.; McCubrey, R.O.; Bair, T.L.; Roberts, C.A.; et al. Early inpatient calculation of laboratory-based 30-day readmission risk scores empowers clinical risk modification during index hospitalization. Am. Heart J. 2017, 185, 101–109. [Google Scholar] [CrossRef] [PubMed]
- Tabak, Y.P.; Sun, X.; Nunez, C.M.; Gupta, V.; Johannes, R.S. Predicting Readmission at Early Hospitalization Using Electronic Clinical Data: An Early Readmission Risk Score. Med. Care 2017, 55, 267–275. [Google Scholar] [CrossRef] [PubMed] [Green Version]


| DUH | DRH | DRAH | |
|---|---|---|---|
| Number of discharges | 67,219 | 27,405 | 17,785 |
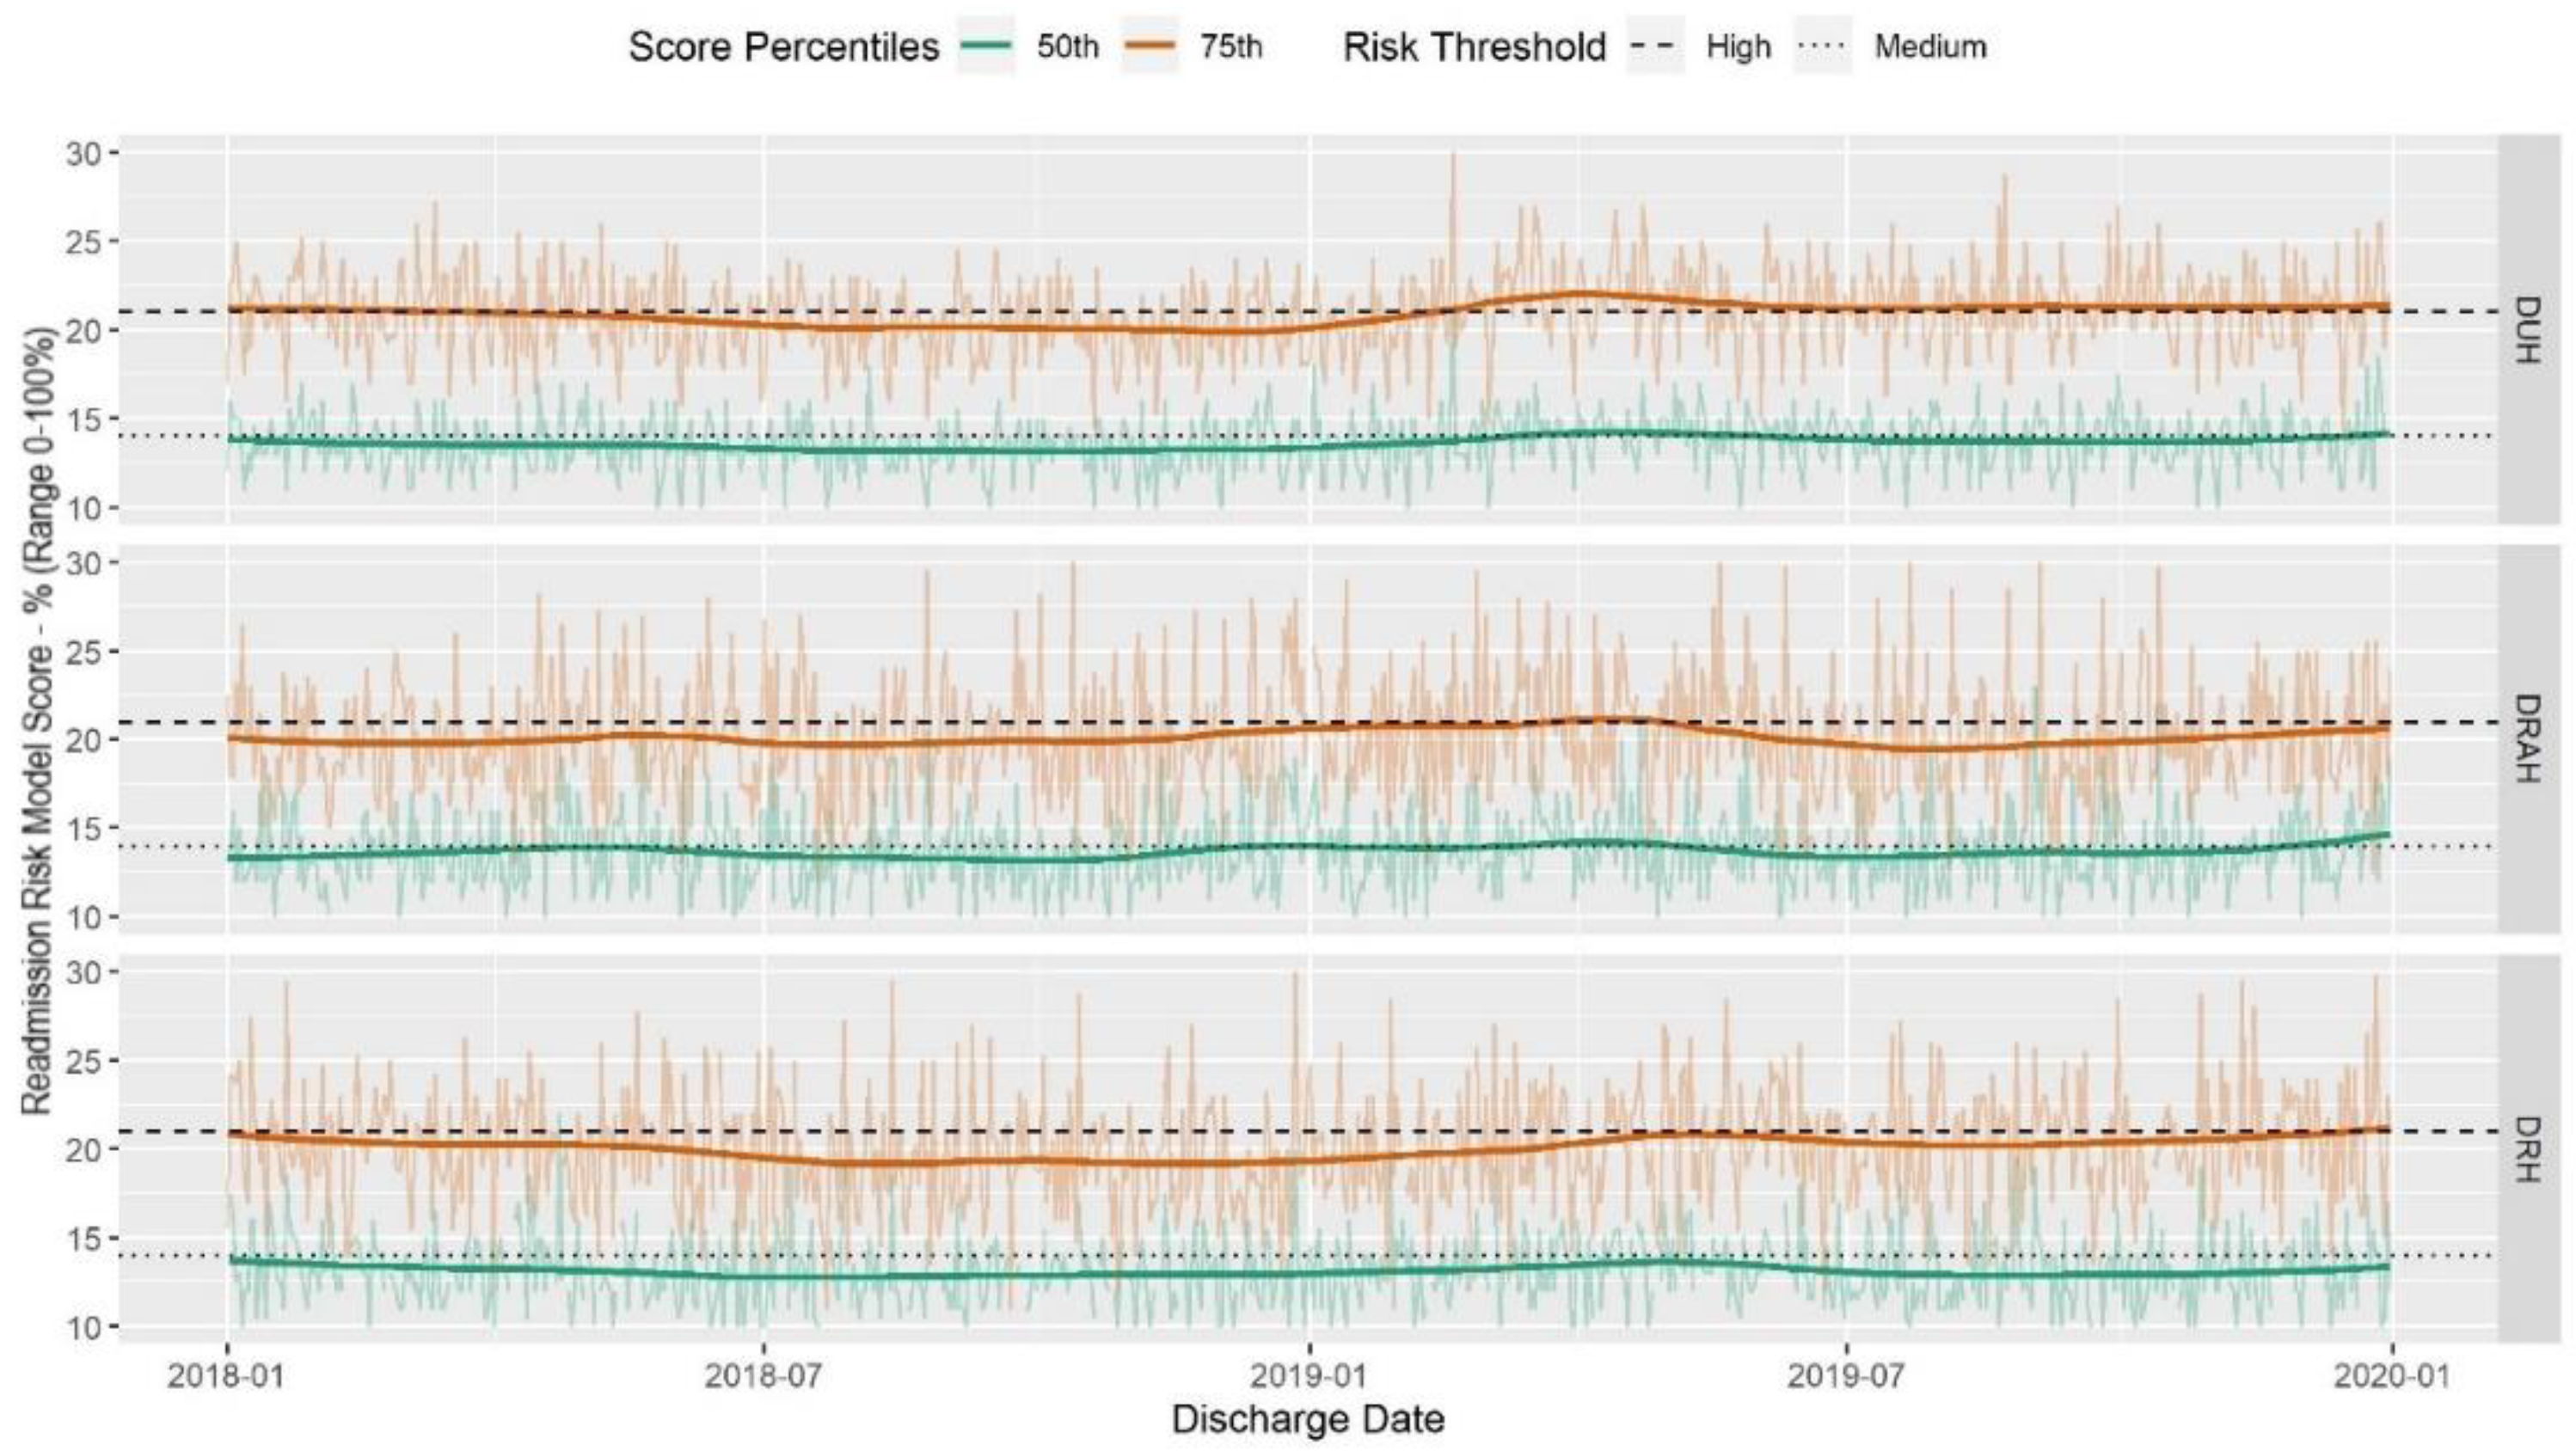
| Median score (IQR) | 14 (9–21) | 13 (7–20) | 13 (9–20) |
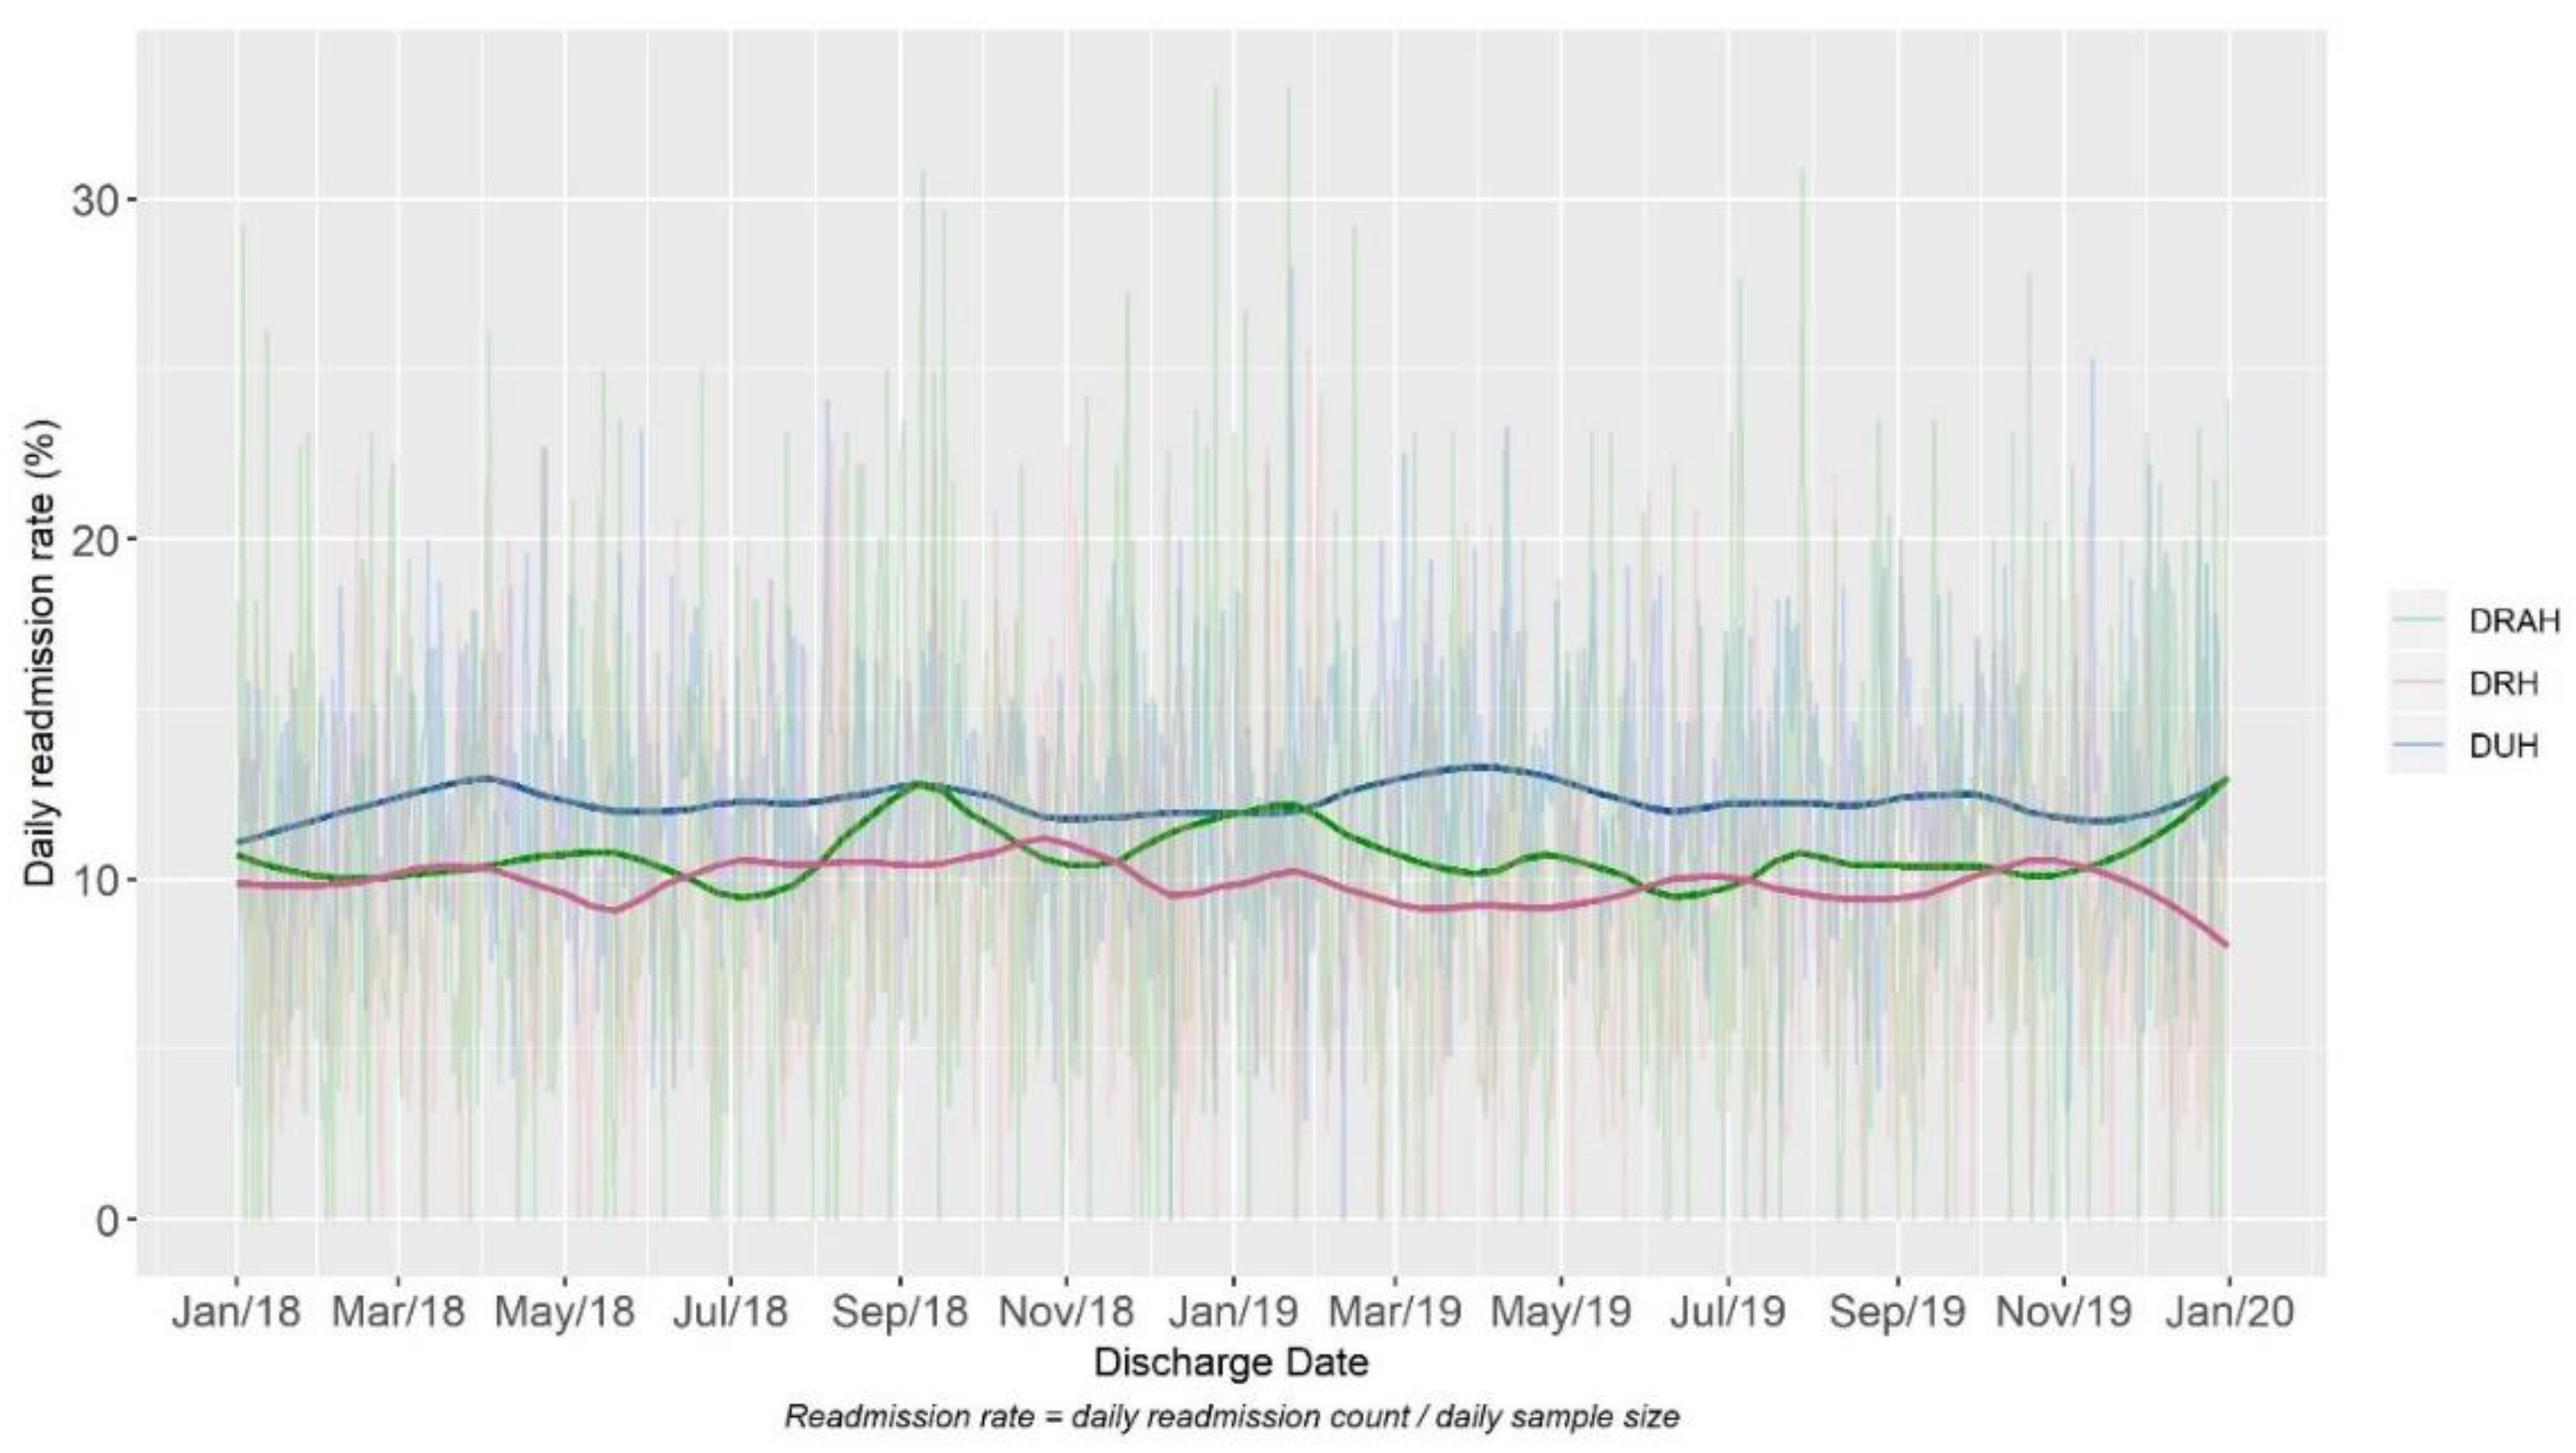
| Readmission number (rate) | 8308 (12%) | 2729 (10%) | 1905 (11%) |
| Number (percentage) of patients getting any intervention | 31,552 (47%) | 12,671 (46%) | 4698 (26%) |
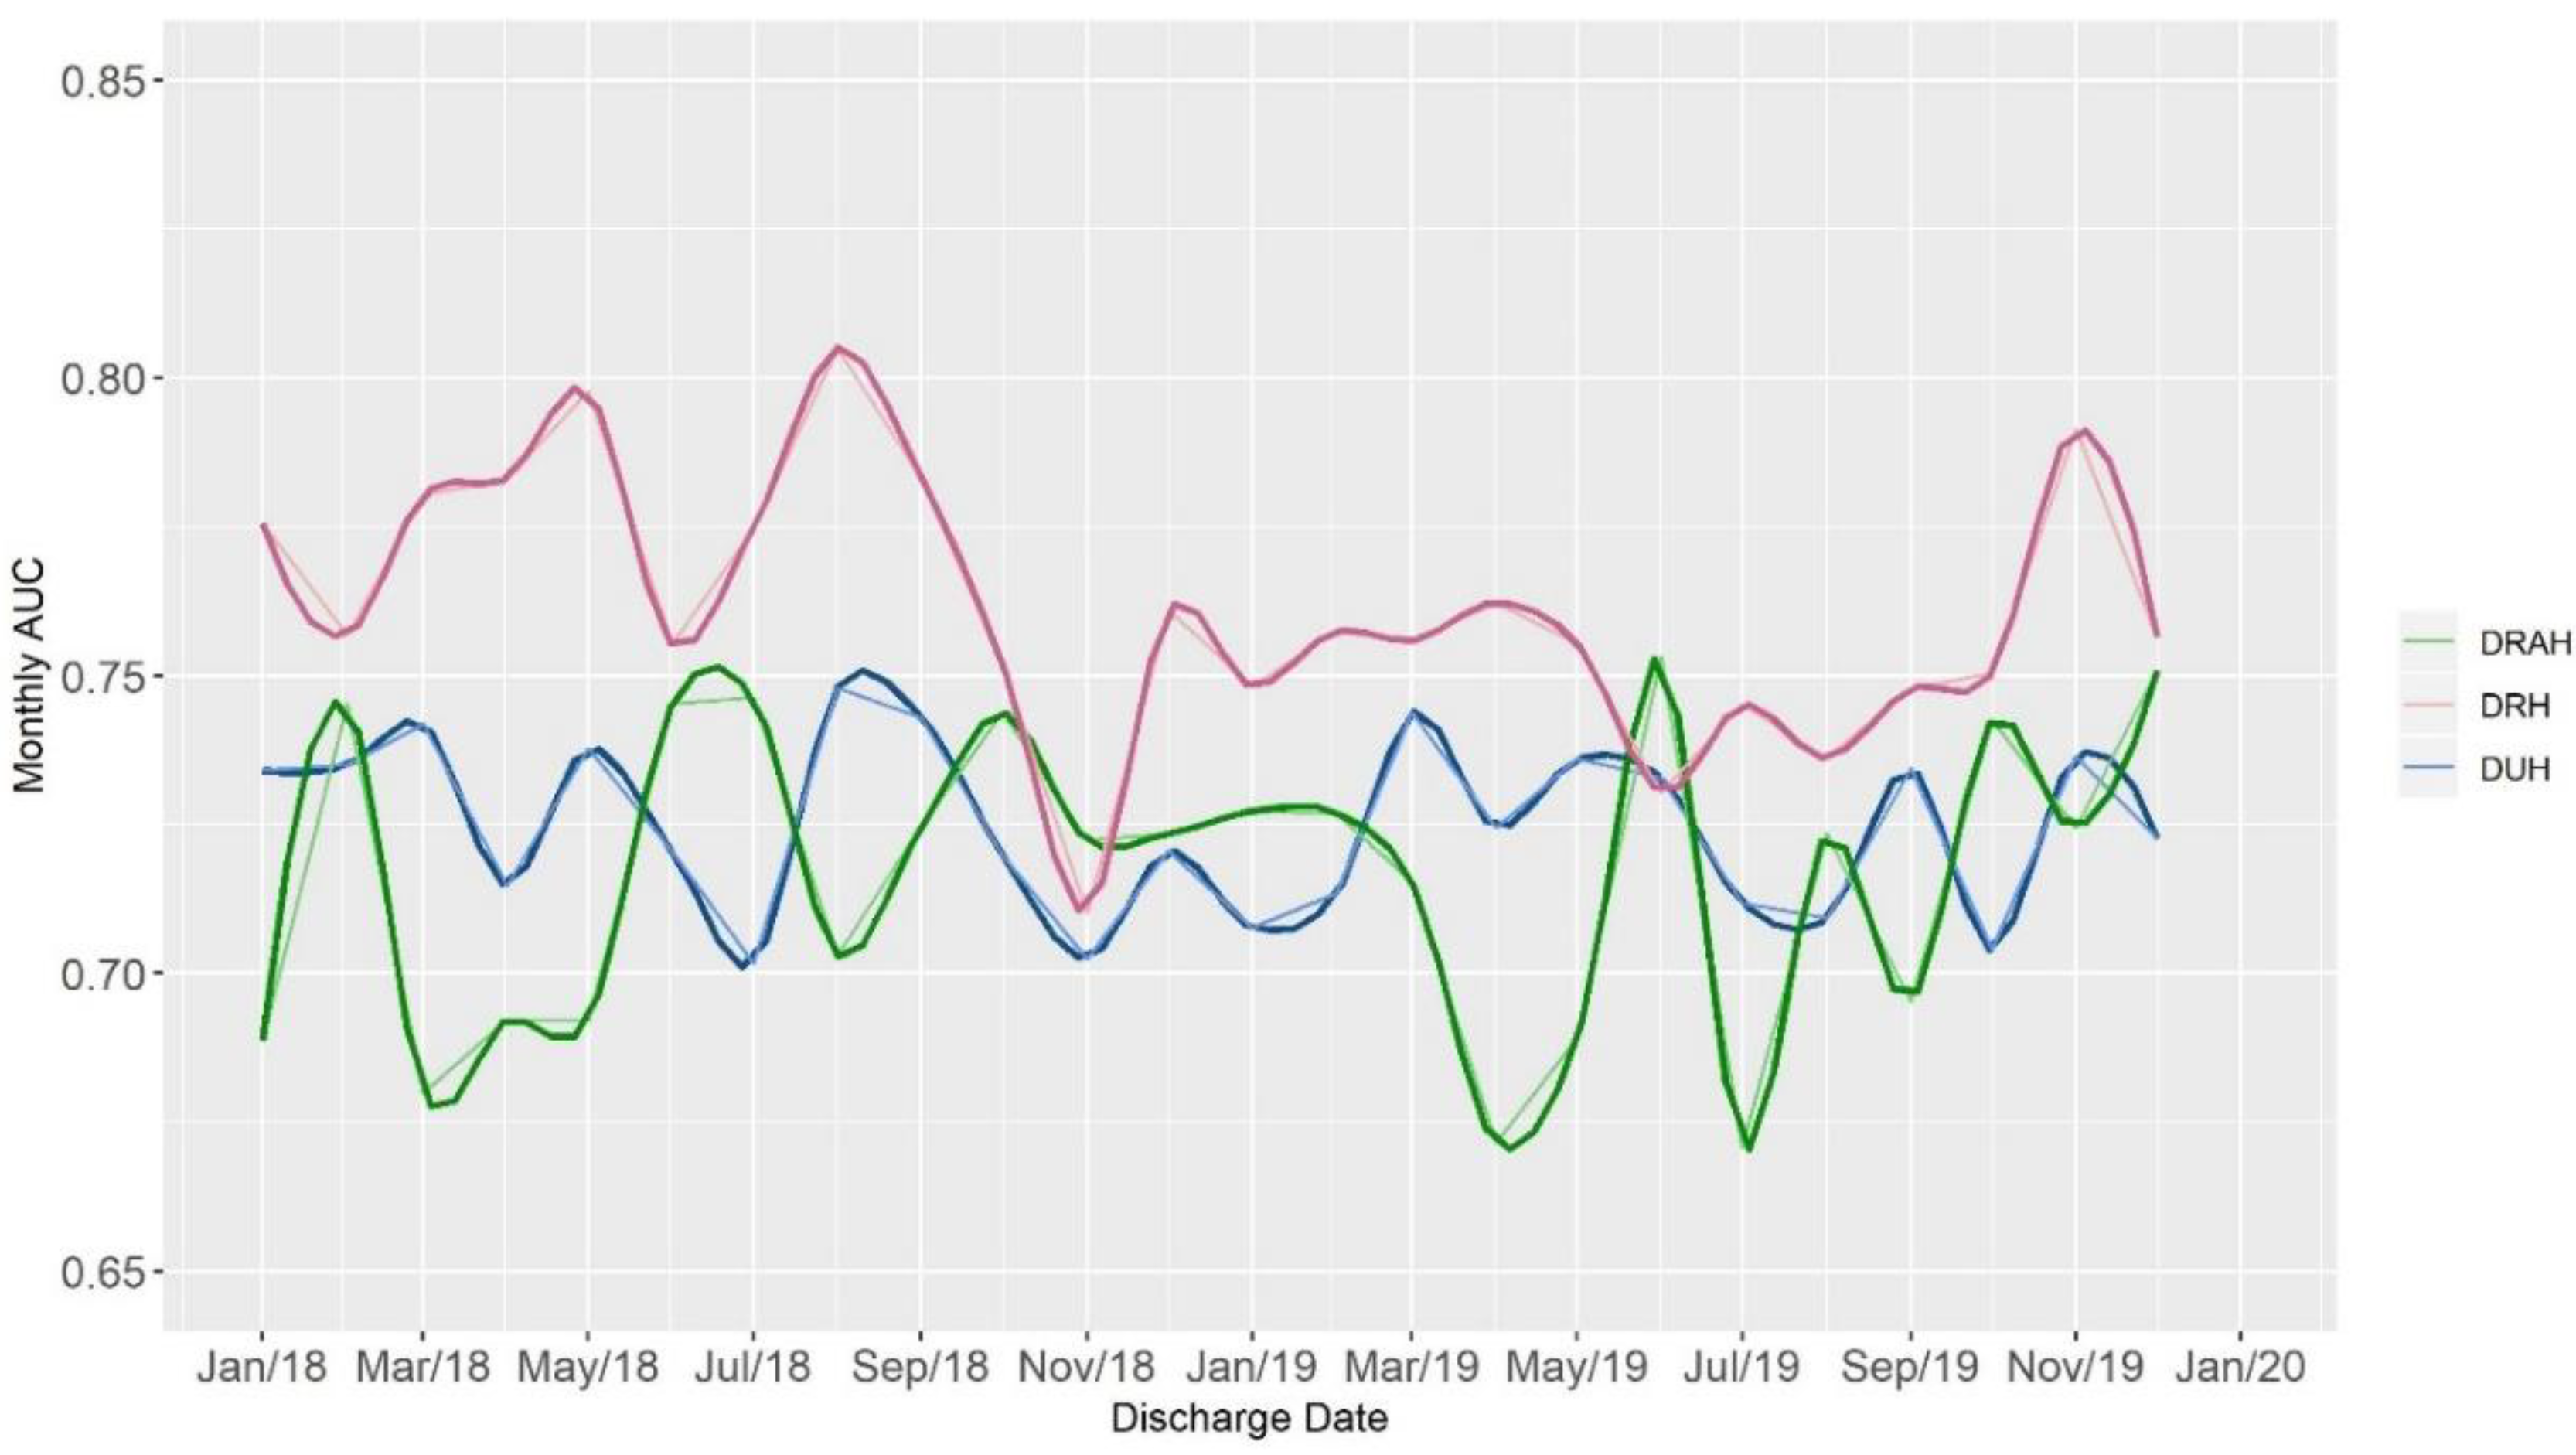
| AUC | 0.72 | 0.72 | 0.76 |
| Calibration Slope | 1.03 | 1.07 | 0.97 |
| Population | AUC | Readmission Rate | Positive Rate at Medium Risk 1 | Positive Rate at High Risk 2 | PPV at Medium Risk | PPV at High Risk | Negative Rate at Medium Risk | Negative Rate at High Risk |
|---|---|---|---|---|---|---|---|---|
| DUH Overall | 0.725 | 12% | 0.249 | 0.534 | 0.128 | 0.248 | 0.239 | 0.228 |
| DUH Gen Medicine | 0.694 | 17% | 0.229 | 0.631 | 0.130 | 0.274 | 0.315 | 0.345 |
| DUH Heart | 0.707 | 13% | 0.263 | 0.599 | 0.108 | 0.232 | 0.326 | 0.297 |
| DUH Oncology | 0.611 | 22% | 0.272 | 0.637 | 0.194 | 0.262 | 0.312 | 0.496 |
| DUH Surgery | 0.663 | 11% | 0.297 | 0.299 | 0.139 | 0.224 | 0.230 | 0.129 |
| DRAH Overall | 0.716 | 11% | 0.273 | 0.507 | 0.118 | 0.217 | 0.246 | 0.219 |
| DRAH Gen Medicine | 0.676 | 14% | 0.283 | 0.580 | 0.126 | 0.218 | 0.320 | 0.339 |
| DRAH Heart | 0.680 | 8% | 0.395 | 0.184 | 0.114 | 0.179 | 0.267 | 0.073 |
| DRAH Oncology | 0.513 | 20% | 0.429 | 0.429 | 0.250 | 0.200 | 0.321 | 0.429 |
| DRAH Surgery | 0.688 | 11% | 0.219 | 0.369 | 0.117 | 0.311 | 0.202 | 0.100 |
| DRH Overall | 0.760 | 10% | 0.243 | 0.567 | 0.109 | 0.227 | 0.219 | 0.214 |
| DRH Gen Medicine | 0.695 | 14% | 0.245 | 0.636 | 0.111 | 0.231 | 0.328 | 0.351 |
| DRH Heart | 0.613 | 9% | 0.387 | 0.484 | 0.073 | 0.150 | 0.477 | 0.265 |
| DRH Oncology 3 | NA | NA | NA | NA | NA | NA | NA | NA |
| DRH Surgery | 0.737 | 10% | 0.268 | 0.366 | 0.144 | 0.261 | 0.170 | 0.110 |
| Intervention Type | DUH | DUH General Med | DRAH | DRH |
|---|---|---|---|---|
| No Intervention | 14.09 (53%) | 19.27 (34%) | 15.04 (74%) | 11.82 (54%) |
| Any Intervention | 19.83 (47%) | 22.52 (66%) | 20.36 (26%) | 20.89 (46%) |
| Arranged transportation | 20.74 (26%) | 22.4 (48%) | 21.73 (12%) | 21.08 (36%) |
| Arranged HH visits | 21.64 (13%) | 23.64 (17%) | 18.47 (3%) | 21.81 (15%) |
| Referral to SNF | 22.51 (10%) | 23.95 (19%) | 20.78 (16%) | 23.87 (11%) |
| Procured DME | 17.06 (11%) | 21.53 (7%) | 14.78 (1%) | 17.51 (7%) |
| Medication assistance/support | 17.49 (2%) | 18.81 (3%) | 19.39 (1%) | 17.65 (2%) |
| Family training for elder patients | 23.6 (1%) | 23.51 (3%) | 24.52 (0%) | 23.93 (3%) |
| Geriatrics follow-up | 22.18 (1%) | 22.93 (4%) | 0 (0%) | 0 (0%) |
| Arranged outpatient dialysis | 30.97 (1%) | 33.57 (2%) | 27.12 (0%) | 33.23 (0%) |
| Duke Well (outpatient CM) | 27.53 (0%) | 28.32 (1%) | 35 (0%) | 24.24 (1%) |
© 2020 by the authors. Licensee MDPI, Basel, Switzerland. This article is an open access article distributed under the terms and conditions of the Creative Commons Attribution (CC BY) license (http://creativecommons.org/licenses/by/4.0/).
Share and Cite
Gallagher, D.; Zhao, C.; Brucker, A.; Massengill, J.; Kramer, P.; Poon, E.G.; Goldstein, B.A. Implementation and Continuous Monitoring of an Electronic Health Record Embedded Readmissions Clinical Decision Support Tool. J. Pers. Med. 2020, 10, 103. https://doi.org/10.3390/jpm10030103
Gallagher D, Zhao C, Brucker A, Massengill J, Kramer P, Poon EG, Goldstein BA. Implementation and Continuous Monitoring of an Electronic Health Record Embedded Readmissions Clinical Decision Support Tool. Journal of Personalized Medicine. 2020; 10(3):103. https://doi.org/10.3390/jpm10030103
Chicago/Turabian StyleGallagher, David, Congwen Zhao, Amanda Brucker, Jennifer Massengill, Patricia Kramer, Eric G. Poon, and Benjamin A. Goldstein. 2020. "Implementation and Continuous Monitoring of an Electronic Health Record Embedded Readmissions Clinical Decision Support Tool" Journal of Personalized Medicine 10, no. 3: 103. https://doi.org/10.3390/jpm10030103