Evaluation of ML-Based Clinical Decision Support Tool to Replace an Existing Tool in an Academic Health System: Lessons Learned

 ,
,  ,
,
Abstract
:1. Introduction
2. Methods
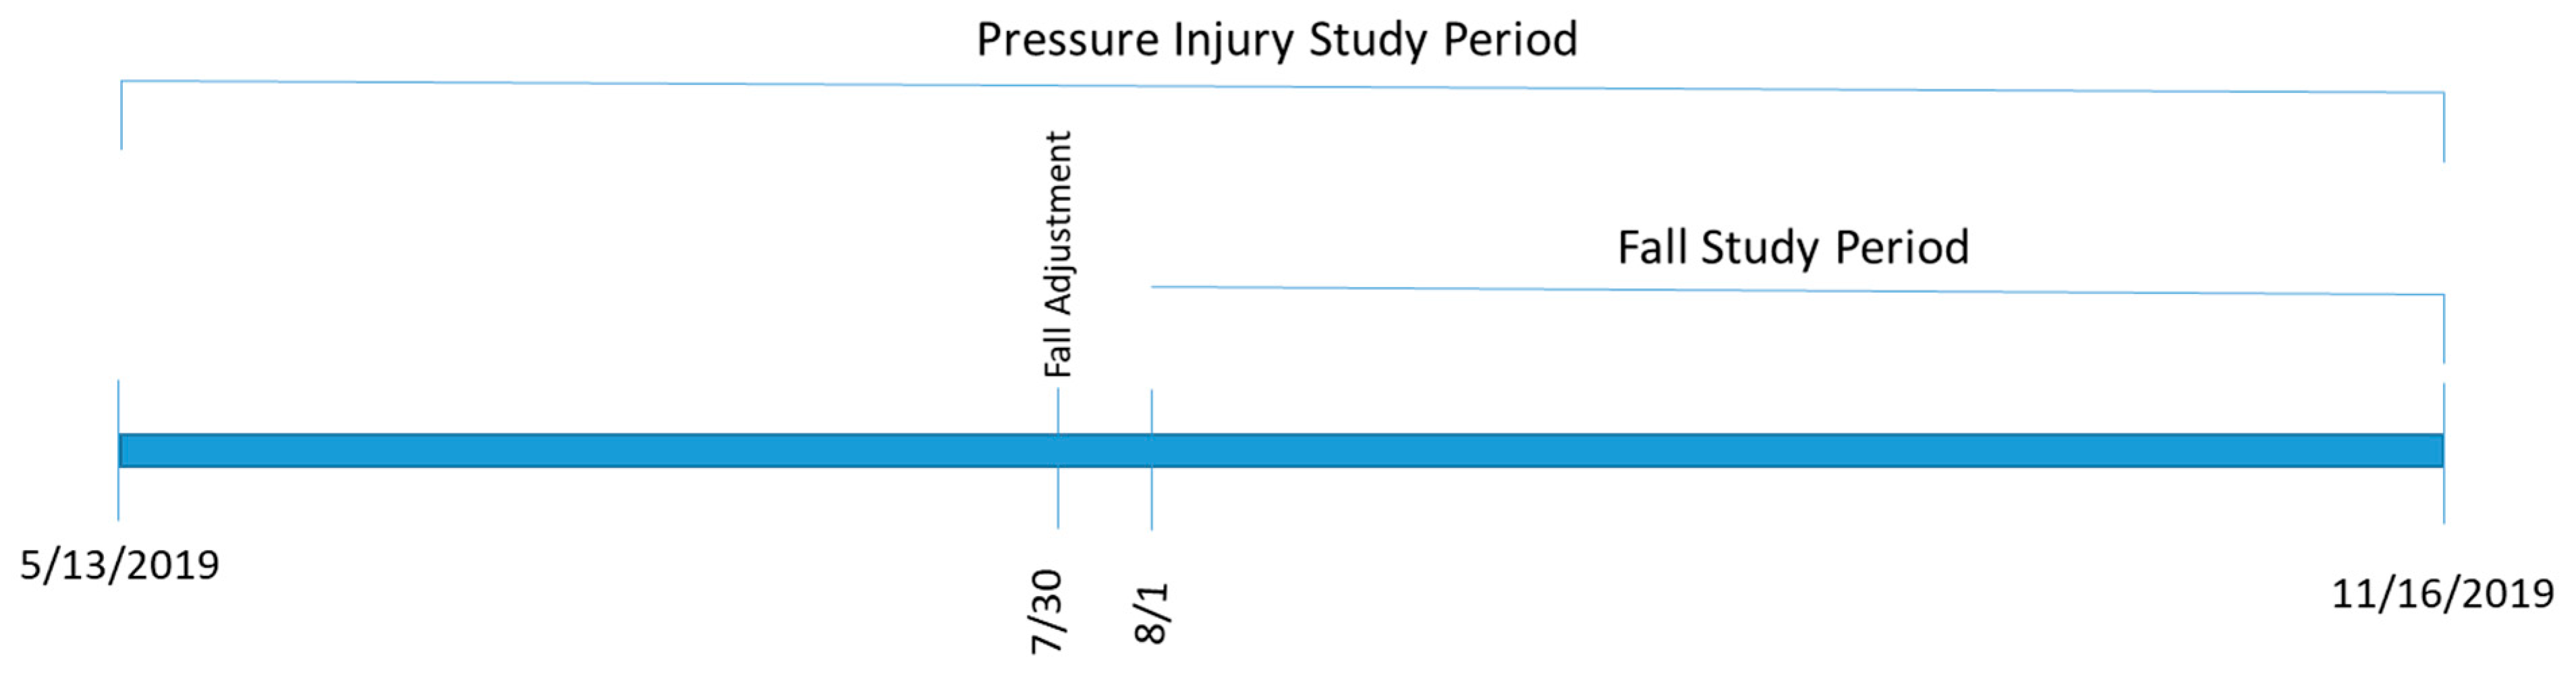
2.1. Clinical Environment
2.2. Clinical Decision Support Tools
2.3. Workflow Implementation
2.4. Data Extracted
2.5. Evaluation Design
3. Results
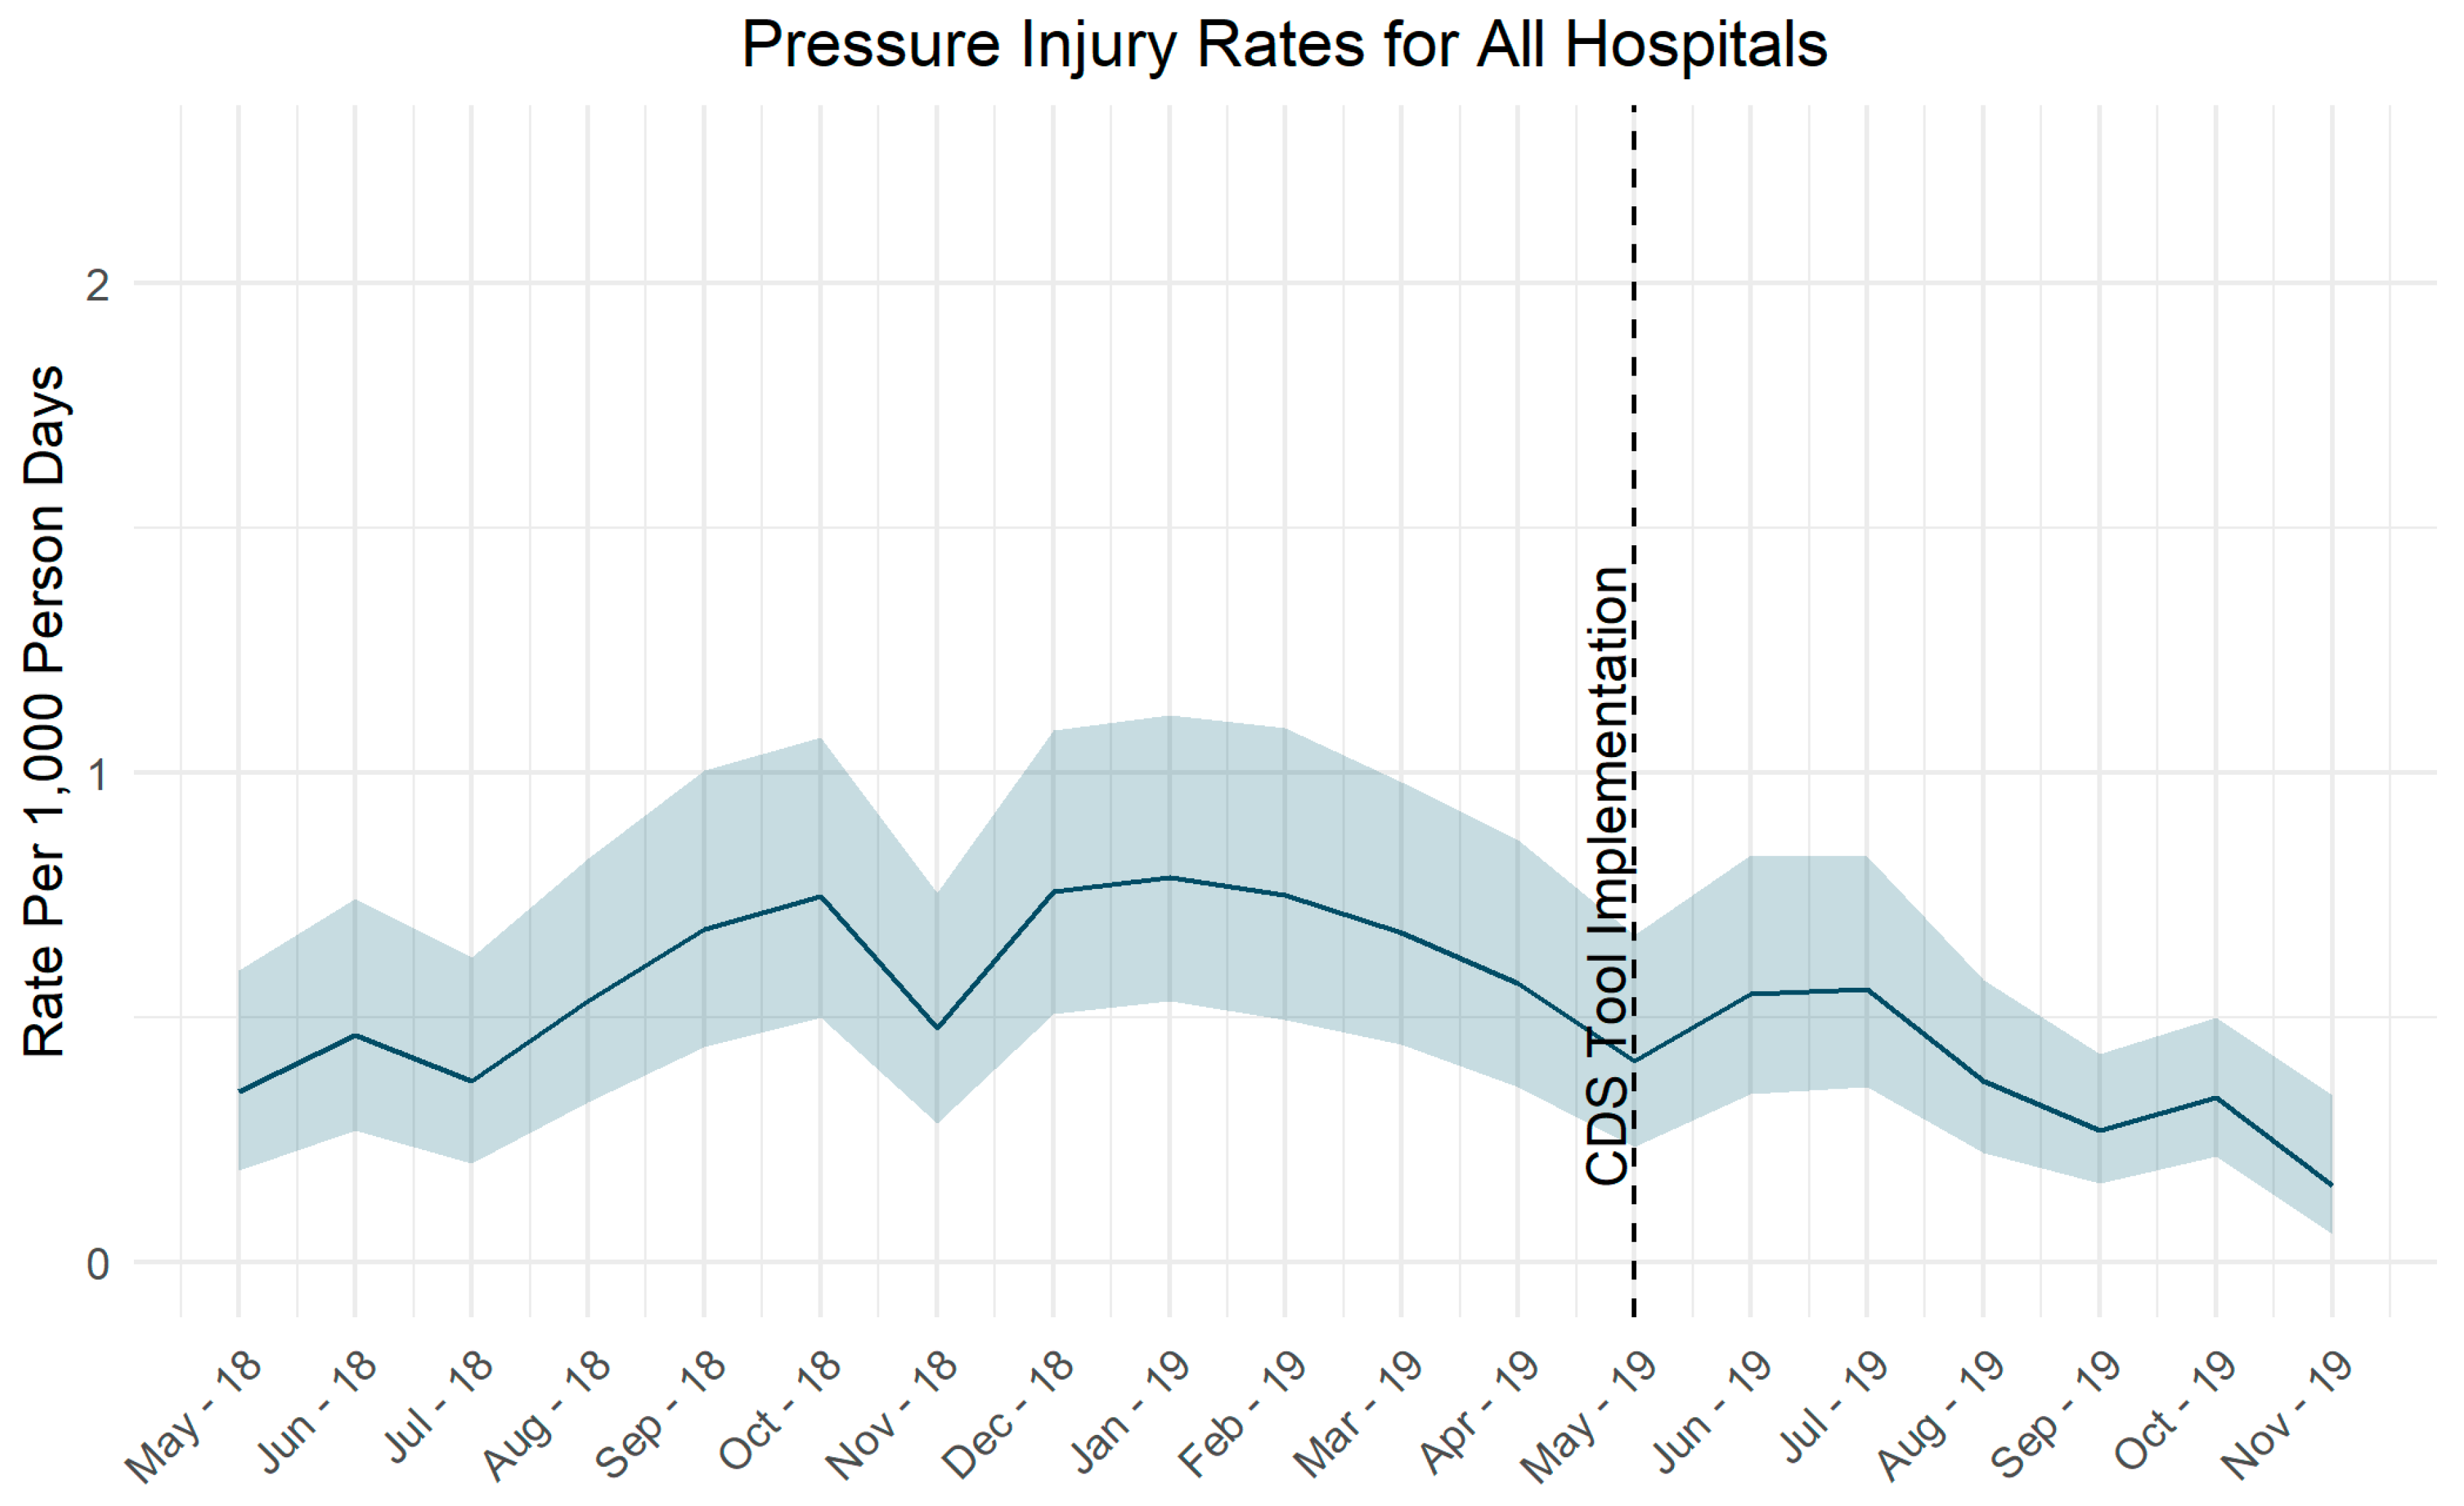
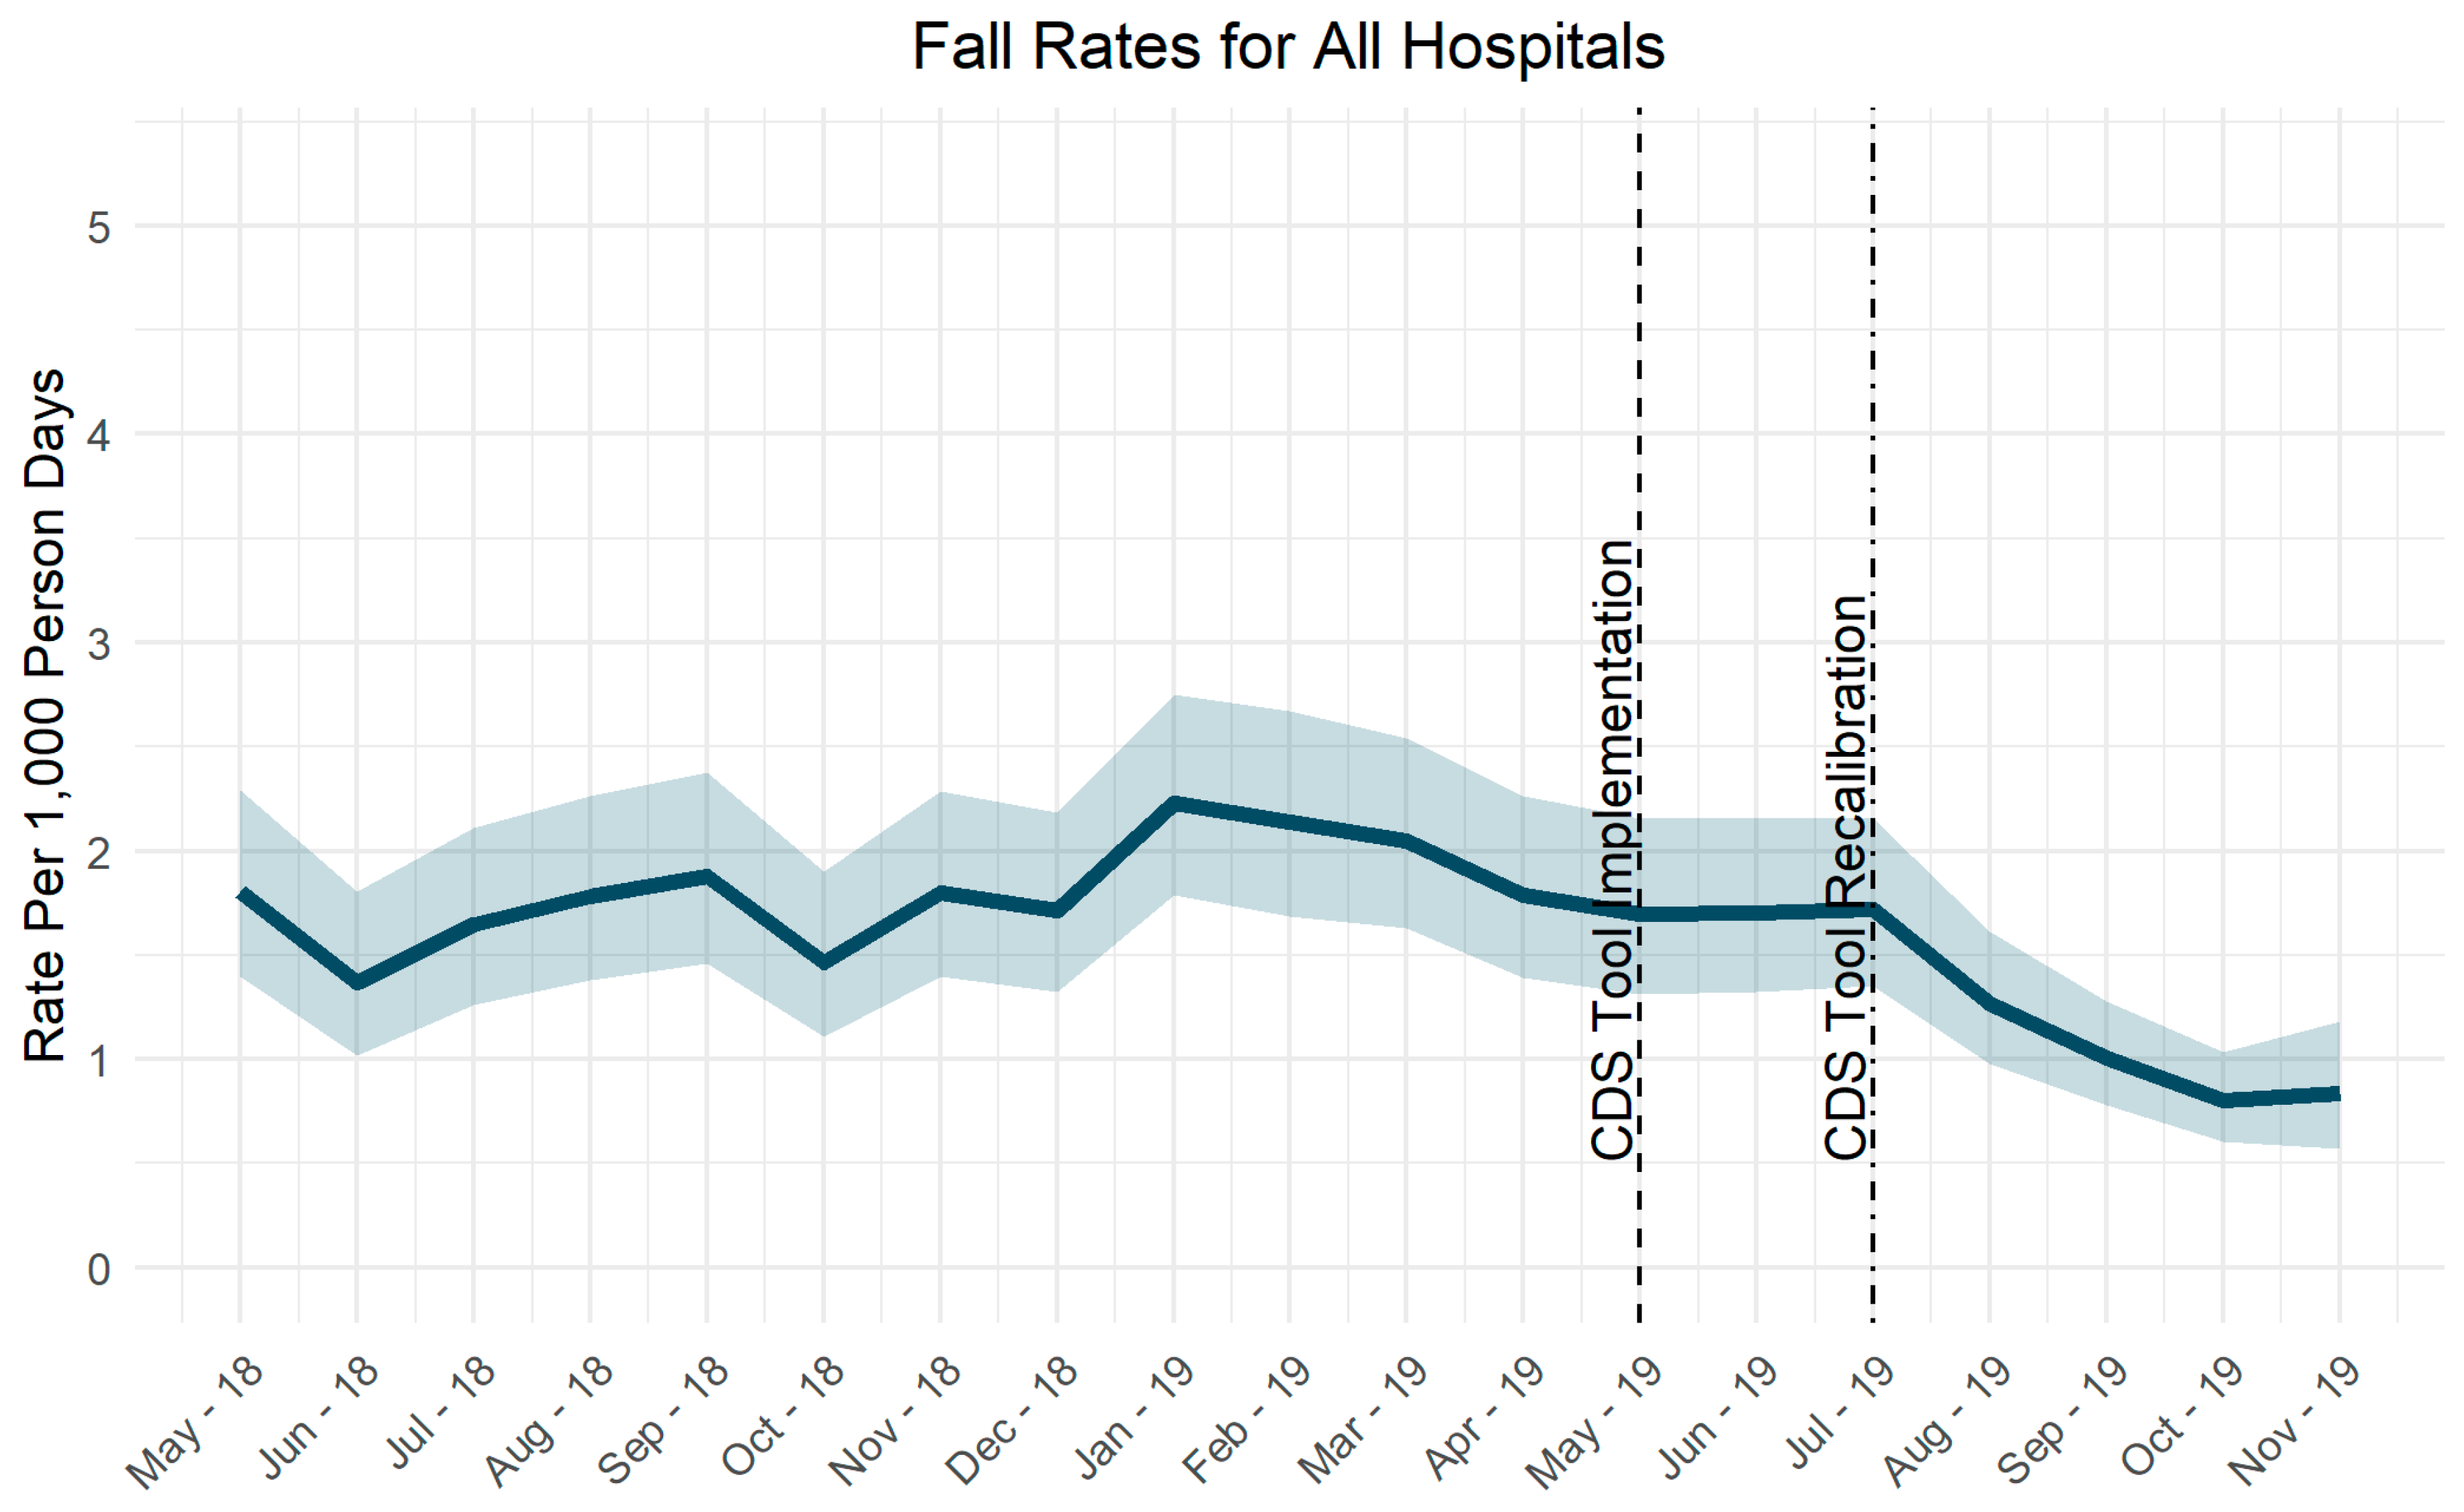
3.1. Event Rates
3.2. Workflow Compliance
3.3. Risk Score Comparisons
4. Discussion
4.1. Challenges in Evaluation
4.1.1. Data Matching
4.1.2. Adjusting Tool Sensitivity
4.1.3. Adoption
4.1.4. Implementation over Standard of Care
4.1.5. Efficacy
4.2. Decision Based on Evaluation
5. Conclusions
Author Contributions
Funding
Conflicts of Interest
Appendix A. Determining High Risk for Falls

References
- Gillum, R. From papyrus to the electronic tablet: A brief history of the clinical medical record with lessons for the digital age. Am. J. Med. 2013, 126, 853–857. [Google Scholar] [CrossRef] [PubMed]
- Campbell, R.J. The five rights of clinical decision support: CDS tools helpful for meeting meaningful use. J. AHIMA 2013, 84, 42–47. [Google Scholar] [PubMed]
- Shortliffe, E.H. Biomedical Informatics: Computer Applications in Health Care and Biomedicine, 4th ed.; Springer: London, UK, 2014. [Google Scholar] [CrossRef]
- Alther, M.; Reddy, C.K. Clinical decision support systems. In Healthcare Data Analytics, 1st ed.; Reddy, C.K., Aggarwal, C.C., Eds.; Chapman and Hall: New York, NY, USA, 2015; pp. 625–656. [Google Scholar]
- Miller, R.A.; Waitman, L.R.; Chen, S.; Rosenbloom, S.T. The anatomy of decision support during inpatient care provider order entry (CPOE): Empirical observations from a decade of CPOE experience at Vanderbilt. J. Biomed. Inform. 2005, 38, 469–485. [Google Scholar] [CrossRef] [PubMed] [Green Version]
- Jaspers, M.W.; Smeulers, M.; Vermeulen, H.; Peute, L.W. Effects of clinical decision-support systems on practioner performance and patient outcomes: A synthesis of high-quality systemic review findings. J. Am. Med. Inform. Assoc. 2011, 18, 327–334. [Google Scholar] [CrossRef] [PubMed] [Green Version]
- Garg, A.X.; Adhikari, N.K.J.; McDonald, H.; Rosas-Arellano, M.P.; Devereaux, P.J.; Beyene, J.; Sam, J.; Haynes, R.B. Effects of computerized clinical decision support systems on practitioner performance and patient outcomes. JAMA 2005, 293, 1223–1238. [Google Scholar] [CrossRef]
- Jenders, R.A. Advances in clinical decision support: Highlights of practice and the literature 2015–2016. Yearb. Med. Inform. 2017, 26, 125–132. [Google Scholar] [CrossRef]
- Sim, I.; Gorman, P.; Greenes, R.A.; Haynes, R.B.; Kaplan, B.; Lehmann, H.P.; Tang, P.C. Clinical decision support systems for the practice of evidence-based medicine. J. Am. Med. Inform. Assoc. 2001, 8, 527–534. [Google Scholar] [CrossRef] [Green Version]
- Ash, J.S.; Sittig, D.F.; Campbell, E.M.; Guappone, K.P.; Dykstra, R.H. Some unintended consequences of clinical decision support systems. AMIA Annu. Symp. Proc. 2007, 2007, 26–30. [Google Scholar]
- O’Brien, C.; Goldstein, B.; Shen, Y.; Phelan, M.; Lambert, C.; Bedoya, A.D.; Steorts, R.C. Development, implementation, and evaluation of an in-hospital optimized early warning score for patient deterioration. MDM Policy Pract. 2020, 5. [Google Scholar] [CrossRef] [Green Version]
- Kia, A.; Timsina, P.; Joshi, H.N.; Klang, E.; Gupta, R.R.; Freeman, R.; Reich, D.L.; Tomlinson, M.S.; Dudley, J.T.; Kohli-Seth, R.; et al. MEWS++: Enhancing the prediction of clinical deterioration in admitted patients through a machine learning model. J. Clin. Med. 2020, 9, 343. [Google Scholar] [CrossRef] [Green Version]
- Churpek, M.M.; Yuen, T.C.; Winslow, C.; Meltzer, D.O.; Kattan, M.W.; Edelson, D.P. Multicenter comparison of machine learning methods and conventional regression for predicting clinical deterioration on the wards. Crit. Care Med. 2016, 44, 368–374. [Google Scholar] [CrossRef] [PubMed] [Green Version]
- Morgan, D.J.; Bame, B.; Zimand, P.; Dooley, P.; Thom, K.A.; Harris, A.D.; Bentzen, S.; Ettinger, W.; Garrett-Ray, S.D.; Tracy, J.K.; et al. Assessment of machine learning vs standard prediction rules for predicting hospital readmissions. JAMA Netw. Open 2019, 2, e190348. [Google Scholar] [CrossRef] [PubMed] [Green Version]
- Ashfaq, A.; Sant’Anna, A.; Lingman, M.; Nowaczyk, S. Readmission prediction using deep learning on electronic health records. J. Biomed. Inform. 2019, 97, 103256. [Google Scholar] [CrossRef] [PubMed]
- Avati, A.; Jung, K.; Harman, S.; Downing, L.; Ng, A.; Shah, N. Improving palliative care with deep learning. IEEE Int. Conf. Bioinform. Biomed. 2017, 311–316. [Google Scholar] [CrossRef] [Green Version]
- Kelly, C.; Karthikesalingam, A.; Suleyman, M.; Corrado, G.; King, D. Key challenges for delivering clinical impact with artificial intelligence. BMC Med. 2019, 17, 195. [Google Scholar] [CrossRef] [Green Version]
- Magrabi, F.; Ammenwerth, E.; McNair, J.B.; De Keizer, N.F.; Hyppönen, H.; Nykänen, P.; Rigby, M.; Scott, P.; Vehko, T.; Wong, Z.S.-Y.; et al. Artificial intelligence in clinical decision support: Challenges for evaluating AI and practical implications. Yearb. Med. Inform. 2019, 28, 128–134. [Google Scholar] [CrossRef] [Green Version]
- Stevens, J.A.; Corso, P.S.; Finkelstein, E.A.; Miller, T.R. The costs of fatal and non-fatal falls among older adults. Inj. Prev. 2006, 12, 290–295. [Google Scholar] [CrossRef] [Green Version]
- Padula, W.V.; Delarmente, B.A. The national cost of hospital-acquired pressure injuries in the United States. Int. Wound J. 2019, 16, 634–640. [Google Scholar] [CrossRef]
- Padula, W.V.; Pronovost, P.J.; Makic, M.B.F.; Wald, H.L.; Moran, D.; Mishra, M.K.; Meltzer, D.O. Value of hospital resources for effective pressure injury prevention: A cost-effectiveness analysis. BMJ Qual. Saf. 2018, 28, 132–141. [Google Scholar] [CrossRef]
- Wong, C.A.; Recktenwald, A.J.; Jones, M.L.; Waterman, B.M.; Bollini, M.L.; Dunagan, W.C. The cost of serious fall-related injuries at three Midwestern hospitals. Jt. Comm. J. Qual. Patient Saf. 2011, 37, 81–87. [Google Scholar] [CrossRef]
- Bergstrom, N.; Braden, B.J.; Laguzza, A.; Holman, V. The Braden scale for predicting pressure score risk. Nurs. Res. 1987, 36, 205–210. [Google Scholar] [CrossRef] [PubMed]
- Lima-Serrano, M.; González-Méndez, M.; Martín-Castaño, C.; Alonso-Araujo, I.; Lima-Rodríguez, J. Validez predictiva y fiabilidad de la escala de Braden para valoración del riesgo de úlceras por presión en una unidad de cuidados intensivos. Med. Intensiva 2018, 42, 82–91. [Google Scholar] [CrossRef] [PubMed]
- Roca-Biosca, A.; Rubio-Rico, L.; Fernández, M.D.M.; Grau, N.G.; Garijo, G.T.; Fernández, F.G. Predictive validity of the Braden scale for assessing risk of developing pressure ulcers and dependence-related lesions. J. Wound Care 2017, 26, 528–536. [Google Scholar] [CrossRef]
- RLDatix. Available online: https://rldatix.com/ (accessed on 25 June 2020).
- Just, B.H.; Marc, D.; Munns, M.; Sandefer, R. Why patient matching is a challenge: Research on master patient index (MPI) data discrepancies in key identifying fields. Perspect. Health Inf. Manag. 2016, 13, 1e. [Google Scholar] [PubMed]
- Hillestad, R.; Bigelow, J.H.; Chaudhry, B.; Dreyer, P.; Greenberg, M.D.; Meili, R.C.; Ridgely, M.S.; Rothenberg, J.; Taylor, R. Identity Crisis: An Examination of the Costs and Benefits of a Unique Patient Identifier for the U.S. Healthcare System; RAND Corp: Santan Monica, CA, USA, 2008. [Google Scholar]
- Heflin, E.; Thornton, S.; Smith, R. An Approach to Understanding and Resolving Inter-Organizational Patient Matching; Slide 7; Care Connectivity Consortium: Orlando, FL, USA, 2014. [Google Scholar]
- Dexheimer, J.W.; Beal, S.J.; Divekar, P.; Hall, E.S.; Patel, V.; Greiner, M.V. Automated patient linking for electronic health record and child welfare databases. J. Technol. Hum. Serv. 2019, 37, 286–292. [Google Scholar] [CrossRef] [PubMed]
- Duggal, R.; Khatri, S.K.; Shukla, B. Improving patient matching: Single patient view for clinical decision support using big data analytics. In Proceedings of the 2015 4th International Conference on Reliability, Infocom Technologies and Optimization (ICRITO), Noida, India, 2–4 September 2015; pp. 1–6. [Google Scholar]


| Low Risk (Standard) | High Risk (Standard) | |
|---|---|---|
| Low Risk (CDS) | No action | Standard of care |
| High Risk (CDS) | CDS recommendations | Standard of care & CDS recommendations |
| Hospital | Falls | Pressure Injuries |
|---|---|---|
| Duke Raleigh | 1.8 | 0.1 |
| Duke Regional | 2.1 | 0.2 |
| Duke University | 2.1 | 0.9 |
| Overall | 2.0 | 0.4 |
| With Falls (n = 209) | Without Falls (n = 21,391) | |||
|---|---|---|---|---|
| Standard Low | Standard High | Standard Low | Standard High | |
| CDS Tool Low | 6 (2.9%) | 44 (21.1%) | 3133 (14.6%) | 6547 (30.6%) |
| CDS Tool High | 20 (9.6%) | 139 (66.5%) | 2318 (10.8%) | 9393 (43.9%) |
| Kappa | 0.01 | 0.13 | ||
| With Pressure Injuries (n = 112) | Without Pressure Injuries (n = 36,983) | |||
| Standard Low | Standard High | Standard Low | Standard High | |
| CDS Tool Low | 4 (3.6%) | 7 (6.2%) | 24,284 (65.7%) | 5916 (16%) |
| CDS Tool High | 12 (10.7%) | 89 (79.5%) | 2099 (5.7%) | 4684 (12.7%) |
| Kappa | 0.20 | 0.41 | ||
| Event Type | Standard | CDS Tool | |
|---|---|---|---|
| Falls | Sensitivity | 183/209 (87.6%) | 159/209 (76.1%) |
| False predicted rate | 15,940/21,391 (74.5%) | 11,711/21,391 (54.7%) | |
| Positive predictive value | 183/16,123 (1.1%) | 159/11,870 (1.3%) | |
| False missed rate | 26/5477 (0.5%) | 50/9730 (0.5%) | |
| Pressure Injuries | Sensitivity | 96/112 (85.7%) | 101/112 (90.2%) |
| False predicted rate | 10,600/36,983 (28.7%) | 6783/36,983 (18.3%) | |
| Positive predictive value | 96/10,696 (0.9%) | 101/6884 (1.5%) | |
| False missed rate | 16/26,399 (0.1%) | 11/30,211 (<0.1%) |
© 2020 by the authors. Licensee MDPI, Basel, Switzerland. This article is an open access article distributed under the terms and conditions of the Creative Commons Attribution (CC BY) license (http://creativecommons.org/licenses/by/4.0/).
Share and Cite
Woo, M.; Alhanti, B.; Lusk, S.; Dunston, F.; Blackwelder, S.; Lytle, K.S.; Goldstein, B.A.; Bedoya, A. Evaluation of ML-Based Clinical Decision Support Tool to Replace an Existing Tool in an Academic Health System: Lessons Learned. J. Pers. Med. 2020, 10, 104. https://doi.org/10.3390/jpm10030104
Woo M, Alhanti B, Lusk S, Dunston F, Blackwelder S, Lytle KS, Goldstein BA, Bedoya A. Evaluation of ML-Based Clinical Decision Support Tool to Replace an Existing Tool in an Academic Health System: Lessons Learned. Journal of Personalized Medicine. 2020; 10(3):104. https://doi.org/10.3390/jpm10030104
Chicago/Turabian StyleWoo, Myung, Brooke Alhanti, Sam Lusk, Felicia Dunston, Stephen Blackwelder, Kay S. Lytle, Benjamin A. Goldstein, and Armando Bedoya. 2020. "Evaluation of ML-Based Clinical Decision Support Tool to Replace an Existing Tool in an Academic Health System: Lessons Learned" Journal of Personalized Medicine 10, no. 3: 104. https://doi.org/10.3390/jpm10030104