
Tear Cytokine Levels in Sicca Syndrome-Related Dry Eye: A Meta-Analysis


Abstract
:1. Introduction
2. Methods
2.1. Inclusion and Exclusion Criteria
2.2. Search Strategy
2.3. Study Selection
2.4. Data Extraction
2.5. Risk of Bias and Quality Assessment
2.6. Data Analysis
3. Results
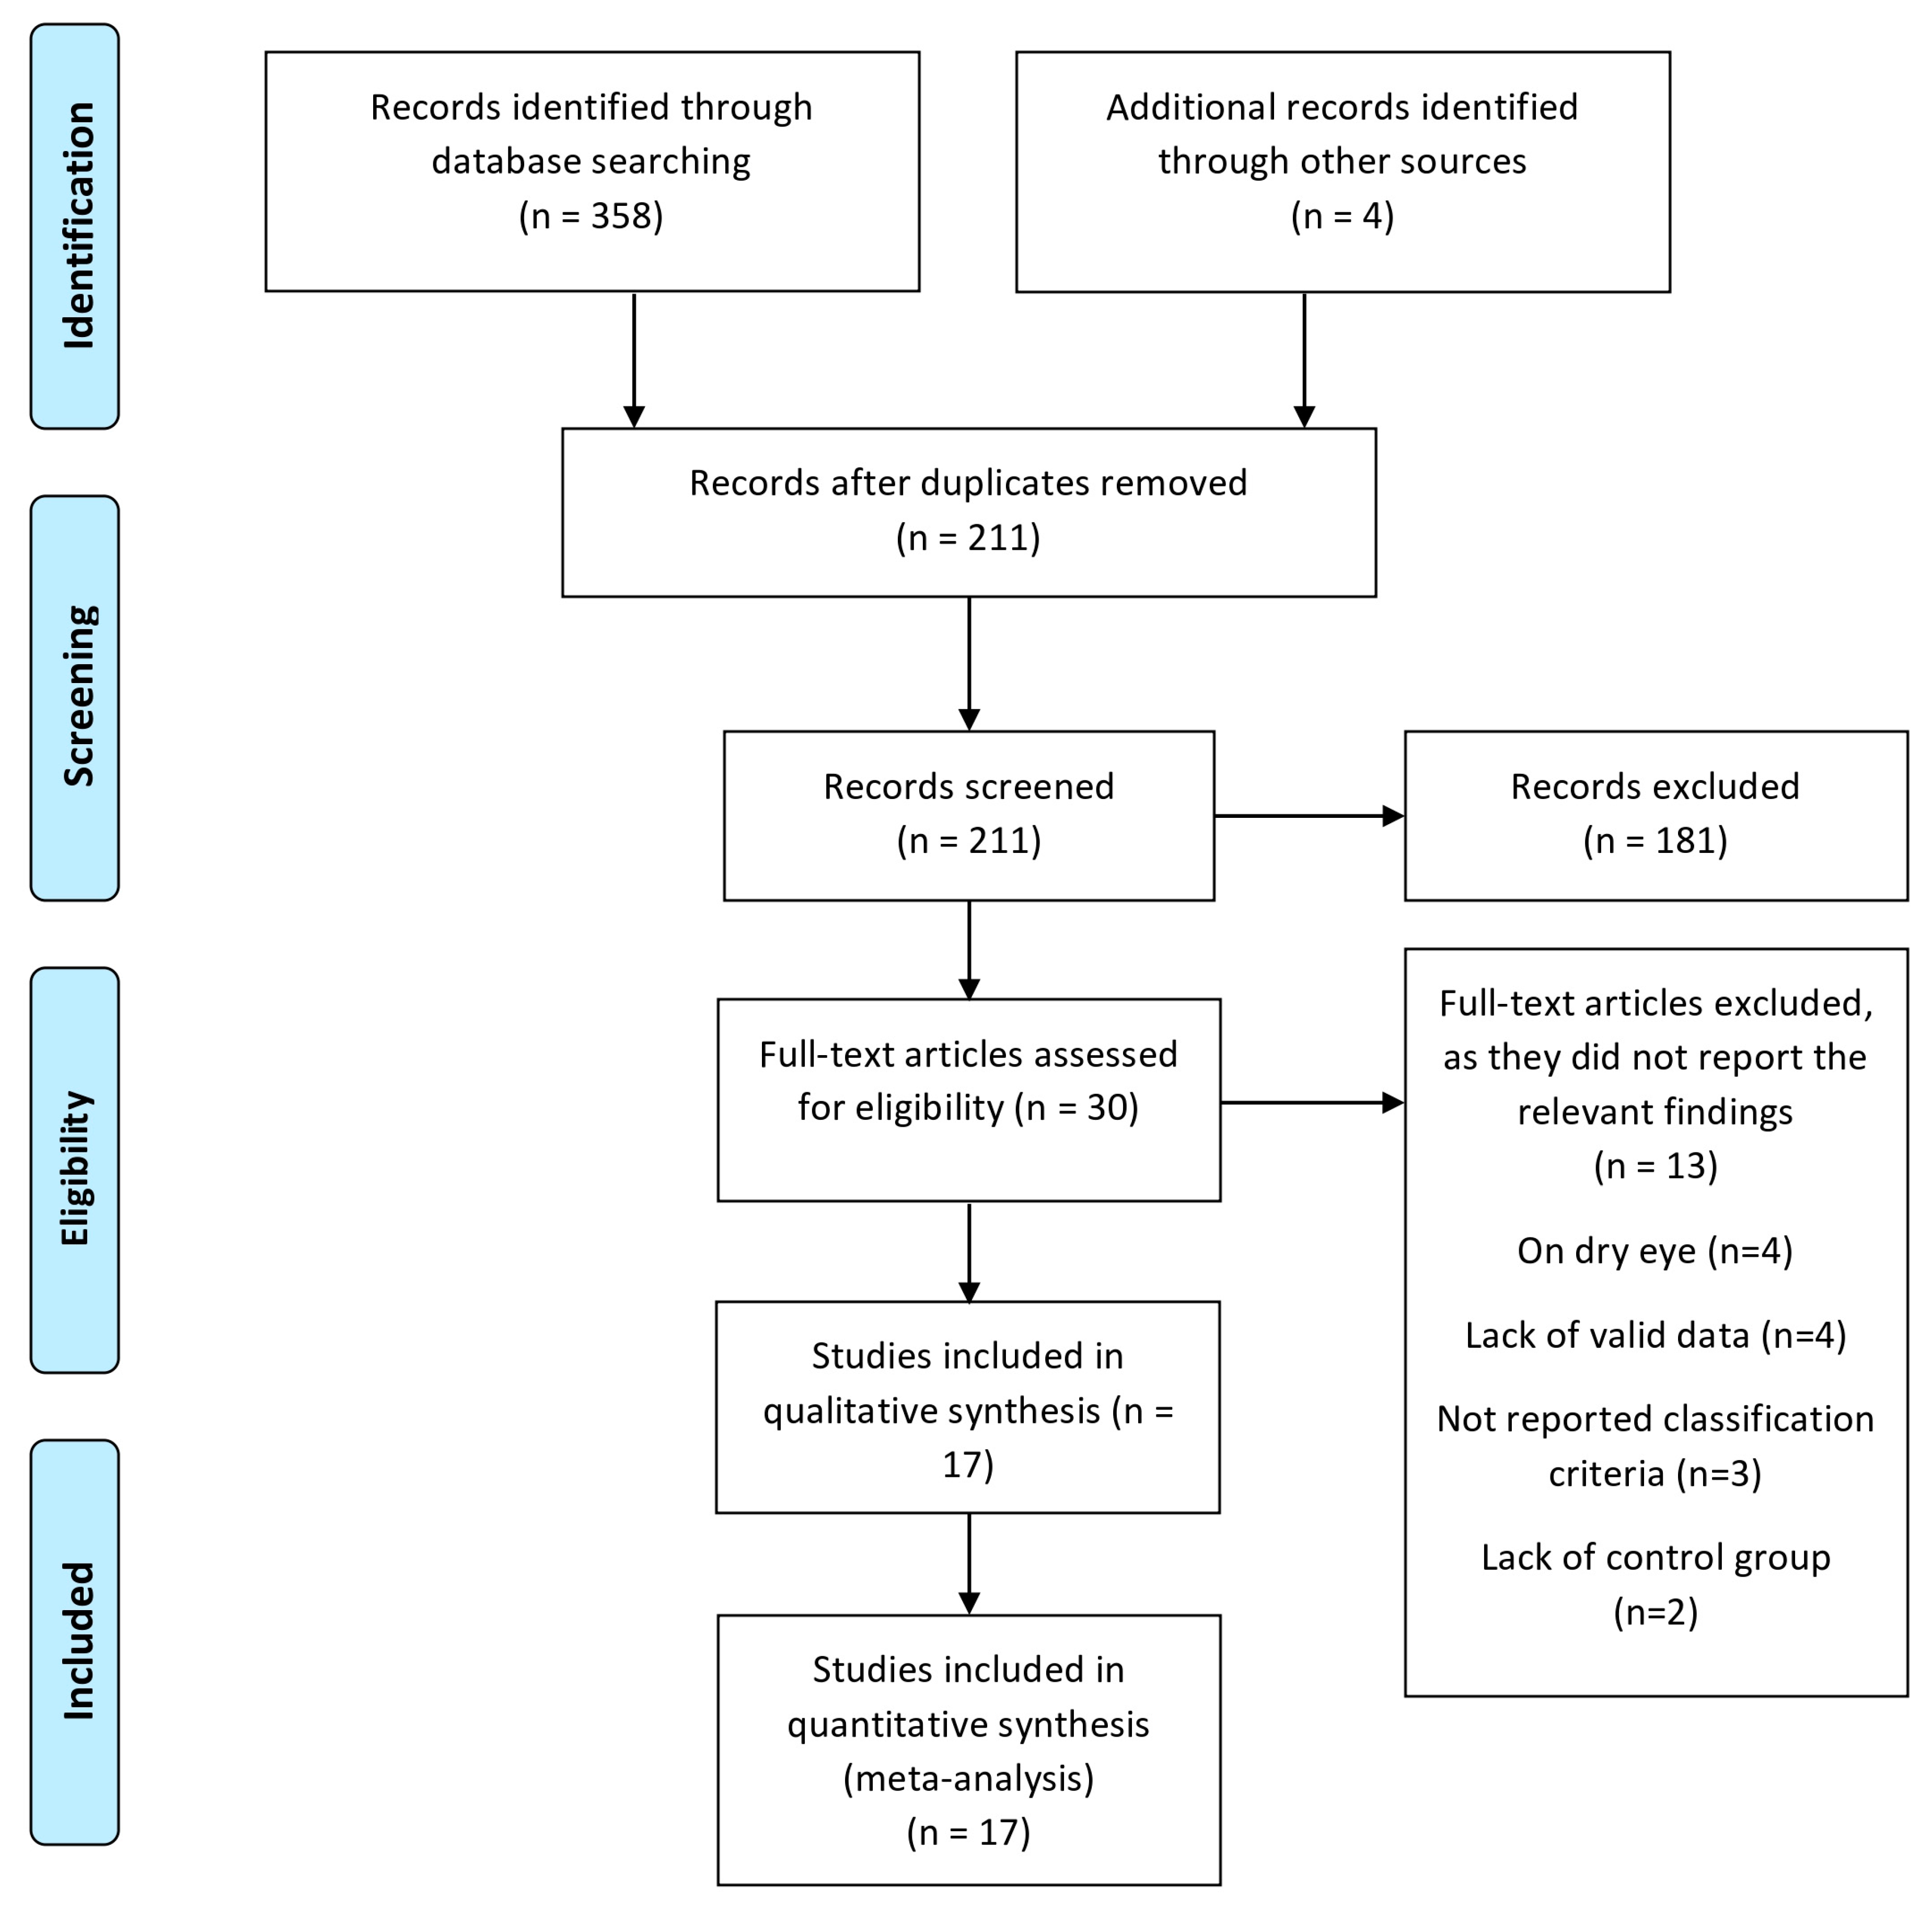
3.1. Search and Selection Process
3.2. Characteristics of Included Studies
3.3. Quality Assessments and Risk of Bias
3.4. Meta-Analysis
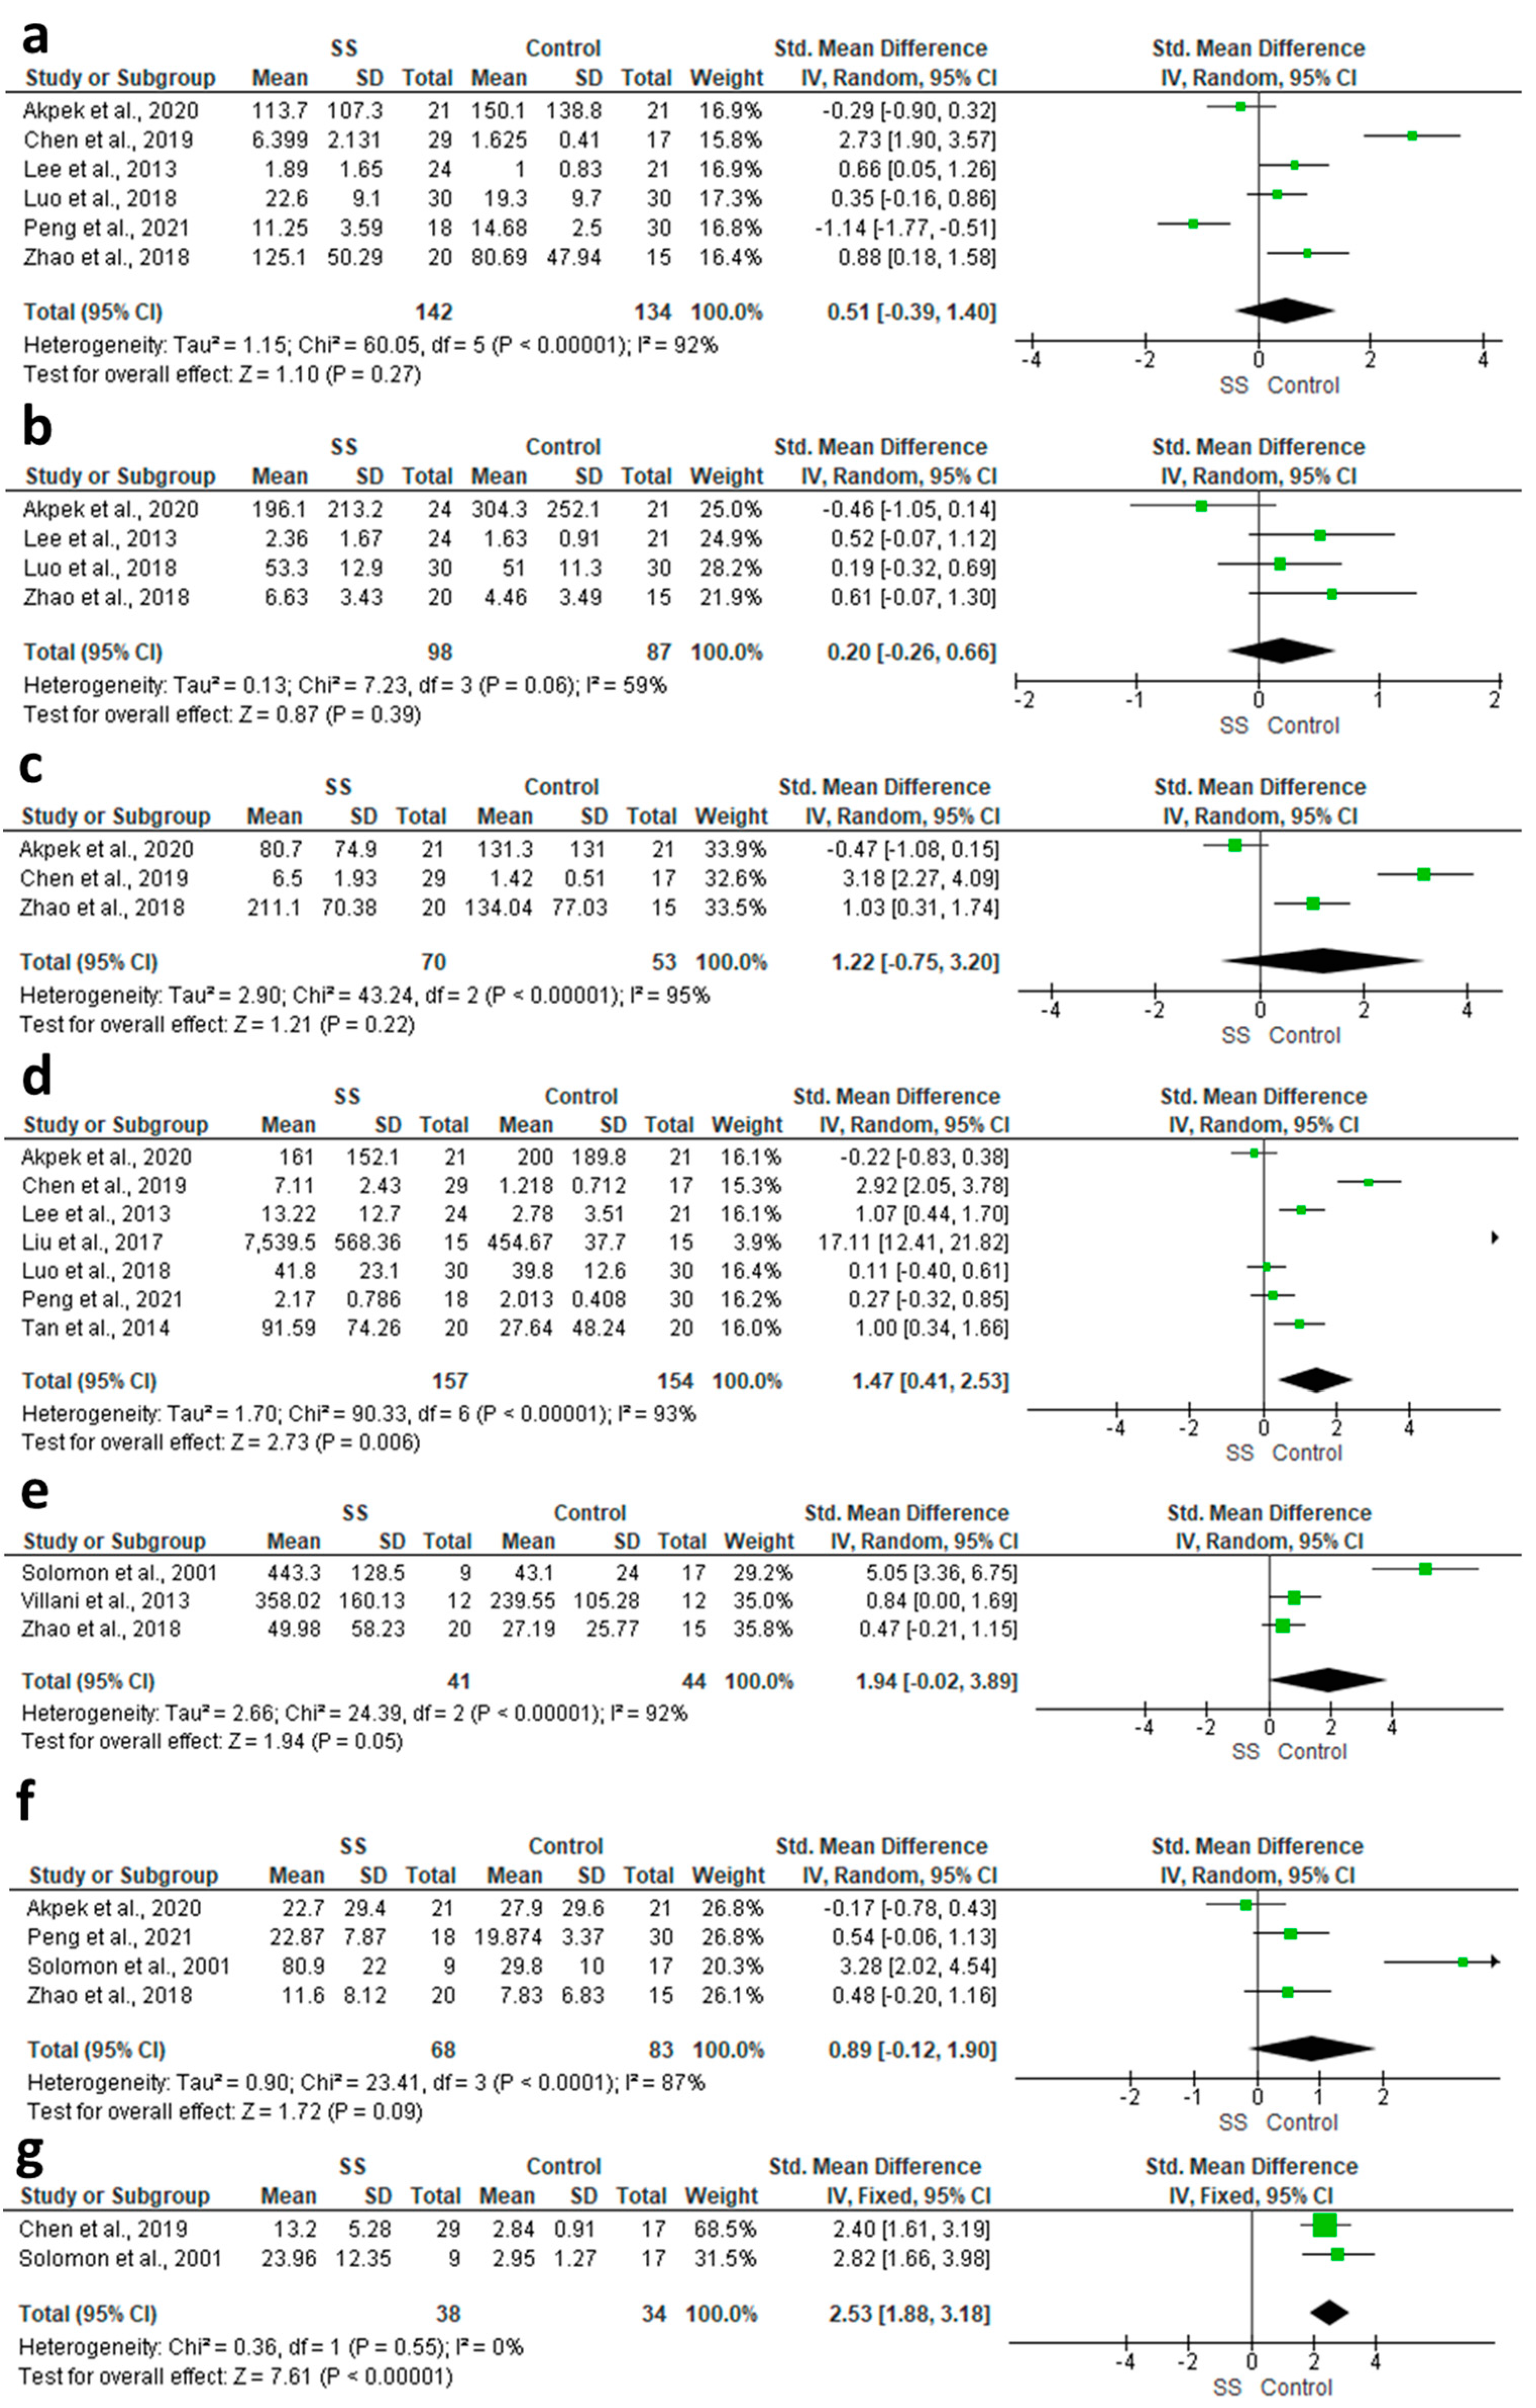
3.4.1. IFN-γ
3.4.2. IL-10
3.4.3. IL-12P70
3.4.4. IL-17
3.4.5. IL-1α
3.4.6. IL-1β
3.4.7. IL-1 Ra
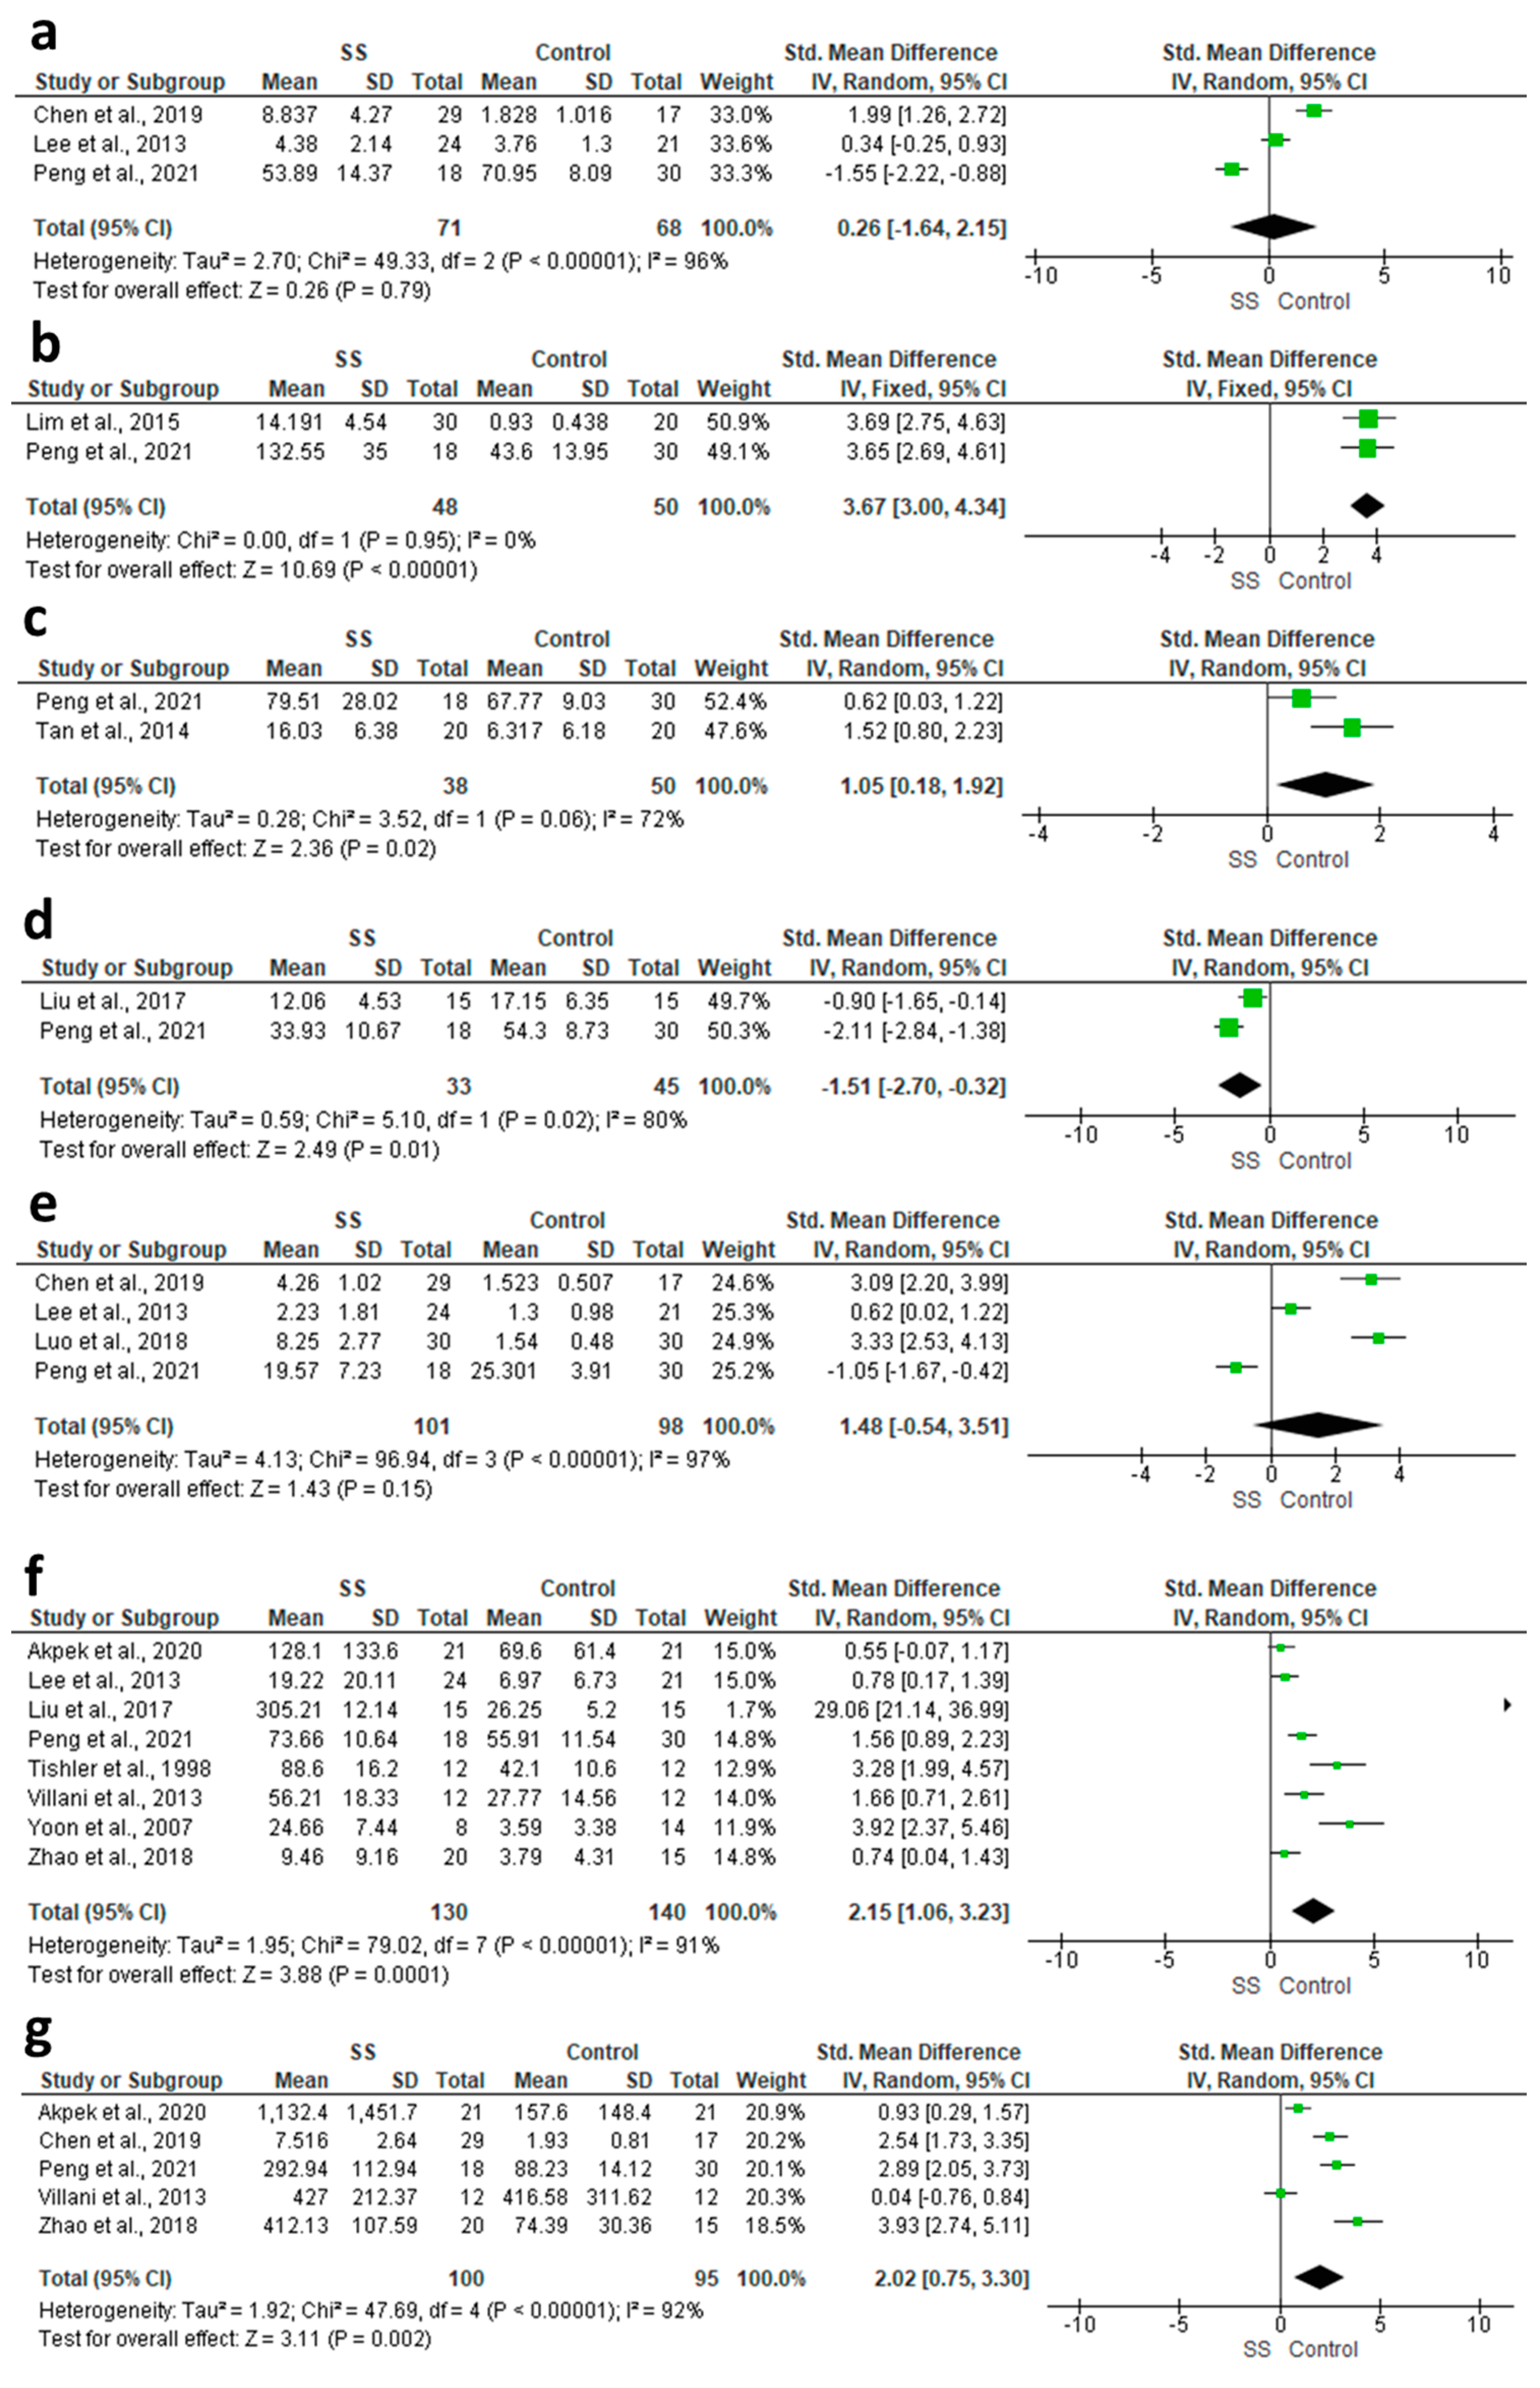
3.4.8. IL-2
3.4.9. IL-21
3.4.10. IL-22
3.4.11. IL-23
3.4.12. IL-4
3.4.13. IL-6
3.4.14. IL-8
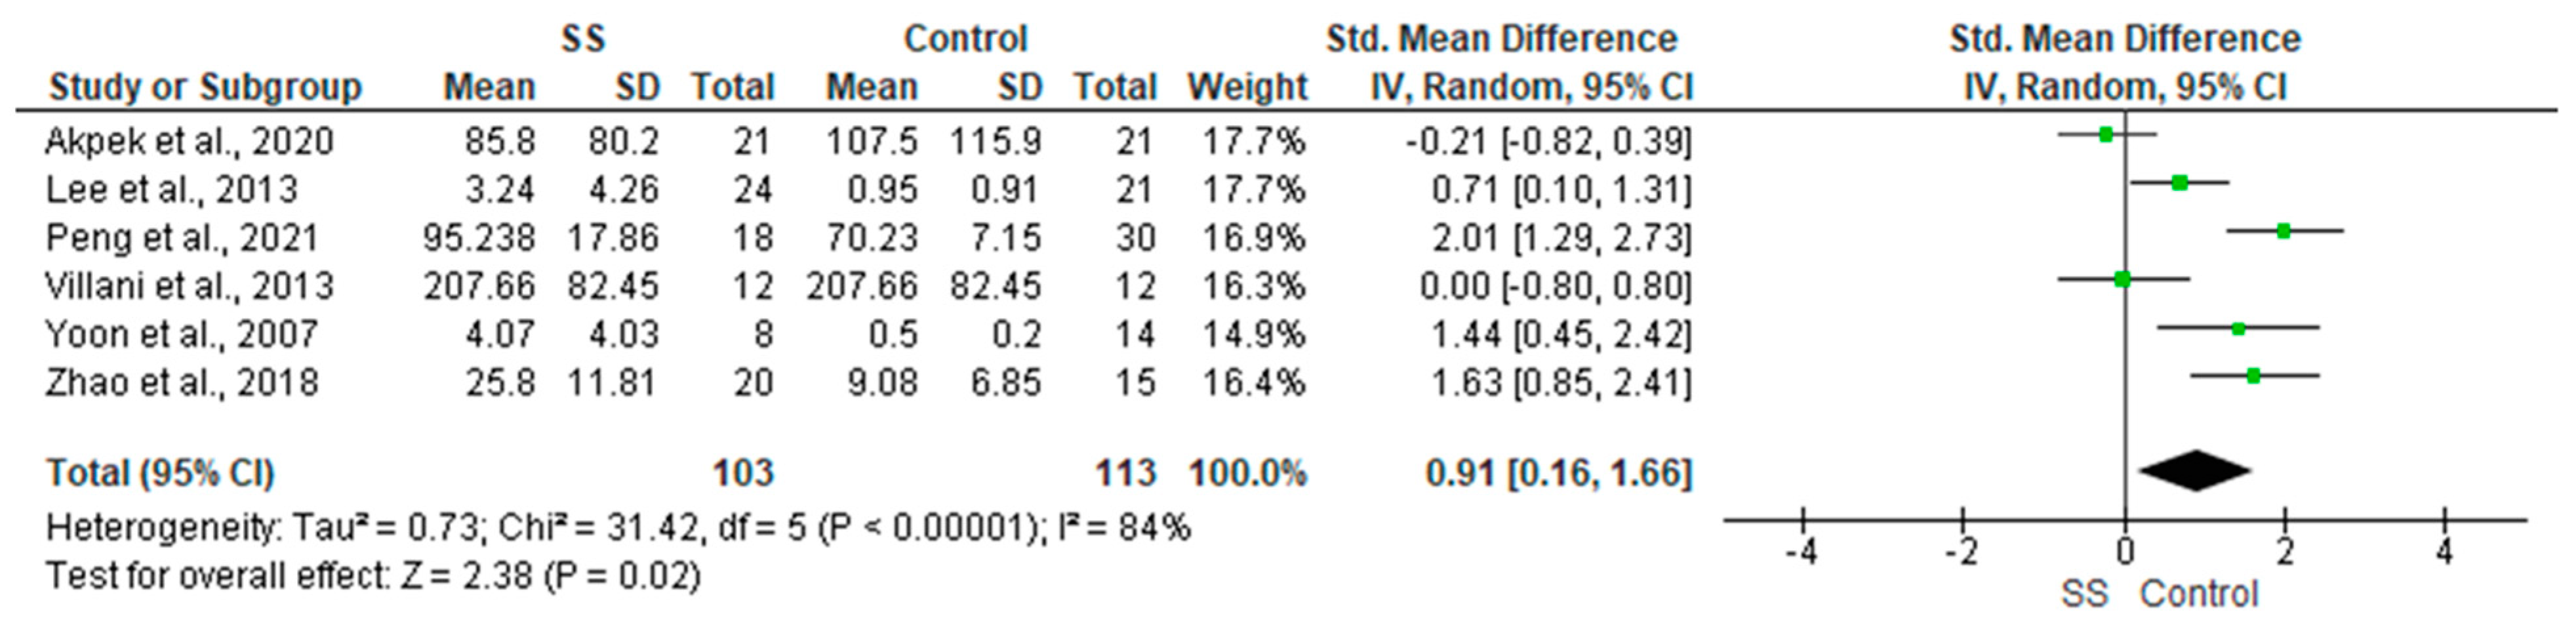
3.4.15. TNF-α
3.5. Results of Individual Studies
4. Discussion
5. Conclusions
Author Contributions
Funding
Institutional Review Board Statement
Informed Consent Statement
Data Availability Statement
Acknowledgments
Conflicts of Interest
References
- Fox, R.I. Clinical features, pathogenesis, and treatment of Sjogren’s syndrome. Curr. Opin. Rheumatol. 1996, 8, 438–445. [Google Scholar] [CrossRef] [PubMed]
- Contreras-Ruiz, L.; Ghosh-Mitra, A.; Shatos, M.A.; Dartt, D.A.; Masli, S. Modulation of conjunctival goblet cell function by inflammatory cytokines. Mediat. Inflamm. 2013, 2013, 636812. [Google Scholar] [CrossRef] [PubMed] [Green Version]
- Zhan, X.; Li, J.; Guo, Y.; Golubnitschaja, O. Mass spectrometry analysis of human tear fluid biomarkers specific for ocular and systemic diseases in the context of 3P medicine. EPMA J. 2021, 12, 449–475. [Google Scholar] [CrossRef] [PubMed]
- Enriquez-de-Salamanca, A.; Castellanos, E.; Stern, M.E.; Fernandez, I.; Carreno, E.; Garcia-Vazquez, C.; Herreras, J.M.; Calonge, M. Tear cytokine and chemokine analysis and clinical correlations in evaporative-type dry eye disease. Mol. Vis. 2010, 16, 862–873. [Google Scholar]
- Page, M.J.; McKenzie, J.E.; Bossuyt, P.M.; Boutron, I.; Hoffmann, T.C.; Mulrow, C.D.; Shamseer, L.; Tetzlaff, J.M.; Akl, E.A.; Brennan, S.E.; et al. The PRISMA 2020 statement: An updated guideline for reporting systematic reviews. BMJ 2021, 372, n71. [Google Scholar] [CrossRef]
- Vitali, C.; Bombardieri, S.; Jonsson, R.; Moutsopoulos, H.M.; Alexander, E.L.; Carsons, S.E.; Daniels, T.E.; Fox, P.C.; Fox, R.I.; Kassan, S.S.; et al. Classification criteria for Sjögren’s syndrome: A revised version of the European criteria proposed by the American-European Consensus Group. Ann. Rheum. Dis. 2002, 61, 554–558. [Google Scholar] [CrossRef] [Green Version]
- Shiboski, C.H.; Shiboski, S.C.; Seror, R.; Criswell, L.A.; Labetoulle, M.; Lietman, T.M.; Rasmussen, A.; Scofield, H.; Vitali, C.; Bowman, S.J.; et al. 2016 American College of Rheumatology/European League Against Rheumatism classification criteria for primary Sjögren’s syndrome: A consensus and data-driven methodology involving three international patient cohorts. Ann. Rheum. Dis. 2017, 76, 9–16. [Google Scholar] [CrossRef]
- Wells, G.; Shea, B.; O’Connell, D.; Robertson, J.; Peterson, J.; Welch, V.; Losos, M.; Tugwell, P. The Newcastle-Ottawa Scale (NOS) for Assessing the Quality of Nonrandomised Studies in Meta-Analyses; University of Liverpool: Liverpool, UK, 2011. [Google Scholar]
- Shiboski, S.C.; Shiboski, C.H.; Criswell, L.A.; Baer, A.N.; Challacombe, S.; Lanfranchi, H.; Schiødt, M.; Umehara, H.; Vivino, F.; Zhao, Y.; et al. American College of Rheumatology classification criteria for Sjögren’s syndrome: A data-driven, expert consensus approach in the Sjögren’s International Collaborative Clinical Alliance cohort. Arthritis Care Res. 2012, 64, 475–487. [Google Scholar] [CrossRef]
- Lemp, M.A. Report of the National Eye Institute/Industry workshop on Clinical Trials in Dry Eyes. CLAO J. 1995, 21, 221–232. [Google Scholar]
- Fox, R.I.; Robinson, C.A.; Curd, J.G.; Kozin, F.; Dds, F.V.H. Sjögren’s syndrome. Proposed criteria for classification. Arthritis Rheum. 1986, 29, 577–585. [Google Scholar] [CrossRef]
- Tishler, M.; Yaron, I.; Geyer, O.; Shirazi, I.; Naftaliev, E.; Yaron, M. Elevated tear interleukin-6 levels in patients with Sjögren syndrome. Ophthalmology 1998, 105, 2327–2329. [Google Scholar] [CrossRef] [PubMed]
- Vitali, C.; Bombardieri, S.; Moutsopoulos, H.M.; Balestrieri, G.; Bencivelli, W.; Bernstein, R.M.; Bjerrum, K.B.; Braga, S.; Coll, J.; De Vita, S.; et al. Preliminary criteria for the classification of Sjögren’s syndrome. Results of a prospective concerted action supported by the European community. Arthritis Rheum. 1993, 36, 340–347. [Google Scholar] [CrossRef] [PubMed]
- Solomon, A.; Dursun, D.; Liu, Z.; Xie, Y.; Macri, A.; Pflugfelder, S.C. Pro- and anti-inflammatory forms of interleukin-1 in the tear fluid and conjunctiva of patients with dry-eye disease. Investig. Ophthalmol. Vis. Sci. 2001, 42, 2283–2292. [Google Scholar]
- Yoon, K.-C.; Jeong, I.-Y.; Park, Y.-G.; Yang, S.-Y. Interleukin-6 and Tumor Necrosis Factor-α Levels in Tears of Patients with Dry Eye Syndrome. Cornea 2007, 26, 431–437. [Google Scholar] [CrossRef]
- Yoon, K.C.; Park, C.S.; You, I.C.; Choi, H.J.; Lee, K.H.; Im, S.K.; Park, H.Y.; Pflugfelder, S.C. Expression of CXCL9, -10, -11, and CXCR3 in the tear film and ocular surface of patients with dry eye syndrome. Investig. Ophthalmol. Vis. Sci. 2010, 51, 643–650. [Google Scholar] [CrossRef]
- Chung, J.K.; Kim, M.K.; Wee, W.R. Prognostic factors for the clinical severity of keratoconjunctivitis sicca in patients with Sjogren’s syndrome. Br. J. Ophthalmol. 2012, 96, 240–245. [Google Scholar] [CrossRef]
- Villani, E.; Galimberti, D.; Del Papa, N.; Nucci, P.; Ratiglia, R. Inflammation in dry eye associated with rheumatoid arthritis: Cytokine and in vivo confocal microscopy study. J. Endotoxin Res. 2013, 19, 420–427. [Google Scholar] [CrossRef]
- Lee, S.Y.; Han, S.J.; Nam, S.M.; Yoon, S.; Ahn, J.M.; Kim, T.-I.; Kim, E.K.; Seo, K.Y. Analysis of Tear Cytokines and Clinical Correlations in Sjögren Syndrome Dry Eye Patients and Non–Sjögren Syndrome Dry Eye Patients. Am. J. Ophthalmol. 2013, 156, 247–253.e1. [Google Scholar] [CrossRef]
- Tan, X.; Sun, S.; Liu, Y.; Zhu, T.; Wang, K.; Ren, T.; Wu, Z.; Xu, H.; Zhu, L. Analysis of Th17-associated cytokines in tears of patients with dry eye syndrome. Eye 2014, 28, 608–613. [Google Scholar] [CrossRef]
- Lim, S.A.; Nam, D.H.; Lee, J.H.; Kwok, S.-K.; Park, S.-H.; Chung, S.-H. Association of IL-21 Cytokine with Severity of Primary Sjögren Syndrome Dry Eye. Cornea 2015, 34, 248–252. [Google Scholar] [CrossRef]
- Liu, R.; Gao, C.; Chen, H.; Li, Y.; Jin, Y.; Qi, H. Analysis of Th17-associated cytokines and clinical correlations in patients with dry eye disease. PLoS ONE 2017, 12, e0173301. [Google Scholar] [CrossRef] [PubMed] [Green Version]
- Hernández-Ruiz, M.; Zlotnik, A.; Llorente, L.; Hernandez-Molina, G. Markedly high salivary and lacrimal CXCL17 levels in primary Sjögren’s syndrome. Jt. Bone Spine 2018, 85, 379–380. [Google Scholar] [CrossRef] [PubMed]
- Luo, G.; Xin, Y.; Qin, D.; Yan, A.; Zhou, Z.; Liu, Z. Correlation of interleukin-33 with Th cytokines and clinical severity of dry eye disease. Indian J. Ophthalmol. 2018, 66, 39–43. [Google Scholar] [CrossRef] [PubMed]
- Zhao, H.; Li, Q.; Ye, M.; Yu, J. Tear luminex analysis in dry eye patients. Med. Sci. Monit. 2018, 24, 7595–7602. [Google Scholar] [CrossRef]
- Chen, X.; Aqrawi, L.A.; Utheim, T.P.; Tashbayev, B.; Utheim, Ø.A.; Reppe, S.; Hove, L.H.; Herlofson, B.B.; Singh, P.B.; Palm, Ø.; et al. Elevated cytokine levels in tears and saliva of patients with primary Sjögren’s syndrome correlate with clinical ocular and oral manifestations. Sci. Rep. 2019, 9, 7319. [Google Scholar] [CrossRef] [Green Version]
- Akpek, E.K.; Wu, H.Y.; Karakus, S.; Zhang, Q.; Masli, S. Differential Diagnosis of Sjögren Versus Non-Sjögren Dry Eye Through Tear Film Biomarkers. Cornea 2020, 39, 991–997. [Google Scholar] [CrossRef]
- Peng, X.; Lu, Y.; Wei, J.; Lin, T.; Lu, Q.; Liu, Q.; Ting, W.J. A cohort study of T helper 17 cell-related cytokine levels in tear samples of systemic lupus erythematosus and Sjögren’s syndrome patients with dry eye disease. Clin. Exp. Rheumatol. 2021, 39, S159–S165. [Google Scholar] [CrossRef]
- Hernández-Molina, G.; Ruiz-Quintero, N.; Lima, G.; Hernández-Ramírez, D.; Llorente-Chávez, A.; Saavedra-González, V.; Jiménez-Soto, R.; Llorente, L. Chemokine tear levels in primary Sjögren’s syndrome and their relationship with symptoms. Int. Ophthalmol. 2022, 42, 2355–2361. [Google Scholar] [CrossRef]
- Roescher, N.; Tak, P.P.; Illei, G.G. Cytokines in Sjögren’s syndrome. Oral Dis. 2009, 15, 519–526. [Google Scholar] [CrossRef] [Green Version]
- Hori, Y. Secreted Mucins on the Ocular Surface. Investig. Ophthalmol. Vis. Sci. 2018, 59, Des151–Des156. [Google Scholar] [CrossRef] [Green Version]
- Stuchell, R.N.; Feldman, J.J.; Farris, R.L.; Mandel, I.D. The effect of collection technique on tear composition. Investig. Ophthalmol. Vis. Sci. 1984, 25, 374–377. [Google Scholar]
- Markoulli, M.; Gokhale, M.; You, J. Substance P in Flush Tears and Schirmer Strips of Healthy Participants. Optom. Vis. Sci. 2017, 94, 527–533. [Google Scholar] [CrossRef] [PubMed]
- Ooi, K.G.; Galatowicz, G.; Towler, H.M.; Lightman, S.L.; Calder, V.L. Multiplex cytokine detection versus ELISA for aqueous humor: IL-5, IL-10, and IFNgamma profiles in uveitis. Investig. Ophthalmol. Vis. Sci. 2006, 47, 272–277. [Google Scholar] [CrossRef] [PubMed]
- Benito, M.J.; Gonzalez-Garcia, M.J.; Teson, M.; Garcia, N.; Fernandez, I.; Calonge, M.; Enriquez-de-Salamanca, A. Intra- and inter-day variation of cytokines and chemokines in tears of healthy subjects. Exp. Eye Res. 2014, 120, 43–49. [Google Scholar] [CrossRef]
- Keustermans, G.C.E.; Hoeks, S.B.E.; Meerding, J.M.; Prakken, B.J.; de Jager, W. Cytokine assays: An assessment of the preparation and treatment of blood and tissue samples. Methods 2013, 61, 10–17. [Google Scholar] [CrossRef]


| Study ID | Study Design | Study Groups | Age | Female | Type of Sample | Classification Criteria | Sampling Method | Analytical Method | Assessed Biomarkers | Findings |
|---|---|---|---|---|---|---|---|---|---|---|
| Tishler et al., 1998 [12] | Case-control | SS (n = 12) | 55.3 ± 6.3 | 10 (83.33%) | Tears and serum | Vitali et al., 1993 [13] | Capillary Glass Micropipette | ELISA | IL-6 | IL-6 was elevated in tear samples of SS (p < 0.05); however, no significant change detected in serum |
| HCT (n = 12) | 60.1 ± 9.9 | 8 (66.67%) | ||||||||
| HCT (n = 10) | 26 ± 3.8 | 9 (90%) | ||||||||
| Solomon et al., 2001 [14] | Case-control | MGD (n = 13) | 55 ± 16.3 | 7 (53.85%) | Tears and Conjunctival Biopsy | Fox et al., 1986 [11] | Polyester wick | ELISA | IL-1α, IL-1Ra and IL-1β (Precursor and mature forms) | IL-1α and mature IL-1β were elevated in SS. Precursor IL-1β was decreased in SS. IL-1Ra showed no significant change. |
| SS (n = 9) | 68 ± 9.1 | 8 (88.89%) | ||||||||
| HCT (n = 17) | 37.76 ± 10.13 | 10 (58.82%) | ||||||||
| Yoon et al., 2007 [15] | Case-control | SS (n = 8) | 43.63 ± 13.61 | 7 (87.5%) | Tears, serum, Conjunctival Biopsy, and Conjunctival Impression | AECG [6] | Capillary glass tube | ELISA, IHC, Flow cytometry | IL-6 and TNF-α | IL-6 was higher in the SS group compared to the other groups. TNF-α levels were higher in the SS group compared to HCT but not DED. |
| DED (n = 10) | 42 ± 9.75 | 8 (80%) | ||||||||
| HCT (n = 14) | 40.43 ± 9.47 | 10 (71.42%) | ||||||||
| Yoon et al., 2010 [16] | Case-control | SS (n = 16) | 49.9 ± 14.6 | 14 (87.5%) | Tears and Conjunctival Biopsy | AECG [6] | Capillary glass tube or micropipette | ELISA, IHC, Flow cytometry | CXCL9, CXCL10 and CXCL11 | CXCL9, 10, and 11 were elevated in SS in comparison to HCT and DED. |
| DED (n = 17) | 47.3 ± 17.8 | 13 (76.47%) | ||||||||
| HCT (n = 15) | 43.0 ± 14.9 | 11 (73.33%) | ||||||||
| Chung et al., 2012 [17] | Case-control | Mi-KCS-pSS (n = 60) | 51.9 ± 11.7 | 59 (98.33%) | Tears | AECG [6] | Tear strips | ELISA | IL-17 | IL-17 in the MS-KCS group was elevated compared to Mi-KCS group for both total SS and sSS. |
| MS-KCS-pSS (n = 46) | 53.4 ± 11.8 | 46 (100%) | ||||||||
| Mi-KCS-sSS (n = 5) | 54.5 ± 13.5 | 5 (100%) | ||||||||
| MS-KCS-sSS (n = 10) | 46.8 ± 12.5 | 10 (100%) | ||||||||
| Villani et al., 2013 [18] | Case-control | RA SS (n = 12) | 51.4 ± 6.1 | 12 (100%) | Tears | ACR/EULAR [7] and AECG [6] | Polyurethane absorbent mini-sponge | ELISA | IL-1α, IL-6, IL-8, and TNF-α | No difference was detected between sSS/RA and RA groups. For sSS/RA group IL-1α and IL-6 were decreased after treatment (p < 0.01), while IL-8 and TNF-α did not show significant changes |
| RA non-SS (n = 12) | 48.8 ± 7.4 | 10 (83%) | ||||||||
| Lee et al., 2013 [19] | Case-control | SS (n = 24) | 55.9 ± 9.96 | 24 (100%) | Tears | AECG [6] | Capillary glass micropipette | Multiplex bead assay | IL-2, IL-4, IL-6, IL-10 IL-17, IFN-γ, and TNF-α | IL-17, IL-6, IL-4, and TNF-α were elevated in SS compared to DED and HCT. IL-2 was elevated in SS compared to DED. IL-10 was elevated in SS compared to HCT |
| DED (n = 25) | 55.4 ± 12.44 | 25 (100%) | ||||||||
| HCT (n = 21) | 52.8 ± 13.19 | 21 (100%) | ||||||||
| Tan et al., 2014 [20] | Case-control | Non-SS (n = 20) | 50.5 ± 4.6 | 15 (75%) | Tears | Lemp, 1995 [10] | Capillary glass micropipette | ELISA | IL-17 and IL-22 | IL-17 and IL-22 were elevated in the SS group compared to HCT and non-SS patients. |
| SS (n = 20) | 52.5 ± 8.1 | 11 (55%) | ||||||||
| HCT (n = 20) | 54.2 ± 7.3 | 6 (30%) | ||||||||
| Lim et al., 2015 [21] | Prospective study | SS (n = 30) | 57.3 ± 9.1 | 30 (100%) | Tears and Conjunctival Impression | AECG [6] | Capillary glass micropipette | Cytometric bead array and PCR | IL-21 | IL-21 levels were elevated in pSS compared to DED and HCT. |
| DED (n = 30) | 58.4 ± 10.1 | 30 (100%) | ||||||||
| HCT (n = 20) | 54.2 ± 12.4 | 20 (100%) | ||||||||
| Liu et al., 2017 [22] | Case-control | SS (n = 15) | 66.75± 9.38 | 15 (100%) | Tears and Conjunctival Impression | AECG [6] | Capillary glass micropipette | Multiplex bead assay and PCR | IL-17, IL-6, and IL-23 | IL-17 and IL-6 were elevated in the SS group compared to DED and HCT. IL-23 was elevated in the SS group compared to HCT. |
| DED (n = 15) | 64.00± 11.00 | 15 (100%) | ||||||||
| HCT (n = 15) | 64.37± 8.34 | 15 (100%) | ||||||||
| Hernández-Ruiz et al., 2018 [23] | Case-control | SS (n = 28) | 51.1 ± 11.09 | 27 (96.4%) | Tears and Saliva | AECG [6] | Tear strips | ELISA | CXCL17 | CXCL17 was elevated in the SS group. Saliva results showed similar levels |
| HCT (n = 28) | 28 (100%) | |||||||||
| Luo et al., 2018 [24] | Case-control | SS (n = 30) | 53.5 ± 9.2 | 30 (100%) | Tears and Serum | Lemp, 1995 [10] | Capillary glass tube | ELISA | IL-33, IL-4, IL-5, IFN-γ, IL-10, IL-17, and TGF-β | IL-4 and IL-5 were elevated in the SS group compared to HCT and non-SS. IL-33 was elevated in the SS group compared to non-SS. |
| Non-SS (n = 30) | 51.6 ± 8.3 | 30 (100%) | ||||||||
| HCT (n = 30) | 50.6 ± 6.7 | 30 (100%) | ||||||||
| Zhao et al., 2018 [25] | Prospective study | SS (n = 20) | NA | NA | Tears | ACR [9] | Capillary glass tube | Luminex assay and ELISA | TNF-α, IL-1α, IL-1β, IL-6, IL-8, IL-10, IL-12P70, IL-13, IFN-γ, EGF and MIP-1α | TNF-α, IL-6, IL-8, and IL-12P70 were elevated in all patient groups compared to HCT. IL-8 and TNF-α were also elevated in SS-ATD compared to the other diseased groups |
| Non-SS (n = 20) | ||||||||||
| MGD (n = 15) | ||||||||||
| HCT (n = 15) | ||||||||||
| Chen et al., 2019 [26] | Case-control | SS (n = 29) | 56.8 ± 13.0 | 29 (100%) | Tears and saliva | AECG [6] | Tear strips | Luminex assay | IL-1RA, IL-2, IL-4, IL-17A, IFN-γ, MIP-1b, L-8, IL-12p70, and IP-10 | IL-1RA, IL-2, IL-4, IL-17A, IFN-γ, and MIP-1b were elevated in the SS group compared to DED and HCT. L-8, IL-12p70, and IP-10 were elevated in the SS group compared to HCT. Salivary levels of IP-10 and MIP-1a were elevated in the SS group compared to DED and HCT |
| DED (n = 20) | 51.7 ± 10.6 | 20 (100%) | ||||||||
| HCT (n = 17) | 45.4 ± 10.9 | 17 (100%) | ||||||||
| Akpek et al., 2020 [27] | Prospective study | SS (n = 21) | 63.3 ± 10.1 | 16 (76.2%) | Tears | ACR [9] | Capillary glass tube | Luminex assay | TNF-α, IFN-γ, IL-1β, IL-6, IL-8, IL-10, IL-12p70, and IL-17A. | IL-8 was elevated in SS compared to HCT and DED. Among all groups IL-6, IL-12p70 and IL-8 were elevated. |
| DED (n = 20) | 62.6 ± 7.7 | 17 (85.0%) | ||||||||
| HCT (n = 21) | 60.2 ± 5.6 | 14 (66.7%) | ||||||||
| Peng et al., 2021 [28] | Case-control | DED (n = 13) | 35.2 ± 11.7 | 10 (76.9%) | Tears | SIT <10, TBUT <10, and anti-dsDNA or anti-Smith antibodies negative | Capillary glass tube | Luminex assay | IL-1β, IL-2, IL-4, IFN-γ, IL 6, IL-8, IL-17F, TNF-α, IL-21, IL-22, and IL-23 | TNF-α and IL-6 were elevated in SS compared to HCT. IL-8 and IL-21 were elevated in SS compared to HCT and DED. IL-23 was decreased in SS compared to HCT. IFN-γ, IL-2, and IL-4 were decreased in SS compared to HCT and DED. |
| SLE (n = 17) | 34.1 ± 9.3 | 16 (94.1%) | ||||||||
| SS (n = 18) | 41.6± 12.6 | 15 (83.3%) | ||||||||
| HCT (n = 30) | 33.7 ± 9.6 | 15 (50%) | ||||||||
| Hernández-Molina et al., 2022 [29] | Case-control | SS (n = 21) | NA | 19 (90.4%) | Tears | ACR/EULAR [7] | Tear strips | Luminex assay | CCL2, CXCL8, and CXCL10 | CXCL10 and CCL2 were decreased in the SS group, while CXCL8 was similar. |
| HCT (n = 21) | NA | 21 (100%) |
| Study ID | Selection | Comparability | Exposure | Total | |||||
|---|---|---|---|---|---|---|---|---|---|
| Is the Case Definition Adequate? | Representativeness of the Cases | Selection of Controls | Definition of Controls | Comparability of Cases and Controls on the Basis of the Design or Analysis | Ascertainment of Exposure | Same Method of Ascertainment for Cases and Controls | Non-Response Rate | ||
| Tishler et al., 1998 [12] | * | * | * | ** | * | * | * | 8 | |
| Solomon et al., 2001 [14] | * | * | * | * | * | * | * | * | 8 |
| Yoon et al., 2007 [15] | * | * | * | * | * | * | * | 7 | |
| Yoon et al., 2010 [16] | * | * | * | * | * | * | * | 7 | |
| Chung et al., 2012 [17] | * | * | * | * | ** | * | * | * | 9 |
| Villani et al., 2013 [18] | * | * | * | * | * | * | * | * | 8 |
| Lee et al., 2013 [19] | * | * | ** | * | * | * | 7 | ||
| Tan et al., 2014 [20] | * | * | * | * | * | * | * | * | 8 |
| Lim et al., 2015 [21] | * | * | ** | * | * | * | 7 | ||
| Liu et al., 2017 [22] | * | * | * | * | * | 5 | |||
| Hernández-Ruiz et al., 2018 [23] | * | * | * | * | * | * | * | * | 8 |
| Luo et al., 2018 [24] | * | * | ** | * | * | * | 7 | ||
| Zhao et al., 2018 [25] | * | * | * | ** | * | * | * | 8 | |
| Chen et al., 2019 [26] | * | * | * | * | ** | * | * | * | 9 |
| Akpek et al., 2020 [27] | * | * | * | * | * | * | * | * | 8 |
| Peng et al., 2021 [28] | * | * | * | * | * | * | * | * | 8 |
| Hernández-Molina et al., 2022 [29] | * | * | * | * | * | * | * | * | 8 |
Disclaimer/Publisher’s Note: The statements, opinions and data contained in all publications are solely those of the individual author(s) and contributor(s) and not of MDPI and/or the editor(s). MDPI and/or the editor(s) disclaim responsibility for any injury to people or property resulting from any ideas, methods, instructions or products referred to in the content. |
© 2023 by the authors. Licensee MDPI, Basel, Switzerland. This article is an open access article distributed under the terms and conditions of the Creative Commons Attribution (CC BY) license (https://creativecommons.org/licenses/by/4.0/).
Share and Cite
Aljohani, S.; Jazzar, A. Tear Cytokine Levels in Sicca Syndrome-Related Dry Eye: A Meta-Analysis. Diagnostics 2023, 13, 2184. https://doi.org/10.3390/diagnostics13132184
Aljohani S, Jazzar A. Tear Cytokine Levels in Sicca Syndrome-Related Dry Eye: A Meta-Analysis. Diagnostics. 2023; 13(13):2184. https://doi.org/10.3390/diagnostics13132184
Chicago/Turabian StyleAljohani, Suad, and Ahoud Jazzar. 2023. "Tear Cytokine Levels in Sicca Syndrome-Related Dry Eye: A Meta-Analysis" Diagnostics 13, no. 13: 2184. https://doi.org/10.3390/diagnostics13132184