
Brain Tumor Class Detection in Flair/T2 Modality MRI Slices Using Elephant-Herd Algorithm Optimized Features

 ,
,  , , and
Abstract
:1. Introduction
- Development of a unique procedure to examine FLAIR- and T2-modality MRI slice with/without the skull region;
- Integrated DL and ML features to achieve better BT-detection performance;
- EHA-based feature optimization to obtain better results without the overfitting issue;
- Verifying the performance of the proposed scheme using a clinical MRI dataset of the T2-modality.
2. Literature Review
3. Methodology
3.1. Disease-Detection Scheme
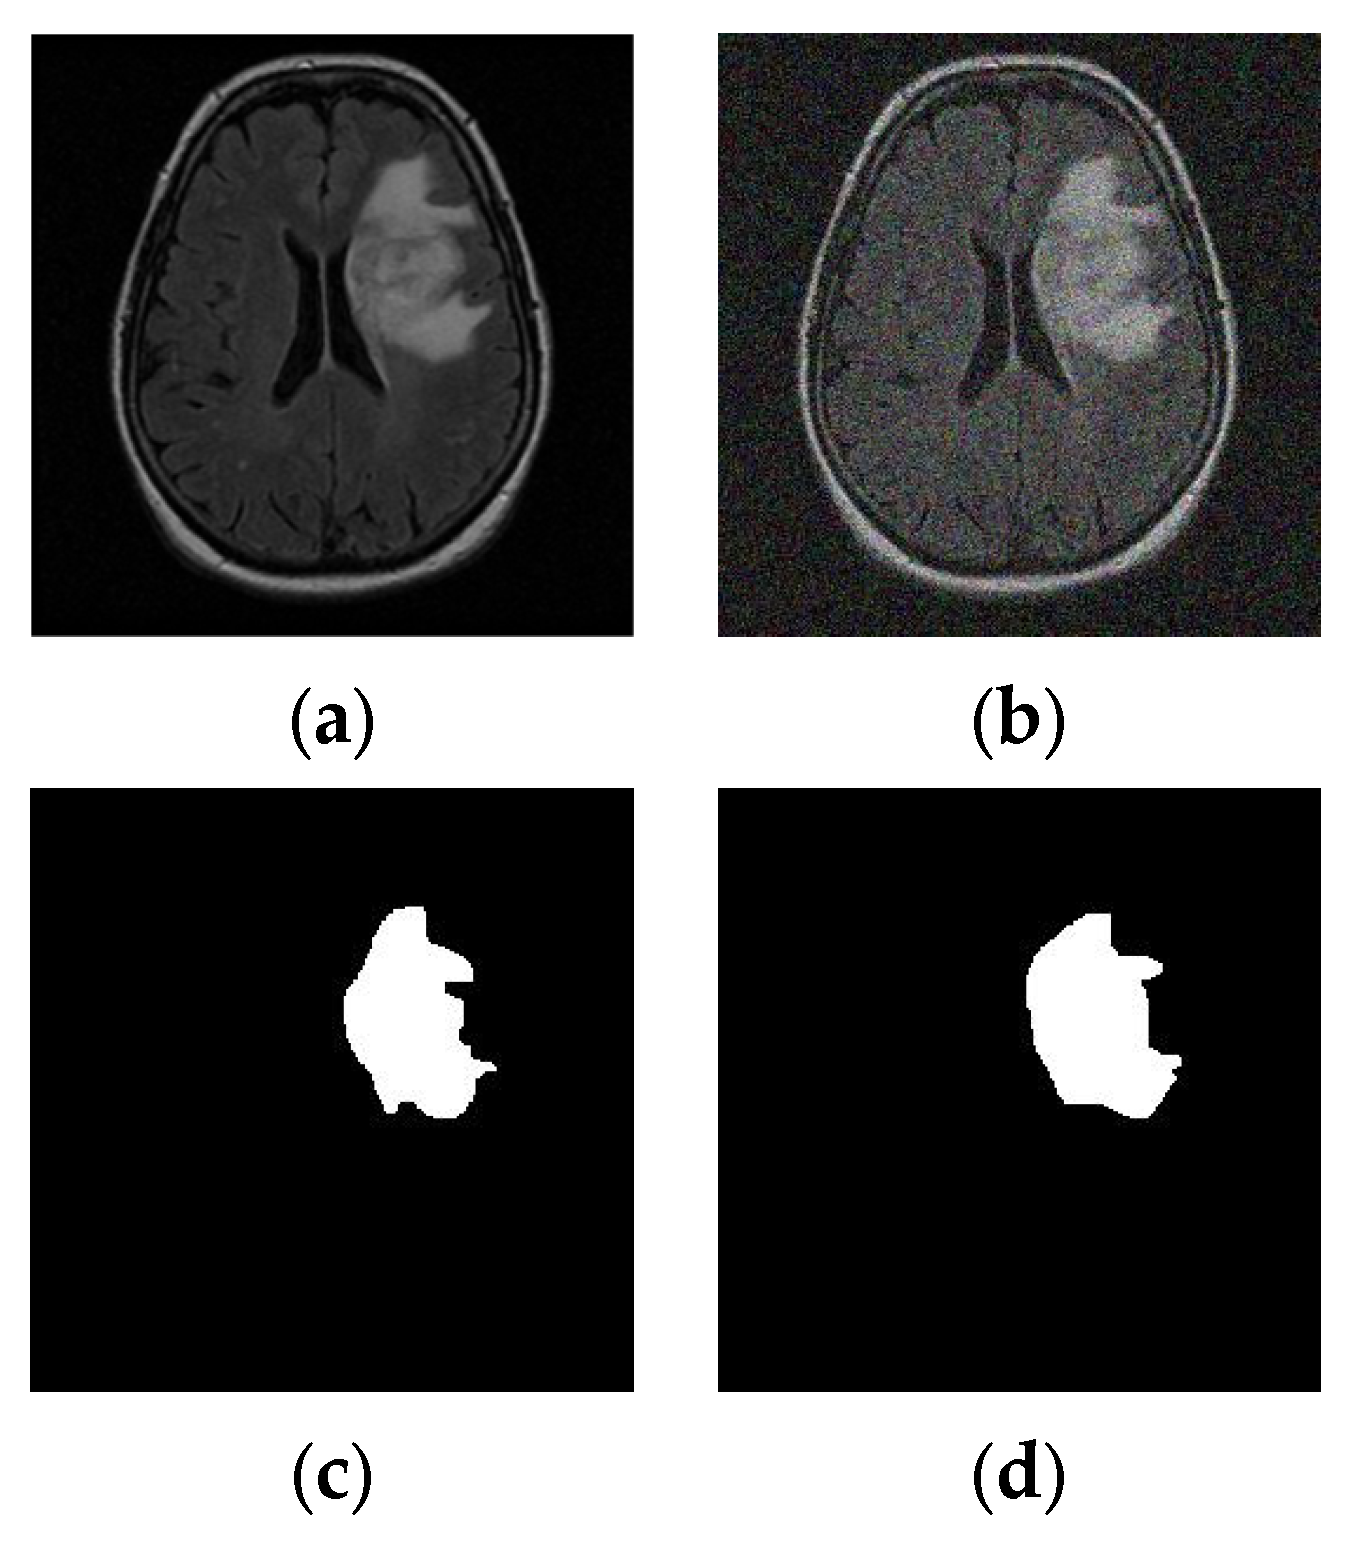
3.2. MRI Dataset
3.3. Feature Extraction
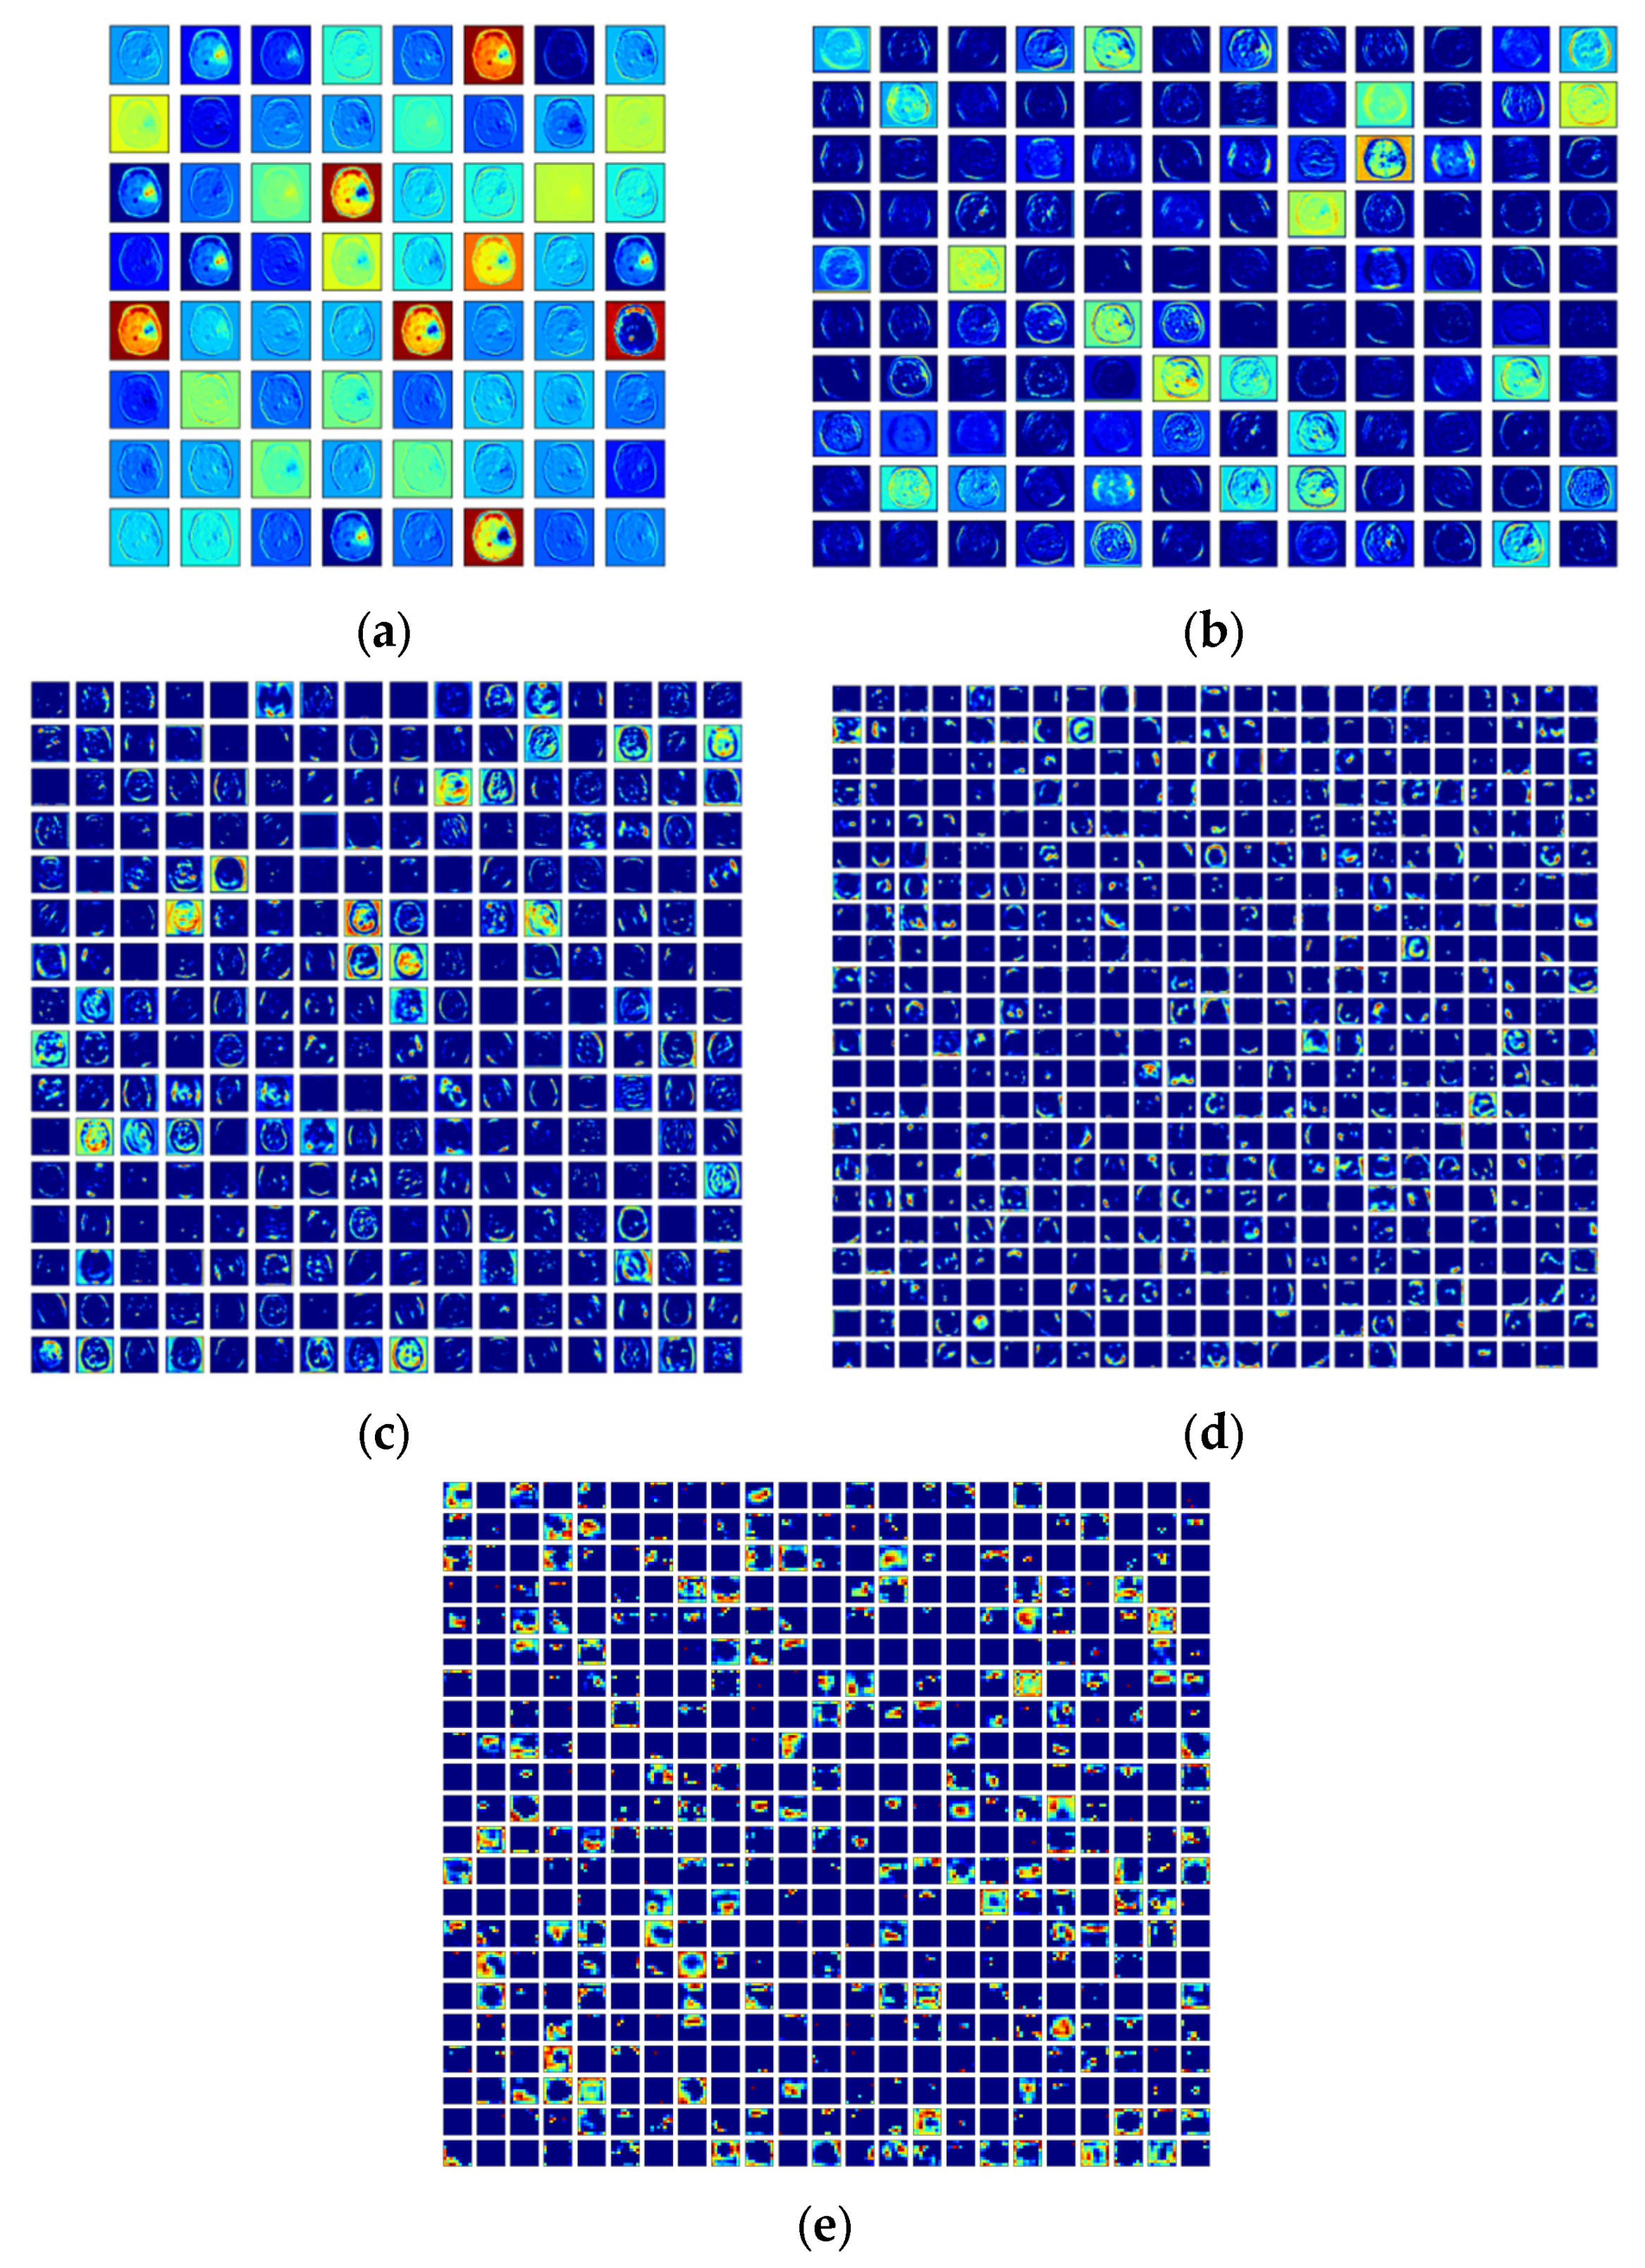
3.3.1. Deep Features
3.3.2. Tumor Features
3.3.3. Feature Optimization
- The herd of elephants in each clan is stable;
- Male elephants are separate from their groups in each generation;
- Herds are led to food and water by older elephants (matriarchs).
3.4. Implementation
3.5. Performance Evaluation
4. Results and Discussion
5. Conclusions
Author Contributions
Funding
Institutional Review Board Statement
Informed Consent Statement
Data Availability Statement
Conflicts of Interest
References
- Rajinikanth, V.; Raj, A.N.J.; Thanaraj, K.P.; Naik, G.R. A customized VGG19 network with concatenation of deep and handcrafted features for brain tumor detection. Appl. Sci. 2020, 10, 3429. [Google Scholar] [CrossRef]
- Sung, H.; Ferlay, J.; Siegel, R.; Laversanne, M.; Soerjomataram, I.; Jemal, A.; Bray, F. Global cancer statistics 2020: GLOBOCAN estimates of incidence and mortality worldwide for 36 cancers in 185 countries. CA Cancer J. Clin. 2021, 71, 209–249. [Google Scholar] [CrossRef] [PubMed]
- Louis, D.N.; Perry, A.; Wesseling, P.; Brat, D.J.; Cree, I.A.; Figarella-Branger, D.; Hawkins, C.; Ng, H.K.; Pfister, S.M.; Reifenberger, G.; et al. The 2021 WHO classification of tumors of the central nervous system: A summary. Neuro-Oncology 2021, 23, 1231–1251. [Google Scholar] [CrossRef] [PubMed]
- Rajinikanth, V.; Kadry, S. Development of a framework for preserving the disease-evidence-information to support efficient disease diagnosis. Int. J. Data Warehous. Min. (IJDWM) 2021, 17, 63–84. [Google Scholar] [CrossRef]
- Rajinikanth, V.; Kadry, S.; Nam, Y. Convolutional-neural-network assisted segmentation and svm classification of brain tumor in clinical MRI slices. Inf. Technol. Control 2021, 50, 342–356. [Google Scholar] [CrossRef]
- Hossain, A.; Islam, M.; Beng, G.; Kashem, S.; Soliman, M.S.; Misran, N.; Chowdhury, M. Microwave brain imaging system to detect brain tumor using metamaterial loaded stacked antenna array. Sci. Rep. 2022, 12, 16478. [Google Scholar] [CrossRef]
- Deepak, S.; Ameer, P. Automated categorization of brain tumor from mri using cnn features and svm. J. Ambient. Intell. Humaniz. Comput. 2021, 12, 8357–8369. [Google Scholar] [CrossRef]
- Zhu, Z.; Khan, M.; Wang, S.H.; Zhang, Y. RBEBT: A ResNet-Based BA-ELM for Brain Tumor Classification. Cmc-Comput. Mater. Contin. 2023, 74, 101–111. [Google Scholar] [CrossRef]
- Belaid, O.N.; Loudini, M. Classification of brain tumor by combination of pre-trained vgg16 cnn. J. Inf. Technol. Manag. 2020, 12, 13–25. [Google Scholar]
- Sarkar, S.; Kumar, A.; Chakraborty, S.; Aich, S.; Sim, J.-S.; Kim, H.-C. A CNN based approach for the detection of brain tumor using MRI scans. Test Eng. Manag. 2020, 83, 16580–16586. [Google Scholar]
- Pugalenthi, R.; Rajakumar, M.; Ramya, J.; Rajinikanth, V. Evaluation and classification of the brain tumor MRI using machine learning technique. J. Control Eng. Appl. Inform. 2019, 21, 12–21. [Google Scholar]
- Brunese, L.; Mercaldo, F.; Reginelli, A.; Santone, A. An ensemble learning approach for brain cancer detection exploiting radiomic features. Comput. Methods Programs Biomed. 2020, 185, 105134. [Google Scholar] [CrossRef] [PubMed]
- Sethy, P.; Behera, S. A data constrained approach for brain tumour detection using fused deep features and SVM. Multimed. Tools Appl. 2021, 80, 28745–28760. [Google Scholar] [CrossRef]
- Raza, A.; Ayub, H.; Khan, J.A.; Ahmad, I.; SSalama, A.; Daradkeh, Y.I.; Javeed, D.; Ur Rehman, A.; Hamam, H. A hybrid deep learning-based approach for brain tumor classification. Electronics 2022, 11, 1146. [Google Scholar] [CrossRef]
- Kadry, S.; Rajinikanth, V.; Raja, N.; Hemanth, D.J.; Hannon, N.; Raj, A. Evaluation of brain tumor using brain MRI with modified-moth-flame algorithm and Kapur’s thresholding: A study. Evol. Intell. 2021, 14, 1053–1063. [Google Scholar] [CrossRef]
- Xiao, Y.; Yin, H.; Wang, S.-H.; Zhang, Y.-D. TReC: Transferred ResNet and CBAM for Detecting Brain Diseases. Front. Neuroinform. 2021, 15, 71. [Google Scholar] [CrossRef]
- Menze, B.H.; Jakab, A.; Bauer, S.; Kalpathy-Cramer, J.; Farahani, K.; Kirby, J.; Burren, Y.; Porz, N.; Slotboom, J.; Wiest, R.; et al. The Multimodal Brain Tumor Image Segmentation Benchmark (BRATS). IEEE Trans. Med. Imaging 2015, 34, 1993–2024. [Google Scholar] [CrossRef]
- Bakas, S.; Akbari, H.; Sotiras, A.; Bilello, M.; Rozycki, M.; Kirby, J.S.; Freymann, J.B.; Farahani, K.; Davatzikos, C. Advancing The Cancer Genome Atlas glioma MRI collections with expert segmentation labels and radiomic features. Nat. Sci. Data 2017, 4, 170117. [Google Scholar] [CrossRef]
- Bakas, S.; Akbari, H.; Sotiras, A.; Bilello, M.; Rozycki, M.; Kirby, J.; Freymann, J.; Farahani, K.; Davatzikos, C. Segmentation Labels and Radiomic Features for the Pre-operative Scans of the TCGA-LGG collection. Cancer Imaging Arch. 2017, 286. [Google Scholar] [CrossRef]
- Bakas, S.; Akbari, H.; Sotiras, A.; Bilello, M.; Rozycki, M.; Kirby, J.; Freymann, J.; Farahani, K.; Davatzikos, C. Segmentation Labels and Radiomic Features for the Pre-operative Scans of the TCGA-GBM collection. Cancer Imaging Arch. 2017. [Google Scholar] [CrossRef]
- Srinivasan, K.; Ankur, A.; Sharma, A. Super-resolution of Magnetic Resonance Images using deep Convolutional Neural Networks. In Proceedings of the 2017 IEEE International Conference on Consumer Electronics—Taiwan (ICCE-TW), Taipei, Taiwan, 12–14 June 2017; pp. 41–42. [Google Scholar] [CrossRef]
- Ramaneswaran, S.; Srinivasan, K.; Vincent, P.M.D.R.; Chang, C.-Y. Hybrid Inception v3 XGBoost Model for Acute Lymphoblastic Leukemia Classification. Comput. Math. Methods Med. 2021, 2021, 2577375. [Google Scholar] [CrossRef]
- Kathiravan, S.; Kanakaraj, J. A Review on Potential Issues and Challenges in MR Imaging. Sci. World J. 2013, 2013, 783715. [Google Scholar] [CrossRef] [PubMed]
- Kalaiselvi, T.; Padmapriya, S.T.; Sriramakrishnan, P.; Somasundaram, K. Deriving tumor detection models using convolutional neural networks from MRI of human brain scans. Int. J. Inf. Technol. 2020, 12, 403–408. [Google Scholar] [CrossRef]
- Raja, P. Brain tumor classification using a hybrid deep autoencoder with Bayesian fuzzy clustering-based segmentation approach. Biocybern. Biomed. Eng. 2020, 40, 440–453. [Google Scholar] [CrossRef]
- Amin, J.; Sharif, M.; Gul, N.; Raza, M.; Anjum, M.; Nisar, M.; Bukhari, S. Brain tumor detection by using stacked autoencoders in deep learning. J. Med. Syst. 2020, 44, 32. [Google Scholar] [CrossRef] [PubMed]
- Özyurt, E.; Avcı, D. An expert system for brain tumor detection: Fuzzy C-means with super resolution and convolutional neural network with extreme learning machine. Med. Hypotheses 2020, 134, 109433. [Google Scholar] [CrossRef] [PubMed]
- Anilkumar, B.; Kumar, P. Tumor classification using block wise fine tuning and transfer learning of deep neural network and KNN classifier on MR brain images. Int. J. Emerg. Trends Eng. Res. 2020, 8, 574–583. [Google Scholar] [CrossRef]
- Sharif, M.I.; Li, J.P.; Khan, M.A.; Saleem, M.A. Active deep neural network features selection for segmentation and recognition of brain tumors using MRI images. Pattern Recognit. Lett. 2020, 129, 181–189. [Google Scholar] [CrossRef]
- Han, C.; Rundo, L.; Araki, R.; Furukawa, Y.; Mauri, G.; Nakayama, H.; Hayashi, H. Infinite Brain Mr Images: PGGAN-Based Data Augmentation for Tumor Detection; Springer: Singapore, 2020; pp. 291–303. [Google Scholar]
- Amin, J.; Sharif, M.; Yasmin, M.; Saba, T.; Anjum, M.A.; Fernandes, S.L. A new approach for brain tumor segmentation and classification based on score level fusion using transfer learning. J. Med. Syst. 2019, 43, 326. [Google Scholar] [CrossRef]
- Siar, M.; Teshnehlab, M. Brain tumor detection using deep neural network and machine learning algorithm. In Proceedings of the 2019 9th International Conference on Computer and Knowledge Engineering (ICCKE), Mashhad, Iran, 24–25 October 2019; pp. 363–368. [Google Scholar] [CrossRef]
- Krishnammal, P.M.; Raja, S.S. Convolutional neural network based image classification and detection of abnormalities in MRI brain images. In Proceedings of the 2019 International Conference on Communication and Signal Processing (ICCSP), Chennai, India, 4–6 April 2019; pp. 548–553. [Google Scholar] [CrossRef]
- Ezhilarasi, R.; Varalakshmi, P. Tumor detection in the brain using faster R-CNN. In Proceedings of the 2018 2nd International Conference on I-SMAC (IoT in Social, Mobile, Analytics and Cloud)(I-SMAC) I-SMAC (IoT in Social, Mobile, Analytics and Cloud) (I-SMAC), Palladam, India, 30–31 August 2018; pp. 388–392. [Google Scholar] [CrossRef]
- Antony, A.; Fathima, K.A.; Raju, D.; Binish, M.C. Brain tumor detection and classification in mri images. Int. J. Innov. Res. Sci. Eng. Technol. 2017, 6, 84–89. [Google Scholar]
- Pandian, A.A.; Balasubramanian, R. Fusion of contourlet transform and zernike moments using content based image retrieval for MRI brain tumor images. Indian J. Sci. Technol. 2016, 9, 1–8. [Google Scholar] [CrossRef]
- Gudigar, A.; Raghavendra, U.; Rao, T.N.; Samanth, J.; Rajinikanth, V.; Satapathy, S.C.; Ciaccio, E.J.; Wai Yee, C.; Acharya, U.R. FFCAEs: An efficient feature fusion framework using cascaded autoencoders for the identification of gliomas. Int. J. Imaging Syst. Technol. 2023, 33, 483–494. [Google Scholar] [CrossRef]
- Demir, F.; Akbulut, Y.; Taşcı, B.; Demir, K. Improving brain tumor classification performance with an effective approach based on new deep learning model named 3ACL from 3D MRI data. Biomed. Signal Process. Control 2023, 81, 104424. [Google Scholar] [CrossRef]
- Qureshi, S.A.; Hussain, L.; Ibrar, U.; Alabdulkreem, E.; Nour, M.K.; Alqahtani, M.S.; Nafie, F.M.; Mohamed, A.; Mohammed, G.P.; Duong, T.Q. Radiogenomic classification for MGMT promoter methylation status using multi-omics fused feature space for least invasive diagnosis through mpMRI scans. Sci. Rep. 2023, 13, 3291. [Google Scholar] [CrossRef]
- Shelatkar, T.; Urvashi, D.; Shorfuzzaman, M.; Alsufyani, A.; Lakshmanna, K. Diagnosis of brain tumor using light weight deep learning model with fine-tuning approach. Comput. Math. Methods Med. 2022, 2022, 2858845. [Google Scholar] [CrossRef] [PubMed]
- Available online: http://www.itksnap.org/pmwiki/pmwiki.php (accessed on 11 December 2022).
- Fernandes, S.L.; Tanik, U.J.; Rajinikanth, V.; Karthik, K.A. A reliable framework for accurate brain image examination and treatment planning based on early diagnosis support for clinicians. Neural Comput. Appl. 2020, 32, 15897–15908. [Google Scholar] [CrossRef]
- Dey, N.; Rajinikanth, V.; Shi, F.; Tavares, J.M.R.; Moraru, L.; Karthik, K.A.; Lin, H.; Kamalanand, K.; Emmanuel, C. Social-Group-Optimization based tumor evaluation tool for clinical brain MRI of Flair/diffusion-weighted modality. Biocybern. Biomed. Eng. 2019, 39, 843–856. [Google Scholar] [CrossRef]
- Rajinikanth, V.; Thanaraj, K.; Satapath, S.C.; Fernandes, S.; Dey, N. Shannon’s entropy and watershed algorithm based technique to inspect ischemic stroke wound. In Smart Intelligent Computing and Applications; Springer: Singapore, 2019; pp. 23–31. [Google Scholar] [CrossRef]
- Wang, G.; Deb, S.; Coelho, L. Elephant herding optimization. In Proceedings of the 2015 3rd International Symposium on Computational and Business Intelligence (ISCBI), Bali, Indonesia, 7–9 December 2015; pp. 1–5. [Google Scholar] [CrossRef]
- Ali, M.A.; Balasubramanian, K.; Krishnamoorthy, G.D.; Muthusamy, S.; Pandiyan, S.; Panchal, H.; Mann, S.; Thangaraj, K.; El-Attar, N.E.; Abualigah, L.; et al. Classification of glaucoma based on elephant-herding optimization algorithm and deep belief network. Electronics 2022, 11, 1763. [Google Scholar] [CrossRef]
- Nayak, M.; Das, S.; Bhanja, U.; Senapati, M. Elephant herding optimization technique based neural network for cancer prediction. Inform. Med. Unlocked 2020, 21, 100445. [Google Scholar] [CrossRef]
- Lu, S.-Y.; Zhang, Z.; Zhang, Y.-D.; Wang, S.-H. CGENet: A deep graph model for COVID-19 detection based on chest CT. Biology 2022, 11, 33. [Google Scholar] [CrossRef]
- Lu, S.; Wang, S.-H.; Zhang, Y.-D. Detection of abnormal brain in MRI via improved AlexNet and ELM optimized by chaotic bat algorithm. Neural Comput. Appl. 2021, 33, 10799–10811. [Google Scholar] [CrossRef]


| References | Procedure Employed | Accuracy (%) |
|---|---|---|
| Kalaiselvi et al. [24] | Convolutional-neural-network (CNN)-supported examination of BT in the BRATS database. | 99.00 |
| Raja [25] | The implementation of a deep autoencoder along Bayesian fuzzy-clustering segmentation is discussed to detect BT in the BRATS database. | 98.50 |
| Amin et al. [26] | Detection of BT in BRATS is presented using stacked autoencoders. | 98.00 |
| Özyurt and Avcı [27] | This work implements fuzzy c-means-based superpixel detection and CNN with an extreme-learning machine to detect BT in a TCIA dataset. | 98.33 |
| Anilkumar and Kumar [28] | BT in the BRATS database is assessed using transfer learning and KNN classification. | 97.28 |
| Sharif et al. [29] | Deep-transfer-learning-supported segmentation and classification are performed using MRI slices from BRATS. | 92.00 |
| Han et al. [30] | Data augmentation and classification of MRI slices from BRATS are performed using the CNN approach. | 91.00 |
| Amin et al. [31] | Transfer learning with score-level fusion to detect BT in MRI slices from the BRATS database. | 99.00 |
| Siar and Teshnehlab [32] | Integrated DL and ML approaches are presented to detect BT in MRI slices from the BRATS database. | 87.00 |
| Krishnammal and Raja [33] | Employment of CNN-based classification and BT-severity detection is performed using BRATS. | 98.00 |
| Ezhilarasi and Varalakshmi [34] | R-CNN scheme-based detection of BT from the BRATS database is discussed. | 97.50 |
| Antony et al. [35] | Automatic detection of BT using BRATS and CNN is presented. | 97.00 |
| Pandian and Balasubramanian [36] | Implementation of content-based image retrieval is discussed using TCIA brain-MRI slices. | 88.00 |
| Gudigar et al. [37] | Cascaded autoencoder-based feature fusion and binary classification are implemented to detect BT in T2-modality MRI slices from TCIA. | 96.70 |
| Demir et al. [38] | A novel CNN scheme is implemented to examine multi-modality brain MRIs from BRATS. | 99.29 |
| Qureshi et al. [39] | Deep-learning radiomic-feature-extraction-based automatic detection of brain MRI is proposed for the BRATS database. | 96.84 |
| Shelatkar et al. [40] | Automatic examination of a tumor in an MRI slice with a lightweight deep-learning scheme. | - |
| Image | Dimensions | Total | Training | Validation | Testing |
|---|---|---|---|---|---|
| Class1 | 224 × 224 × 3 | 1500 | 1200 | 150 | 150 |
| Class2 | 224 × 224 × 3 | 1500 | 1200 | 150 | 150 |
| BT | Scheme | TP | FN | TN | FP | AC | PR | SE | SP | F1S |
|---|---|---|---|---|---|---|---|---|---|---|
| LGG/ HGG | VGG16 | 139 | 10 | 138 | 13 | 92.3333 | 91.4474 | 93.2886 | 91.3907 | 92.3588 |
| DenseNet101 | 135 | 14 | 140 | 11 | 91.6667 | 92.4658 | 90.6040 | 92.7152 | 91.5254 | |
| ResNet101 | 136 | 13 | 134 | 17 | 90.0000 | 88.8889 | 91.2752 | 88.7417 | 90.0662 | |
| VGG19 | 133 | 19 | 136 | 12 | 89.6667 | 91.7241 | 87.5000 | 91.8919 | 89.5623 | |
| ResNet50 | 133 | 17 | 135 | 15 | 89.3333 | 89.8649 | 88.6667 | 90.0000 | 89.2617 | |
| LGG/ GBM | VGG16 | 138 | 14 | 138 | 10 | 92.0000 | 93.2432 | 90.7895 | 93.2432 | 92.0000 |
| DenseNet101 | 136 | 13 | 138 | 13 | 91.3333 | 91.2752 | 91.2752 | 91.3907 | 91.2752 | |
| VGG19 | 134 | 19 | 136 | 11 | 90.0000 | 92.4138 | 87.5817 | 92.5170 | 89.9329 | |
| ResNet101 | 131 | 18 | 137 | 14 | 89.3333 | 90.3448 | 87.9195 | 90.7285 | 89.1156 | |
| ResNet50 | 132 | 17 | 135 | 16 | 89.0000 | 89.1892 | 88.5906 | 89.4040 | 88.8889 |
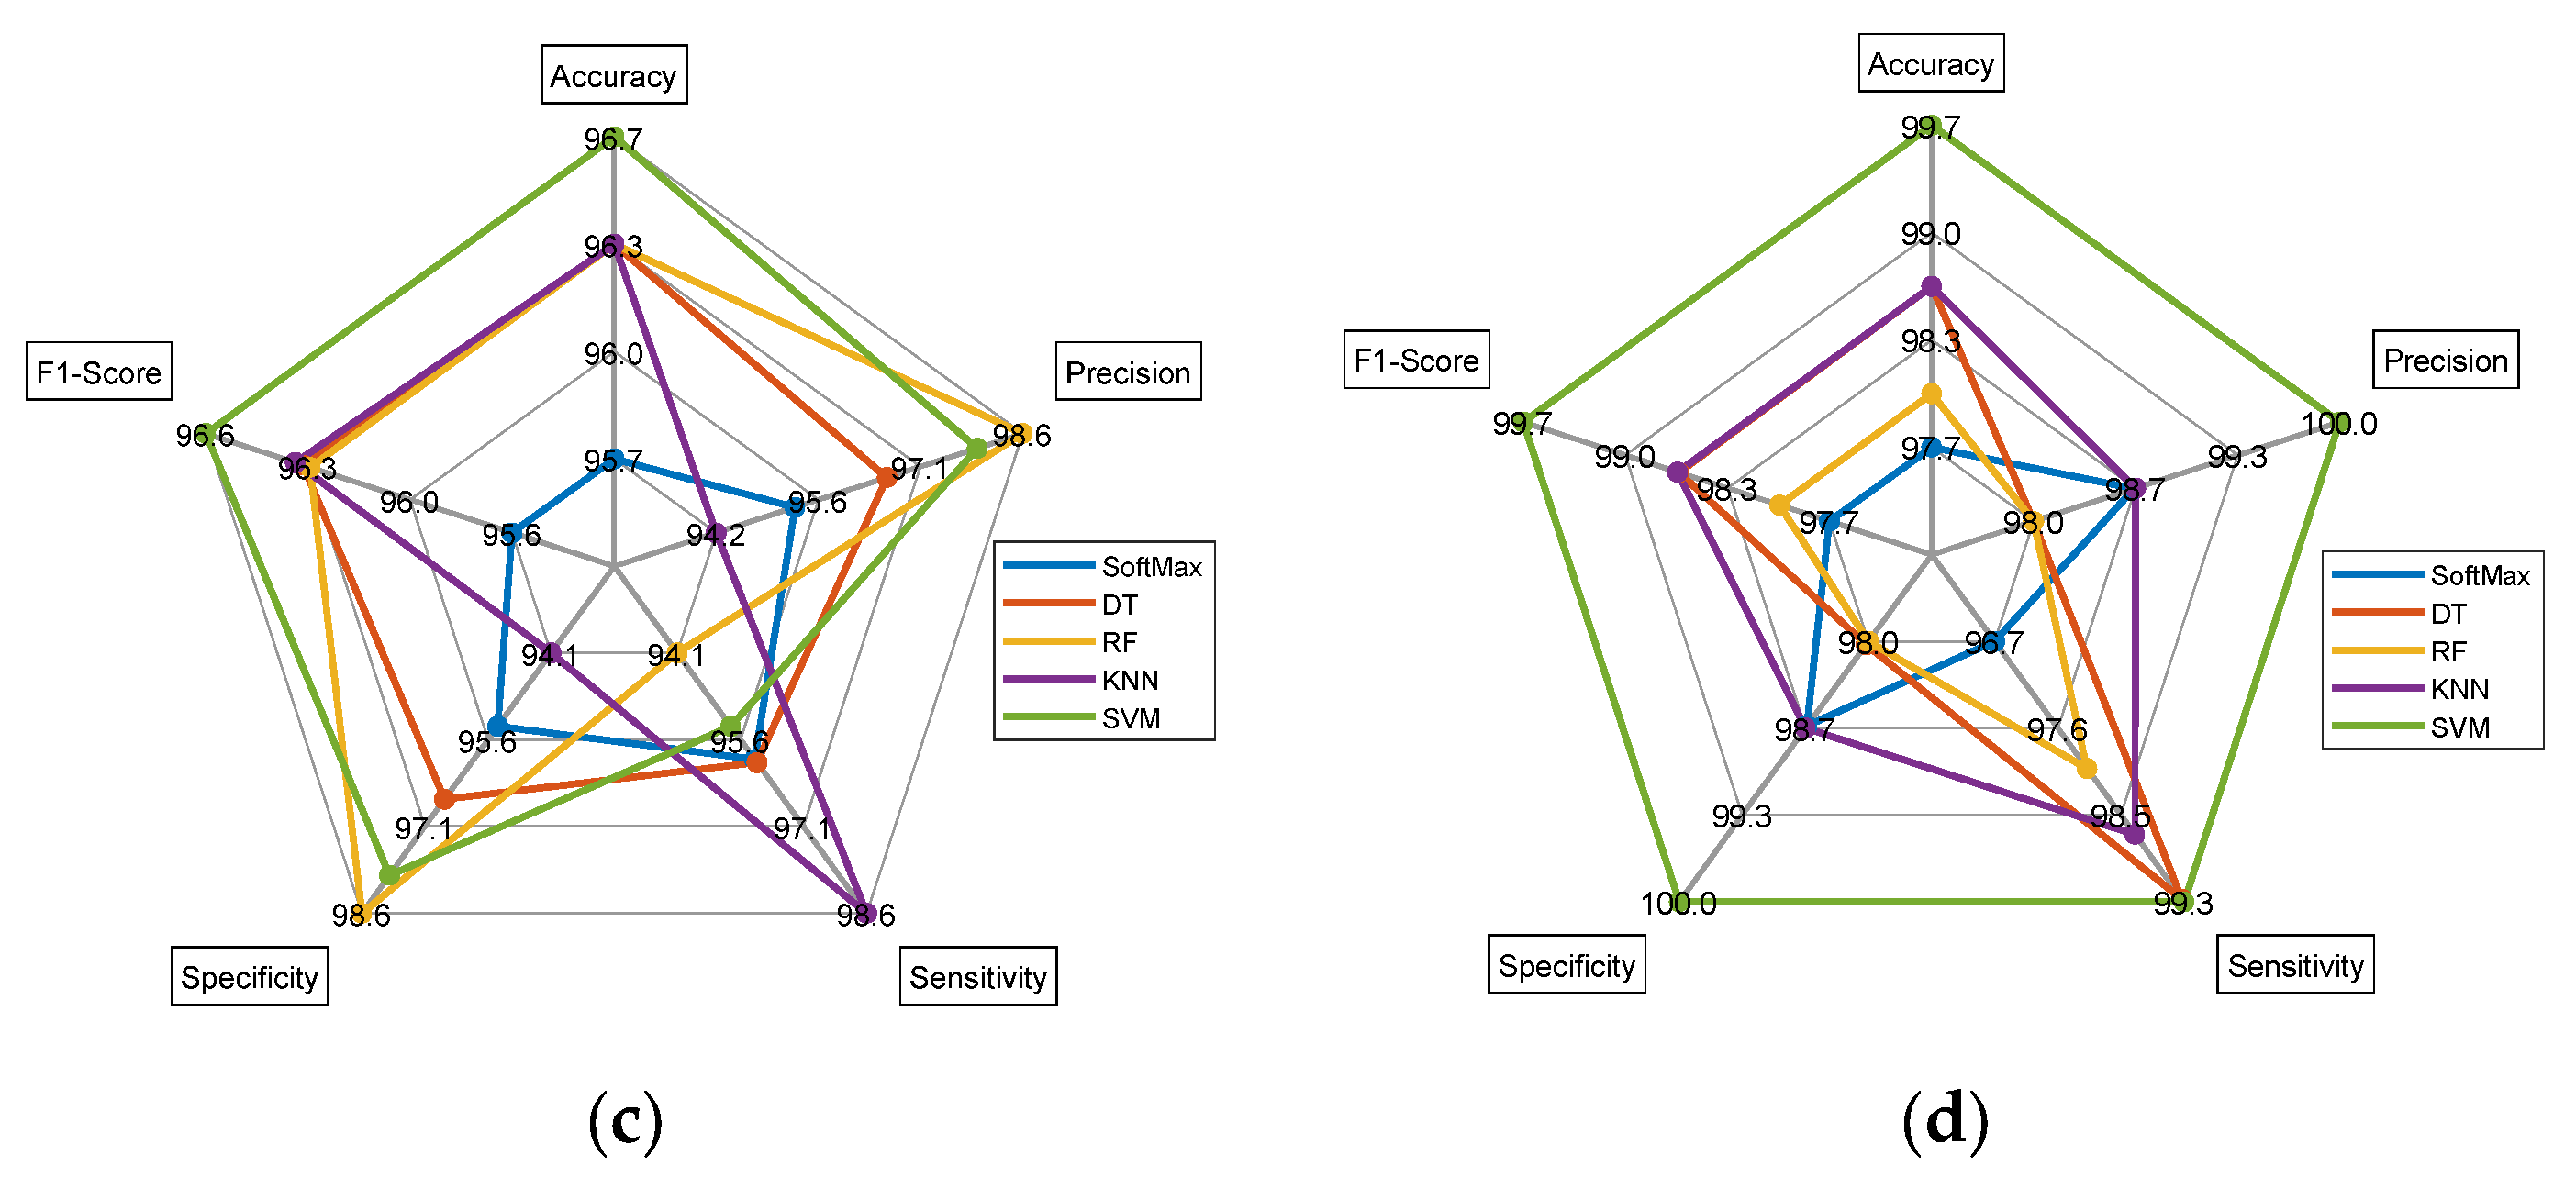
| Features | Classifiers | TP | FN | TN | FP | AC | PR | SE | SP | F1S |
|---|---|---|---|---|---|---|---|---|---|---|
| Dual Deep | SoftMax | 143 | 5 | 146 | 6 | 96.3333 | 95.9732 | 96.6216 | 96.0526 | 96.2963 |
| DT | 146 | 6 | 145 | 3 | 97.0000 | 97.9866 | 96.0526 | 97.9730 | 97.0100 | |
| RF | 144 | 7 | 145 | 4 | 96.3333 | 97.2973 | 95.3642 | 97.3154 | 96.3211 | |
| KNN | 145 | 4 | 144 | 7 | 96.3333 | 95.3947 | 97.3154 | 95.3642 | 96.3455 | |
| SVM | 144 | 7 | 146 | 3 | 96.6667 | 97.9592 | 95.3642 | 97.9866 | 96.6443 | |
| DL + ML | SoftMax | 146 | 2 | 148 | 4 | 98.0000 | 97.3333 | 98.6486 | 97.3684 | 97.9866 |
| DT | 148 | 3 | 144 | 5 | 97.3333 | 96.7320 | 98.0132 | 96.6443 | 97.3684 | |
| RF | 150 | 1 | 147 | 2 | 99.0000 | 98.6842 | 99.3377 | 98.6577 | 99.0099 | |
| KNN | 151 | 1 | 147 | 1 | 99.3333 | 99.3421 | 99.3421 | 99.3243 | 99.3421 | |
| SVM | 147 | 4 | 148 | 1 | 98.3333 | 99.3243 | 97.3510 | 99.3289 | 98.3278 |
| Features | Classifiers | TP | FN | TN | FP | AC | PR | SE | SP | F1S |
|---|---|---|---|---|---|---|---|---|---|---|
| Dual-Deep | SoftMax | 142 | 6 | 145 | 7 | 95.6667 | 95.3020 | 95.9459 | 95.3947 | 95.6229 |
| DT | 144 | 6 | 145 | 5 | 96.3333 | 96.6443 | 96.0000 | 96.6667 | 96.3211 | |
| RF | 143 | 9 | 146 | 2 | 96.3333 | 98.6207 | 94.0789 | 98.6486 | 96.2963 | |
| KNN | 145 | 2 | 144 | 9 | 96.3333 | 94.1558 | 98.6395 | 94.1176 | 96.3455 | |
| SVM | 144 | 7 | 146 | 3 | 96.6667 | 97.9592 | 95.3642 | 97.9866 | 96.6443 | |
| DL + ML | SoftMax | 146 | 5 | 147 | 2 | 97.6667 | 98.6486 | 96.6887 | 98.6577 | 97.6589 |
| DT | 146 | 1 | 150 | 3 | 98.6667 | 97.9866 | 99.3197 | 98.0392 | 98.6486 | |
| RF | 146 | 3 | 148 | 3 | 98.0000 | 97.9866 | 97.9866 | 98.0132 | 97.9866 | |
| KNN | 147 | 2 | 149 | 2 | 98.6667 | 98.6577 | 98.6577 | 98.6755 | 98.6577 | |
| SVM | 152 | 1 | 147 | 0 | 99.6667 | 100 | 99.3464 | 100 | 99.6721 |
Disclaimer/Publisher’s Note: The statements, opinions and data contained in all publications are solely those of the individual author(s) and contributor(s) and not of MDPI and/or the editor(s). MDPI and/or the editor(s) disclaim responsibility for any injury to people or property resulting from any ideas, methods, instructions or products referred to in the content. |
© 2023 by the authors. Licensee MDPI, Basel, Switzerland. This article is an open access article distributed under the terms and conditions of the Creative Commons Attribution (CC BY) license (https://creativecommons.org/licenses/by/4.0/).
Share and Cite
Rajinikanth, V.; Vincent, P.M.D.R.; Gnanaprakasam, C.N.; Srinivasan, K.; Chang, C.-Y. Brain Tumor Class Detection in Flair/T2 Modality MRI Slices Using Elephant-Herd Algorithm Optimized Features. Diagnostics 2023, 13, 1832. https://doi.org/10.3390/diagnostics13111832
Rajinikanth V, Vincent PMDR, Gnanaprakasam CN, Srinivasan K, Chang C-Y. Brain Tumor Class Detection in Flair/T2 Modality MRI Slices Using Elephant-Herd Algorithm Optimized Features. Diagnostics. 2023; 13(11):1832. https://doi.org/10.3390/diagnostics13111832
Chicago/Turabian StyleRajinikanth, Venkatesan, P. M. Durai Raj Vincent, C. N. Gnanaprakasam, Kathiravan Srinivasan, and Chuan-Yu Chang. 2023. "Brain Tumor Class Detection in Flair/T2 Modality MRI Slices Using Elephant-Herd Algorithm Optimized Features" Diagnostics 13, no. 11: 1832. https://doi.org/10.3390/diagnostics13111832