
In Vivo Study of Local and Systemic Responses to Clinical Use of Mg–1Ca Bioresorbable Orthopedic Implants

 ,
,  , ,
, ,  ,
,
Abstract
:1. Introduction
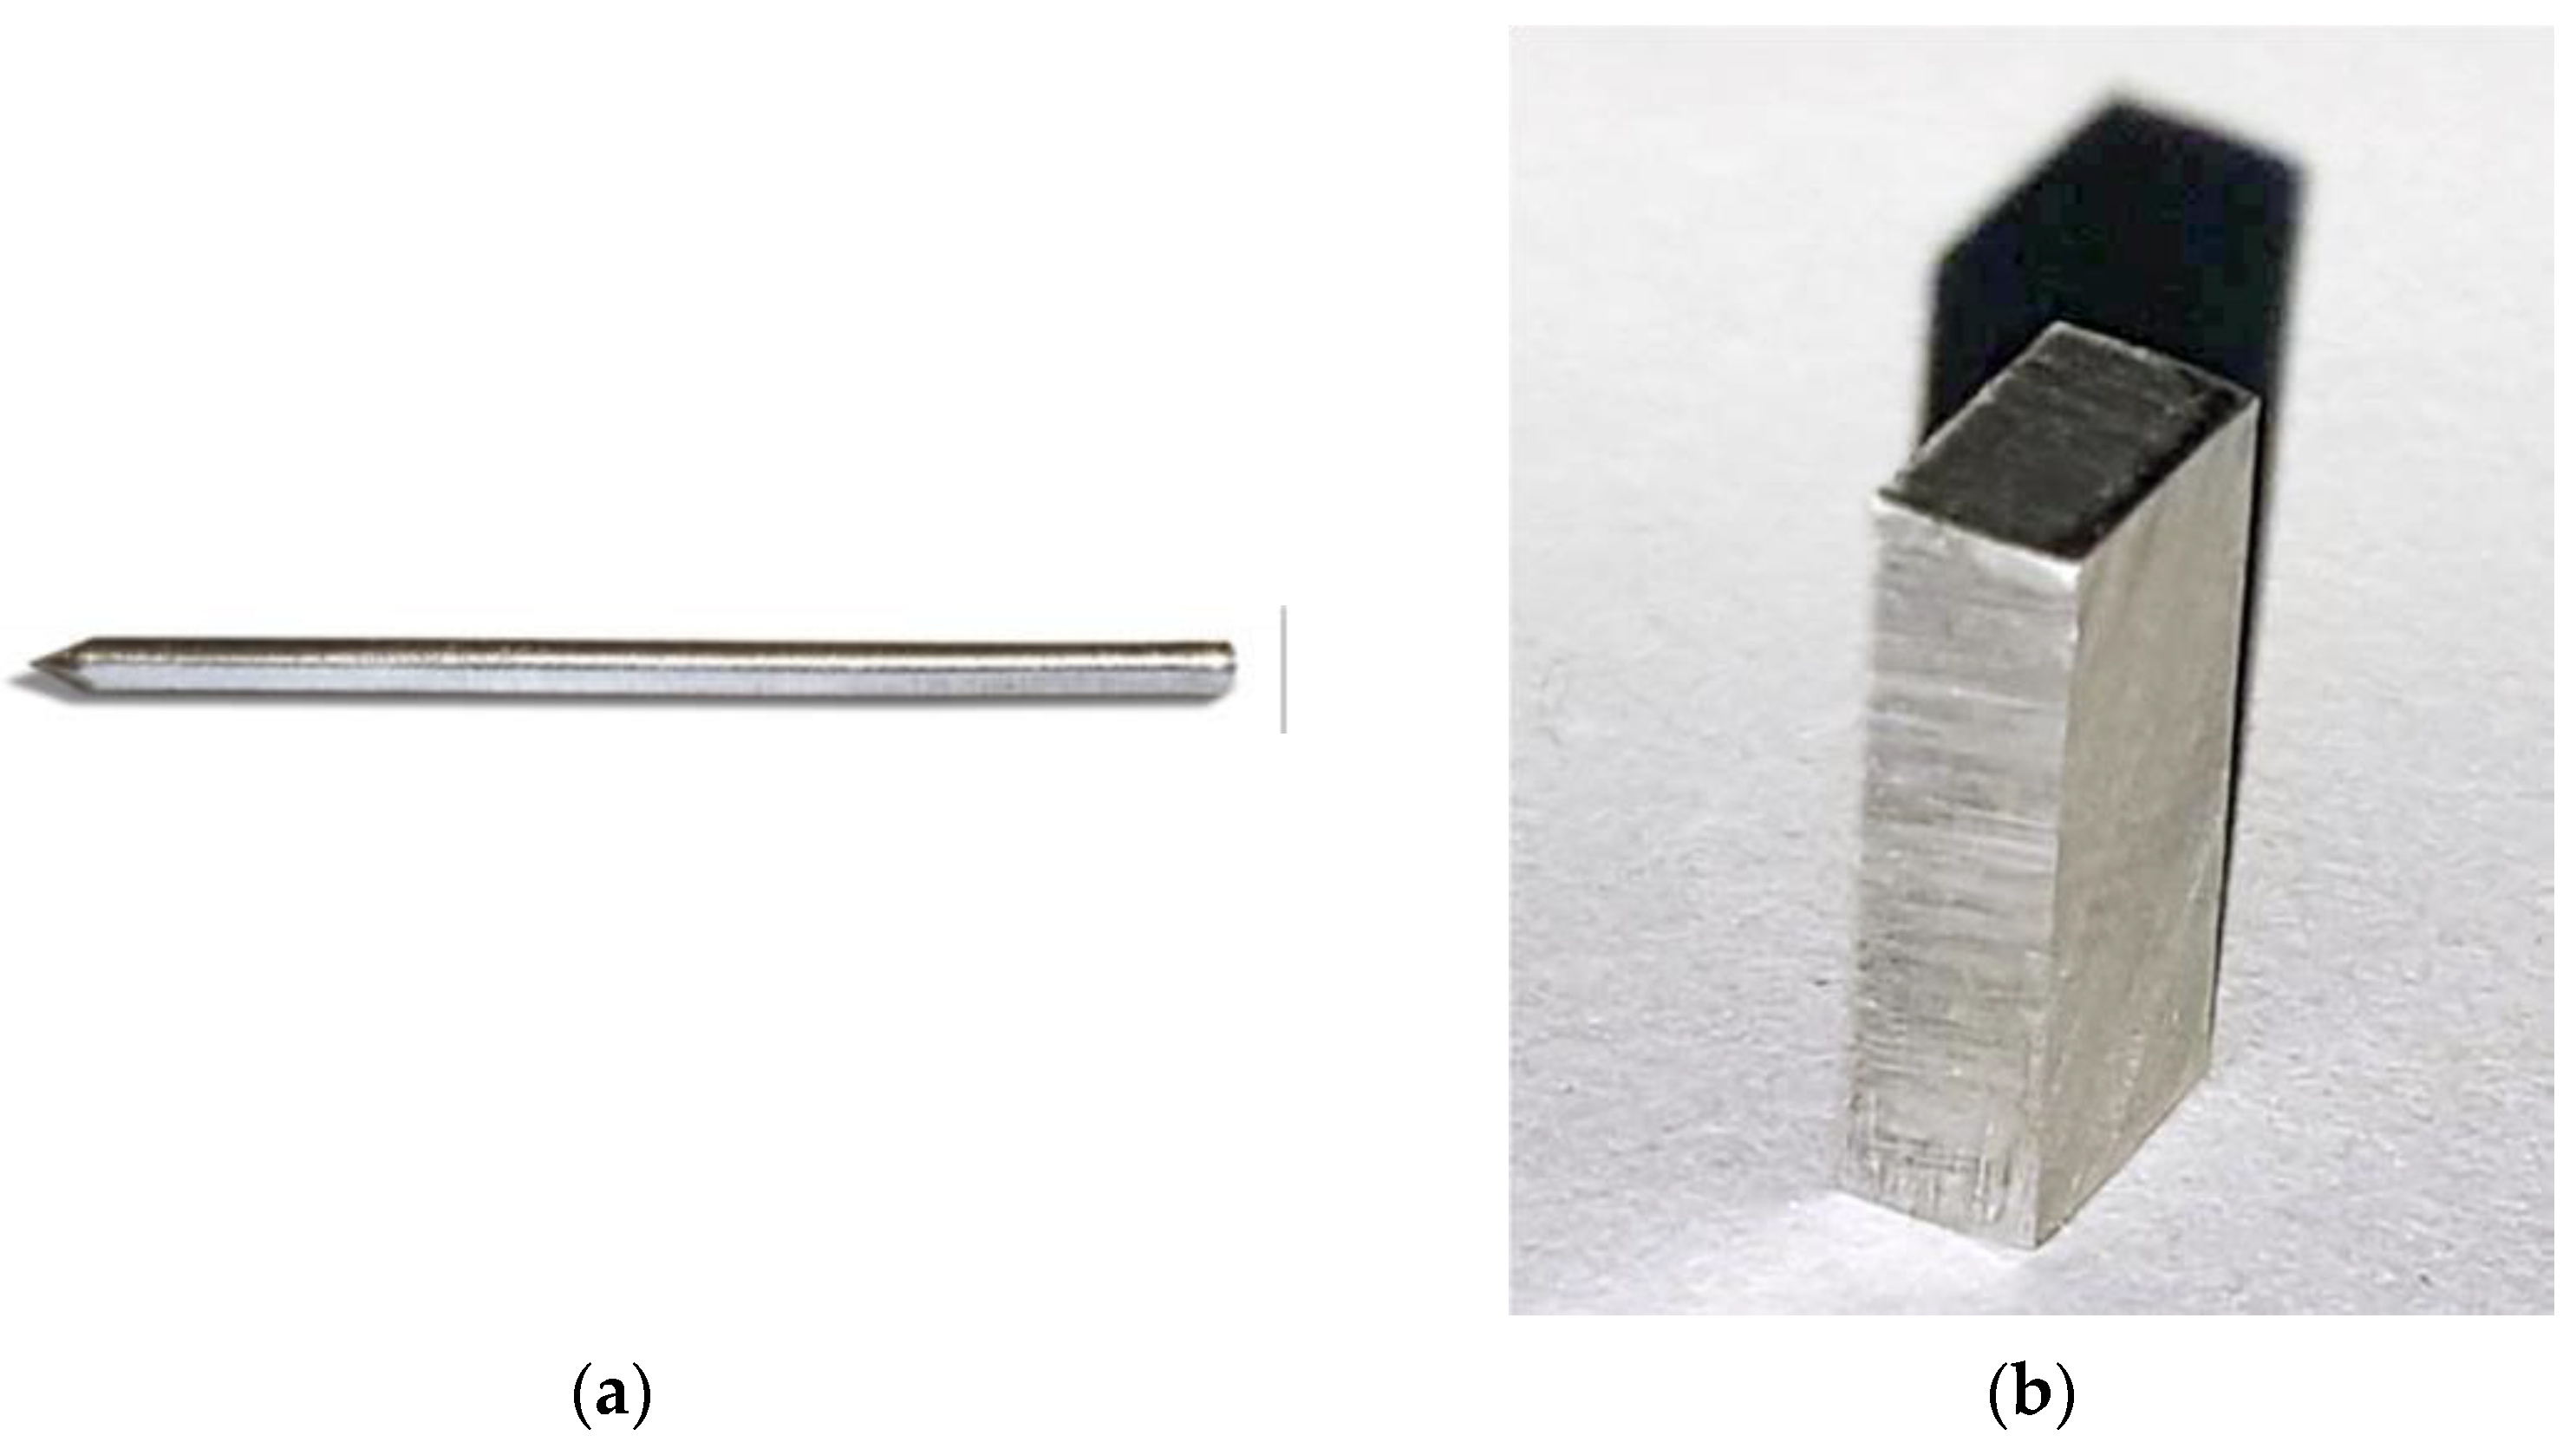
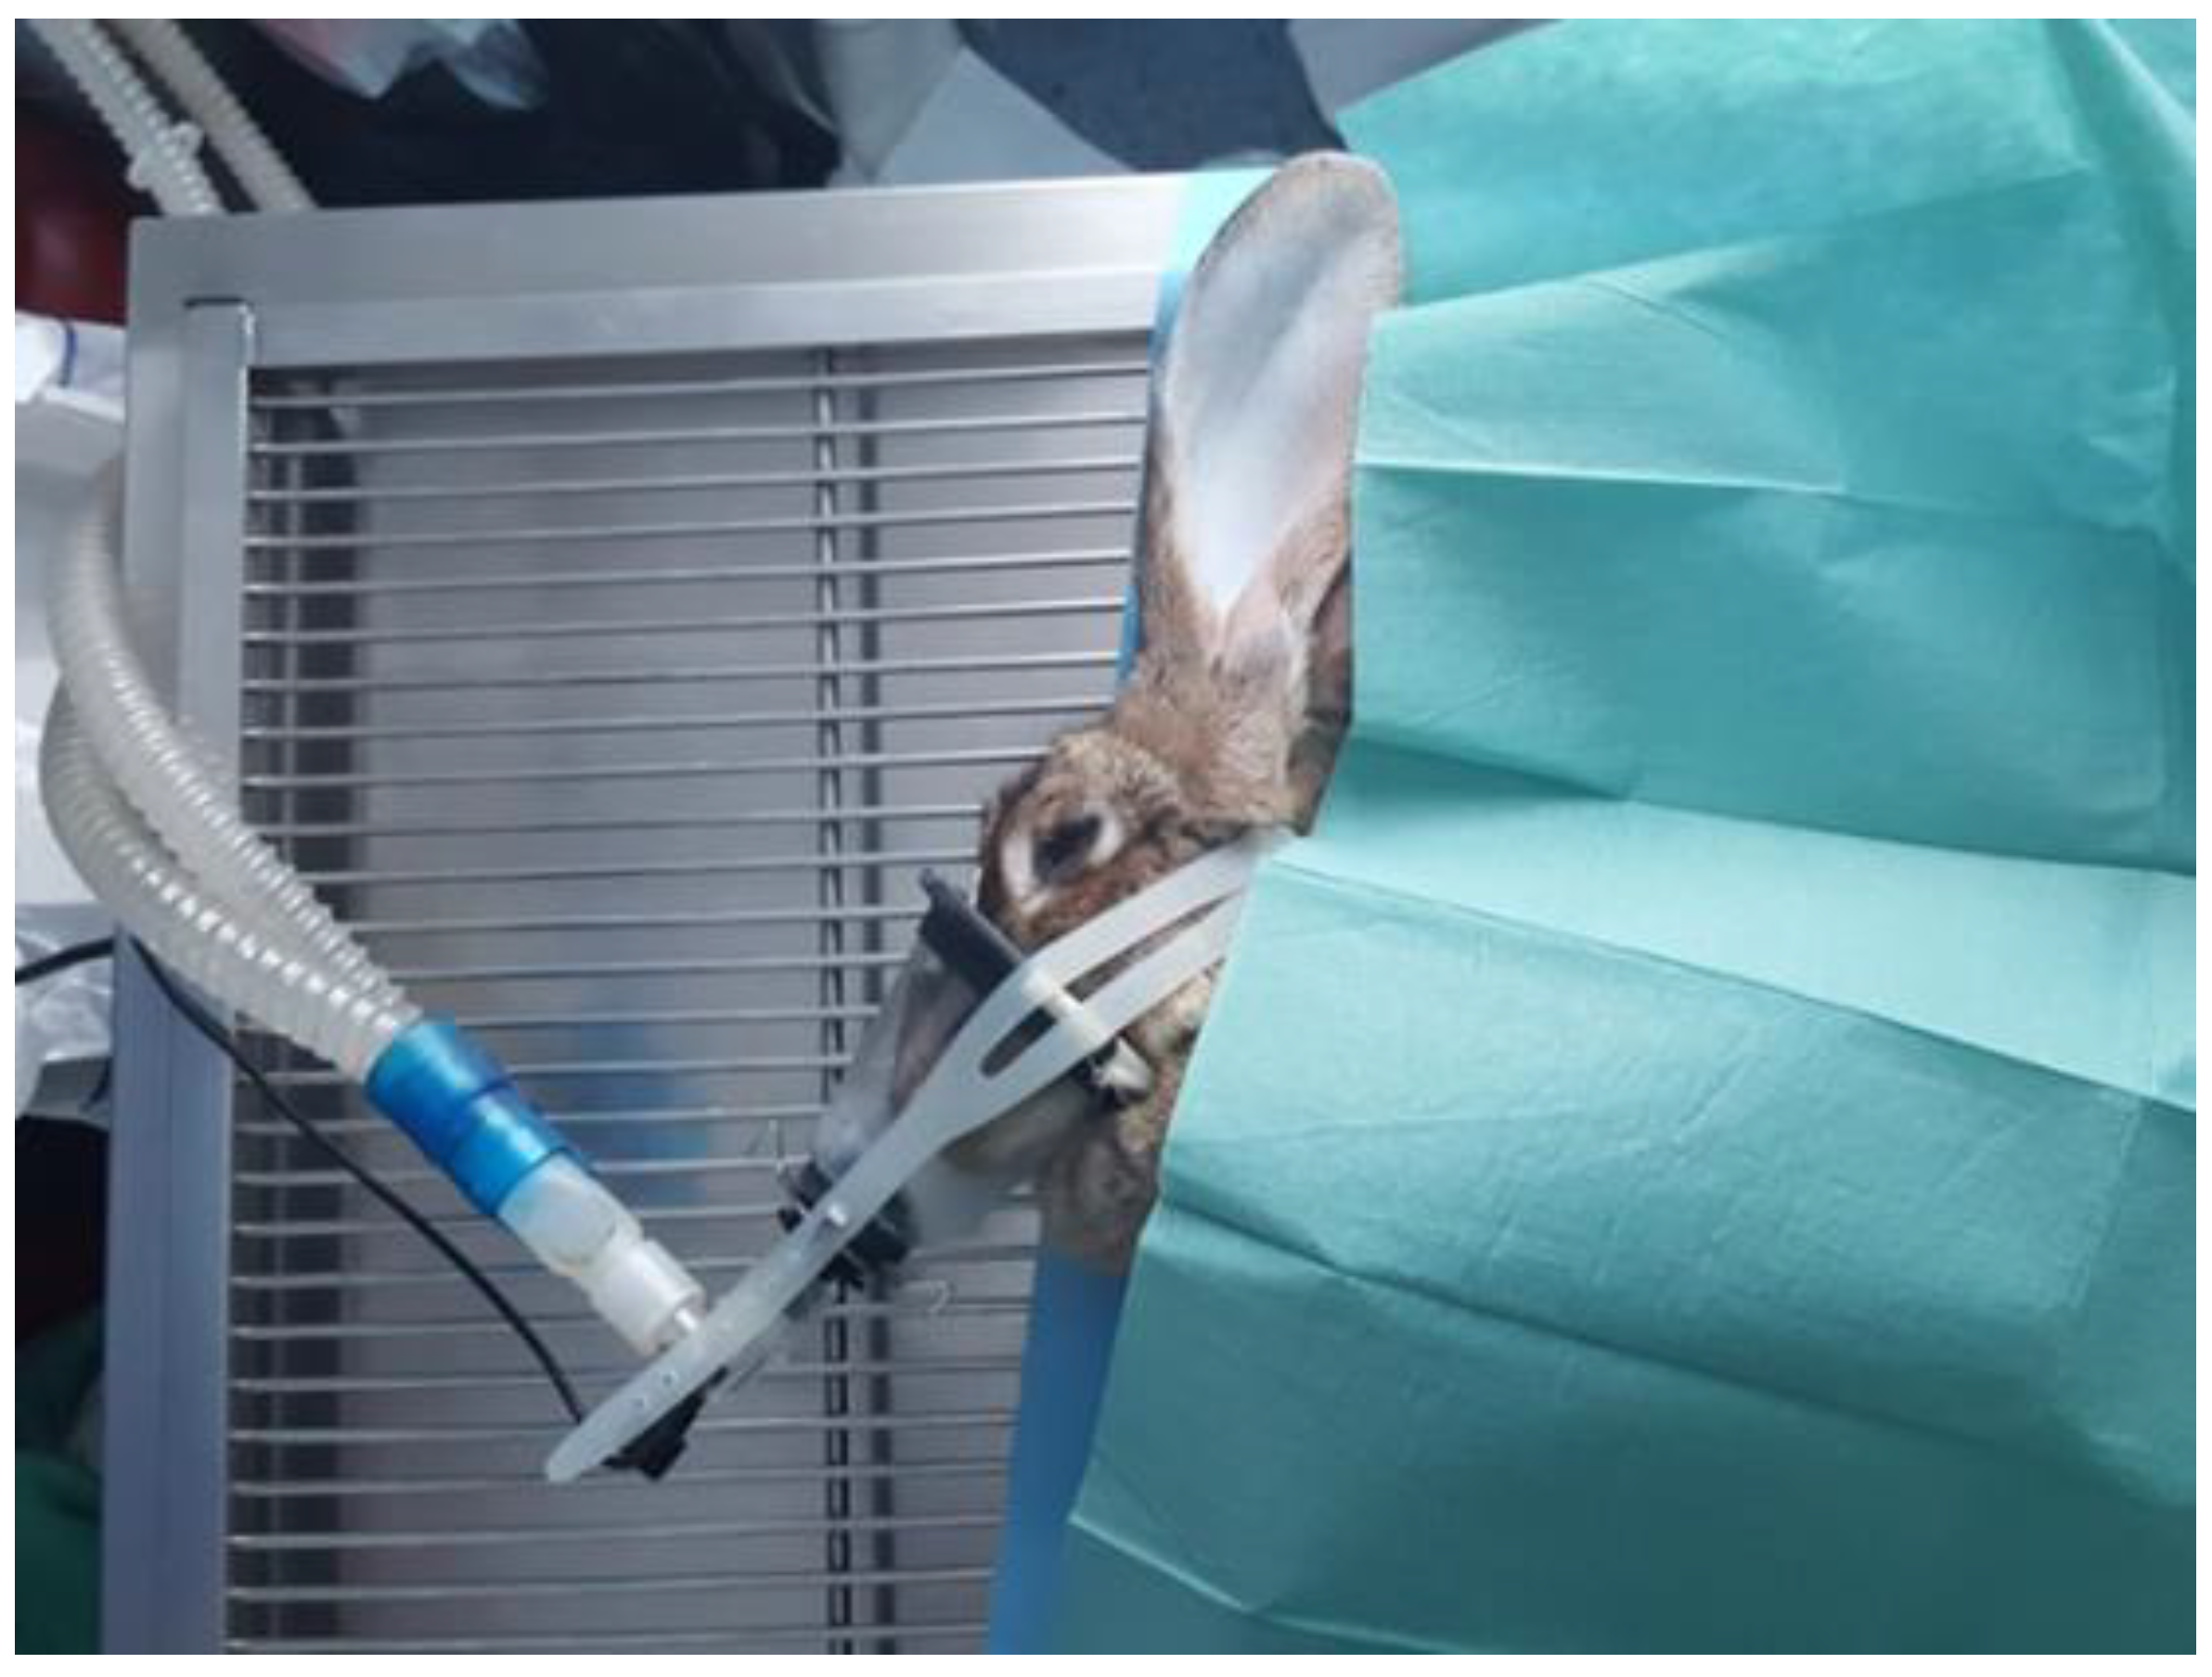
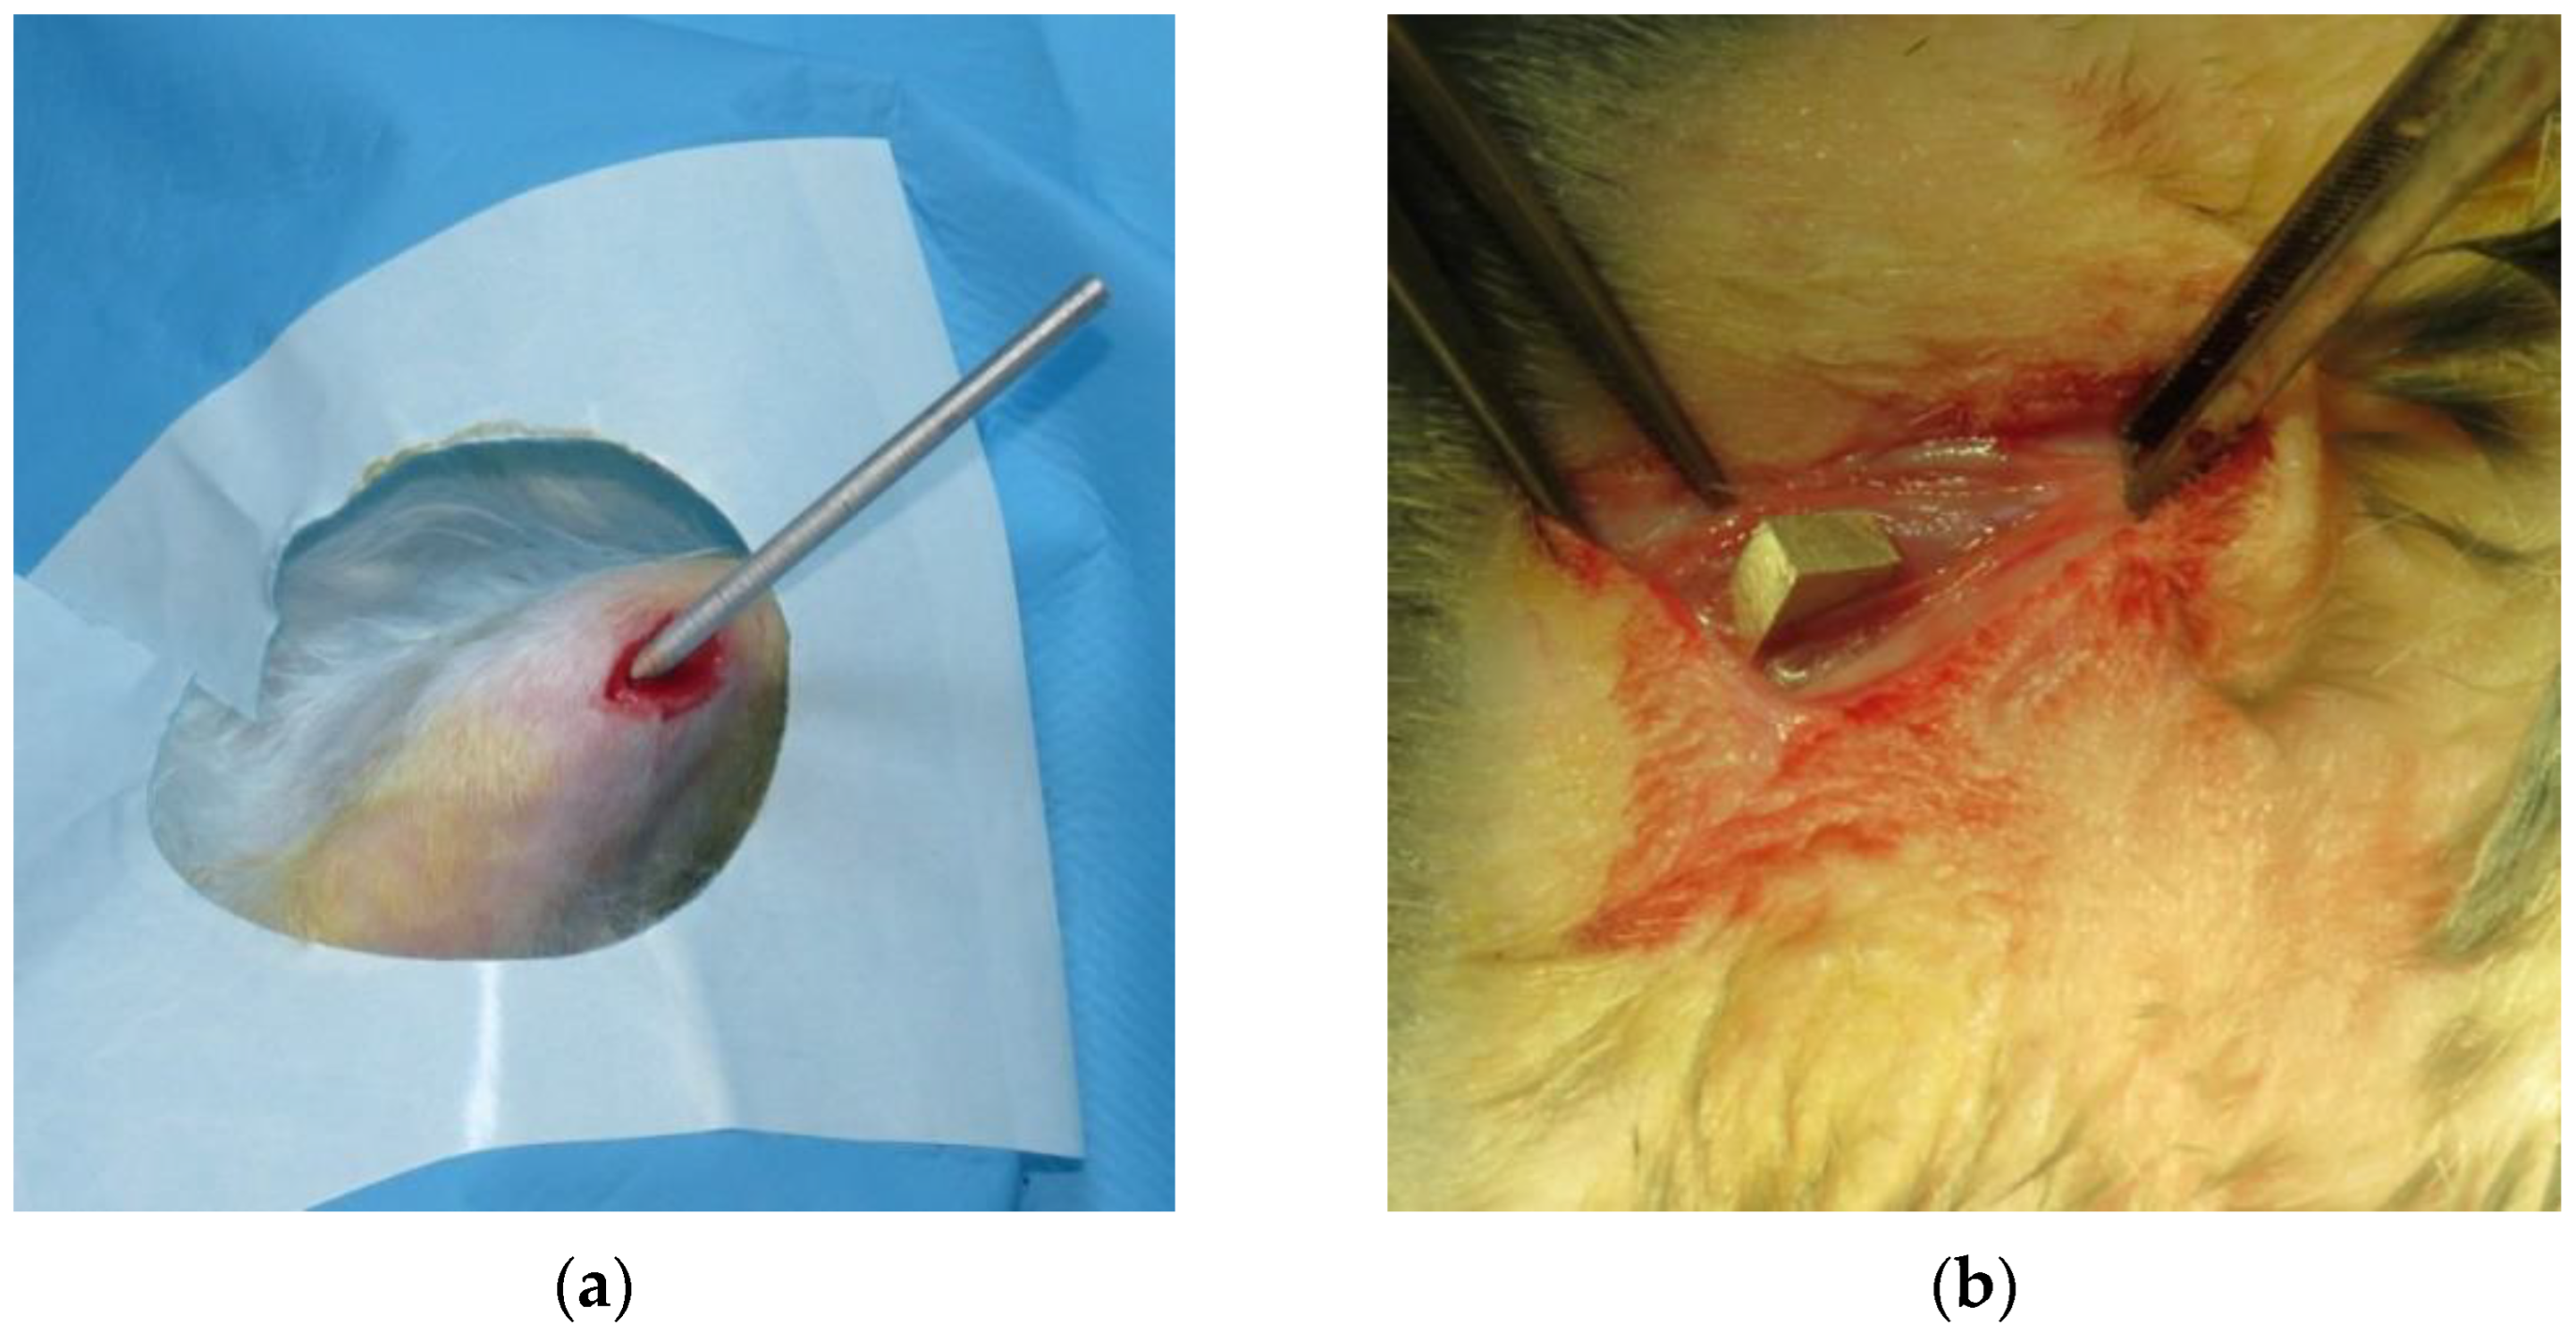
2. Materials and Methods
3. Results
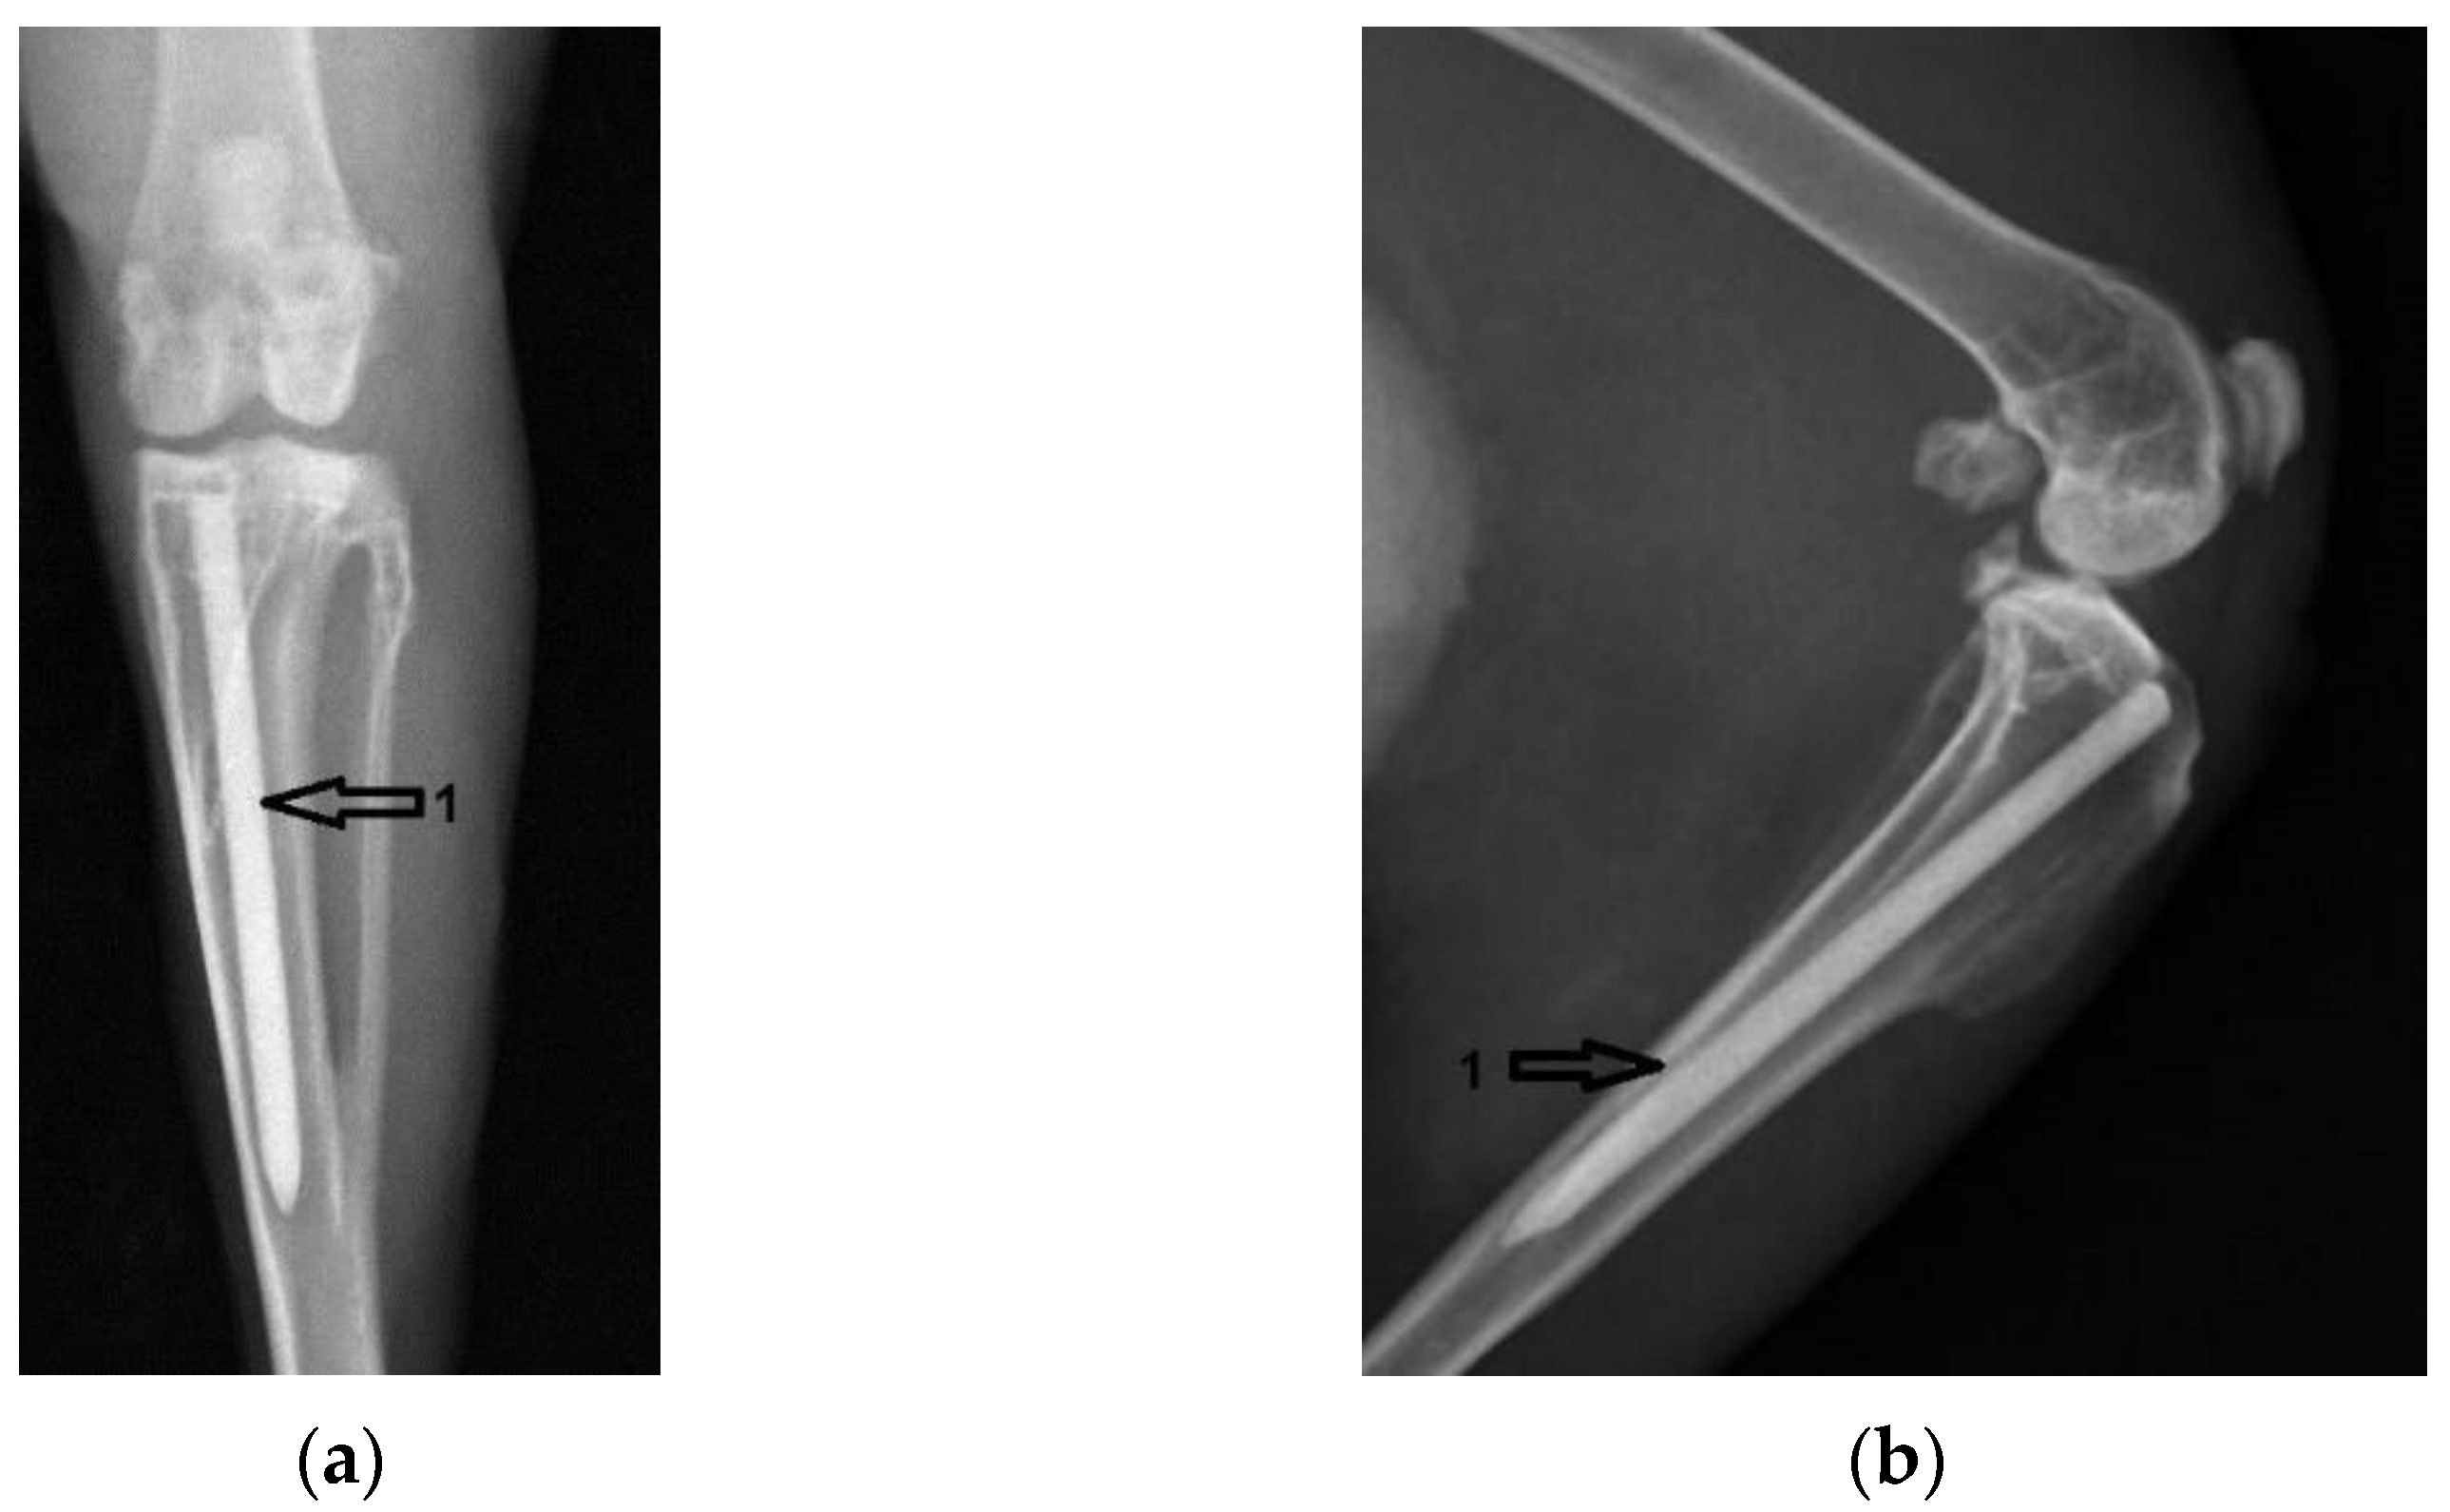
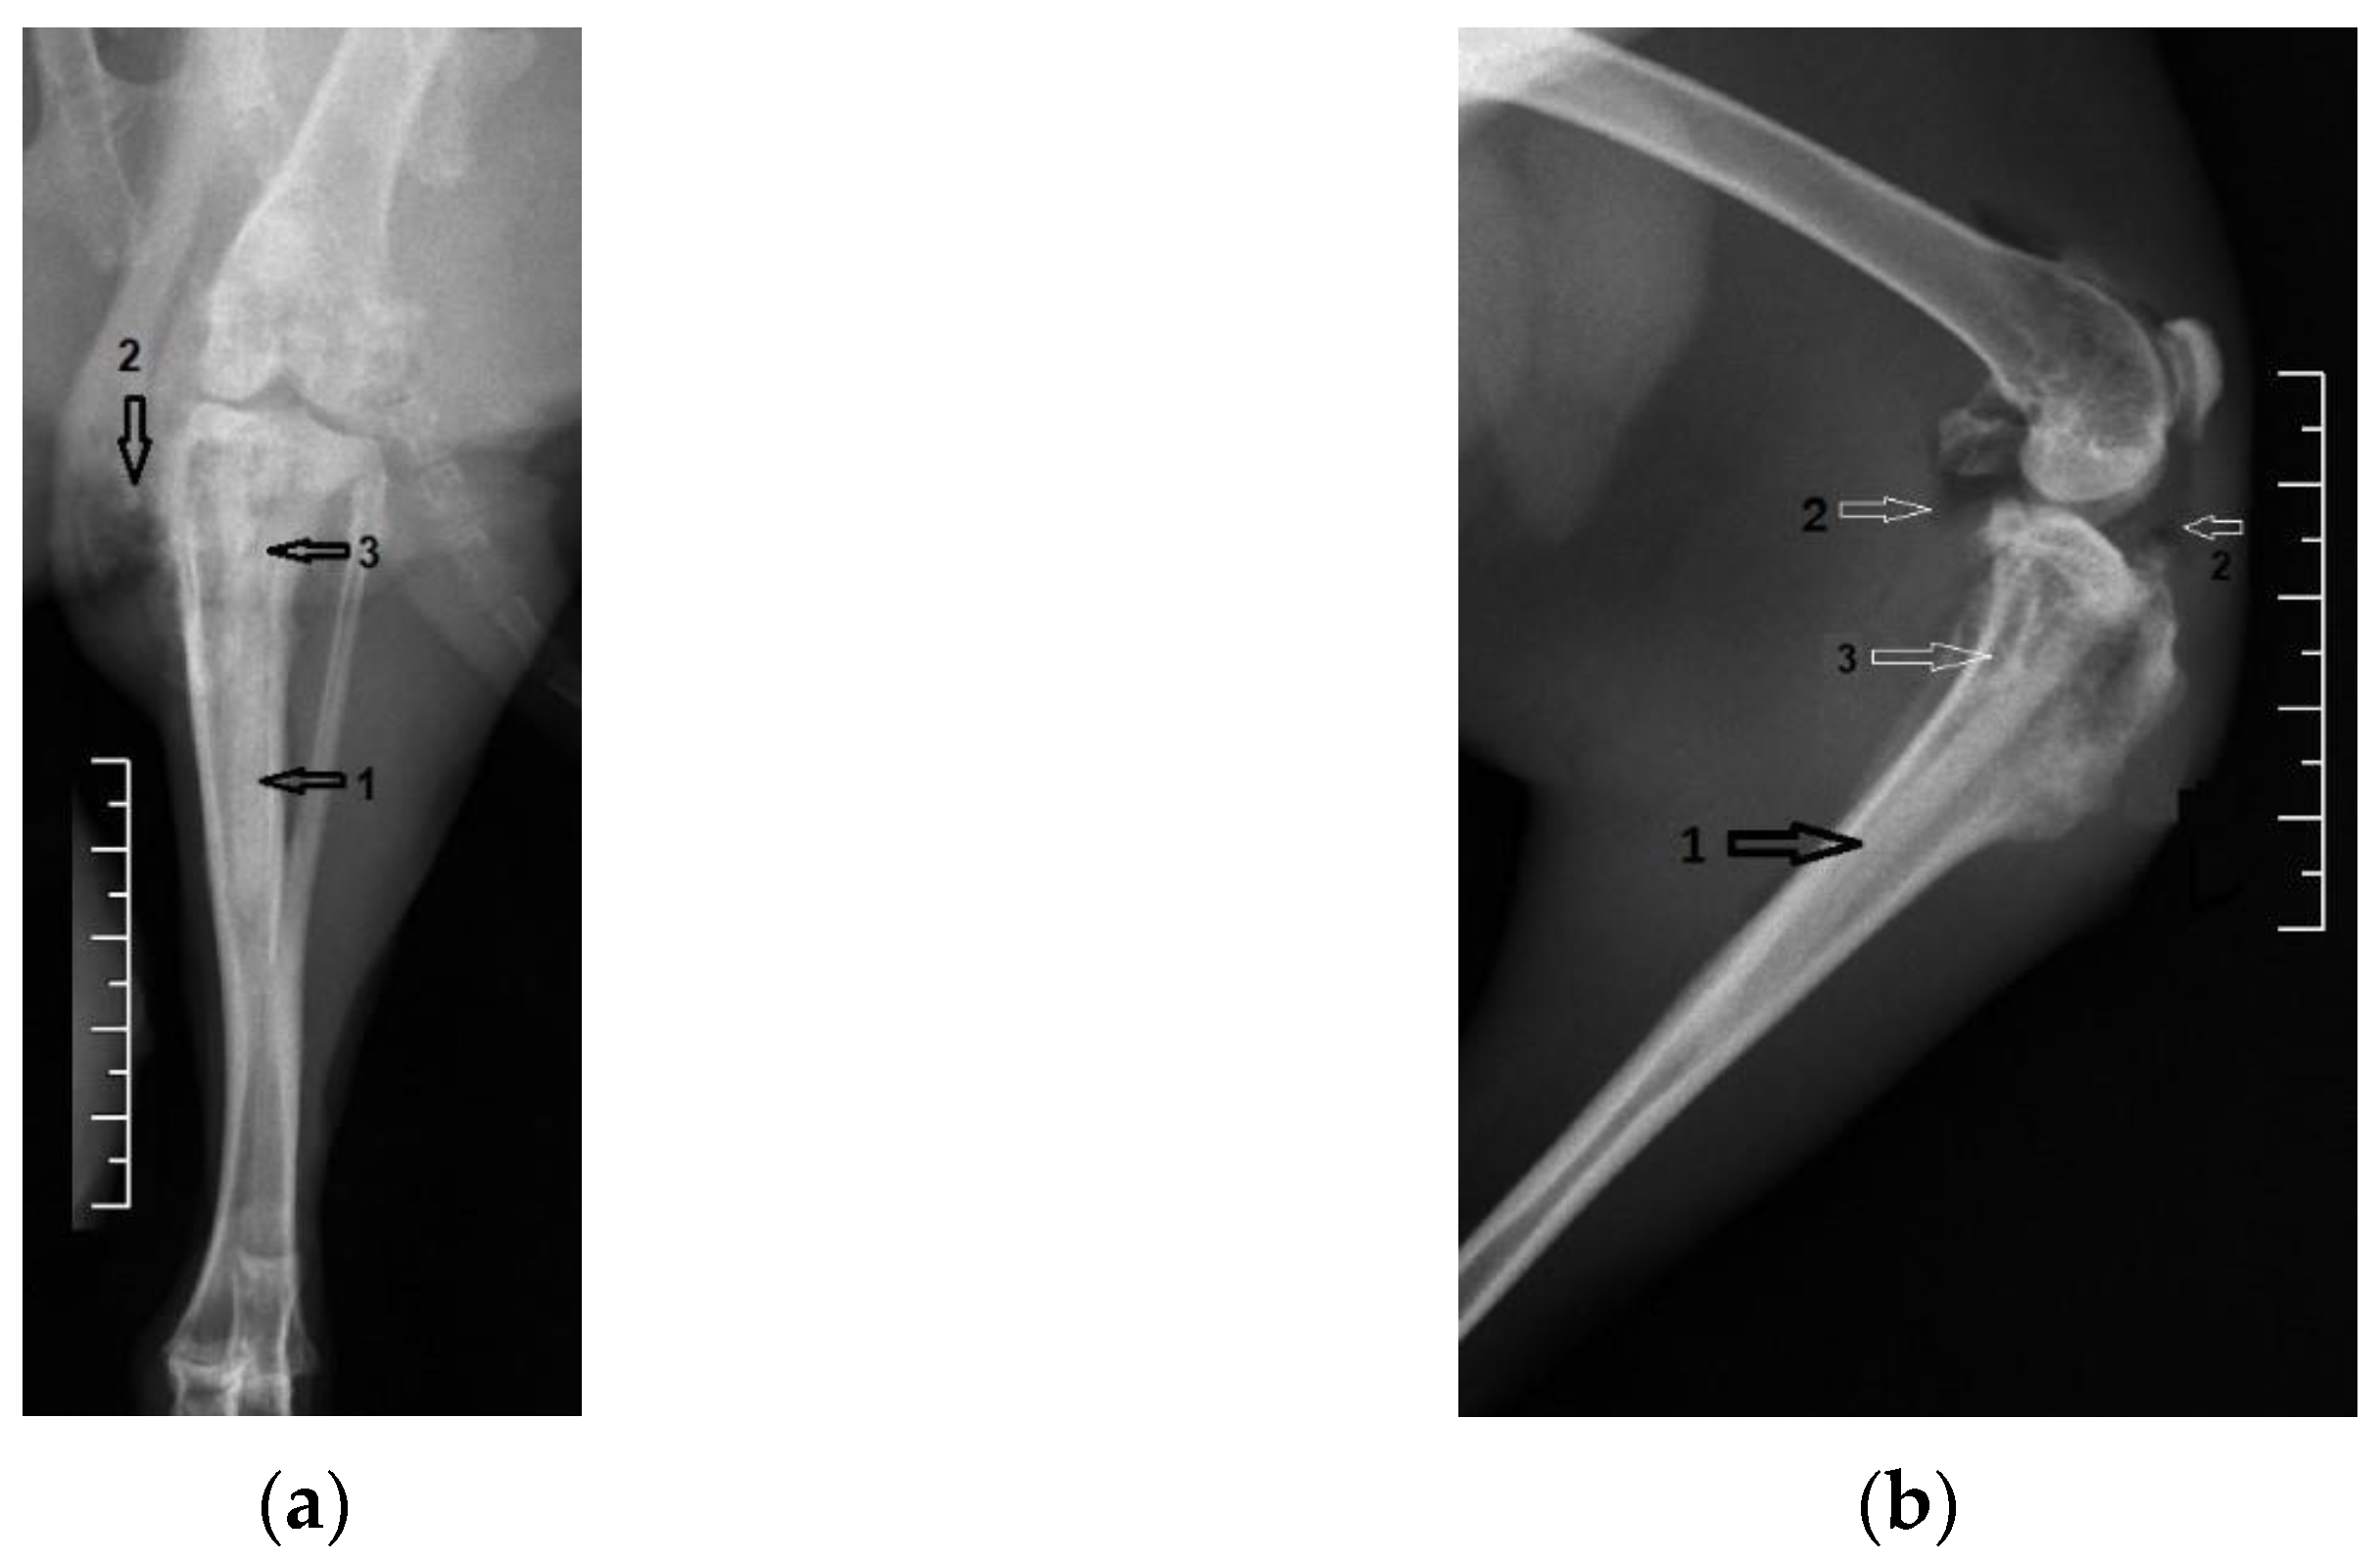
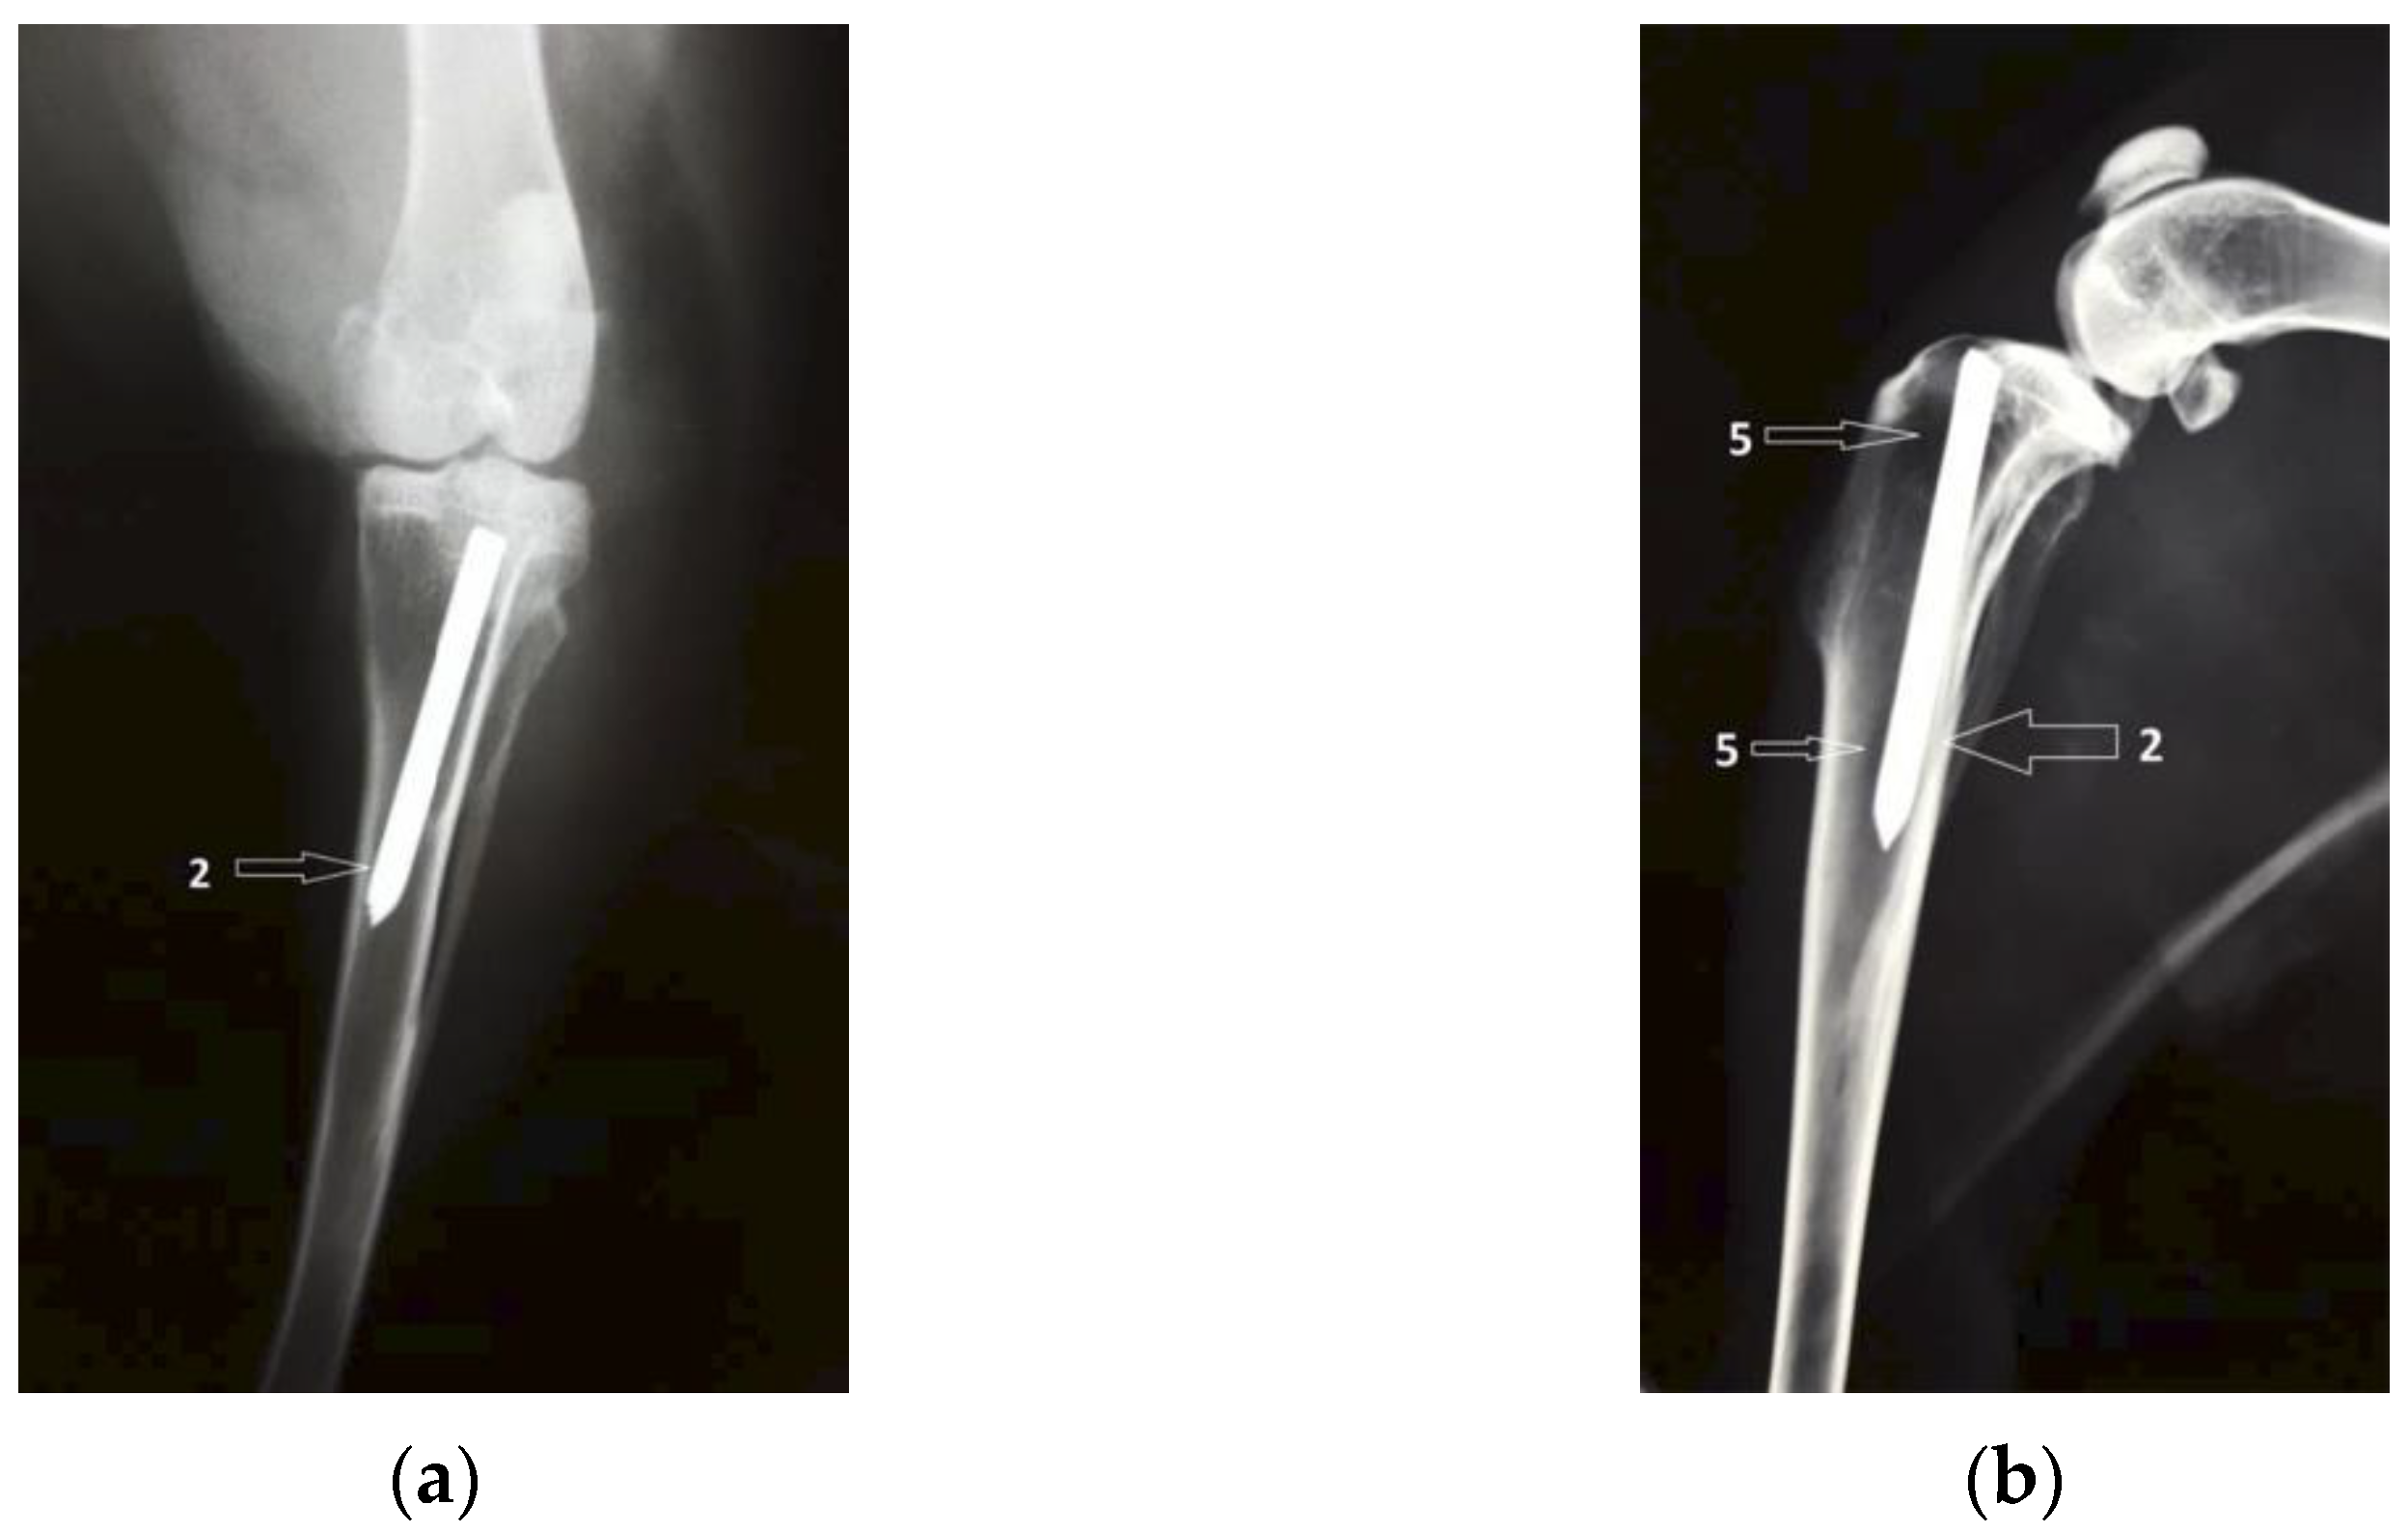
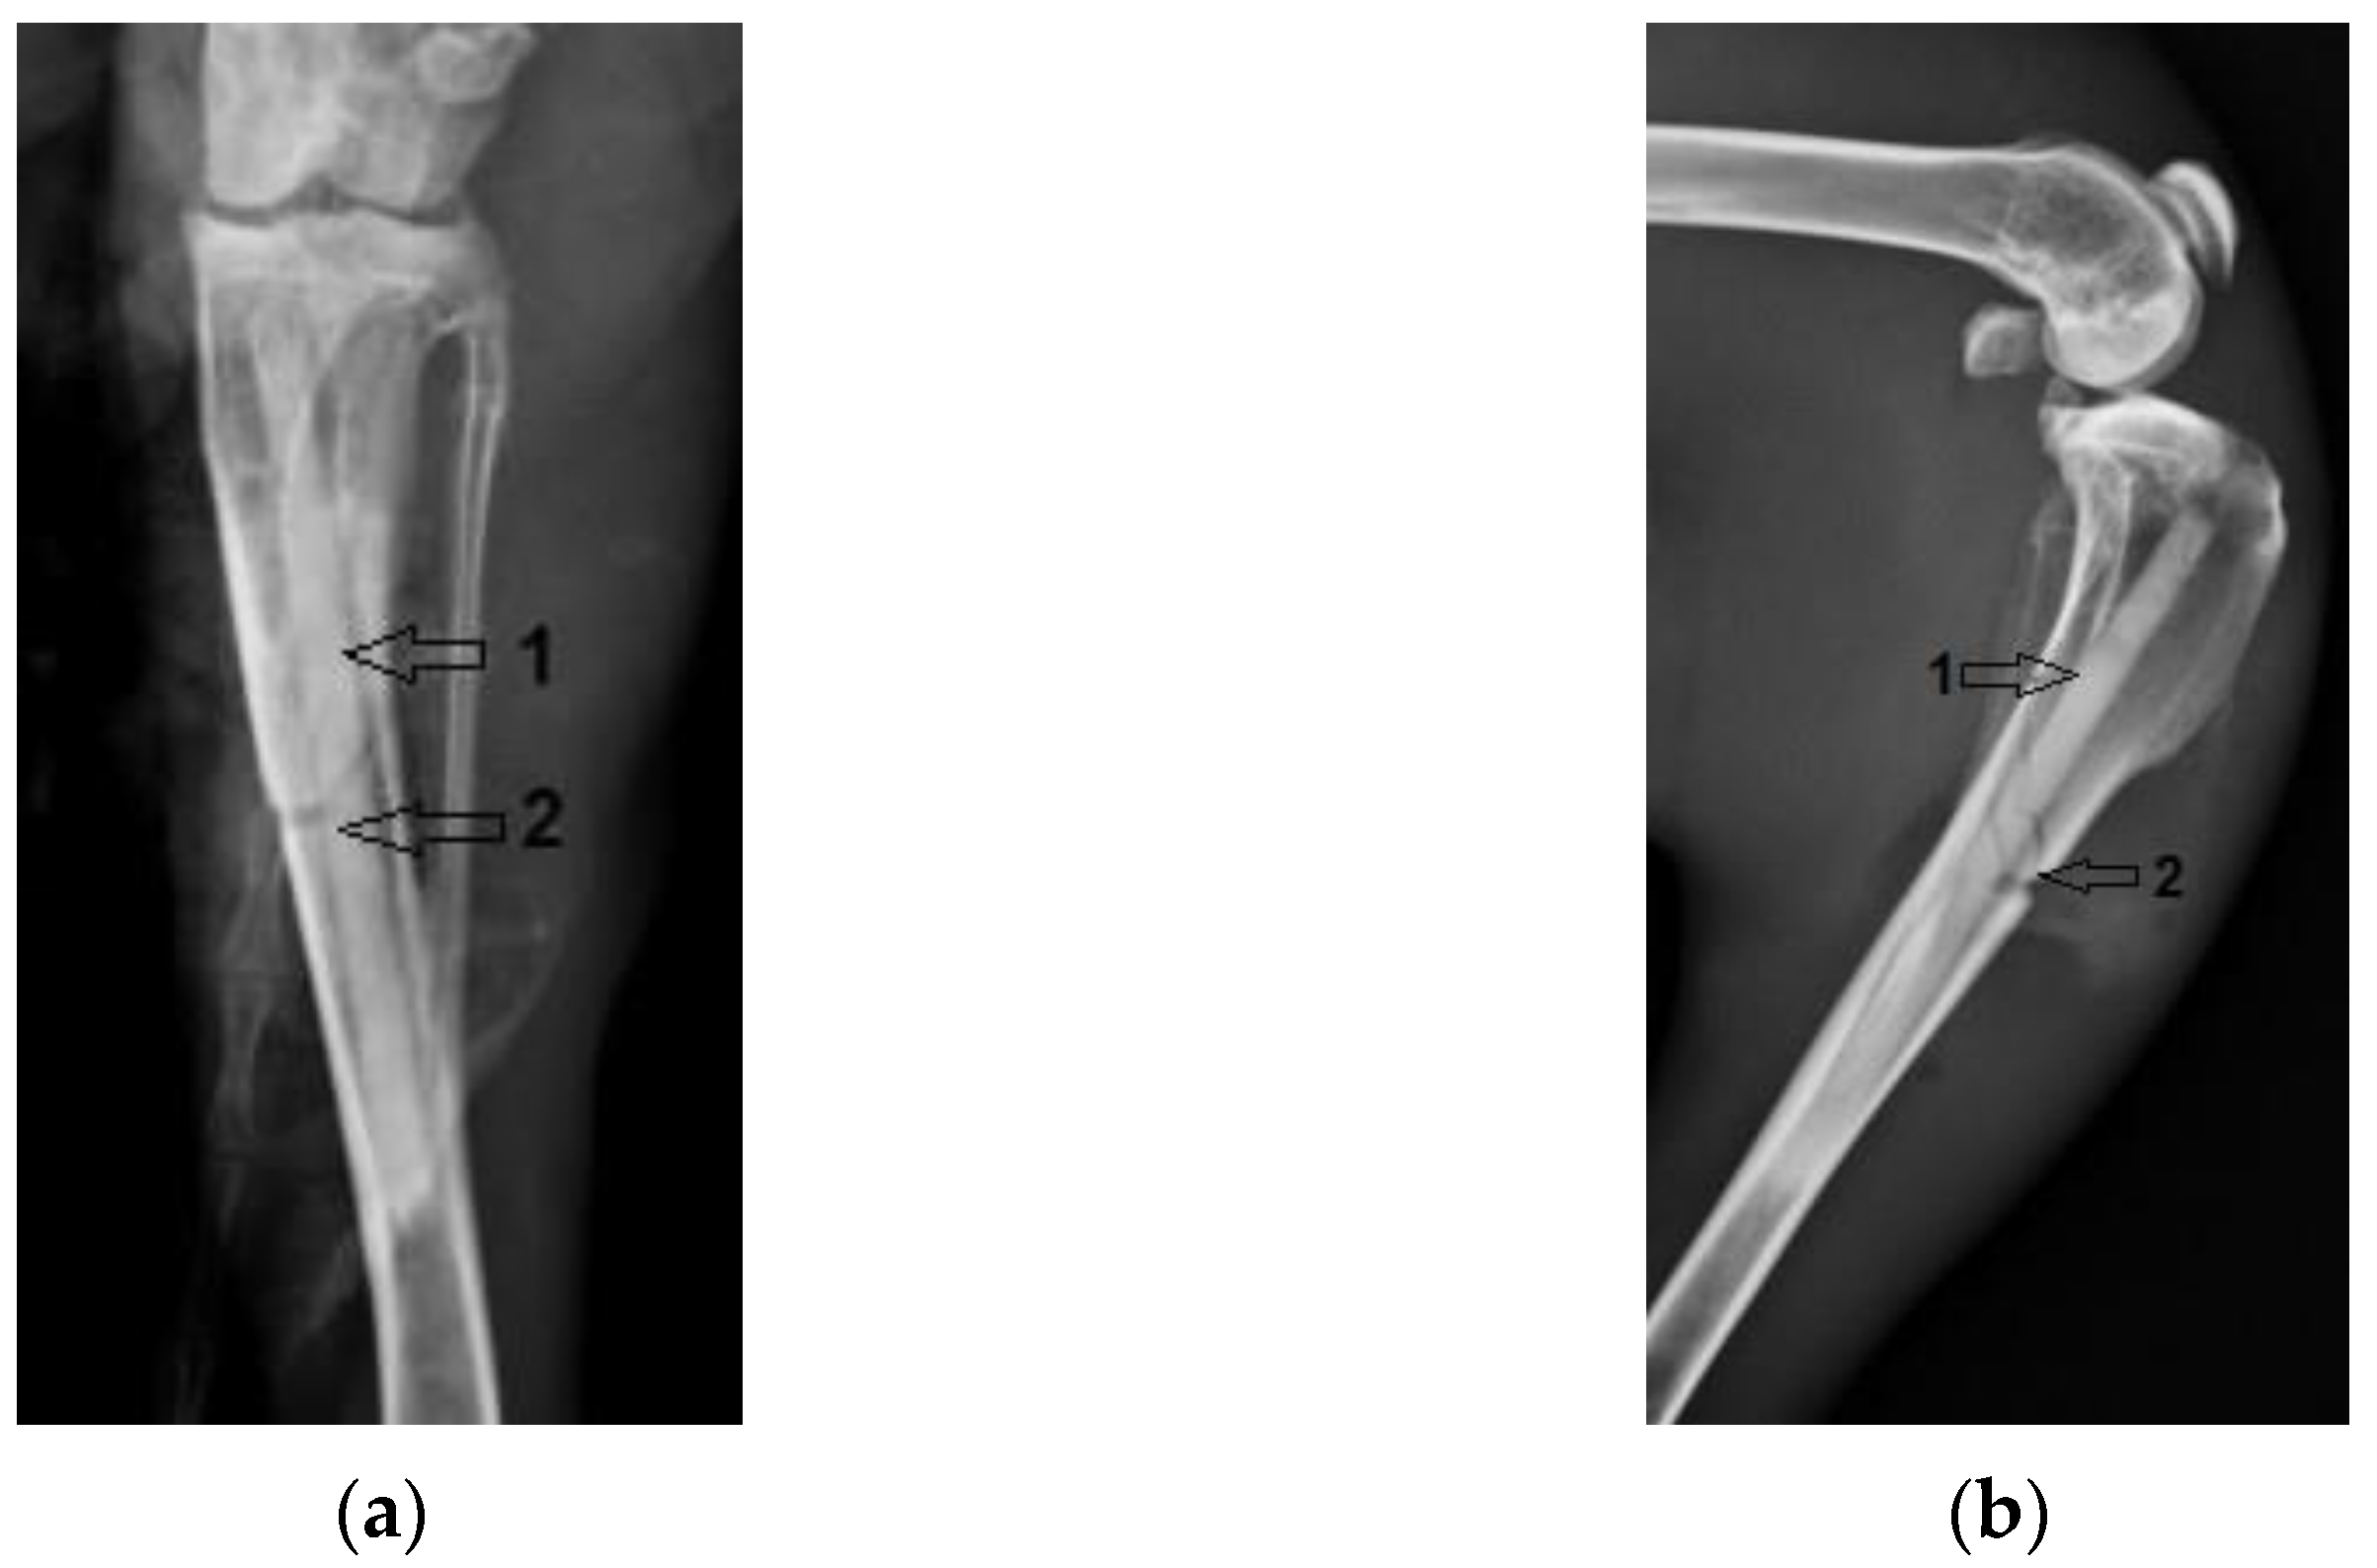
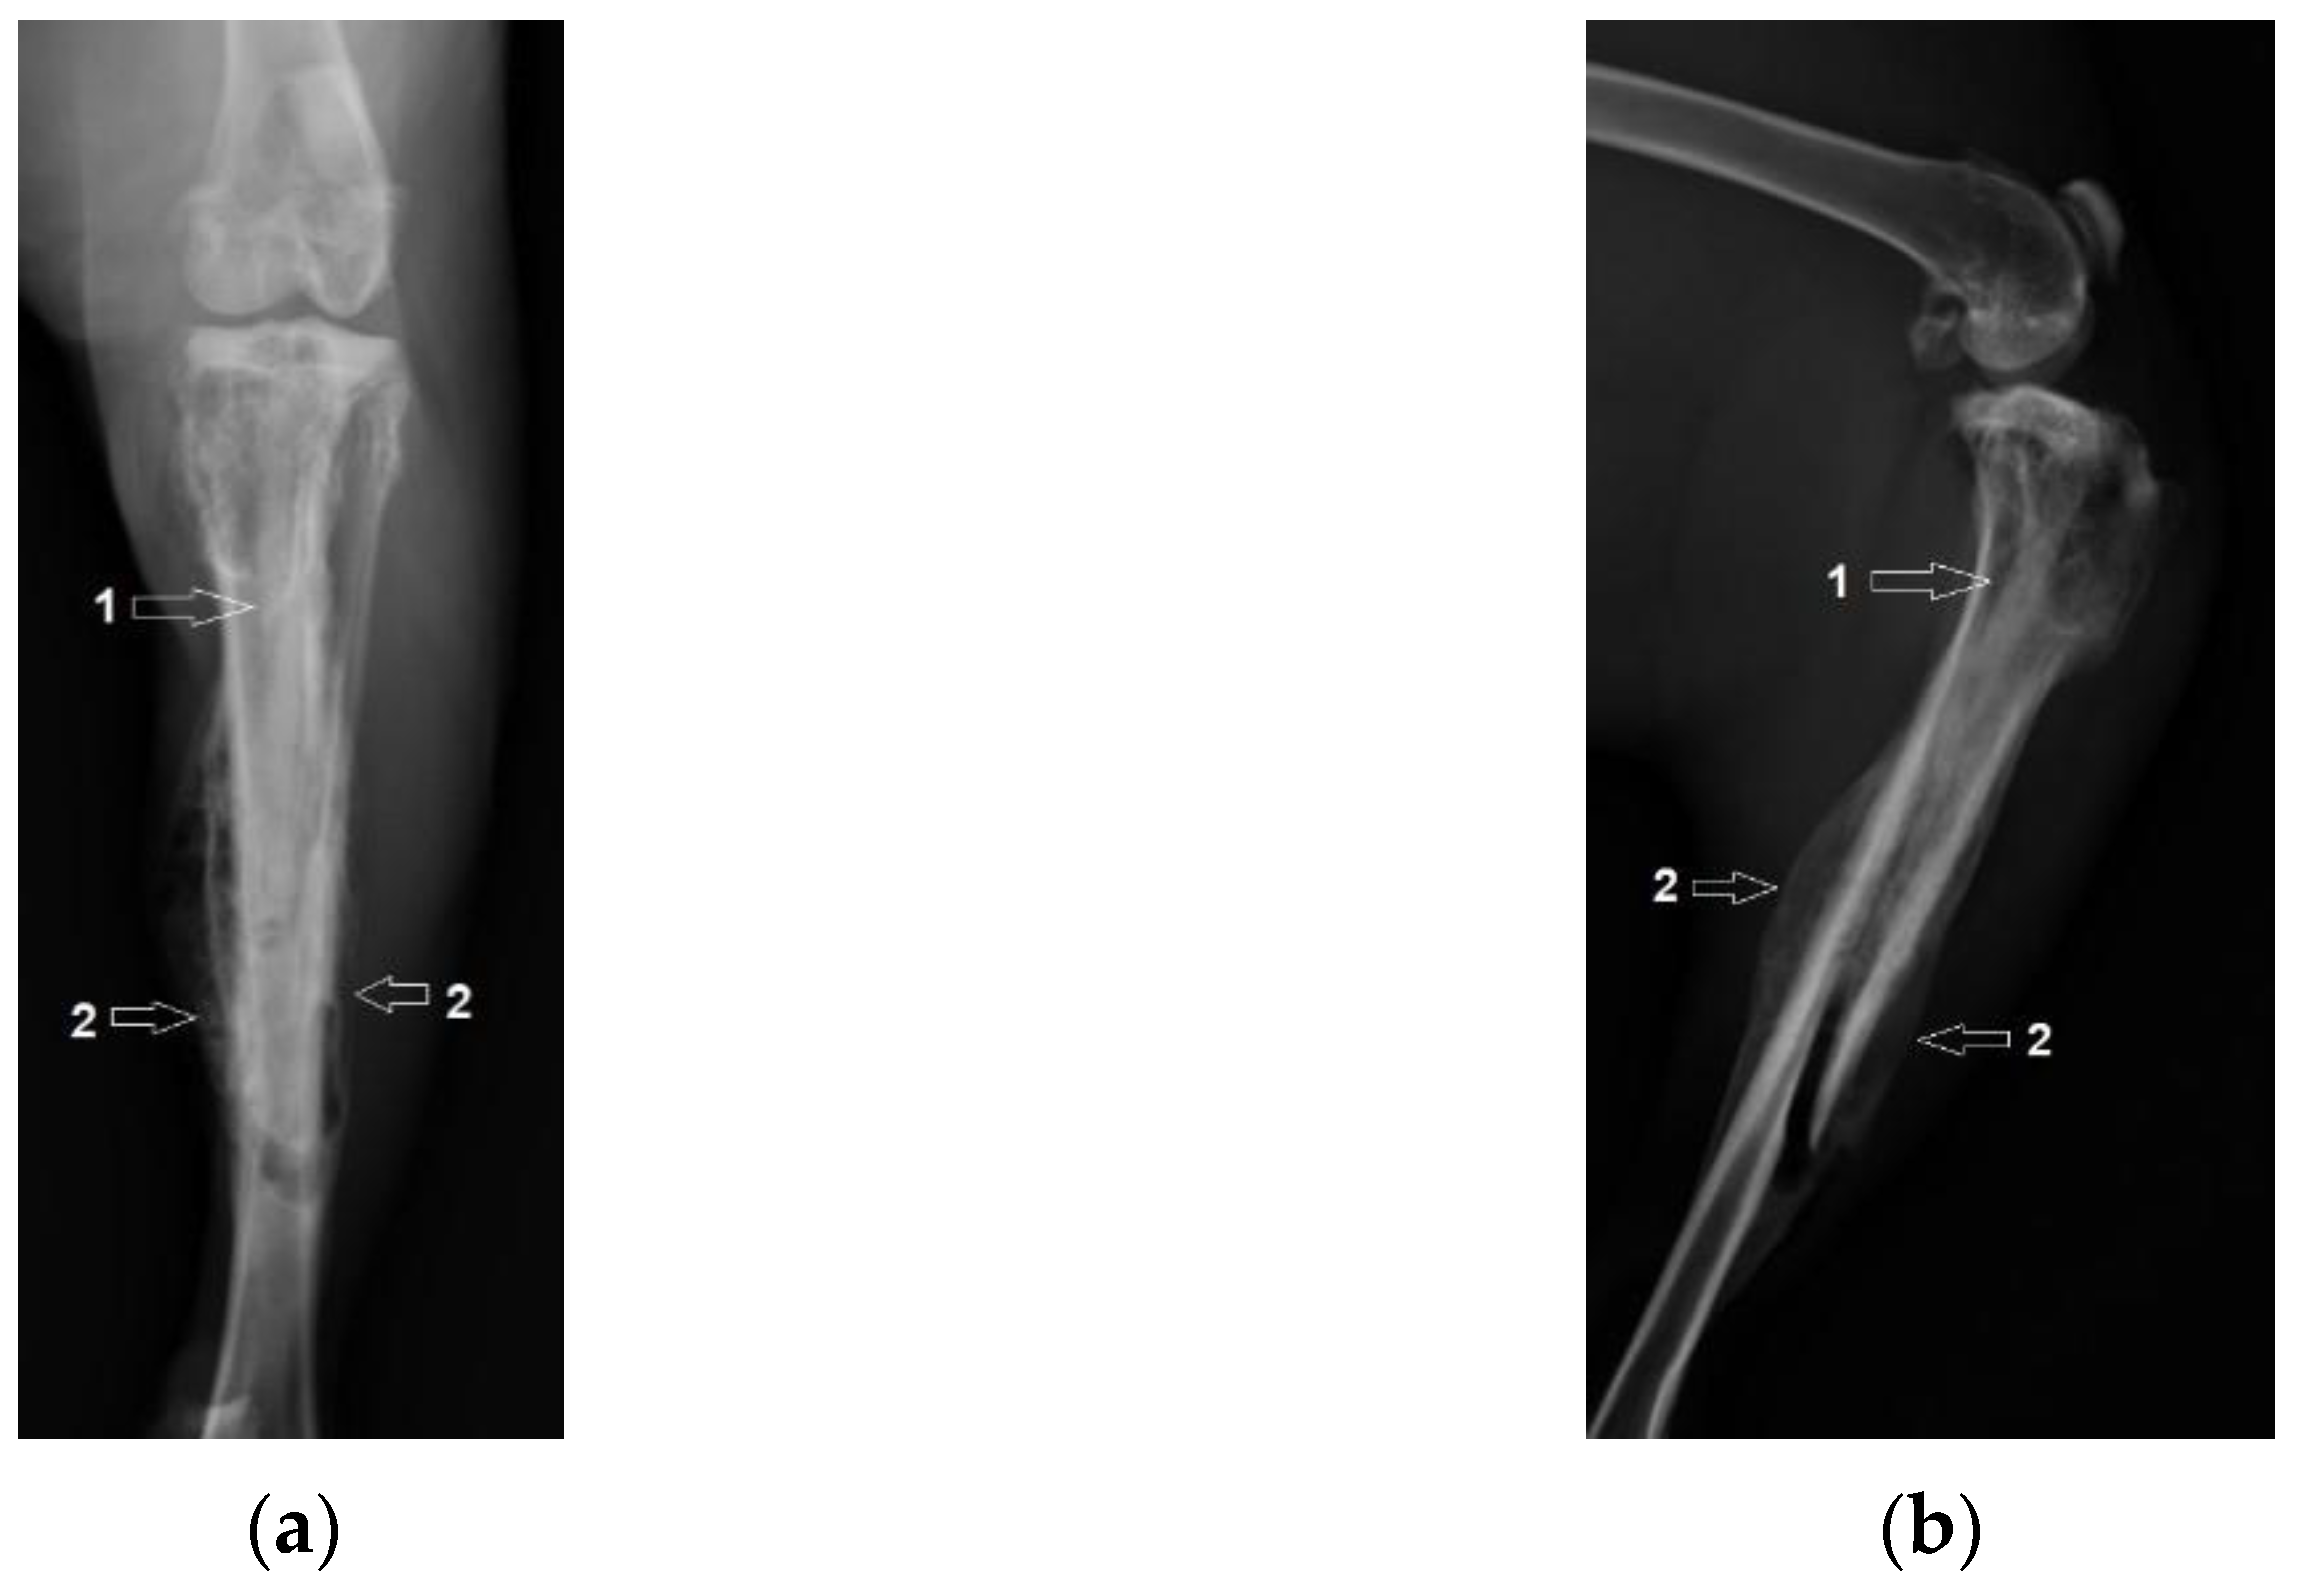
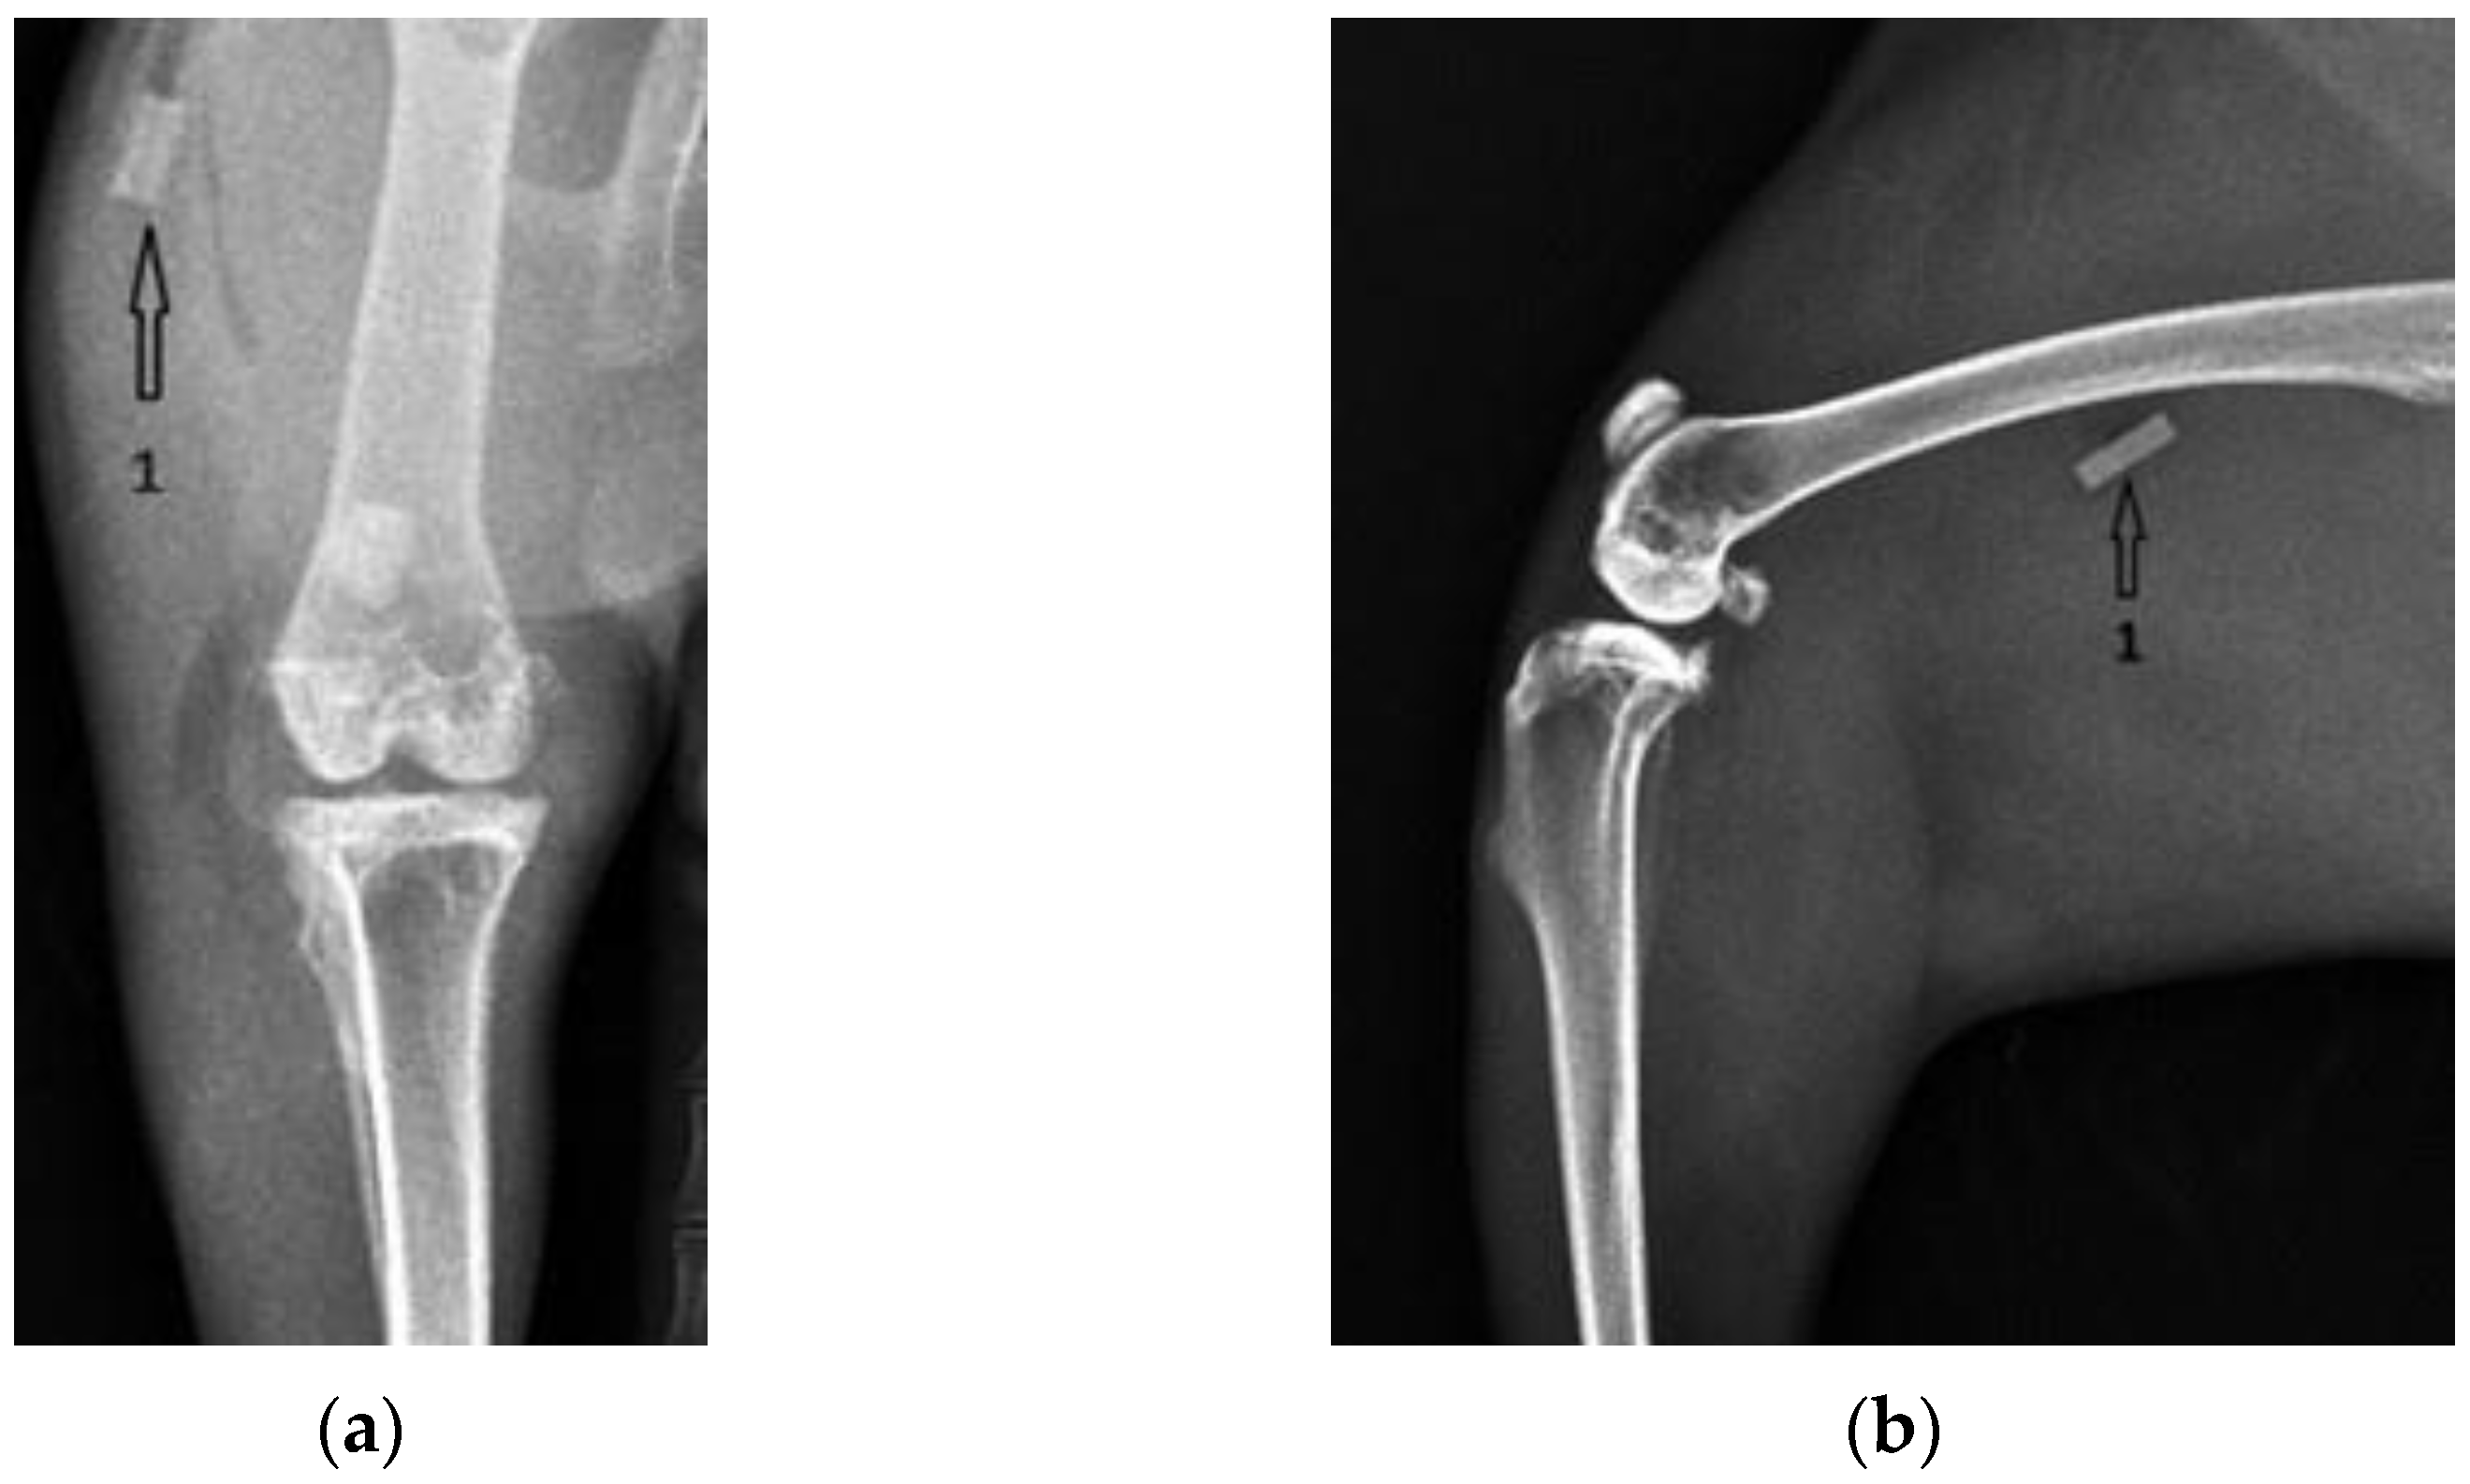
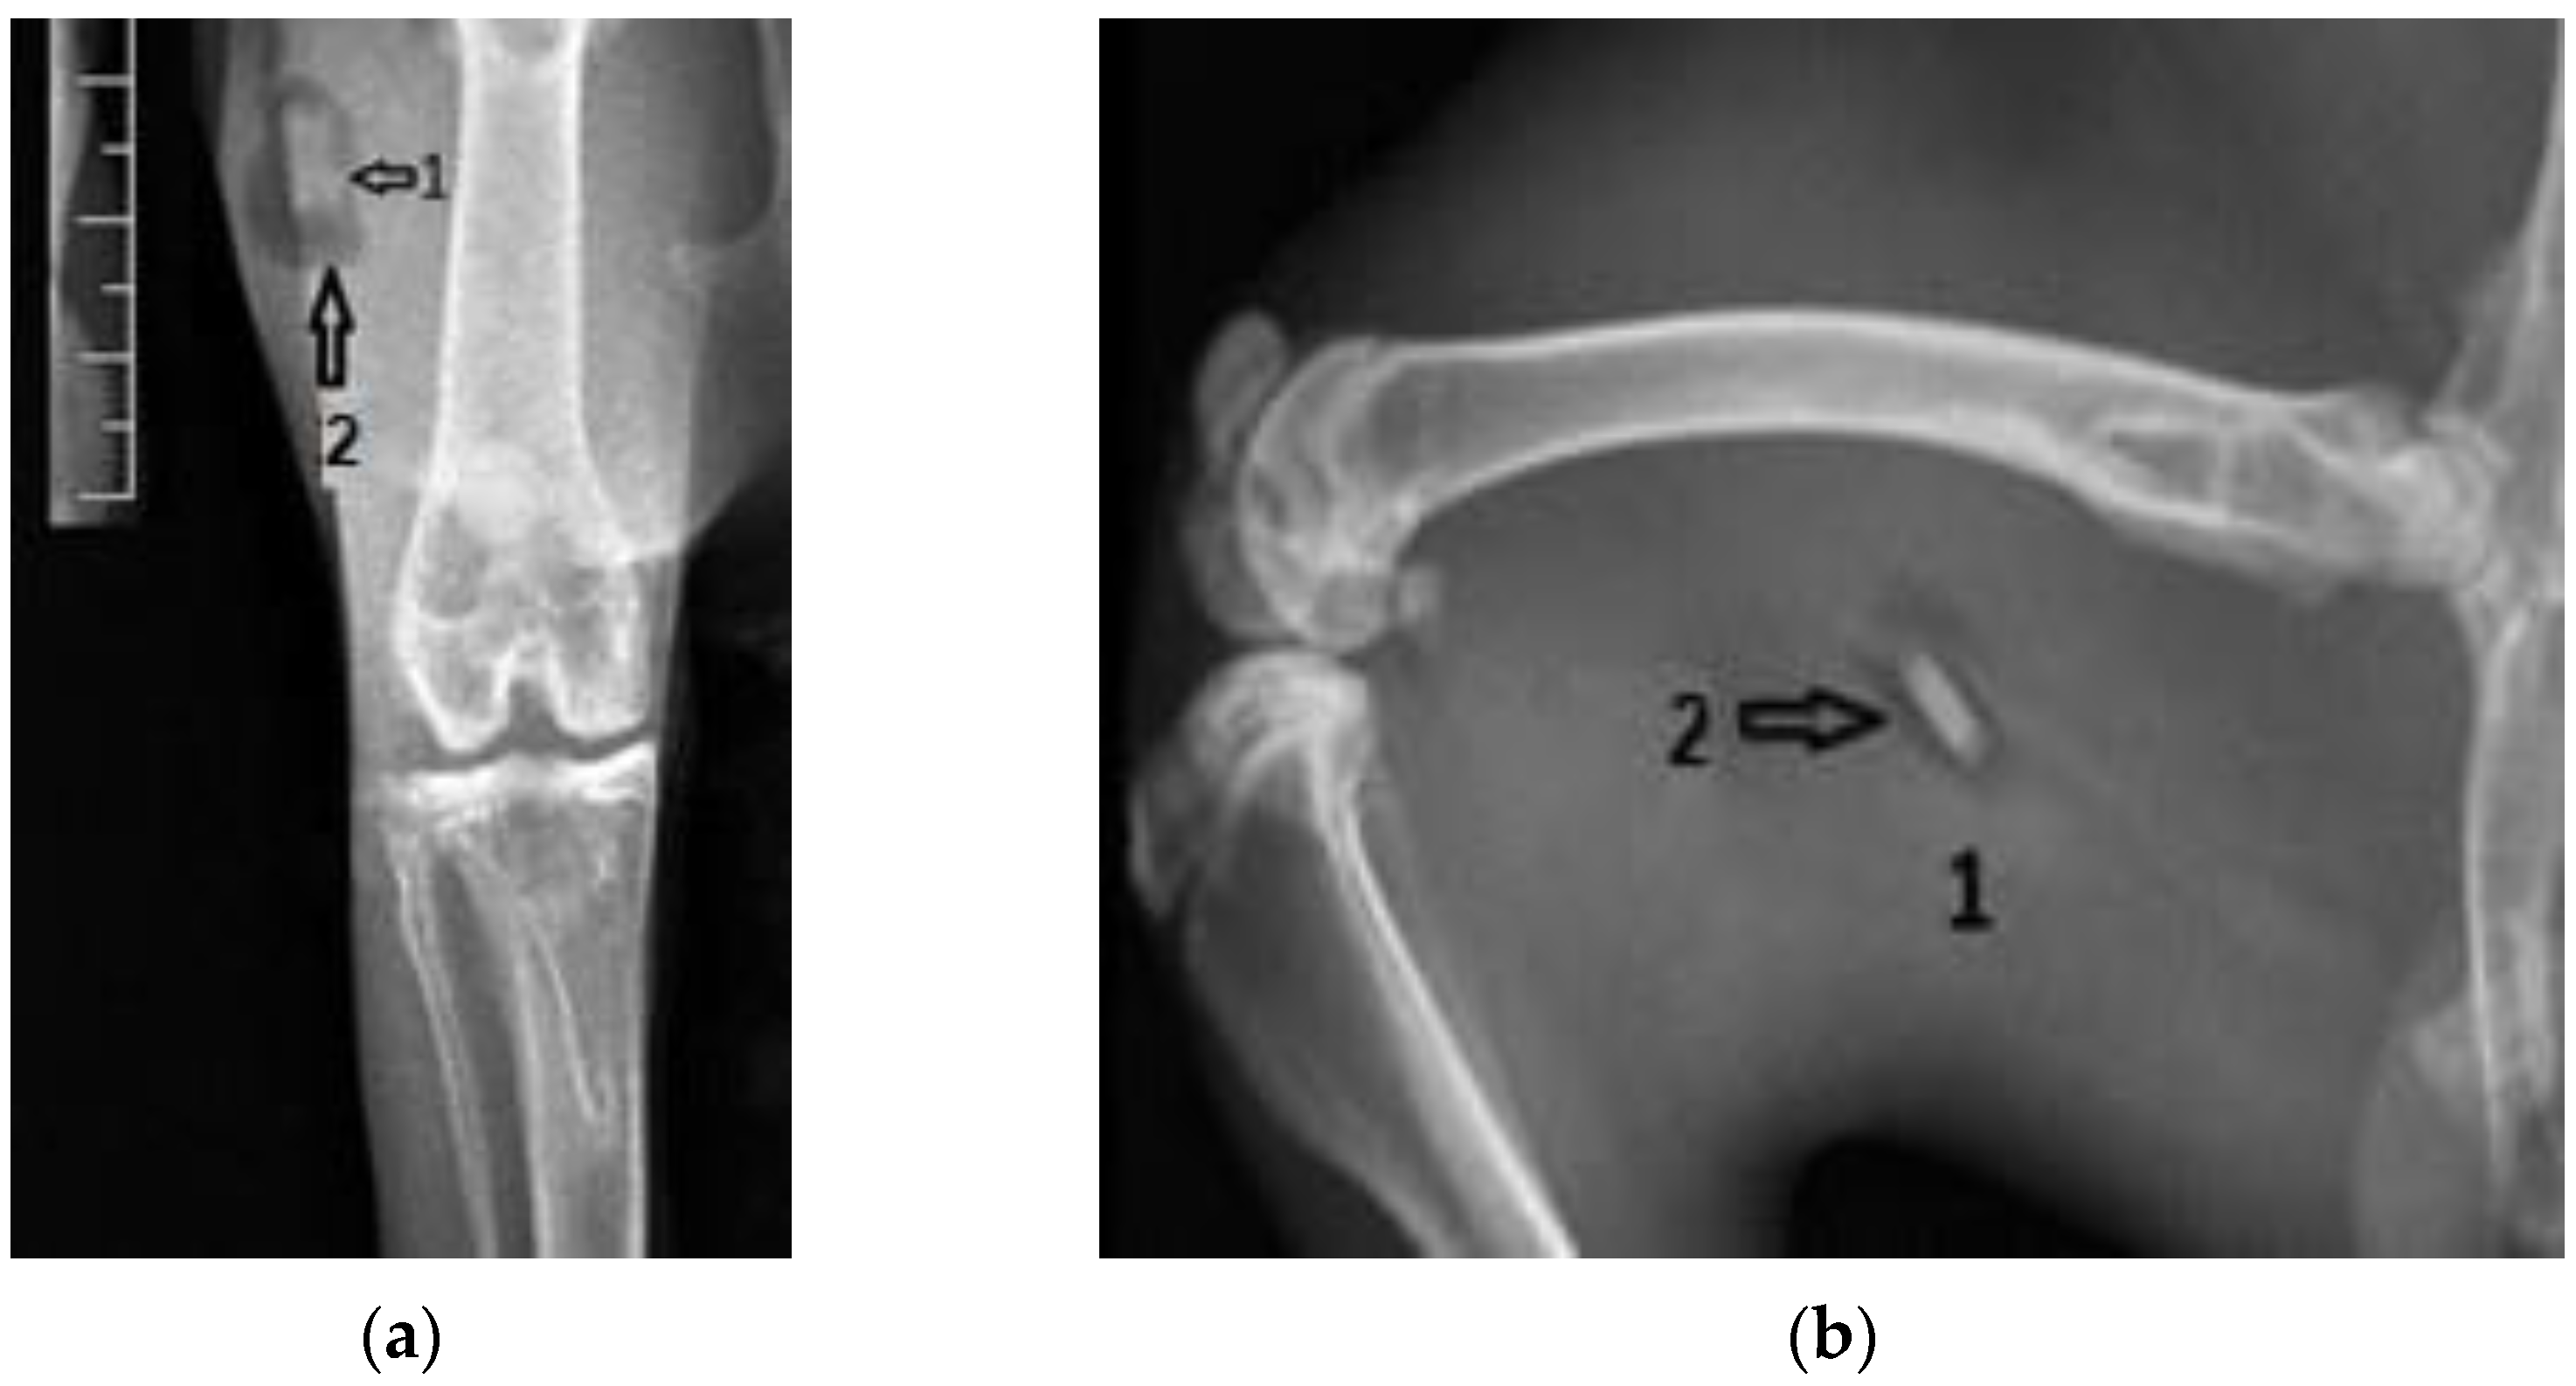
3.1. Radiological Followup
3.2. Clinical Evolution
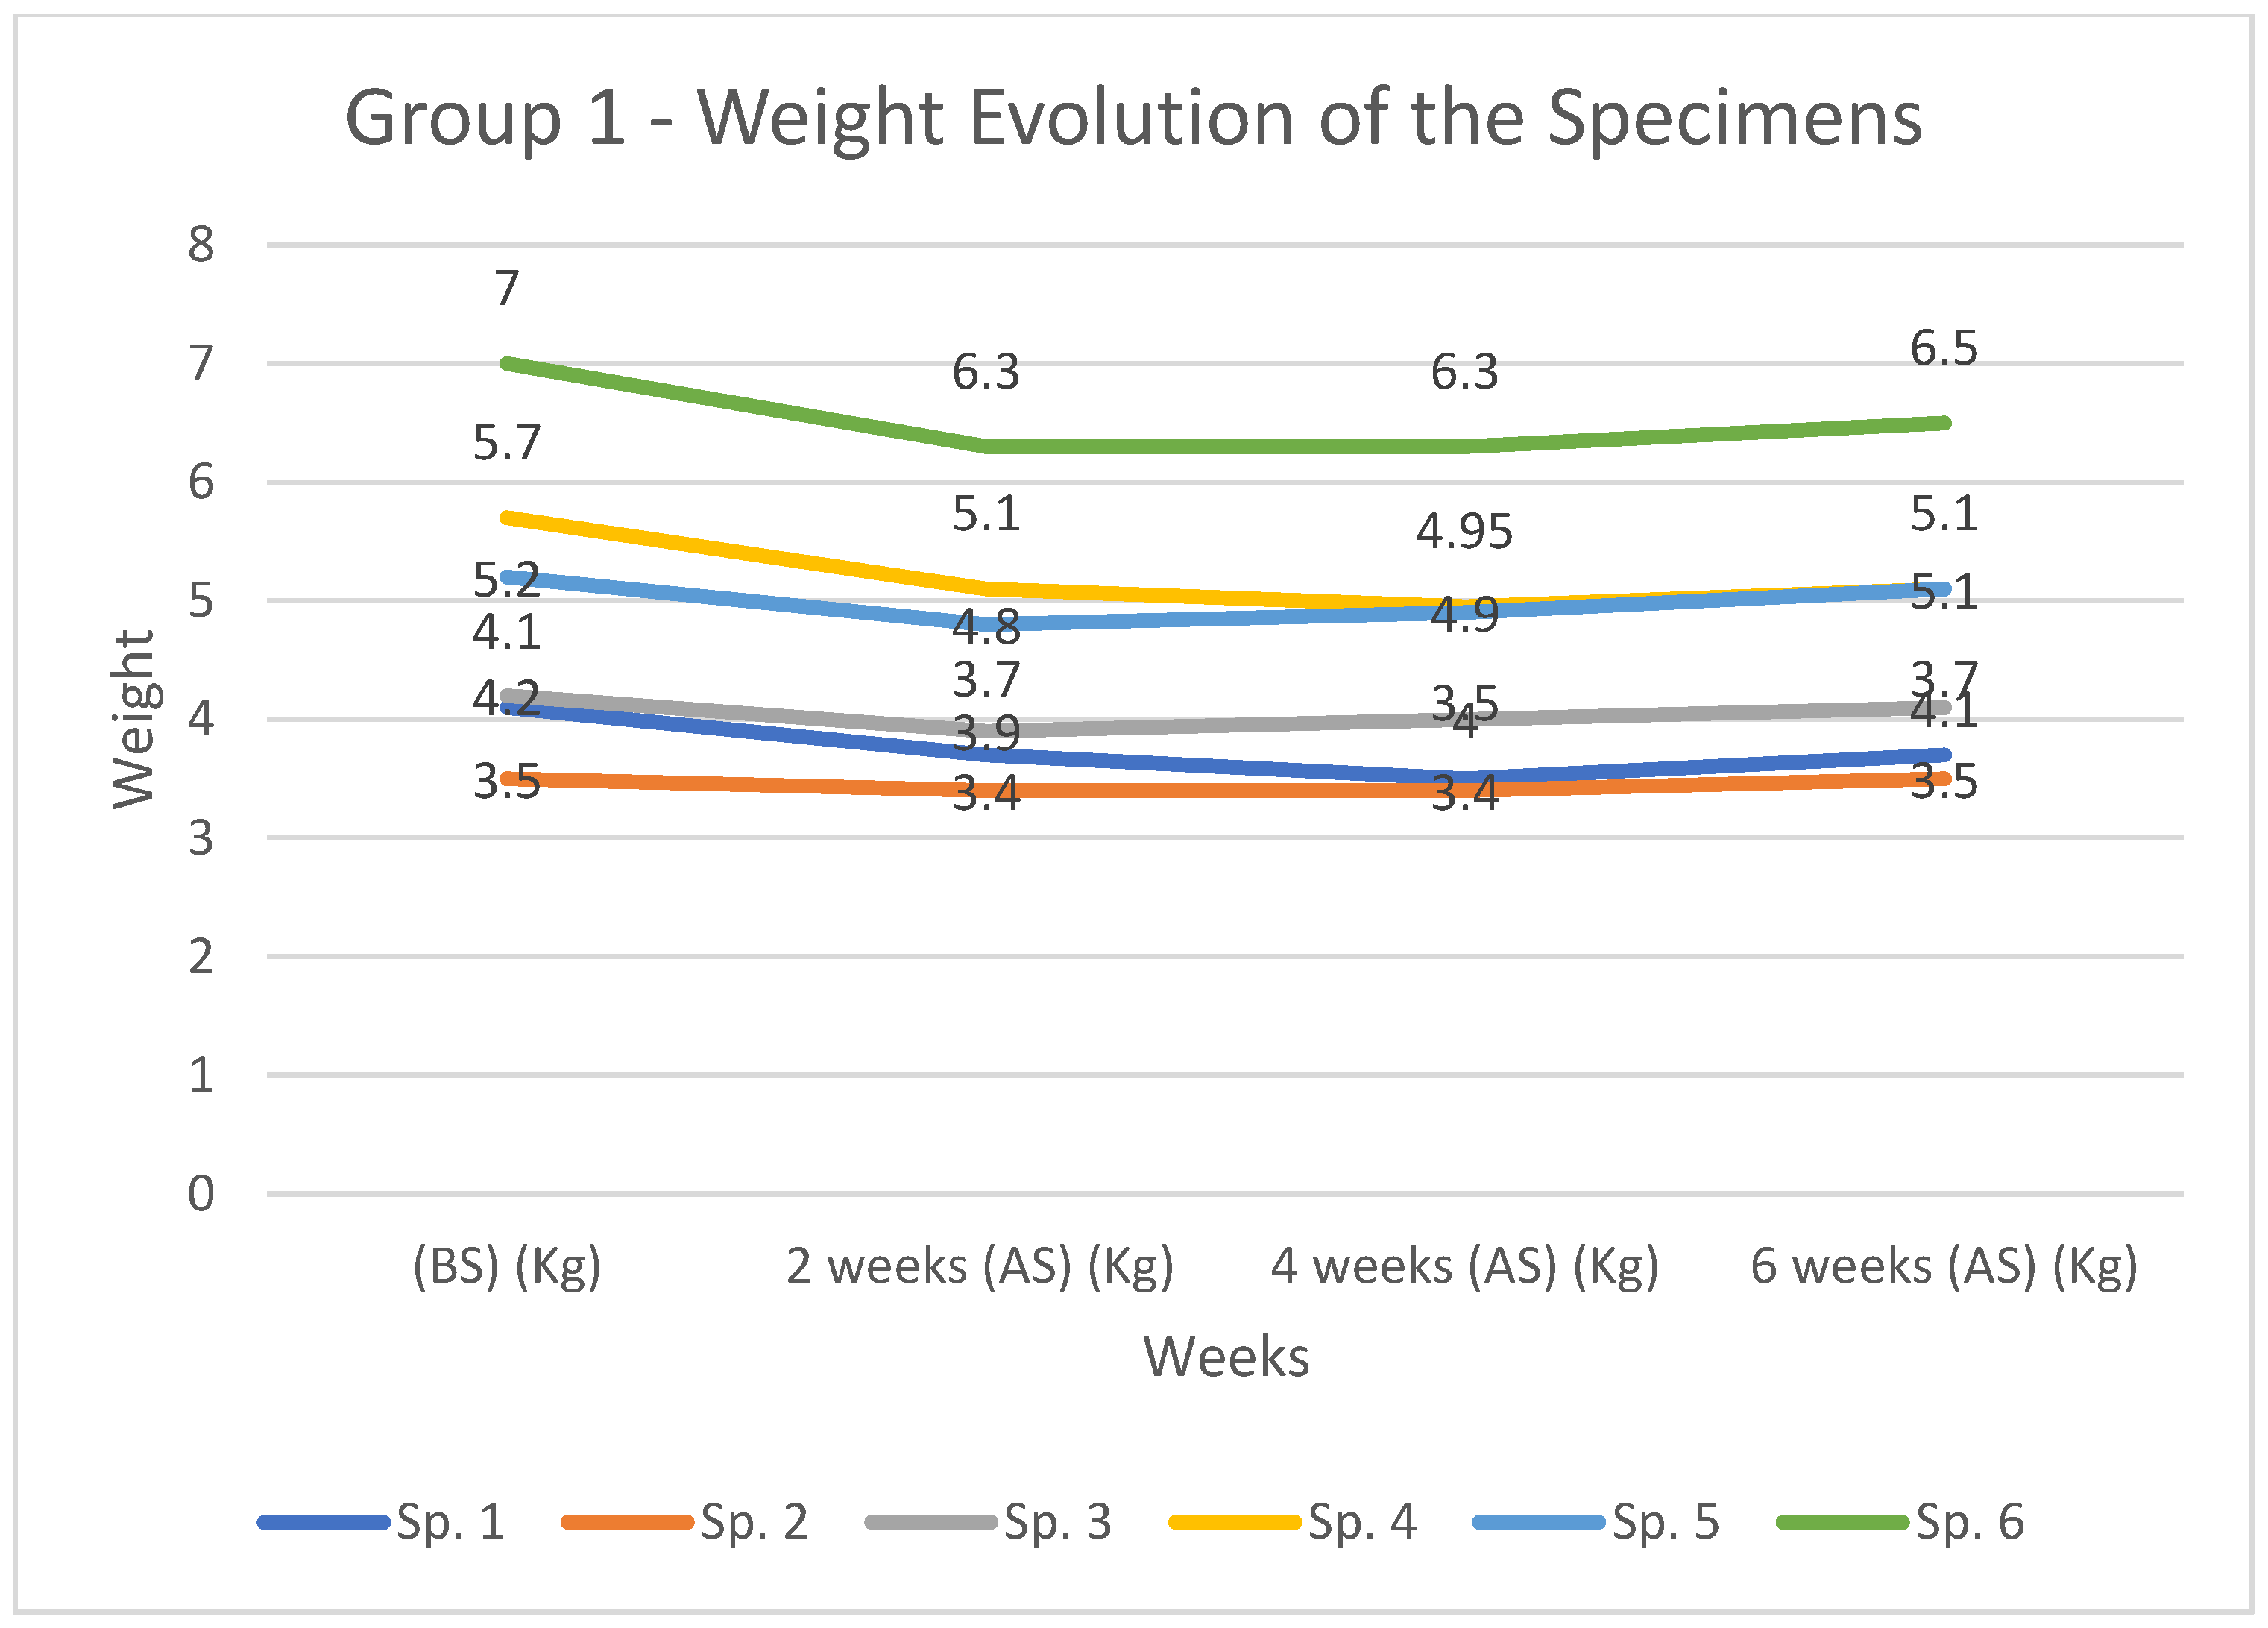
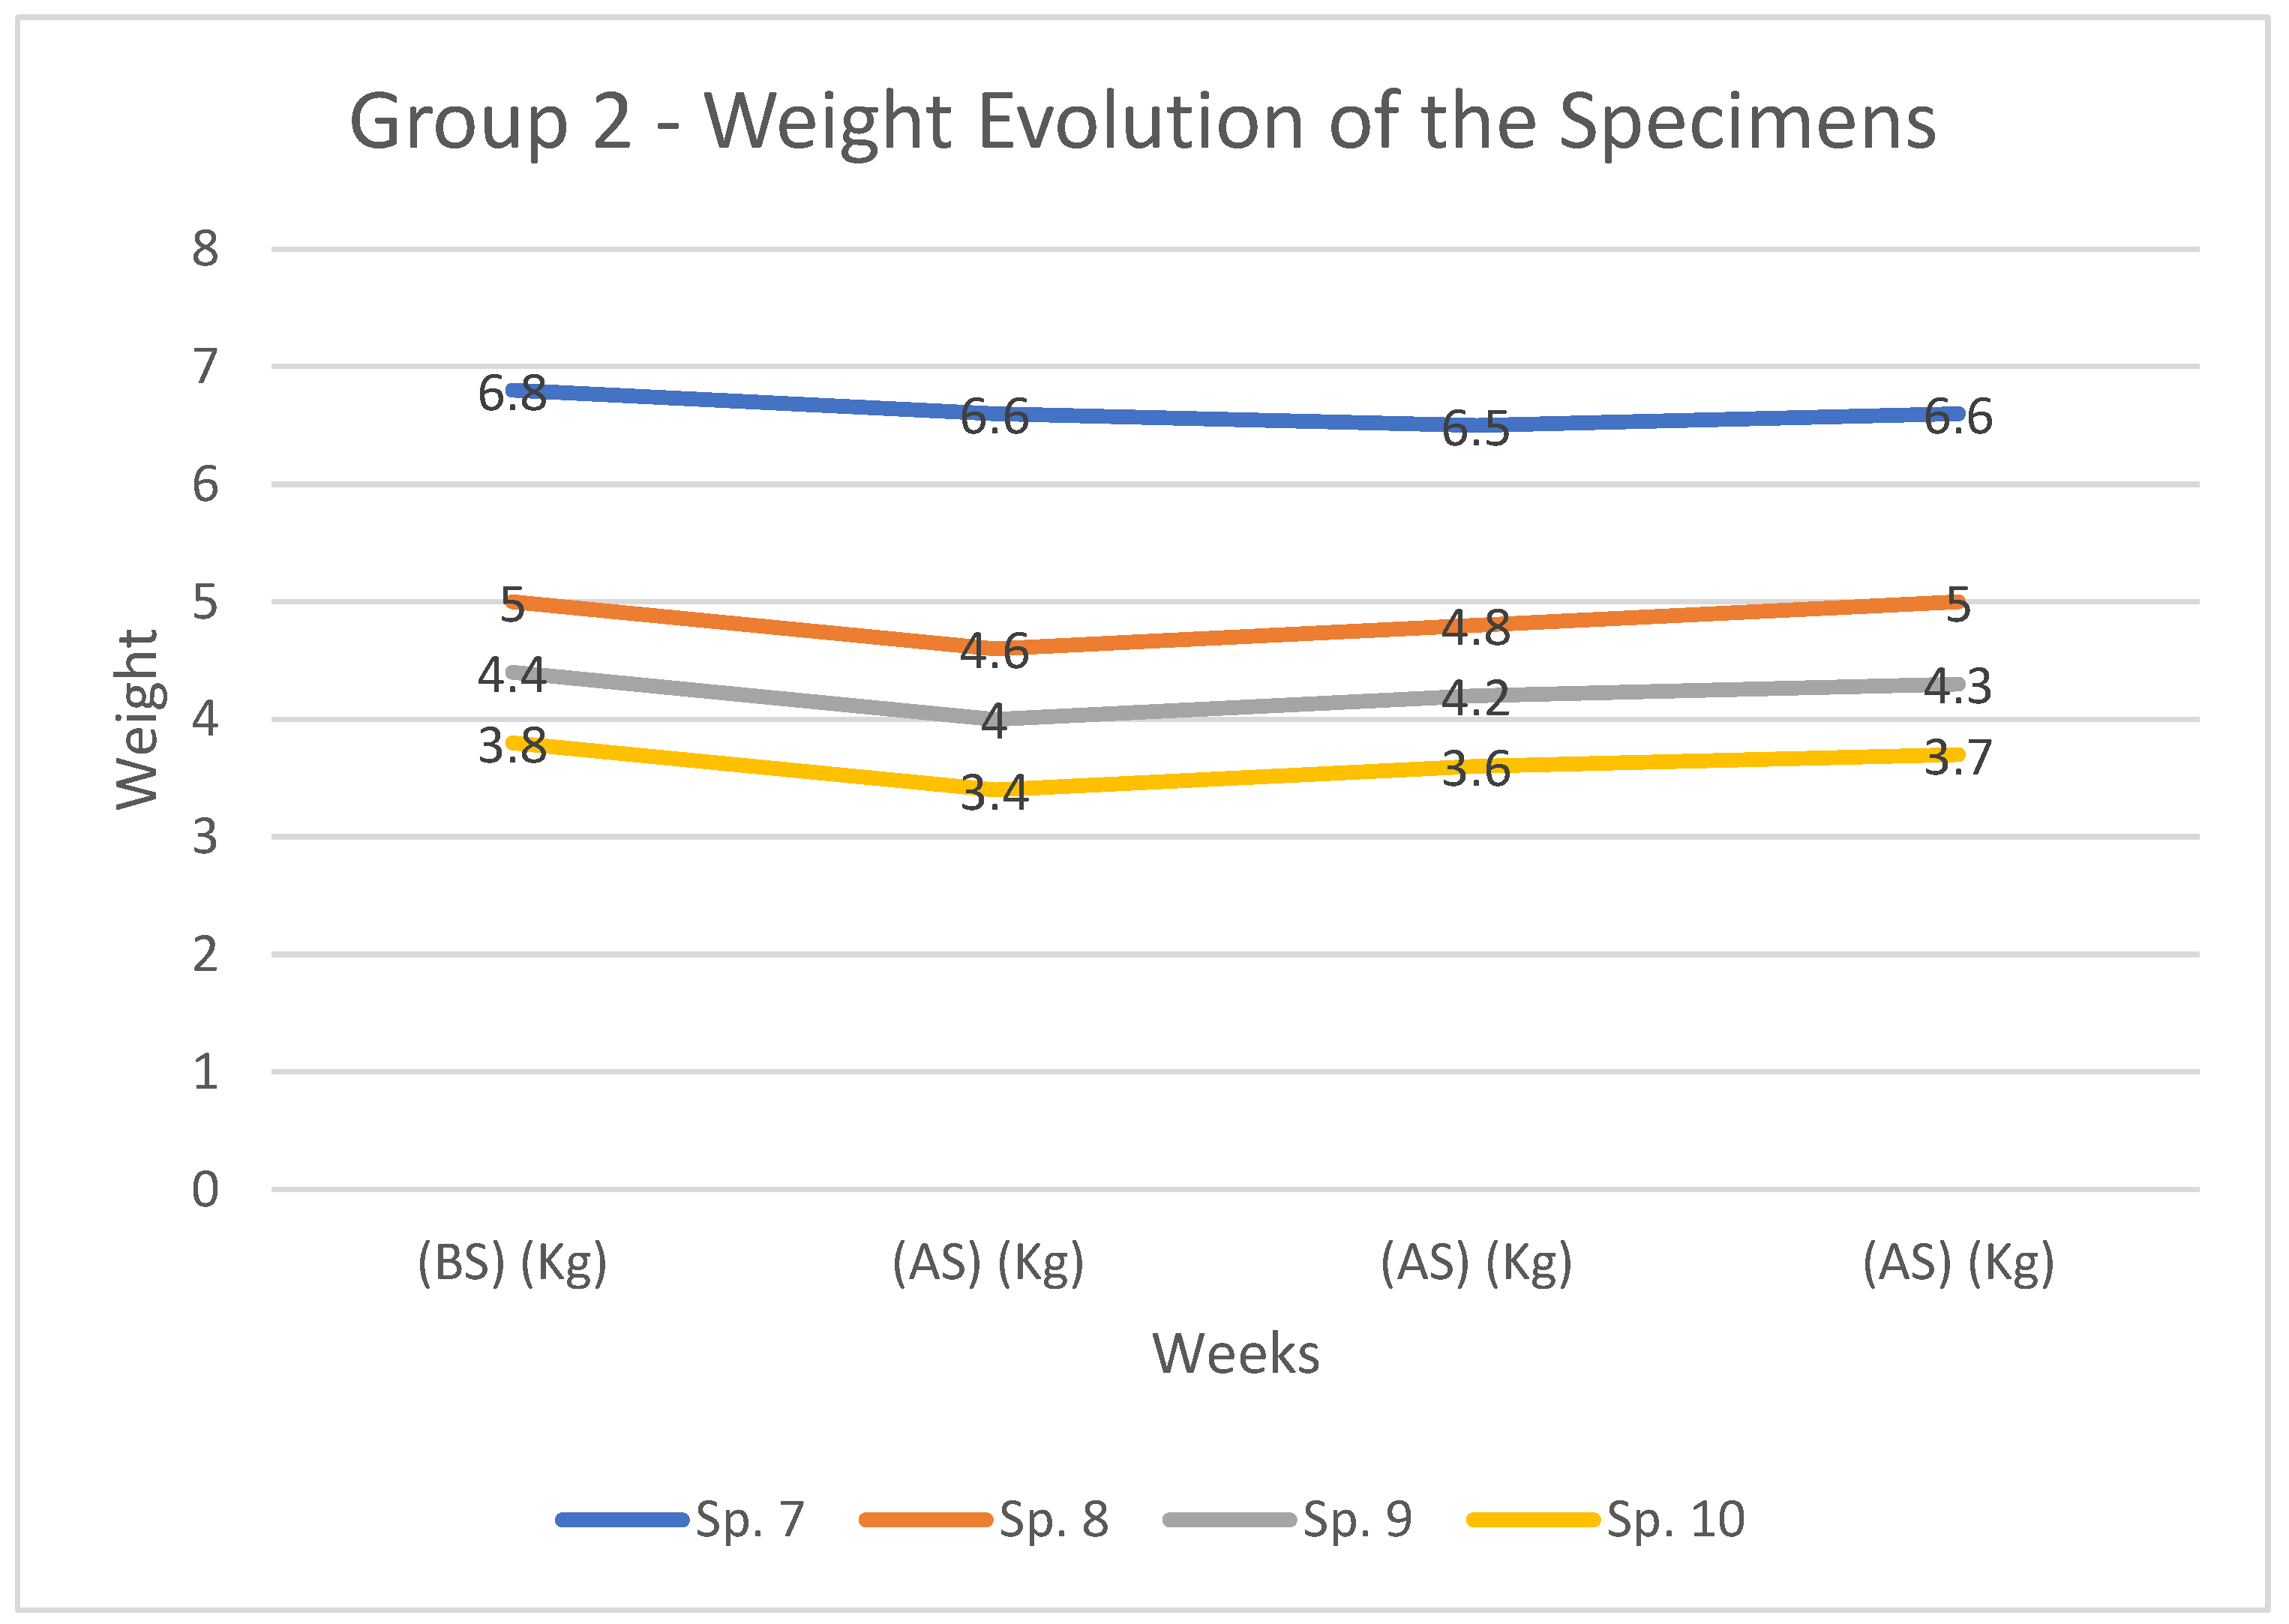
3.2.1. Weight Evolution
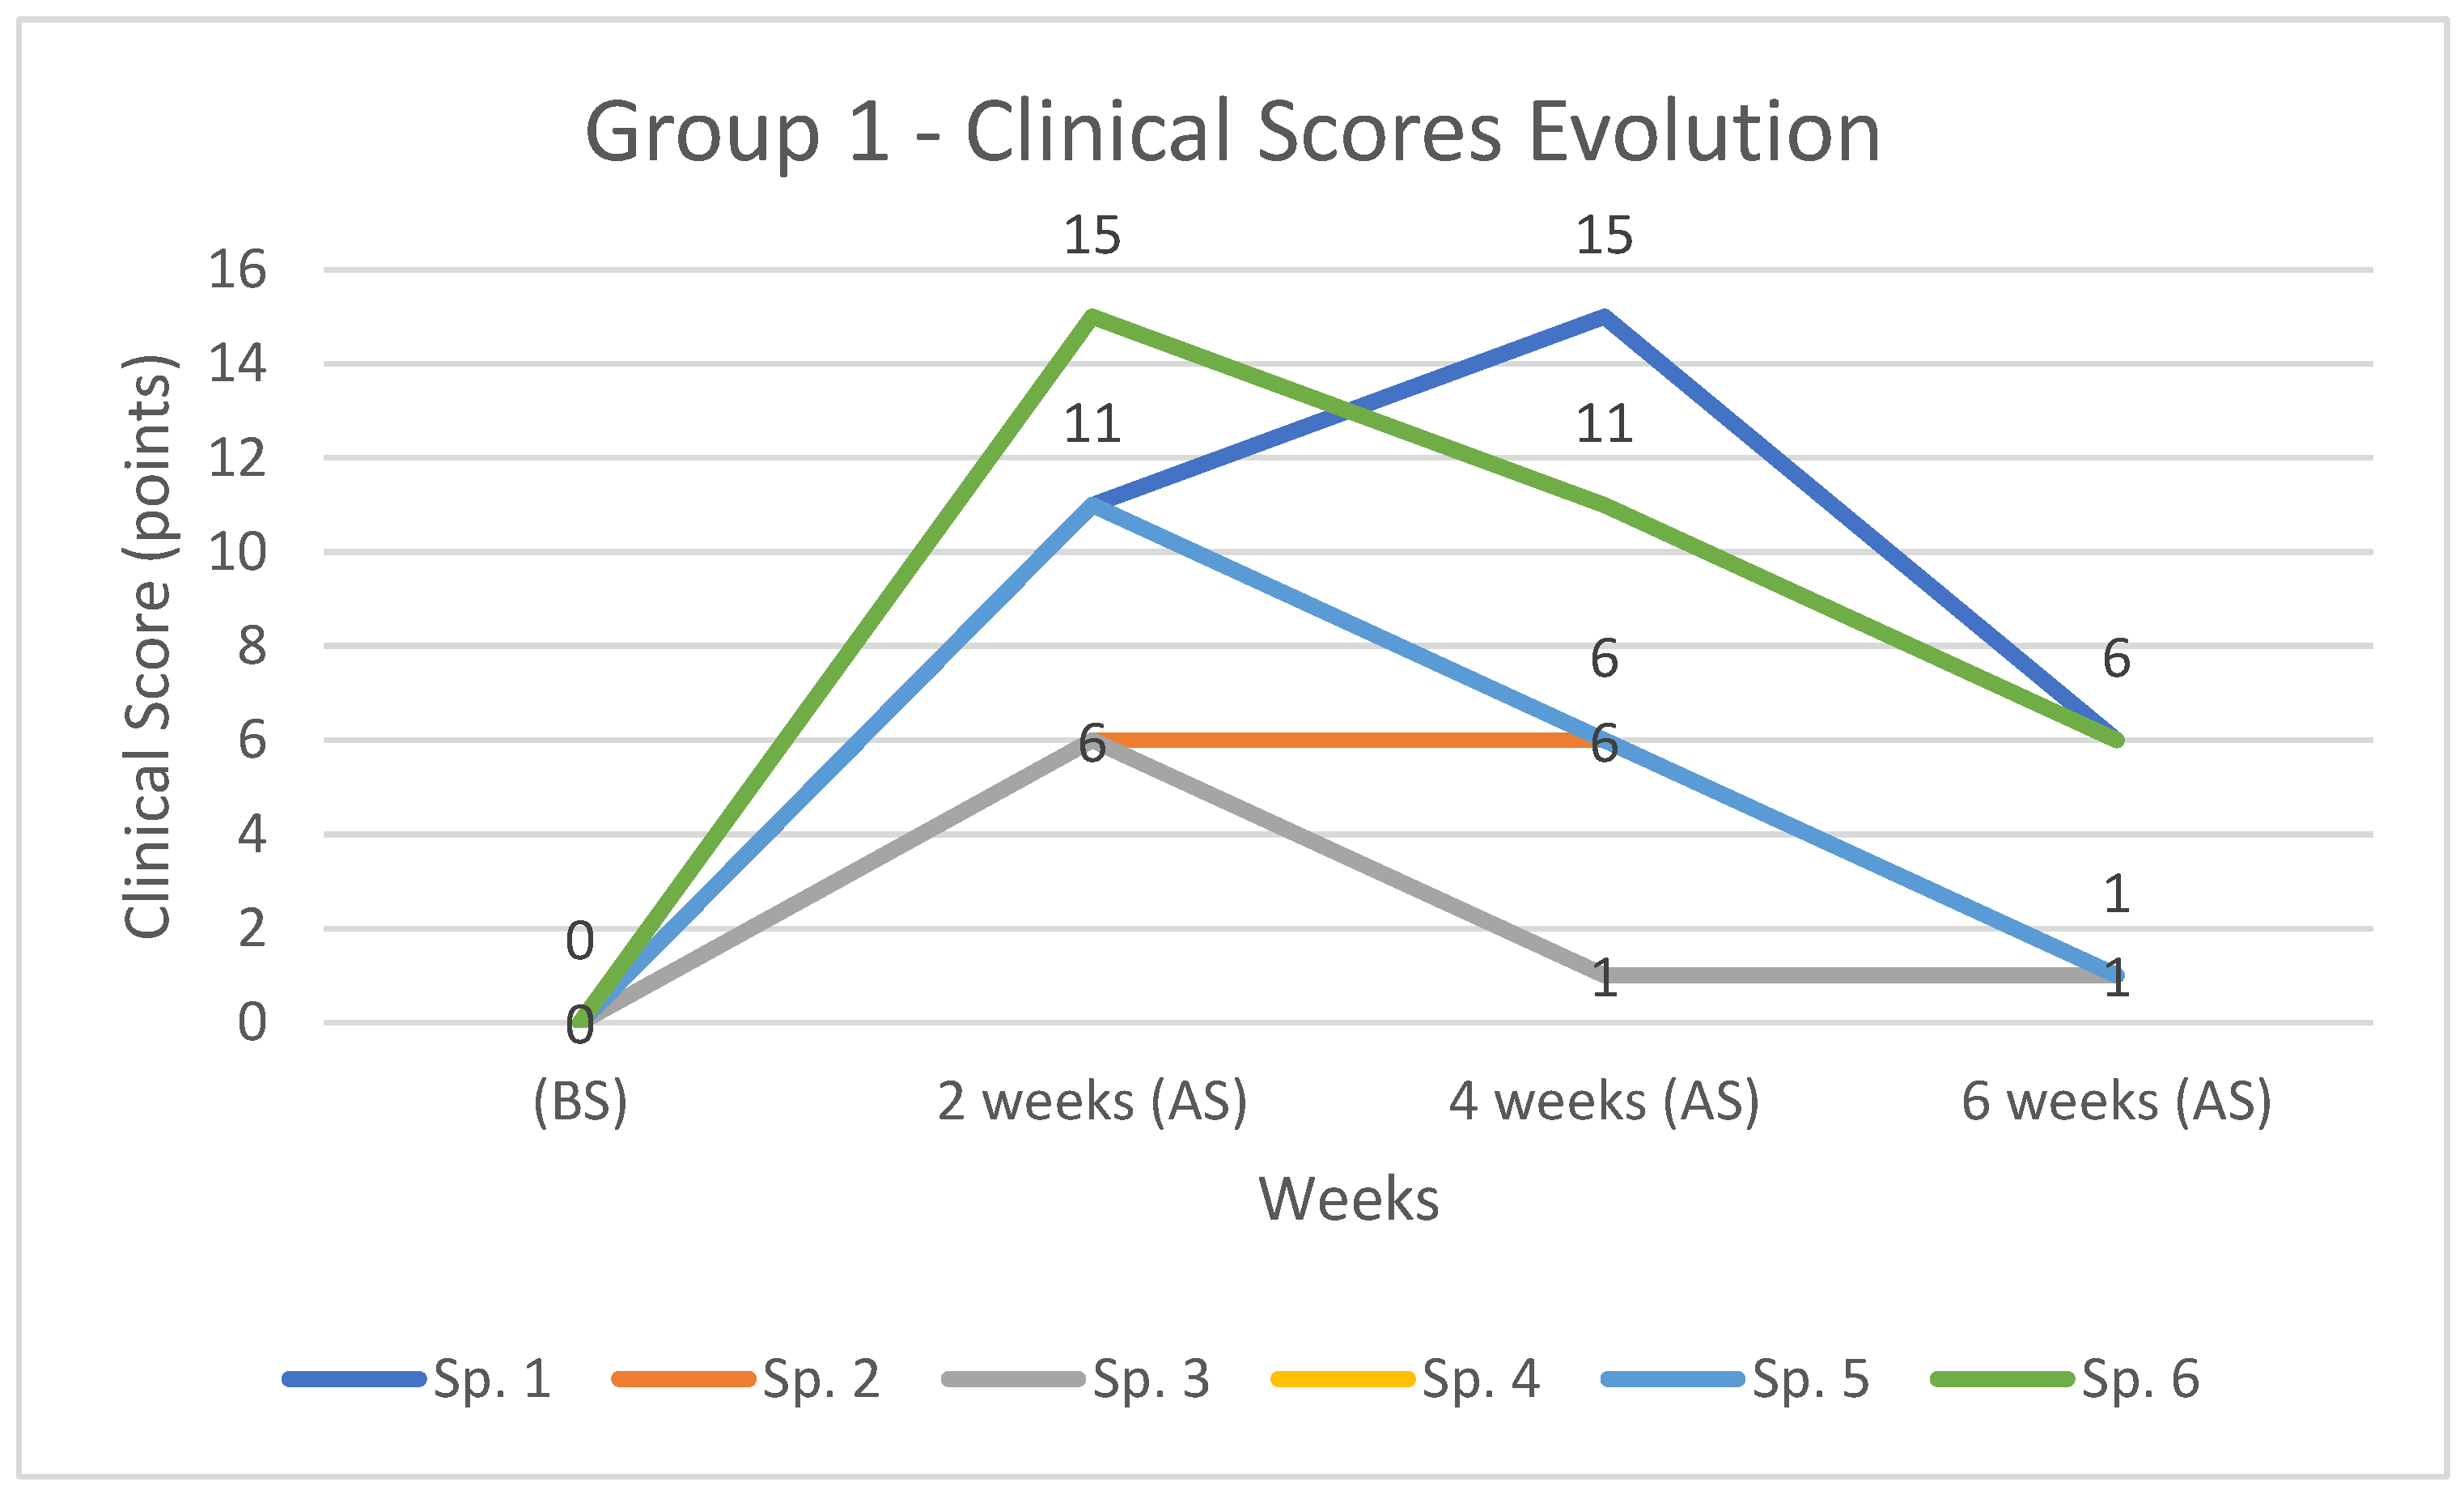
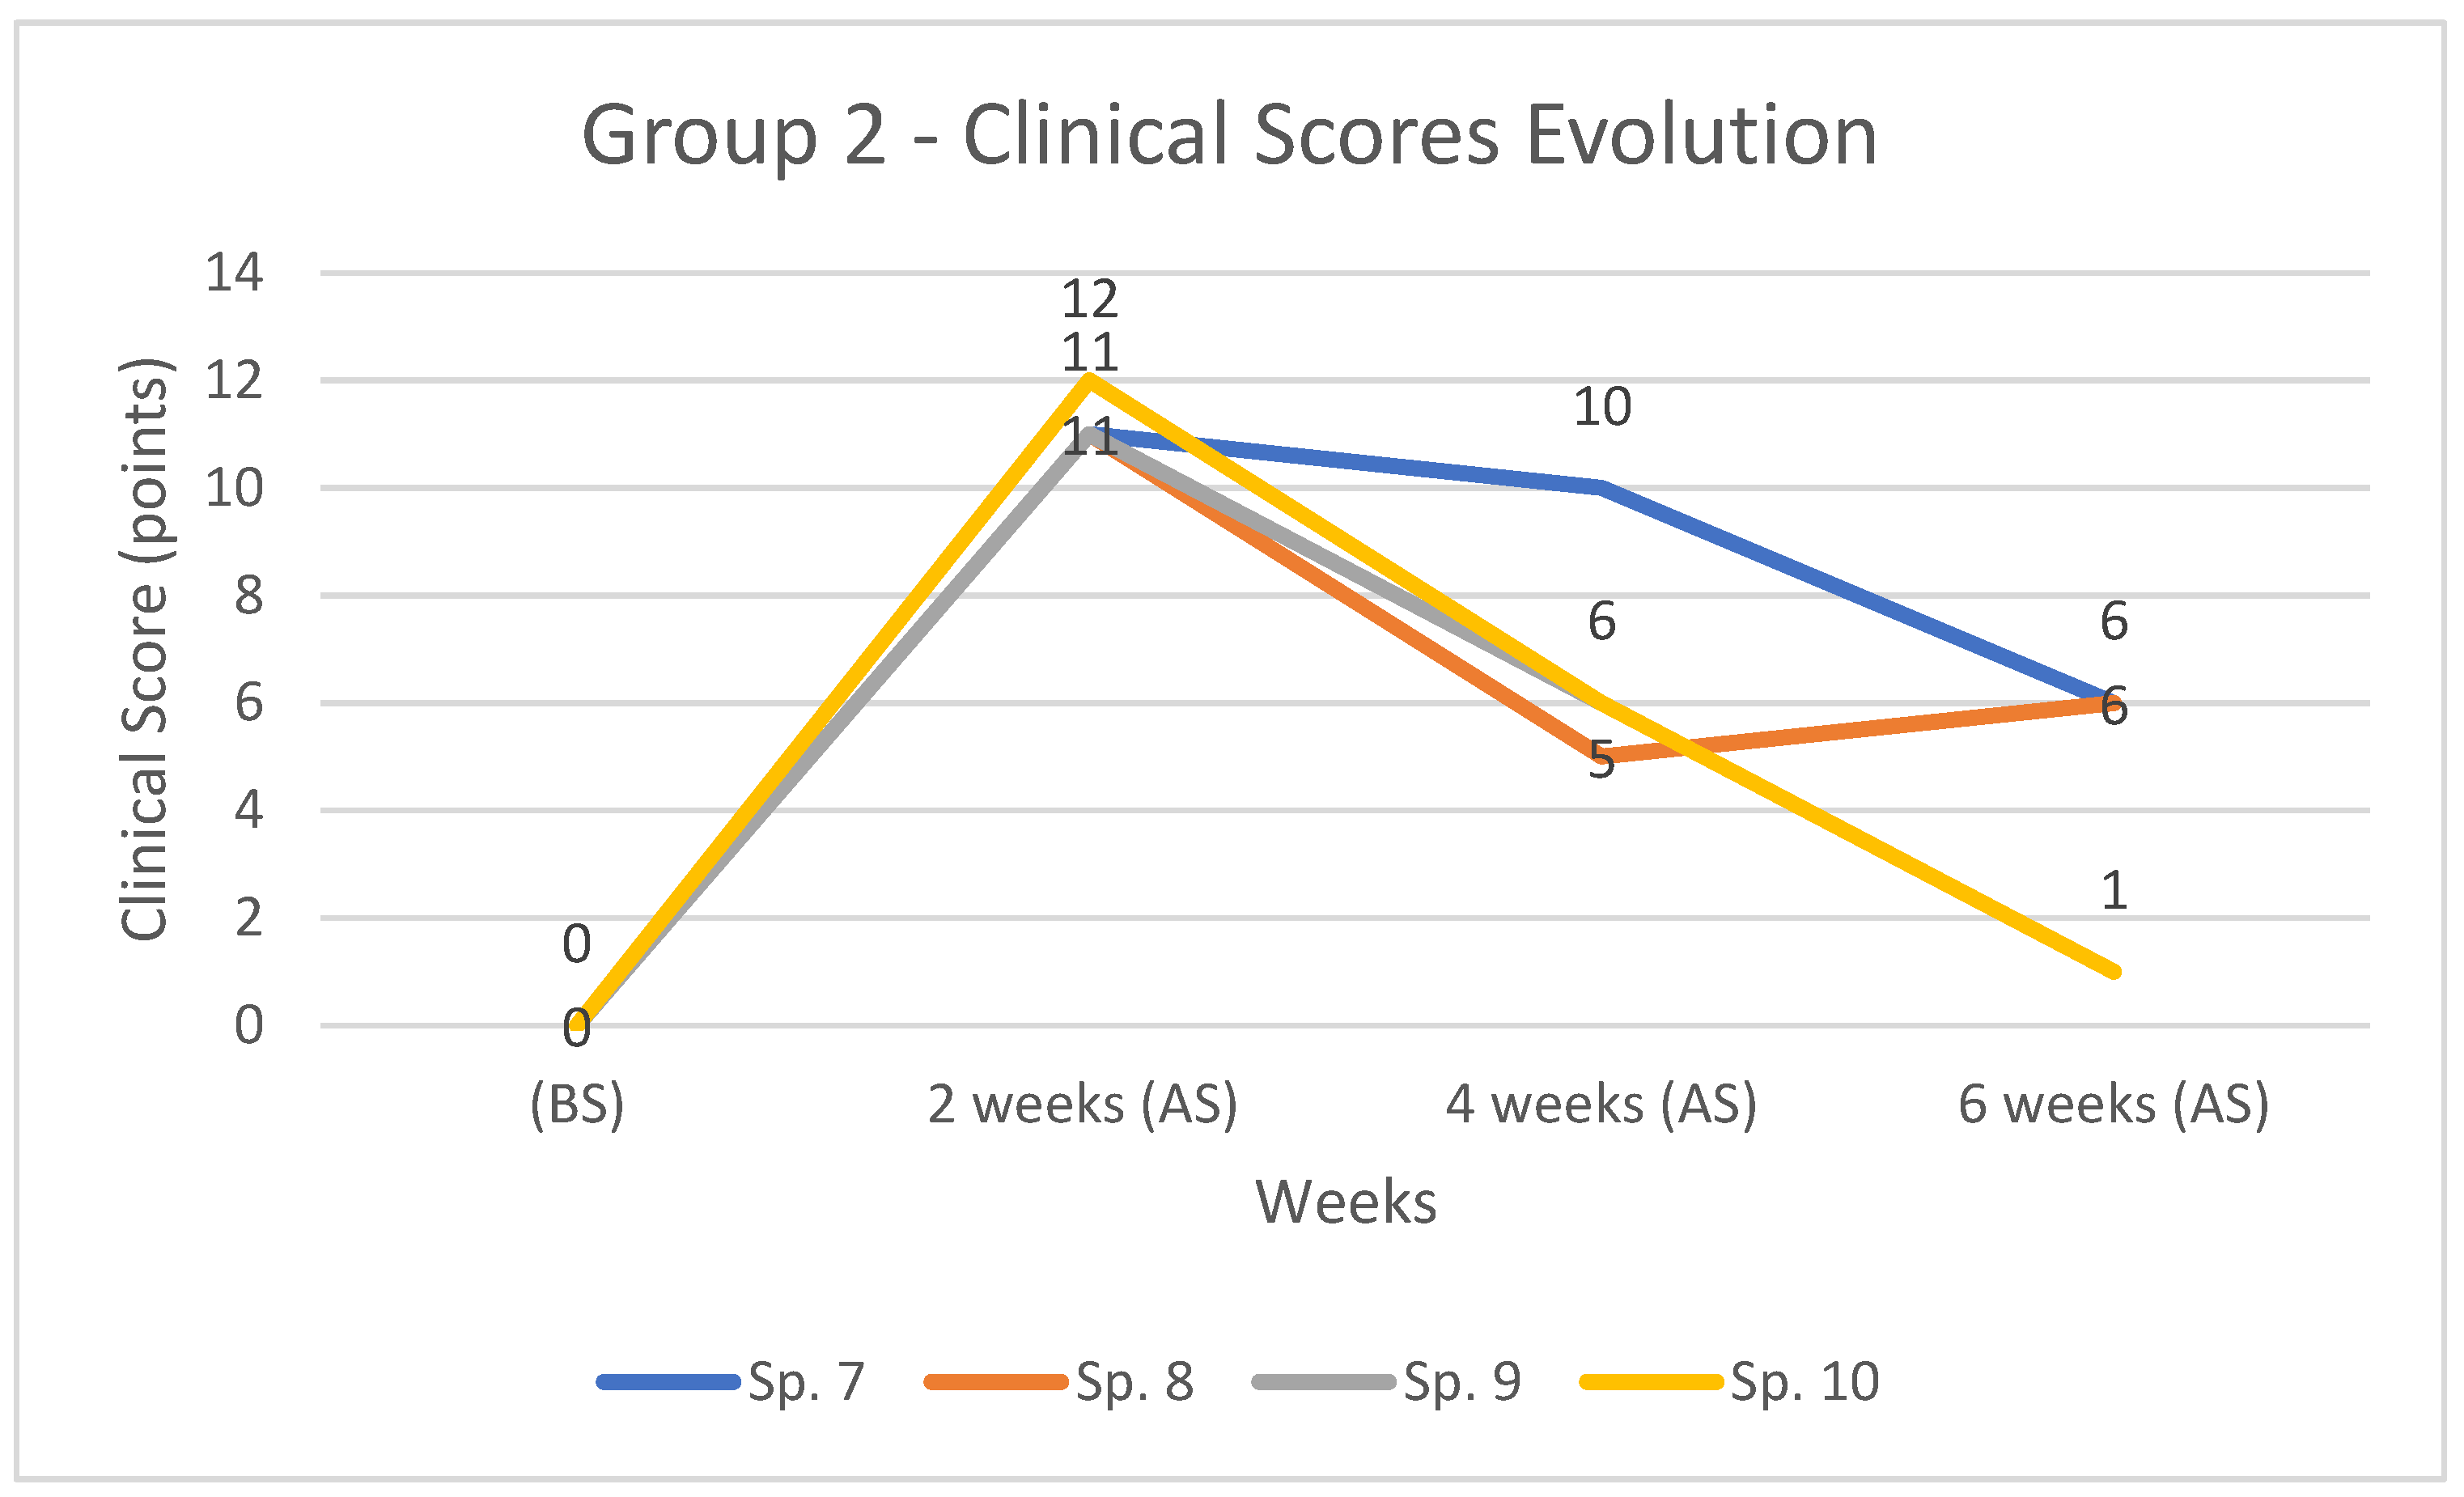
3.2.2. Clinical Score Evolution
3.2.3. Blood Loss Evolution
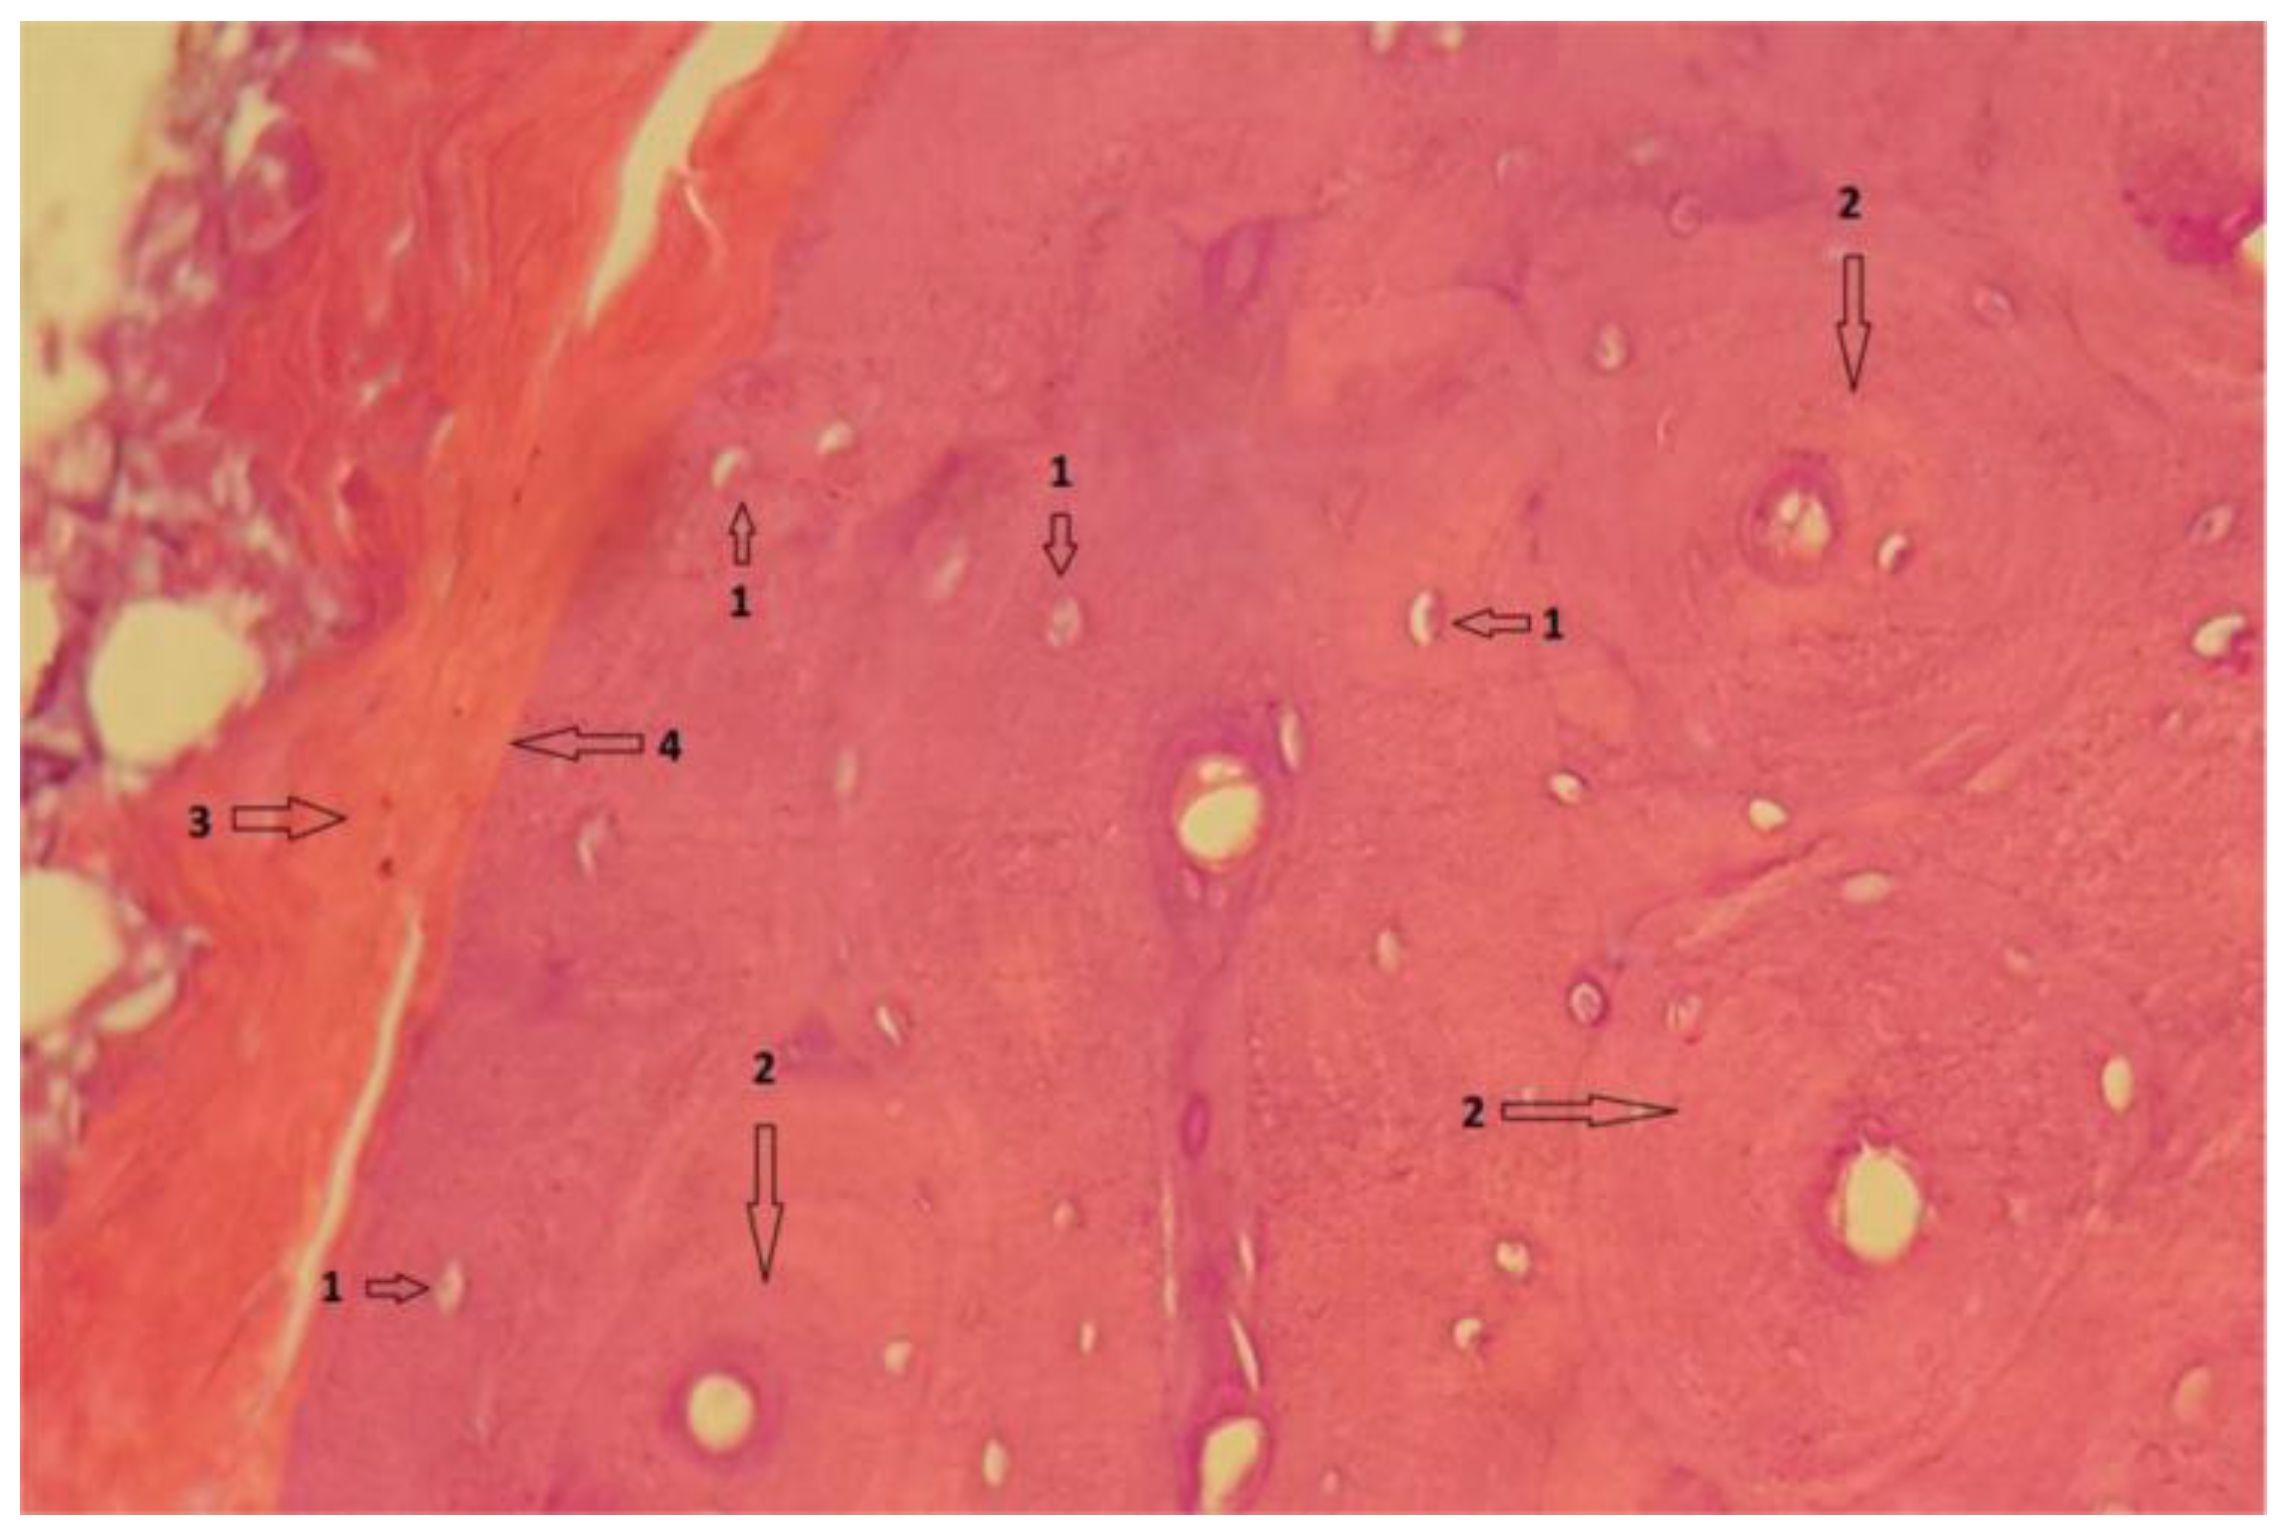
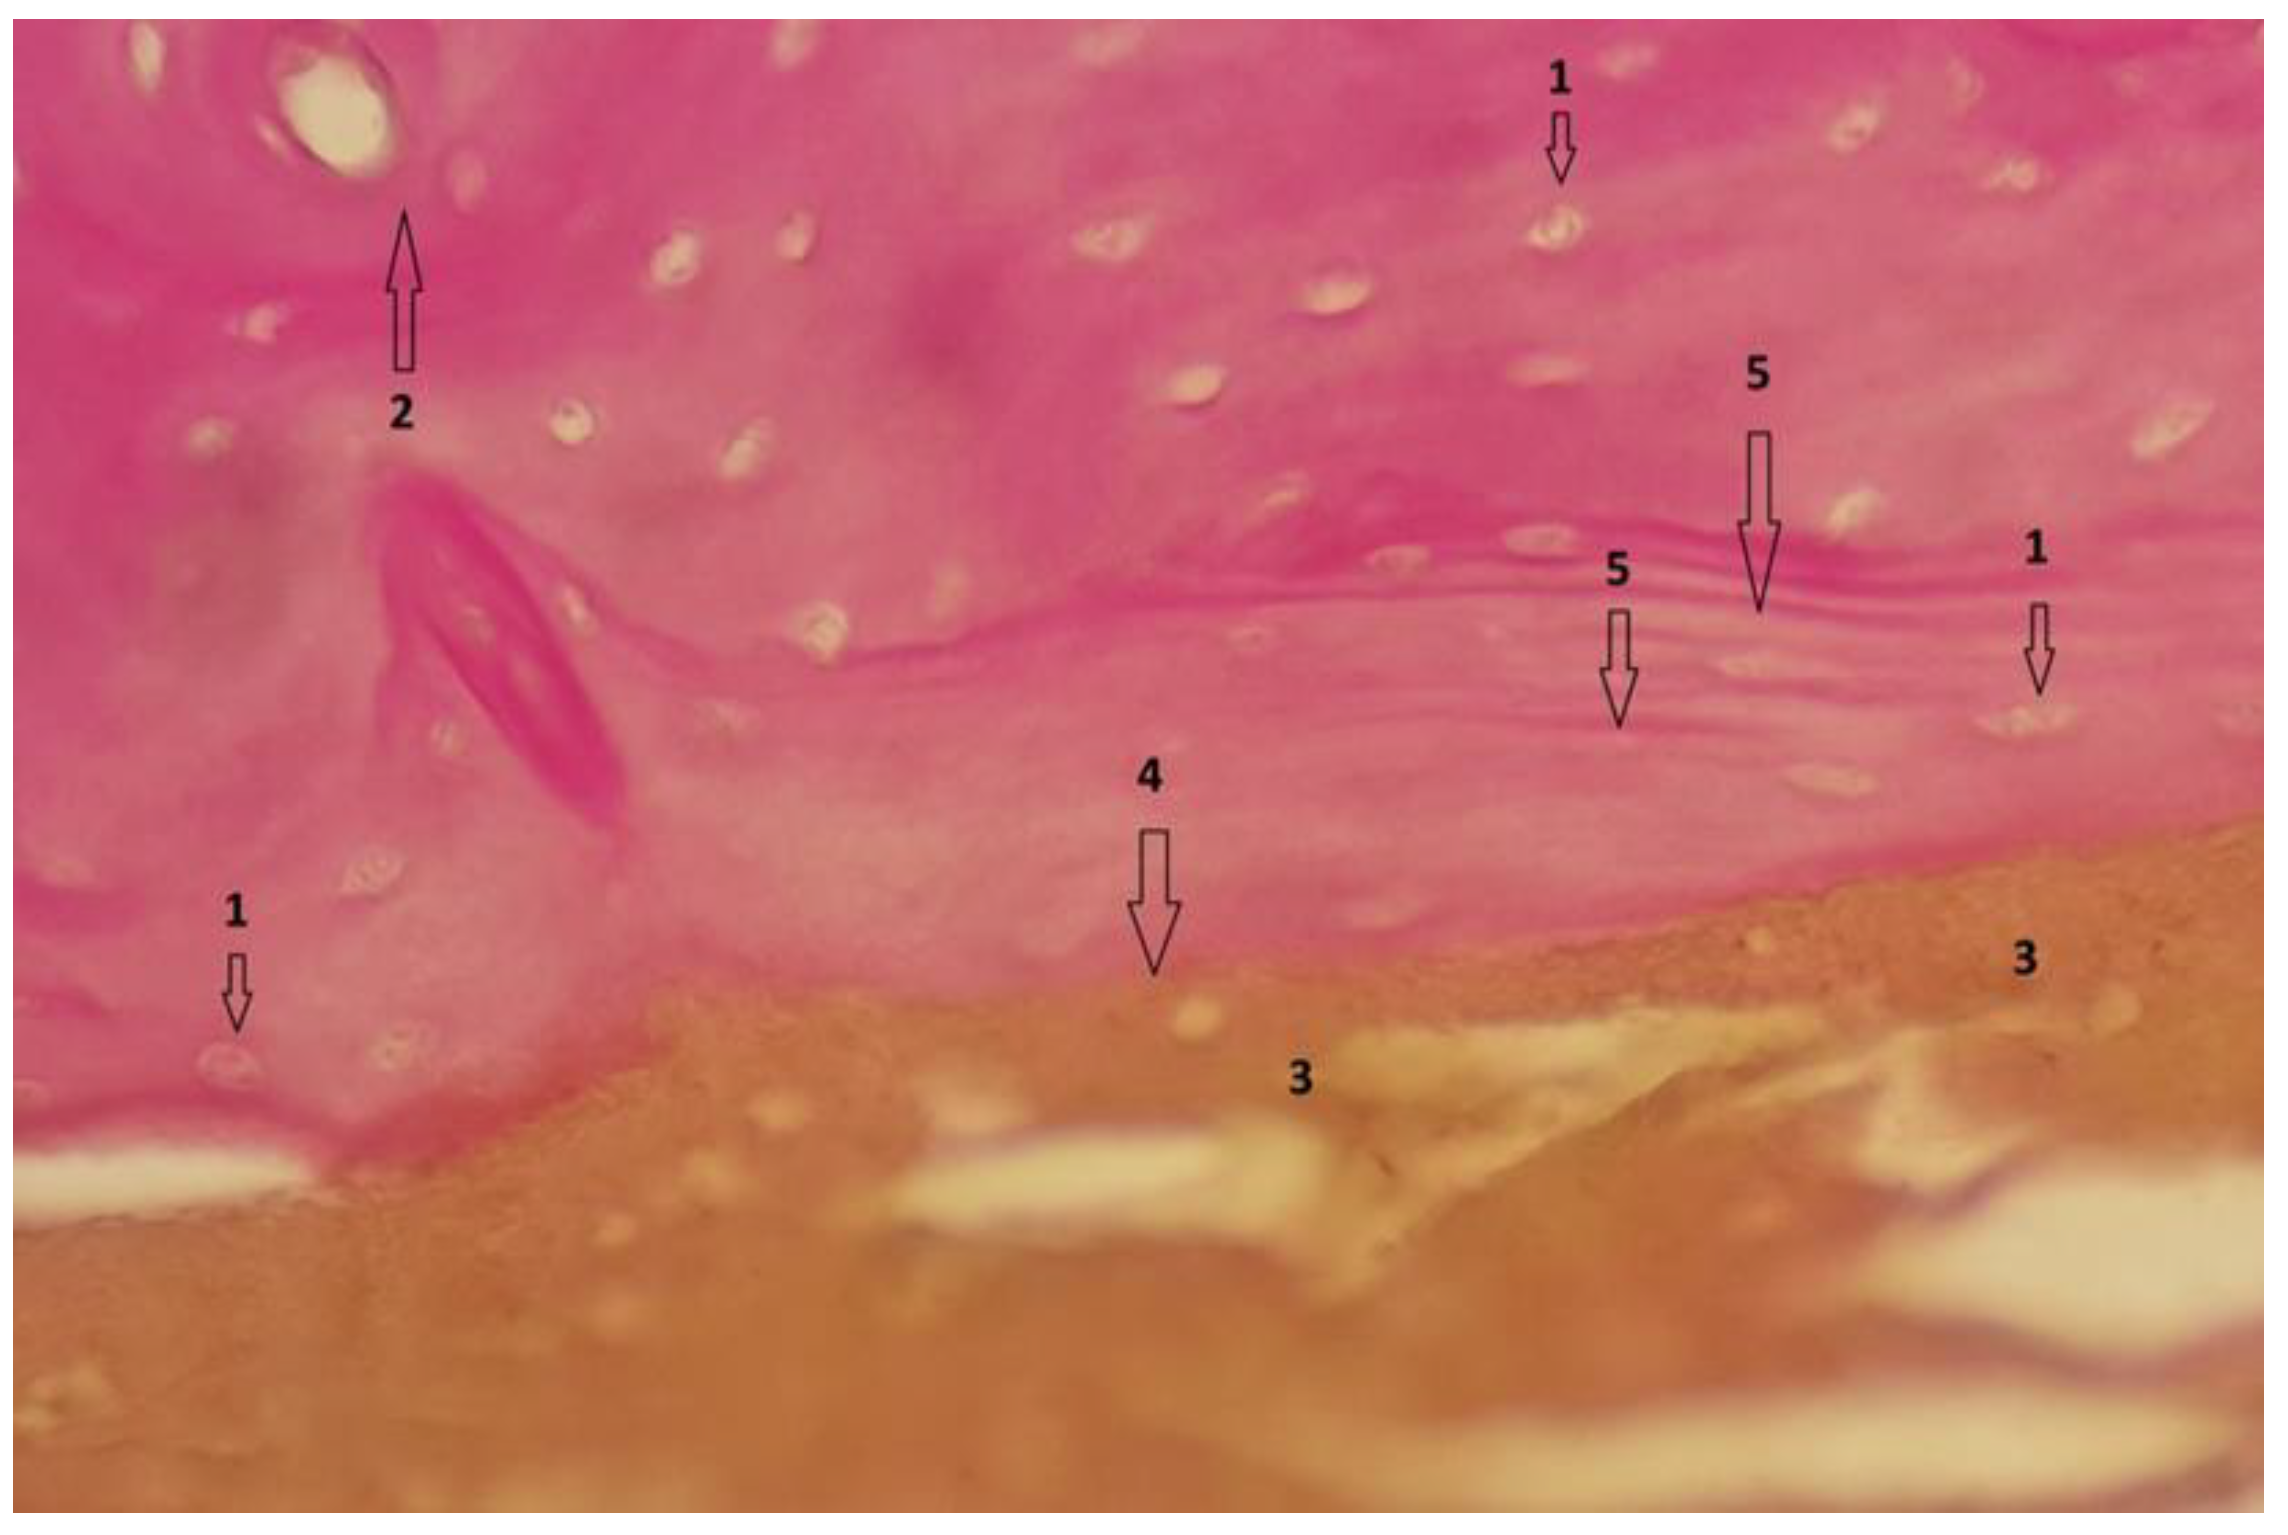
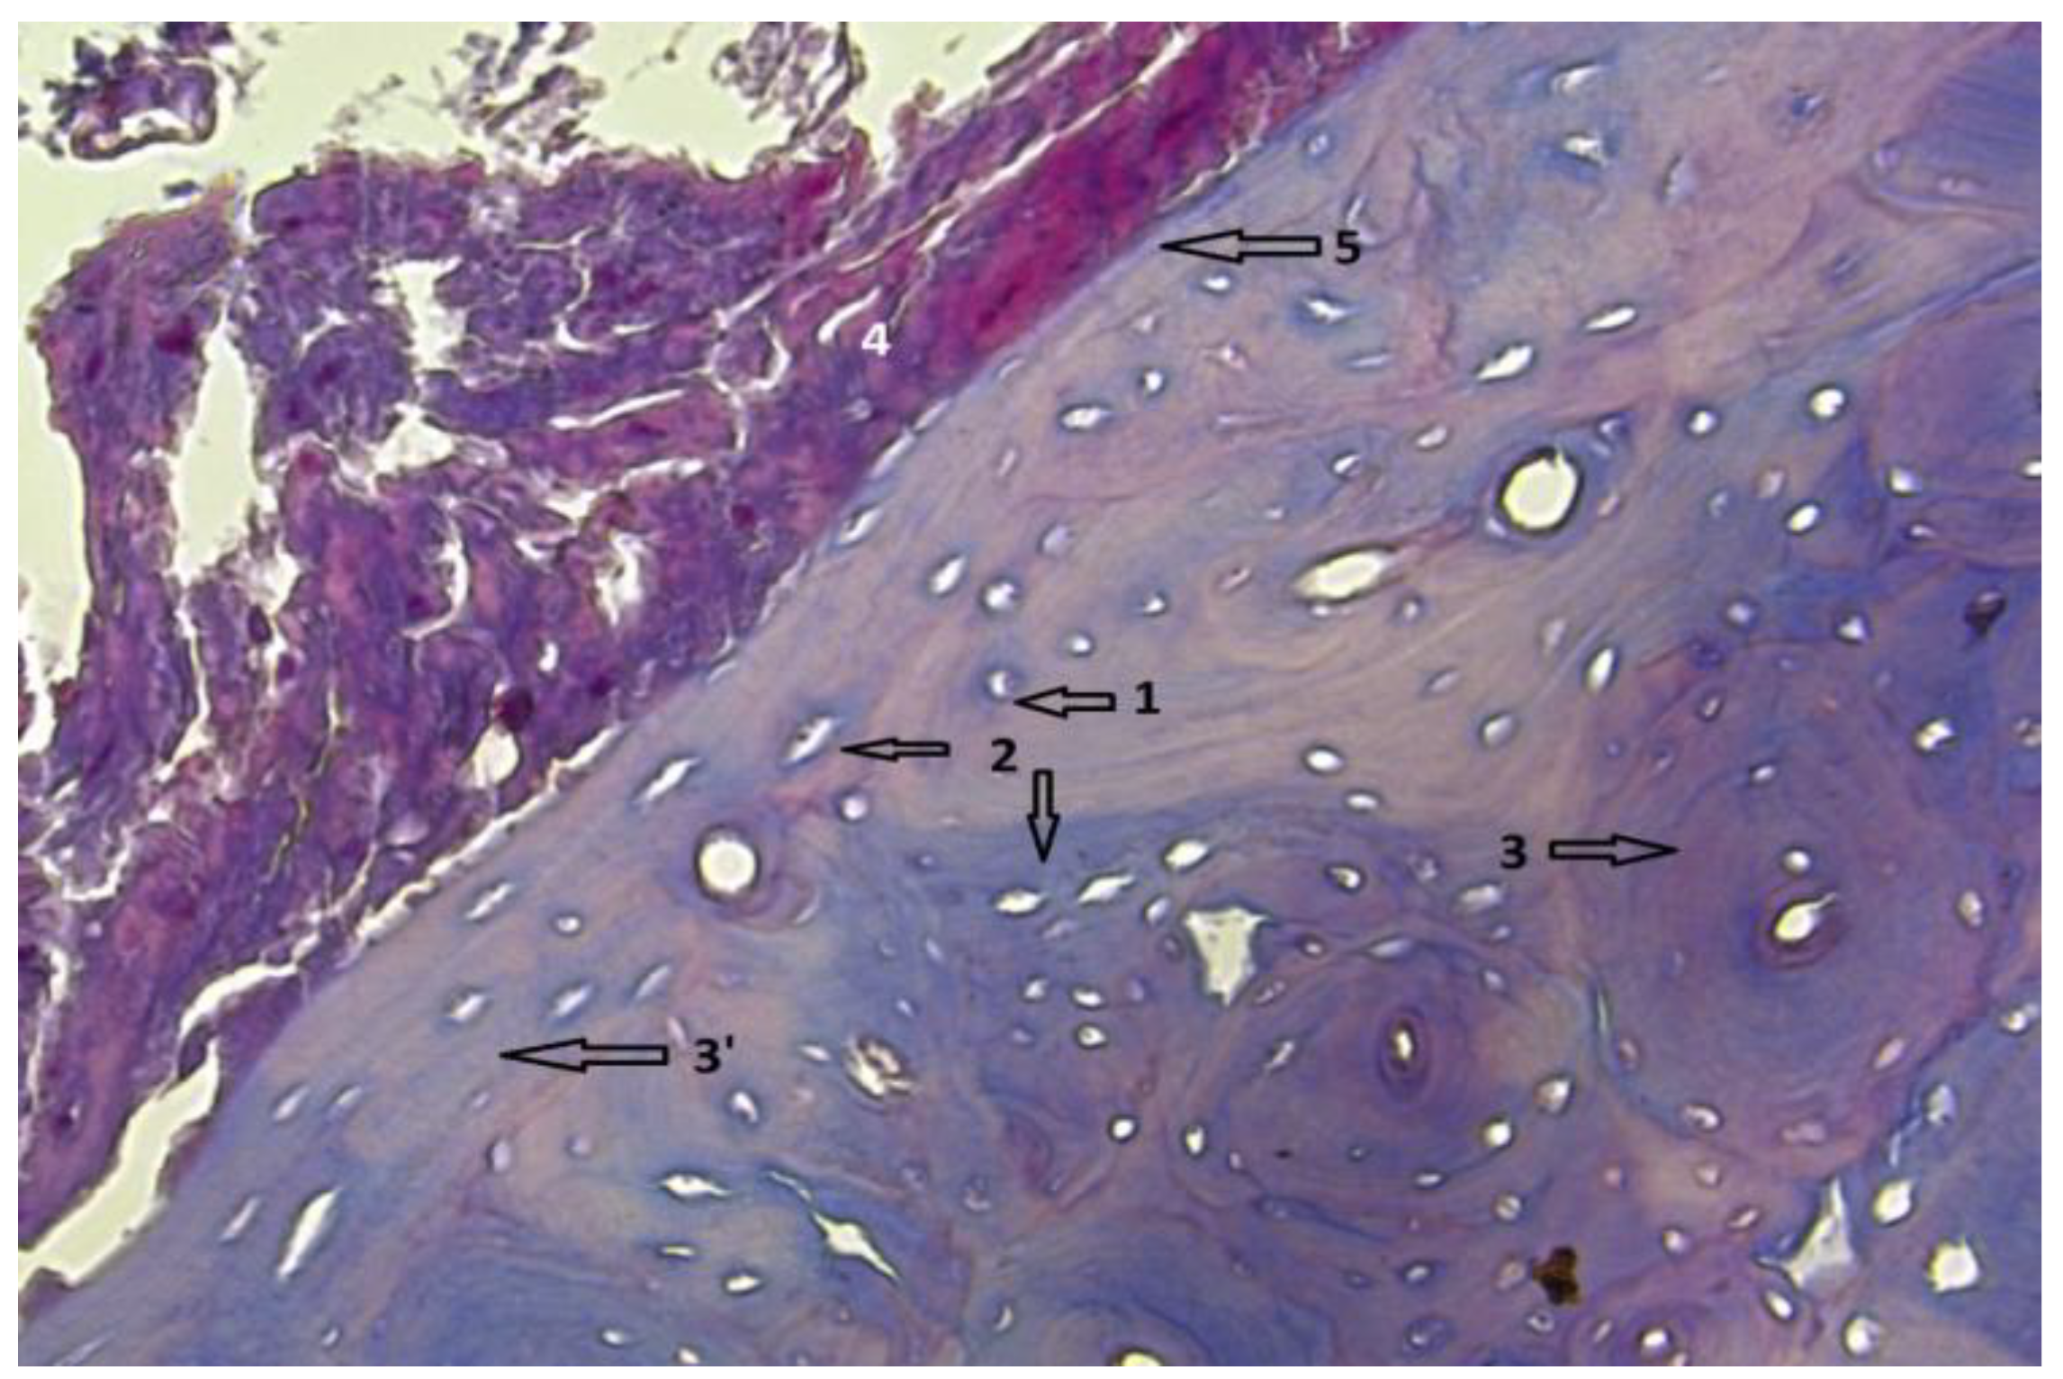
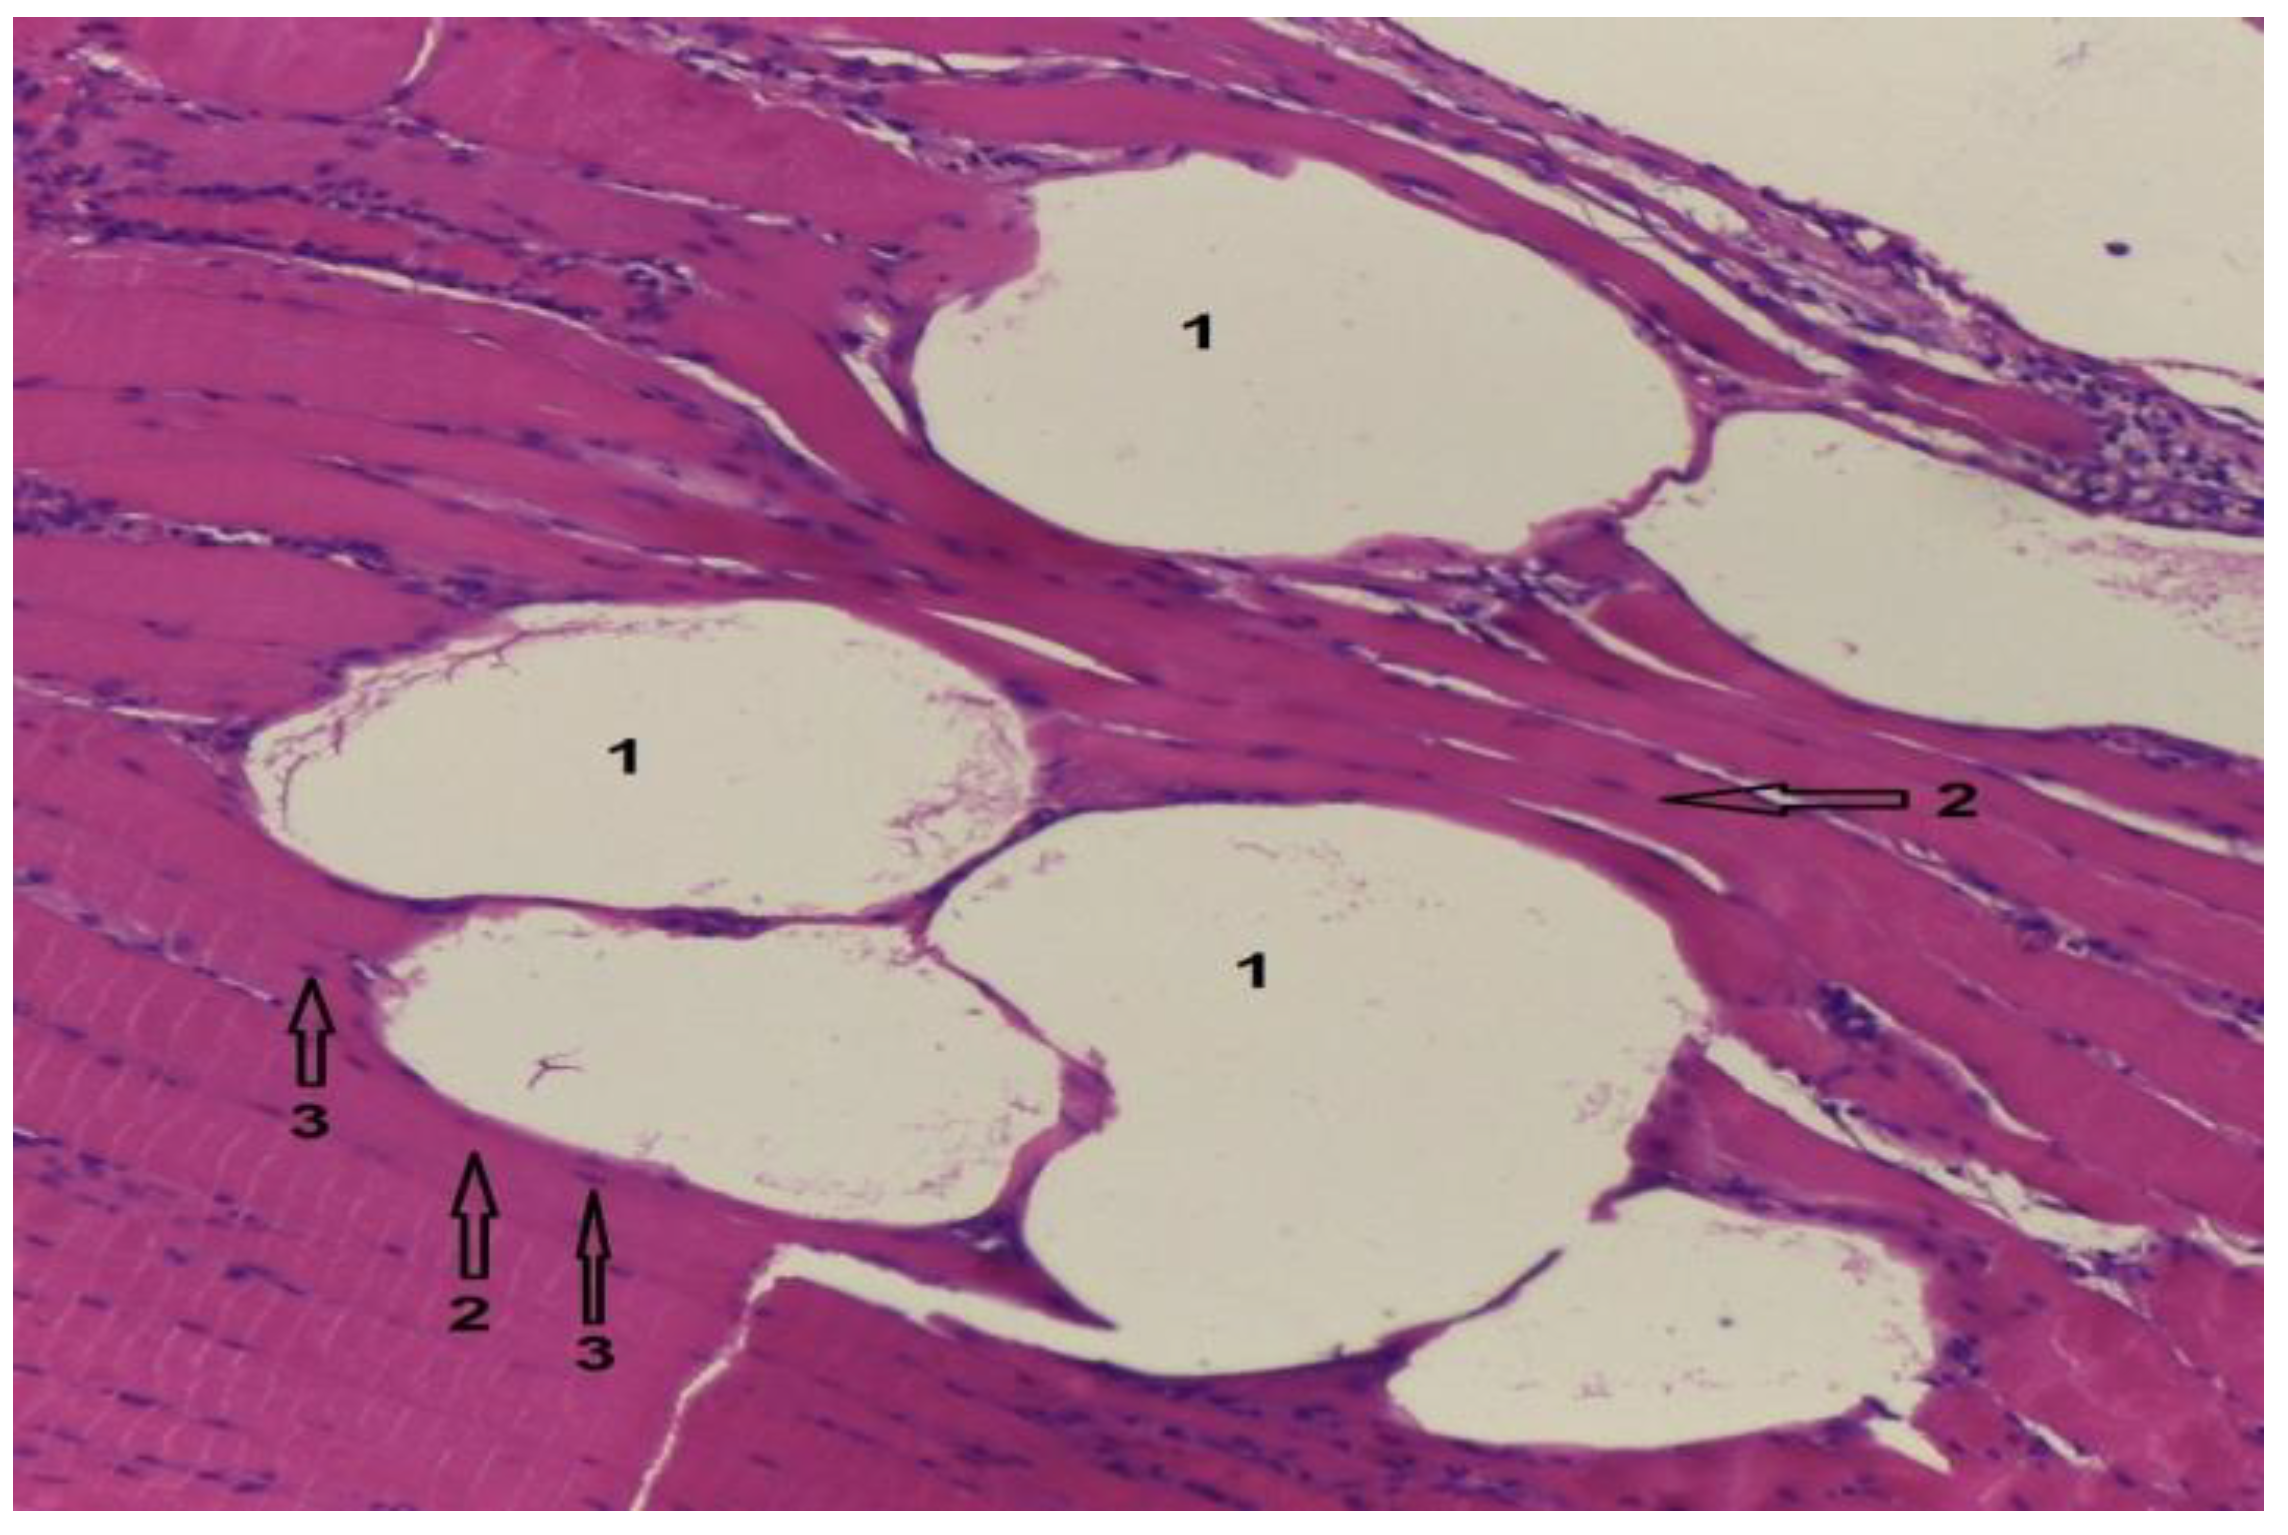
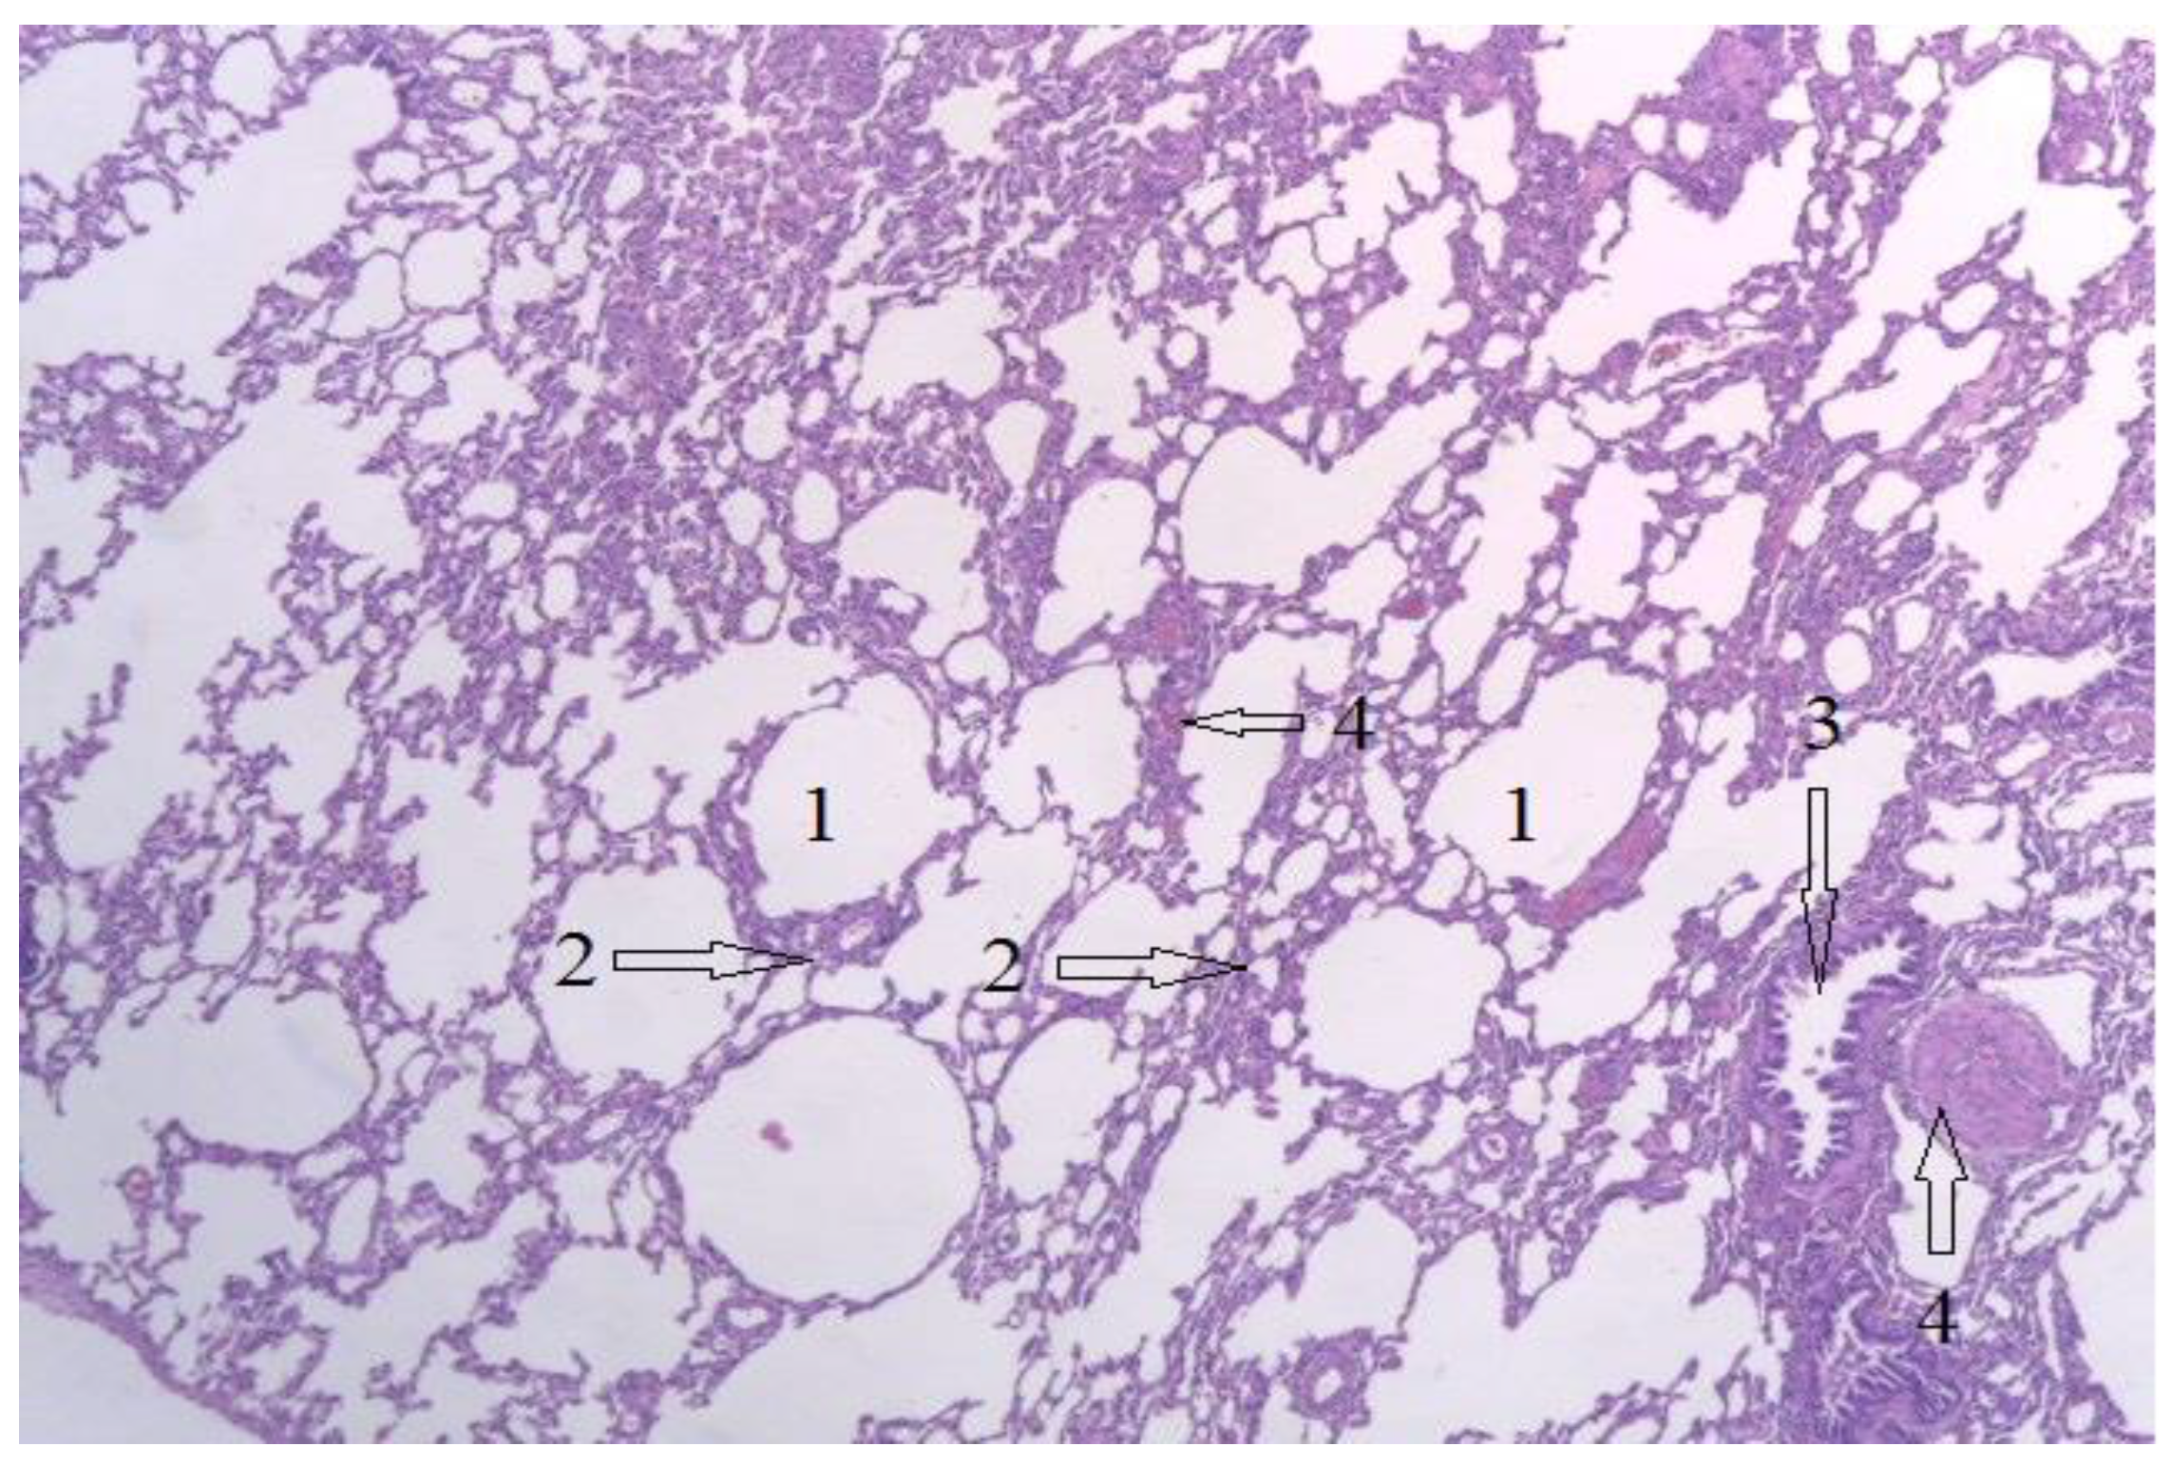
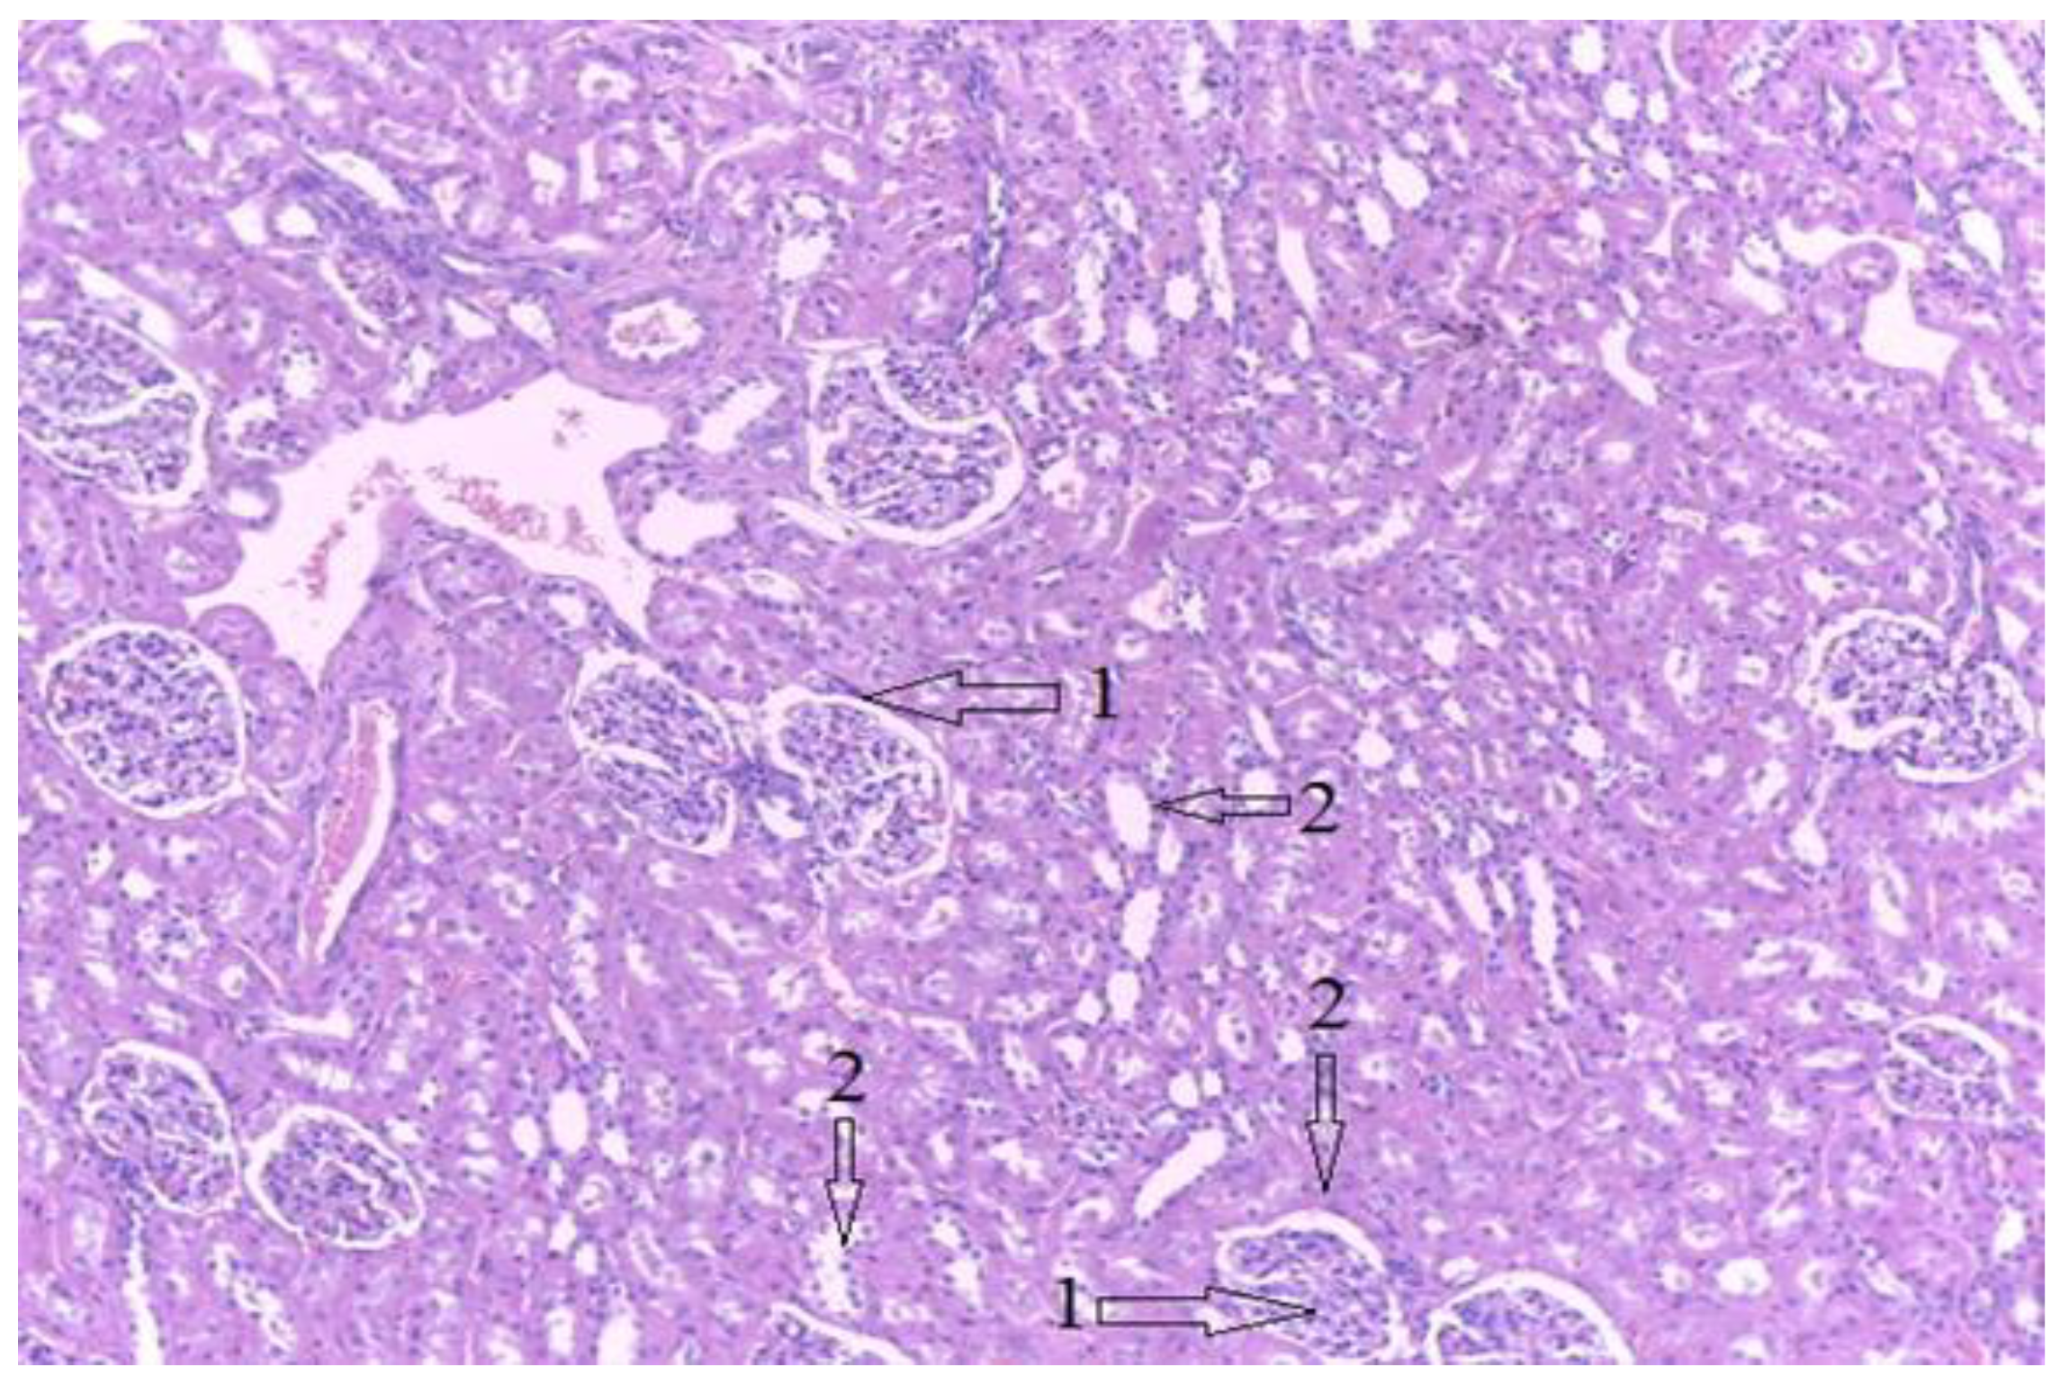
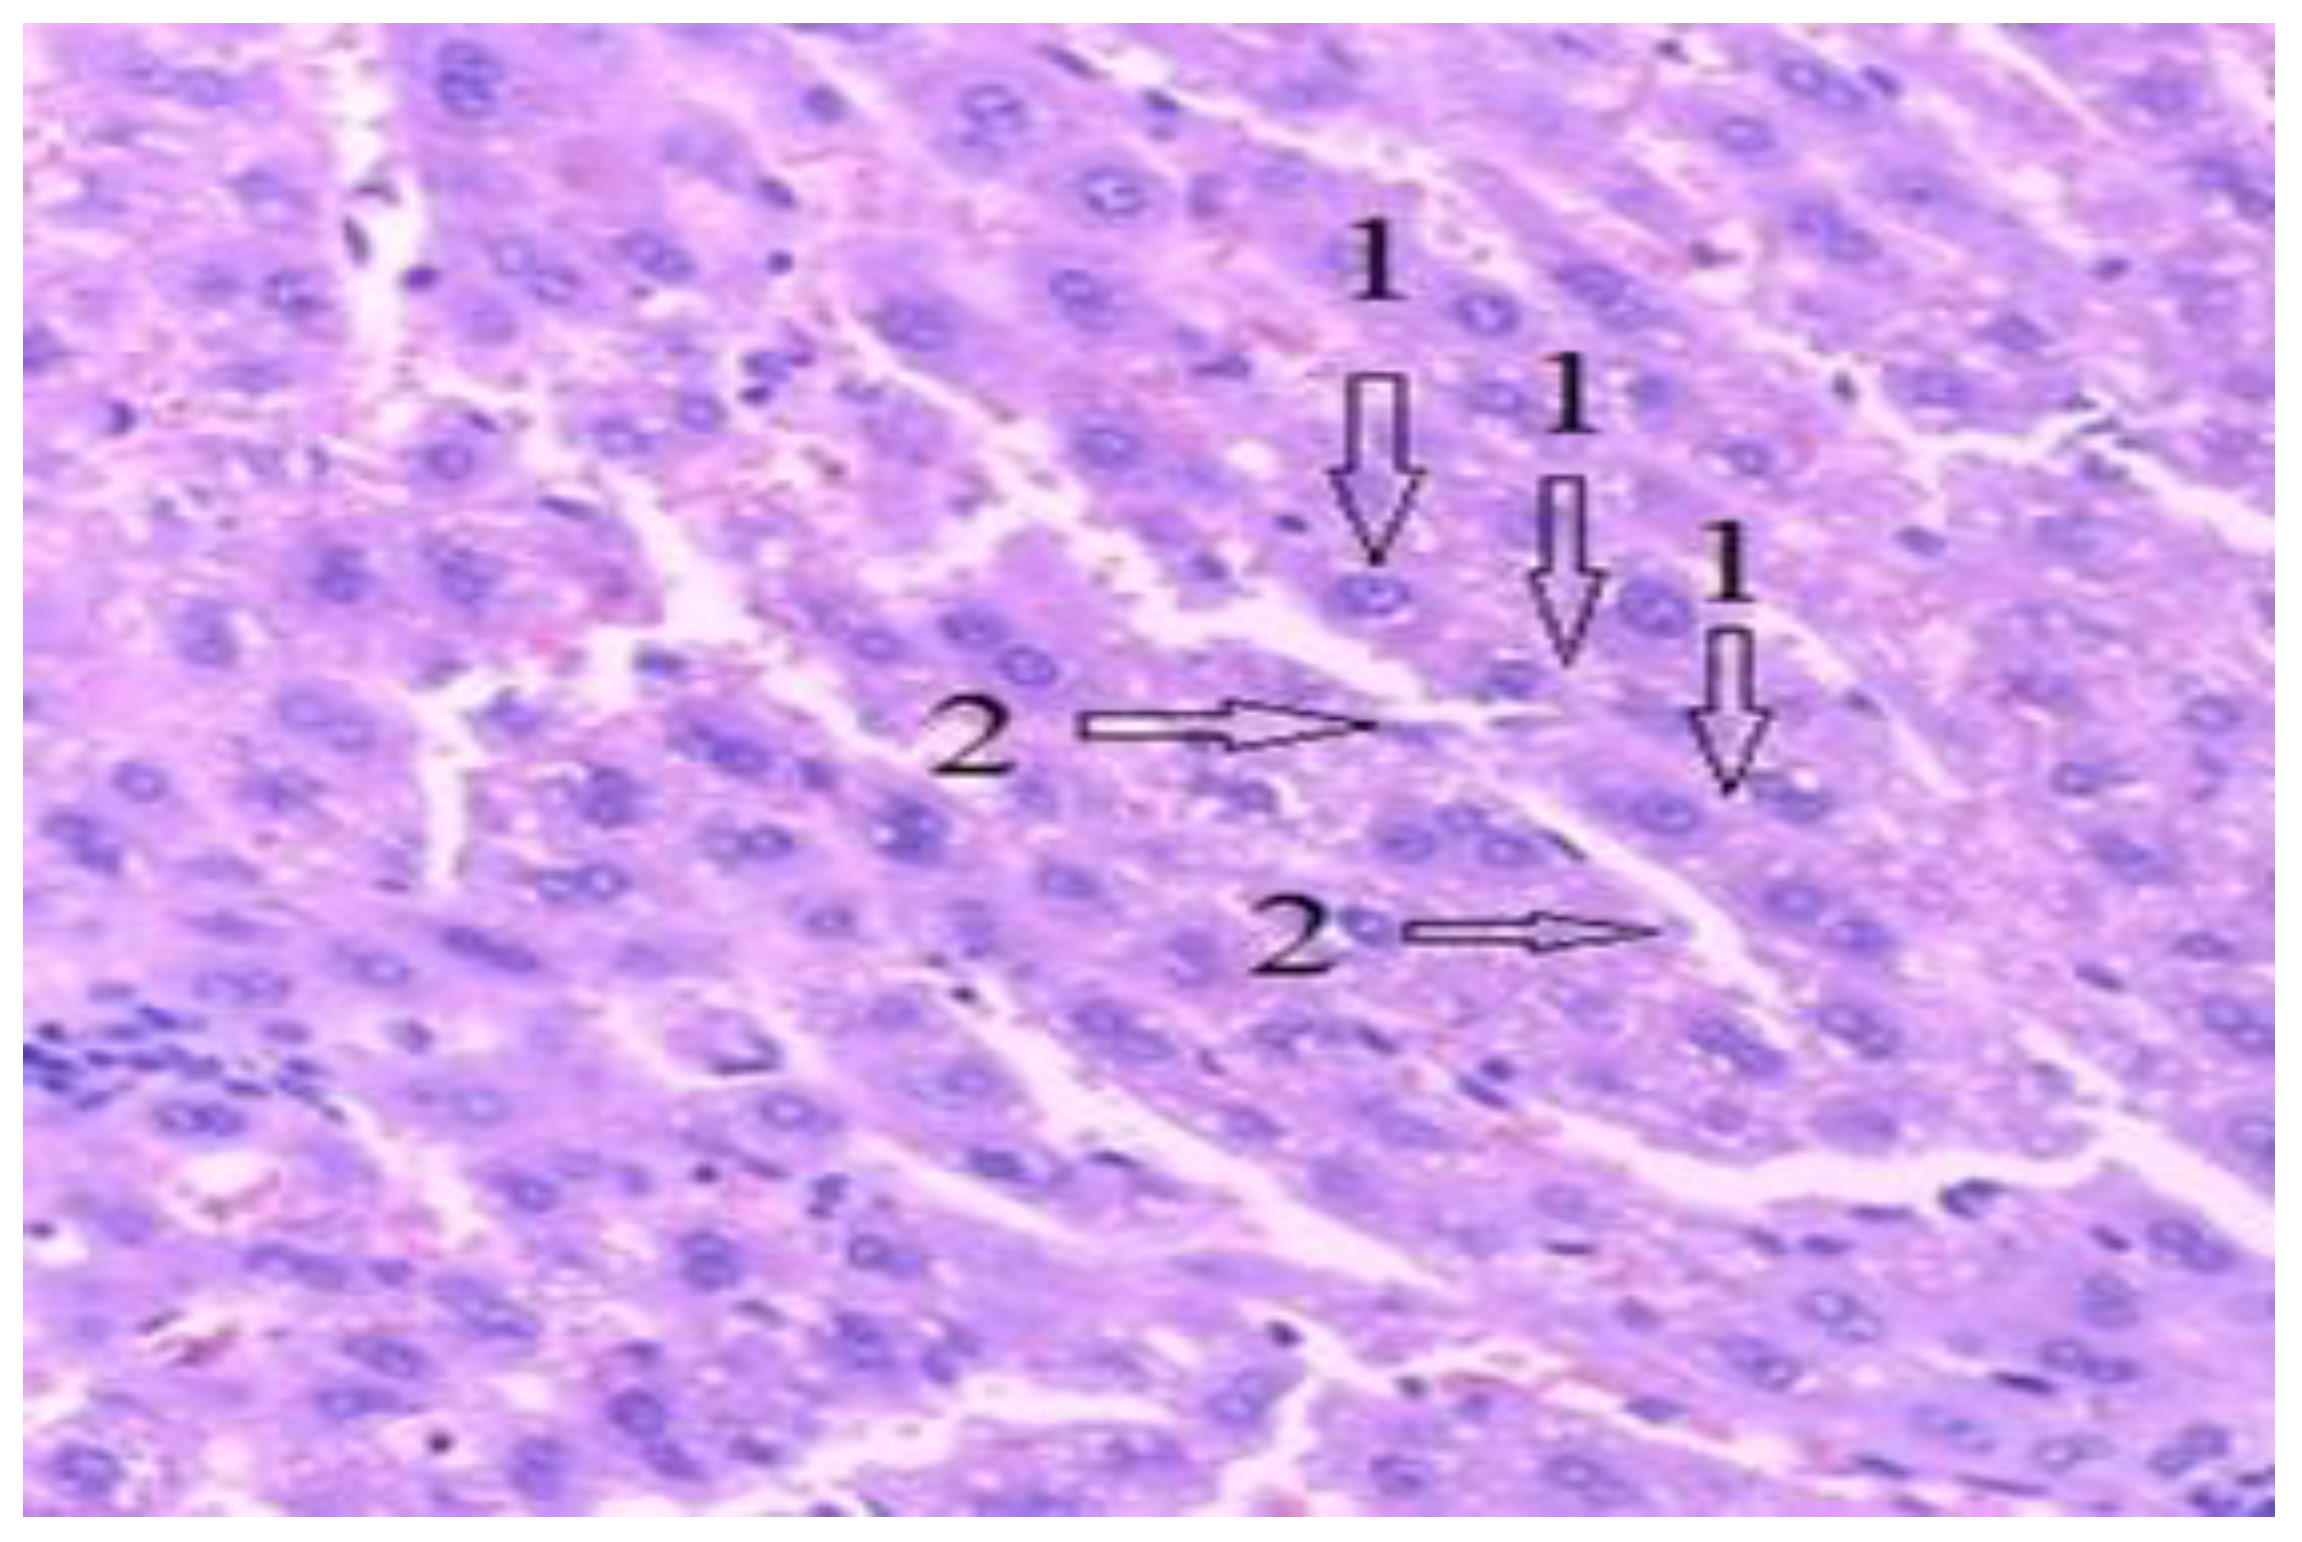
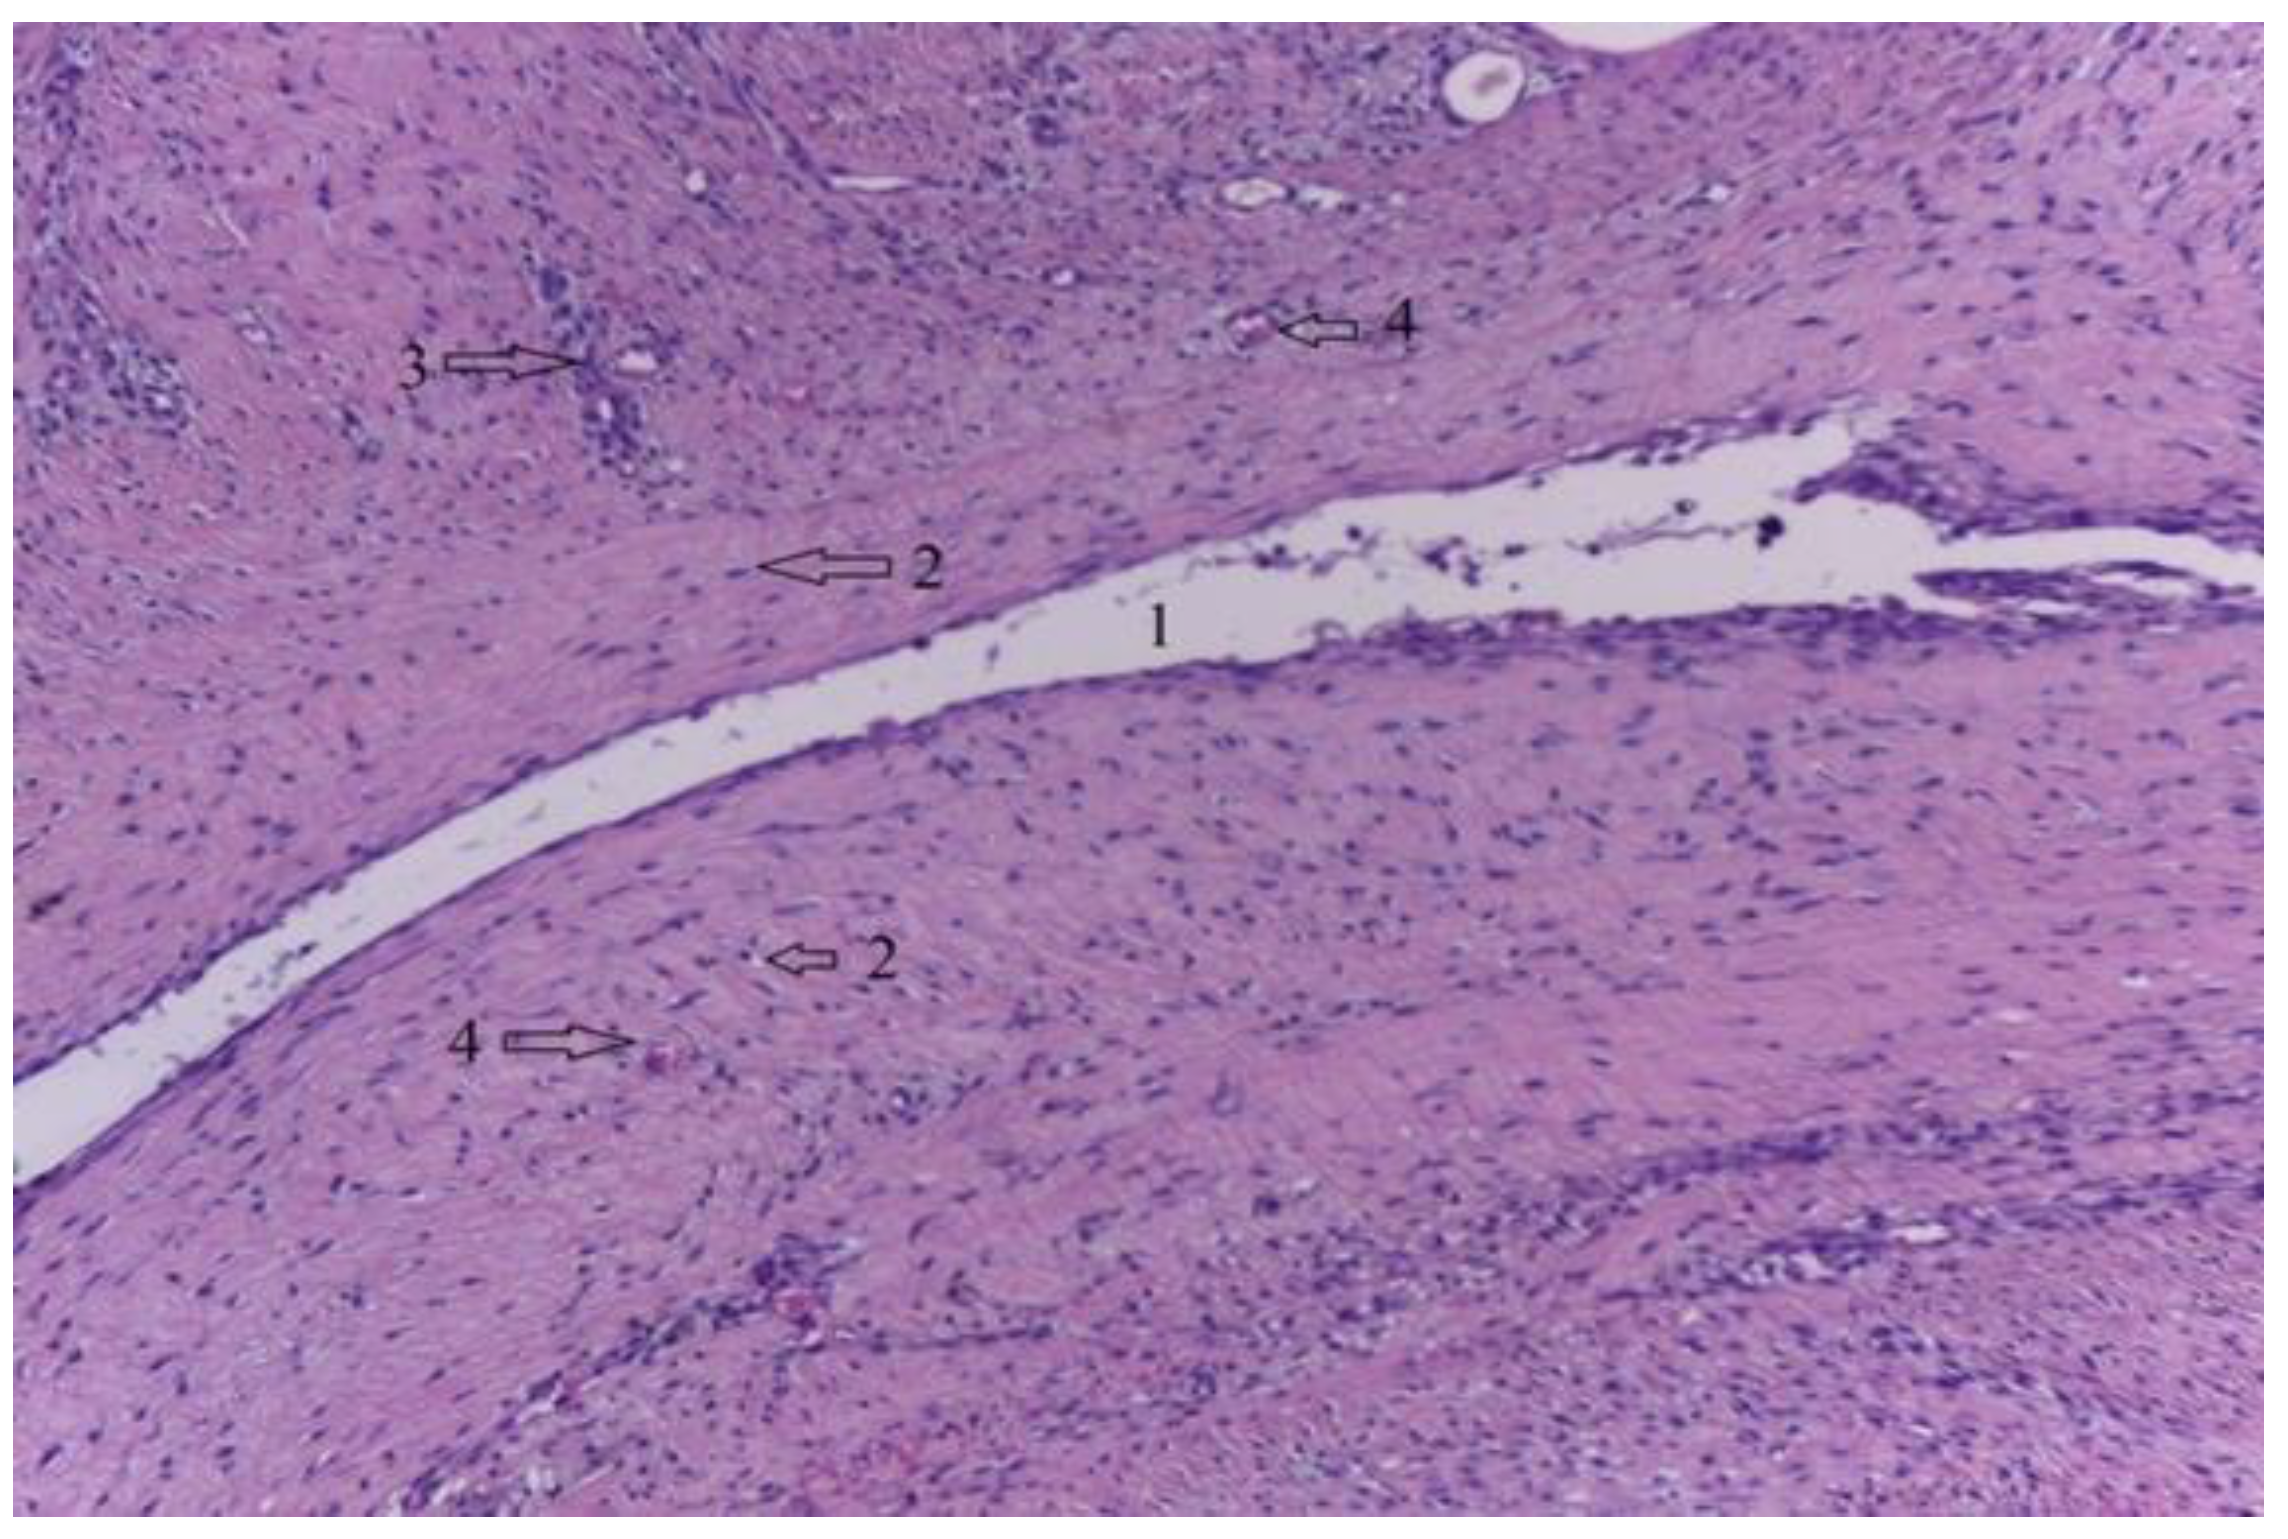
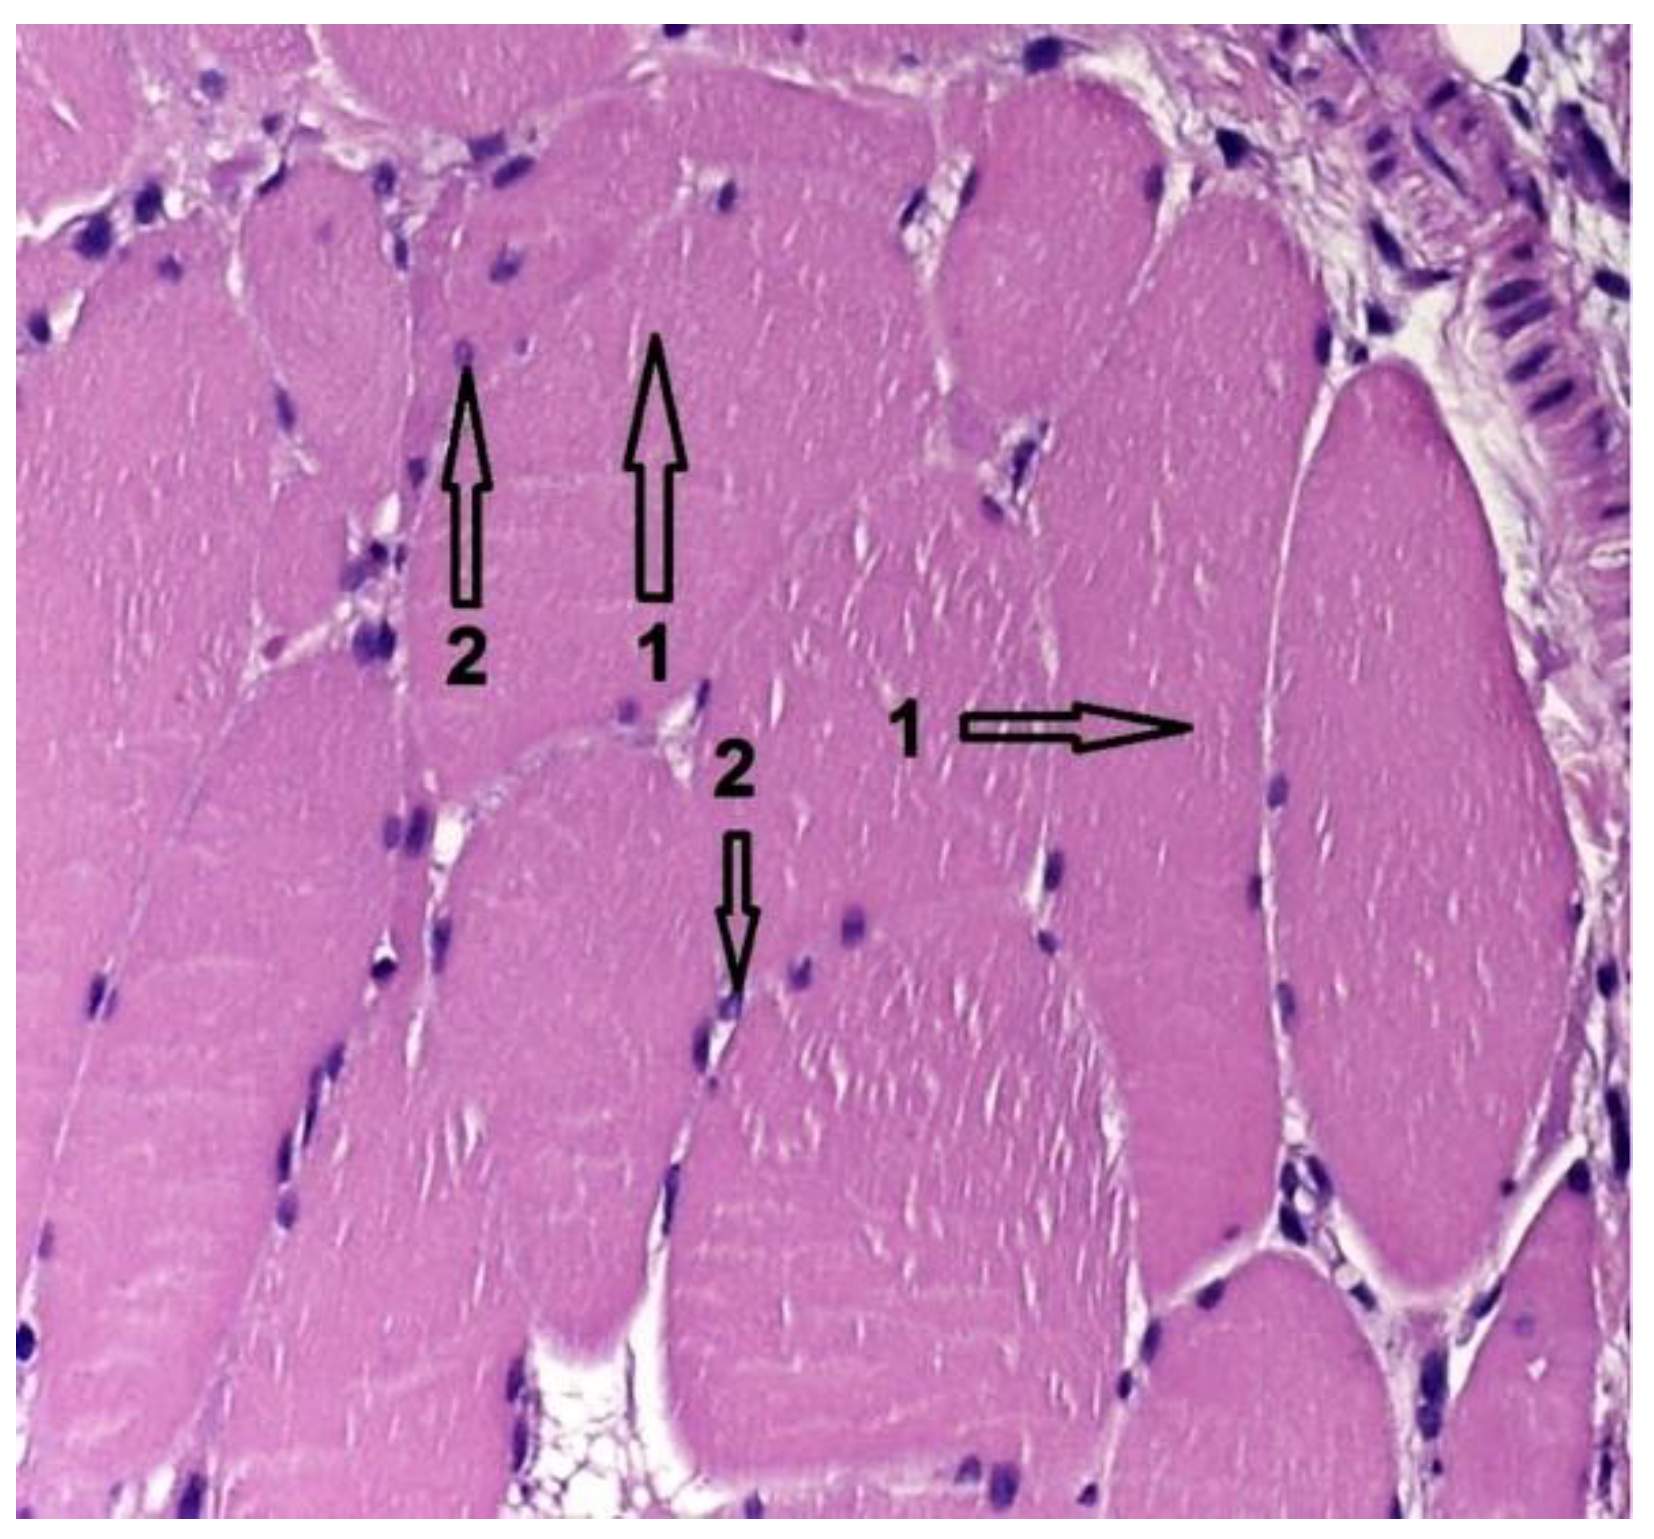
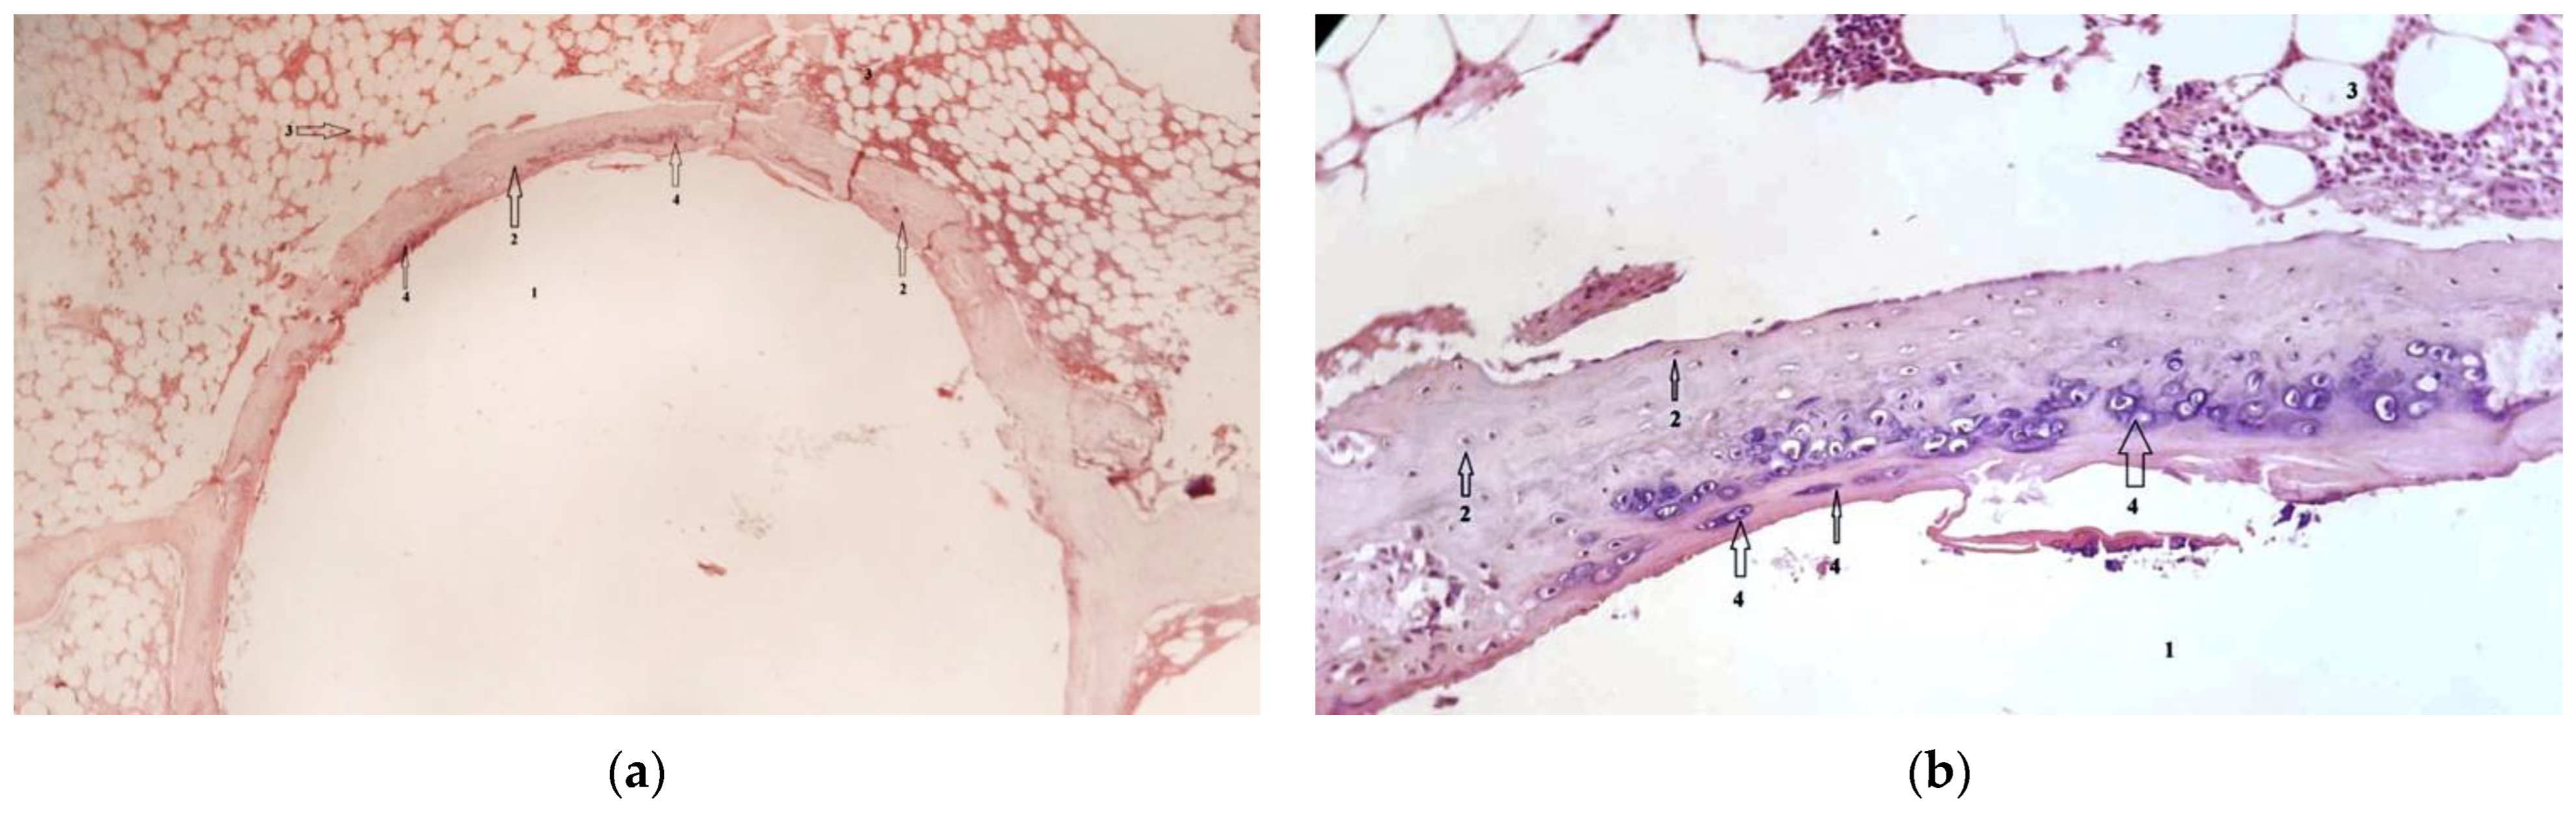
3.3. Histological Results
4. Limitations of the Current Study
5. Conclusions
Author Contributions
Funding
Institutional Review Board Statement
Informed Consent Statement
Data Availability Statement
Conflicts of Interest
References
- Chen, Y.; Xu, Z.; Smith, C.; Sankar, J. Recent advances on the development of magnesium alloys for biodegradable implants. Acta Biomater. 2014, 10, 4561–4573. [Google Scholar] [CrossRef] [PubMed]
- Witte, F.; Feyerabend, F.; Maier, P.; Fischer, J.; Störmer, M.; Blawert, C.; Dietzel, W.; Hort, N. Biodegradable magnesium-hydroxyapatite metal matrix composites. Biomaterials 2007, 28, 2163–2174. [Google Scholar] [CrossRef] [PubMed]
- Antoniac, I.; Adam, R.; Biță, A.; Miculescu, M.; Trante, O.; Petrescu, I.M.; Pogărășteanu, M. Comparative Assessment of In Vitro and In Vivo Biodegradation of Mg-1Ca Magnesium Alloys for Orthopedic Applications. Materials 2020, 14, 84. [Google Scholar] [CrossRef] [PubMed]
- Staiger, M.P.; Pietak, A.M.; Huadmai, J.; Dias, G. Magnesium and its alloys as orthopedic biomaterials: A review. Biomaterials 2006, 27, 1728–1734. [Google Scholar] [CrossRef] [PubMed]
- Razavi, M.; Fathi, M.; Savabi, O.; Boroni, M. A Review of degradation properties of Mg based biodegradable implants. Res. Rev. Mater. Sci. Chem. 2012, 1, 15–58. [Google Scholar]
- Ghali, E.; Dietzel, W.; Kainer, K.U. General and localized corrosion of magnesium alloys: A critical review. J. Mater. Eng. Perform. 2004, 13, 7–23. [Google Scholar] [CrossRef]
- Adam, R.; Antoniac, I.; Avram, G.M.; Niculescu, M. Mg-1Ca alloy intramedullary nailing influence on bone callus formation and on vital organs functions, as an alternative to bioplastics. Rom. J. Milit. Med. 2022, 125, 15–23. [Google Scholar] [CrossRef]
- Hou, R.Q.; Ye, C.Q.; Chen, C.D.; Dong, S.G.; Lv, M.Q.; Zhang, S.; Pan, J.S.; Song, G.L.; Lin, C.J. Localized Corrosion of Binary Mg-Ca Alloy in 0.9 wt% Sodium Chloride Solution. Acta Met. Sin. Engl. 2016, 29, 46–57. [Google Scholar] [CrossRef]
- Salahshoor, M.; Guo, Y. Biodegradable Orthopedic Magnesium-Calcium (MgCa) Alloys, Processing, and Corrosion Performance. Materials 2012, 5, 135–155. [Google Scholar] [CrossRef]
- Adam, R.; Orban, C.; Gheorghiu, N.; Orban, H.; Antoniac, I. Bisphosphonates vs Atypical Femur Fractures—Influence on Bone Resorption. Key Eng. Mater. 2015, 638, 296–300. [Google Scholar] [CrossRef]
- Li, Z.; Gu, X.; Lou, S.; Zheng, Y. The development of binary Mg-Ca alloys for use as biodegradable materials within bone. Biomaterials 2008, 29, 1329–1344. [Google Scholar] [CrossRef] [PubMed]
- Li, N.; Zheng, Y. Novel Magnesium Alloys Developed for Biomedical Application: A Review. Mater. Sci. Technol. 2013, 29, 489–502. [Google Scholar] [CrossRef]
- Kim, W.C.; Kim, J.G.; Lee, J.Y.; Seok, H.K. Influence of calcium on the corrosion properties of magnesium for biomaterials. Mater. Lett. 2008, 62, 4146–4148. [Google Scholar] [CrossRef]
- Zreiqat, H.; Howlett, C.R.; Zannettino, A.; Evans, P.; Schulze-Tanzil, G.; Knabe, C.; Shakibaei, M. Mechanisms of magnesium-stimulated adhesion of osteoblastic cells to commonly used orthopaedic implants. J. Biomed. Mater. Res. 2002, 62, 175–184. [Google Scholar] [CrossRef]
- Kraus, T.; Fischerauer, S.F.; Hanzi, A.C.; Uggowitzer, P.J.; Loffler, J.F.; Weinberg, A.M. Magnesium alloys for temporary implants in osteosynthesis: In vivo studies of their degradation and interaction with bone. Acta Biomater. 2012, 8, 1230–1238. [Google Scholar] [CrossRef] [PubMed]
- Guillen, J. FELASA guidelines and recommendations. J. Am. Assoc. Lab. Anim. Sci. 2012, 51, 311–321. [Google Scholar]
- Fentener van Vlissingen, J.M.; Borrens, M.; Girod, A.; Lelovas, P.; Morrison, F.; Torres, Y.S. The reporting of clinical signs in laboratory animals: FELASA Working Group Report. Lab. Anim. 2015, 49, 267–283. [Google Scholar] [CrossRef]
- Pearce, A.I.; Richards, R.G.; Milz, S.; Schneider, E.; Pearce, S.G. Animal models for implant biomaterial research in bone: A review. Eur. Cell Mater. 2007, 13, 1–10. [Google Scholar] [CrossRef]
- Gorecki, G.; Cochior, D.; Moldovan, C.; Rusu, E. Molecular mechanisms in septic shock (Review). Exp. Ther. Med. 2021, 22, 1161. [Google Scholar] [CrossRef]
- Gu, X.N.; Zheng, Y.F.; Lan, Q.X.; Cheng, Y.; Zhang, Z.X.; Xi, T.F.; Zhang, D.Y. Surface modification of an Mg-1Ca alloy to slow down its biocorrosion by chitosan. Biomed. Mater. 2009, 4, 044109. [Google Scholar] [CrossRef]
- Li, N.; Li, Y.D.; Li, Y.X.; Wu, Y.H.; Zheng, Y.F.; Han, Y. Effect of surface mechanical attrition treatment on biodegradable Mg-1Ca alloy. Mater. Sci. Eng. C Mater. Biol. Appl. 2014, 35, 314–321. [Google Scholar] [CrossRef] [PubMed]
- Liu, Y.; Bian, D.; Wu, Y.; Li, N.; Qiu, K.; Zheng, Y.; Han, Y. Influence of biocompatible metal ions (Ag, Fe, Y) on the surface chemistry, corrosion behavior and cytocompatibility of Mg-1Ca alloy treated with MEVVA. Colloids Surf B Biointerfaces 2015, 133, 99–107. [Google Scholar] [CrossRef] [PubMed]
- Dubey, A.; Jaiswal, S.; Haldar, S.; Roy, P.; Lahiri, D. Functionally gradient magnesium-based composite for temporary orthopaedic implant with improved corrosion resistance and osteogenic properties. Biomed. Mater. 2020, 16, 015017. [Google Scholar] [CrossRef]
- He, W.; Zhang, H.; Qiu, J. Osteogenic effects of bioabsorbable magnesium implant in rat mandibles and in vitro. J. Periodontol. 2021, 92, 1181–1191. [Google Scholar] [CrossRef] [PubMed]
- Lee, J.H.; Baek, S.M.; Lee, G.; Kim, S.J.; Kim, H.S.; Hahn, S.K. Biocompatible Magnesium Implant Double-Coated with Dexamethasone-Loaded Black Phosphorus and Poly(lactide-co-glycolide). ACS Appl. Bio Mater. 2020, 3, 8879–8889. [Google Scholar] [CrossRef]
- Imwinkelried, T.; Beck, S.; Schaller, B. Pre-clinical testing of human size magnesium implants in miniature pigs: Implant degradation and bone fracture healing at multiple implantation sites. Mater. Sci. Eng. C Mater. Biol. Appl. 2020, 108, 110389. [Google Scholar] [CrossRef] [PubMed]
- Jaiswal, S.; Dubey, A.; Haldar, S.; Roy, P.; Lahiri, D. Differential in vitro degradation and protein adhesion behaviour of spark plasma sintering fabricated magnesium-based temporary orthopaedic implant in serum and simulated body fluid. Biomed. Mater. 2019, 15, 015006. [Google Scholar] [CrossRef]
- Guan, R.-G.; Johnson, I.; Cui, T.; Zhao, T.; Zhao, Z.-Y.; Li, X.; Liu, H. Electrodeposition of hydroxyapatite coating on Mg-4.0Zn-1.0Ca-0.6Zr alloy and in vitro evaluation of degradation, hemolysis, and cytotoxicity. J. Biomed. Mater. Res. Part A 2012, 100, 999–1015. [Google Scholar] [CrossRef]
- ASTM F756-17; Standard Recommended Practice for the Assessment of the Hemolytic Properties of Materials. American Society for Testing and Materials: New York, NY, USA, 1978; pp. 318–320.
- Li, W.; Qiao, W.; Liu, X.; Bian, D.; Shen, D.; Zheng, Y.; Wu, J.; Kwan, K.Y.H.; Wong, T.M.; Cheung, K.M.C.; et al. Biomimicking Bone-Implant Interface Facilitates the Bioadaption of a New Degradable Magnesium Alloy to the Bone Tissue Microenvironment. Adv. Sci. 2021, 8, 2102035. [Google Scholar] [CrossRef]
- Xiong, P.; Jia, Z.; Zhou, W.; Yan, J.; Wang, P.; Yuan, W.; Li, Y.; Cheng, Y.; Guan, Z.; Zheng, Y. Osteogenic and pH stimuli-responsive self-healing coating on biomedical Mg-1Ca alloy. Acta Biomater. 2019, 92, 336–350. [Google Scholar] [CrossRef]
- Abdal-Hay, A.; Hasan, A.; Kim, Y.K.; Lee, M.H.; Hamdy, A.S.; Khalil, K.A. Biocorrosion behavior of biodegradable nanocomposite fibers coated layer-by-layer on AM50 magnesium implant. Mater. Sci. Eng. C Mater. Biol. Appl. 2016, 58, 1232–1241. [Google Scholar] [CrossRef] [PubMed]
- Amerstorfer, F.; Fischerauer, S.; Fischer, L.; Eichler, J.; Draxler, J.; Zitek, A.; Meischel, M.; Martinelli, E.; Kraus, T.; Hann, S.; et al. Long-term in vivo degradation behavior and near-implant distribution of resorbed elements for magnesium alloys WZ21 and ZX50. Acta Biomater. 2016, 42, 440–450. [Google Scholar] [CrossRef] [PubMed]
- Burmester, A.; Willumeit-Romer, R.; Feyerabend, F. Behavior of bone cells in contact with magnesium implant material. J. Biomed. Mater. Res. B Appl. Biomater. 2017, 105, 165–179. [Google Scholar] [CrossRef]
- Zhu, W.-Y.; Guo, J.; Yang, W.-F.; Tao, Z.-Y.; Lan, X.; Wang, L.; Xu, J.; Qin, L.; Su, Y.-X. Biodegradable magnesium implant enhances angiogenesis and alleviates medication-related osteonecrosis of the jaw in rats. J. Orthop. Translat. 2022, 33, 153–161. [Google Scholar] [CrossRef] [PubMed]
- Sun, Y.; Helmholz, H.; Will, O.; Damm, T.; Wiese, B.; Luczak, M.; Peschke, E.; Luthringer-Feyerabend, B.; Ebel, T.; Hövener, J.-B.; et al. Dynamic in vivo monitoring of fracture healing process in response to magnesium implant with multimodal imaging: Pilot longitudinal study in a rat external fixation model. Biomater. Sci. 2022, 10, 1532–1543. [Google Scholar] [CrossRef]
- Nasr Azadani, M.; Zahedi, A.; Bowoto, O.K.; Oladapo, B.I. A review of current challenges and prospects of magnesium and its alloy for bone implant applications. Prog. Biomater. 2022, 11, 1–26. [Google Scholar] [CrossRef]
- Smith, M.E.; Rose, D.P.; Cui, X.; Stastny, A.L.; Zhang, P.; Heineman, W.R. A Visual Hydrogen Sensor Prototype for Monitoring Magnesium Implant Biodegradation. Anal. Chem. 2021, 93, 10487–10494. [Google Scholar] [CrossRef]
- Han, Z.; Bhavsar, M.; Leppik, L.; Oliveira, K.M.C.; Barker, J.H. Histological Scoring Method to Assess Bone Healing in Critical Size Bone Defect Models. Tissue Eng. Part C Methods 2018, 24, 272–279. [Google Scholar] [CrossRef]
- Di Carlo, S.; De Angelis, F.; Brauner, E.; Rosella, D.; Papi, P.; Pompa, G.; Saptefrati, L.; Cimpean, A.M.A.; Ciobanu, G. Histological and immunohistochemical evaluation of mandibular bone tissue regeneration. Int. J. Immunopathol. Pharmacol. 2018, 32, 2058738418798249. [Google Scholar] [CrossRef]


| Specimen No. | Weight (Kg) |
|---|---|
| 1 | 4.1 |
| 2 | 3.5 |
| 3 | 4.2 |
| 4 | 5.7 |
| 5 | 5.2 |
| 6 | 7 |
| 7 | 6.8 |
| 8 | 5 |
| 9 | 4.4 |
| 10 | 3.8 |
| Clinical Parameter | Qualifier | Score |
|---|---|---|
| Weight loss | Without | 0 |
| 5% | 1 | |
| 10% | 5 | |
| 20% | 20 | |
| Sounds made (vocalization) | Without | 0 |
| Provoked | 5 | |
| Unprovoked | 10 | |
| Posture | Normal | 0 |
| Kyphotic | 10 | |
| Mobility | Normal | 0 |
| Low | 5 | |
| Without mobility | 10 | |
| Surgical incision | No dehiscence | 0 |
| Partial dehiscence | 5 | |
| Total dehiscence/pathological secretions | 10 |
| Class | Element | Values |
|---|---|---|
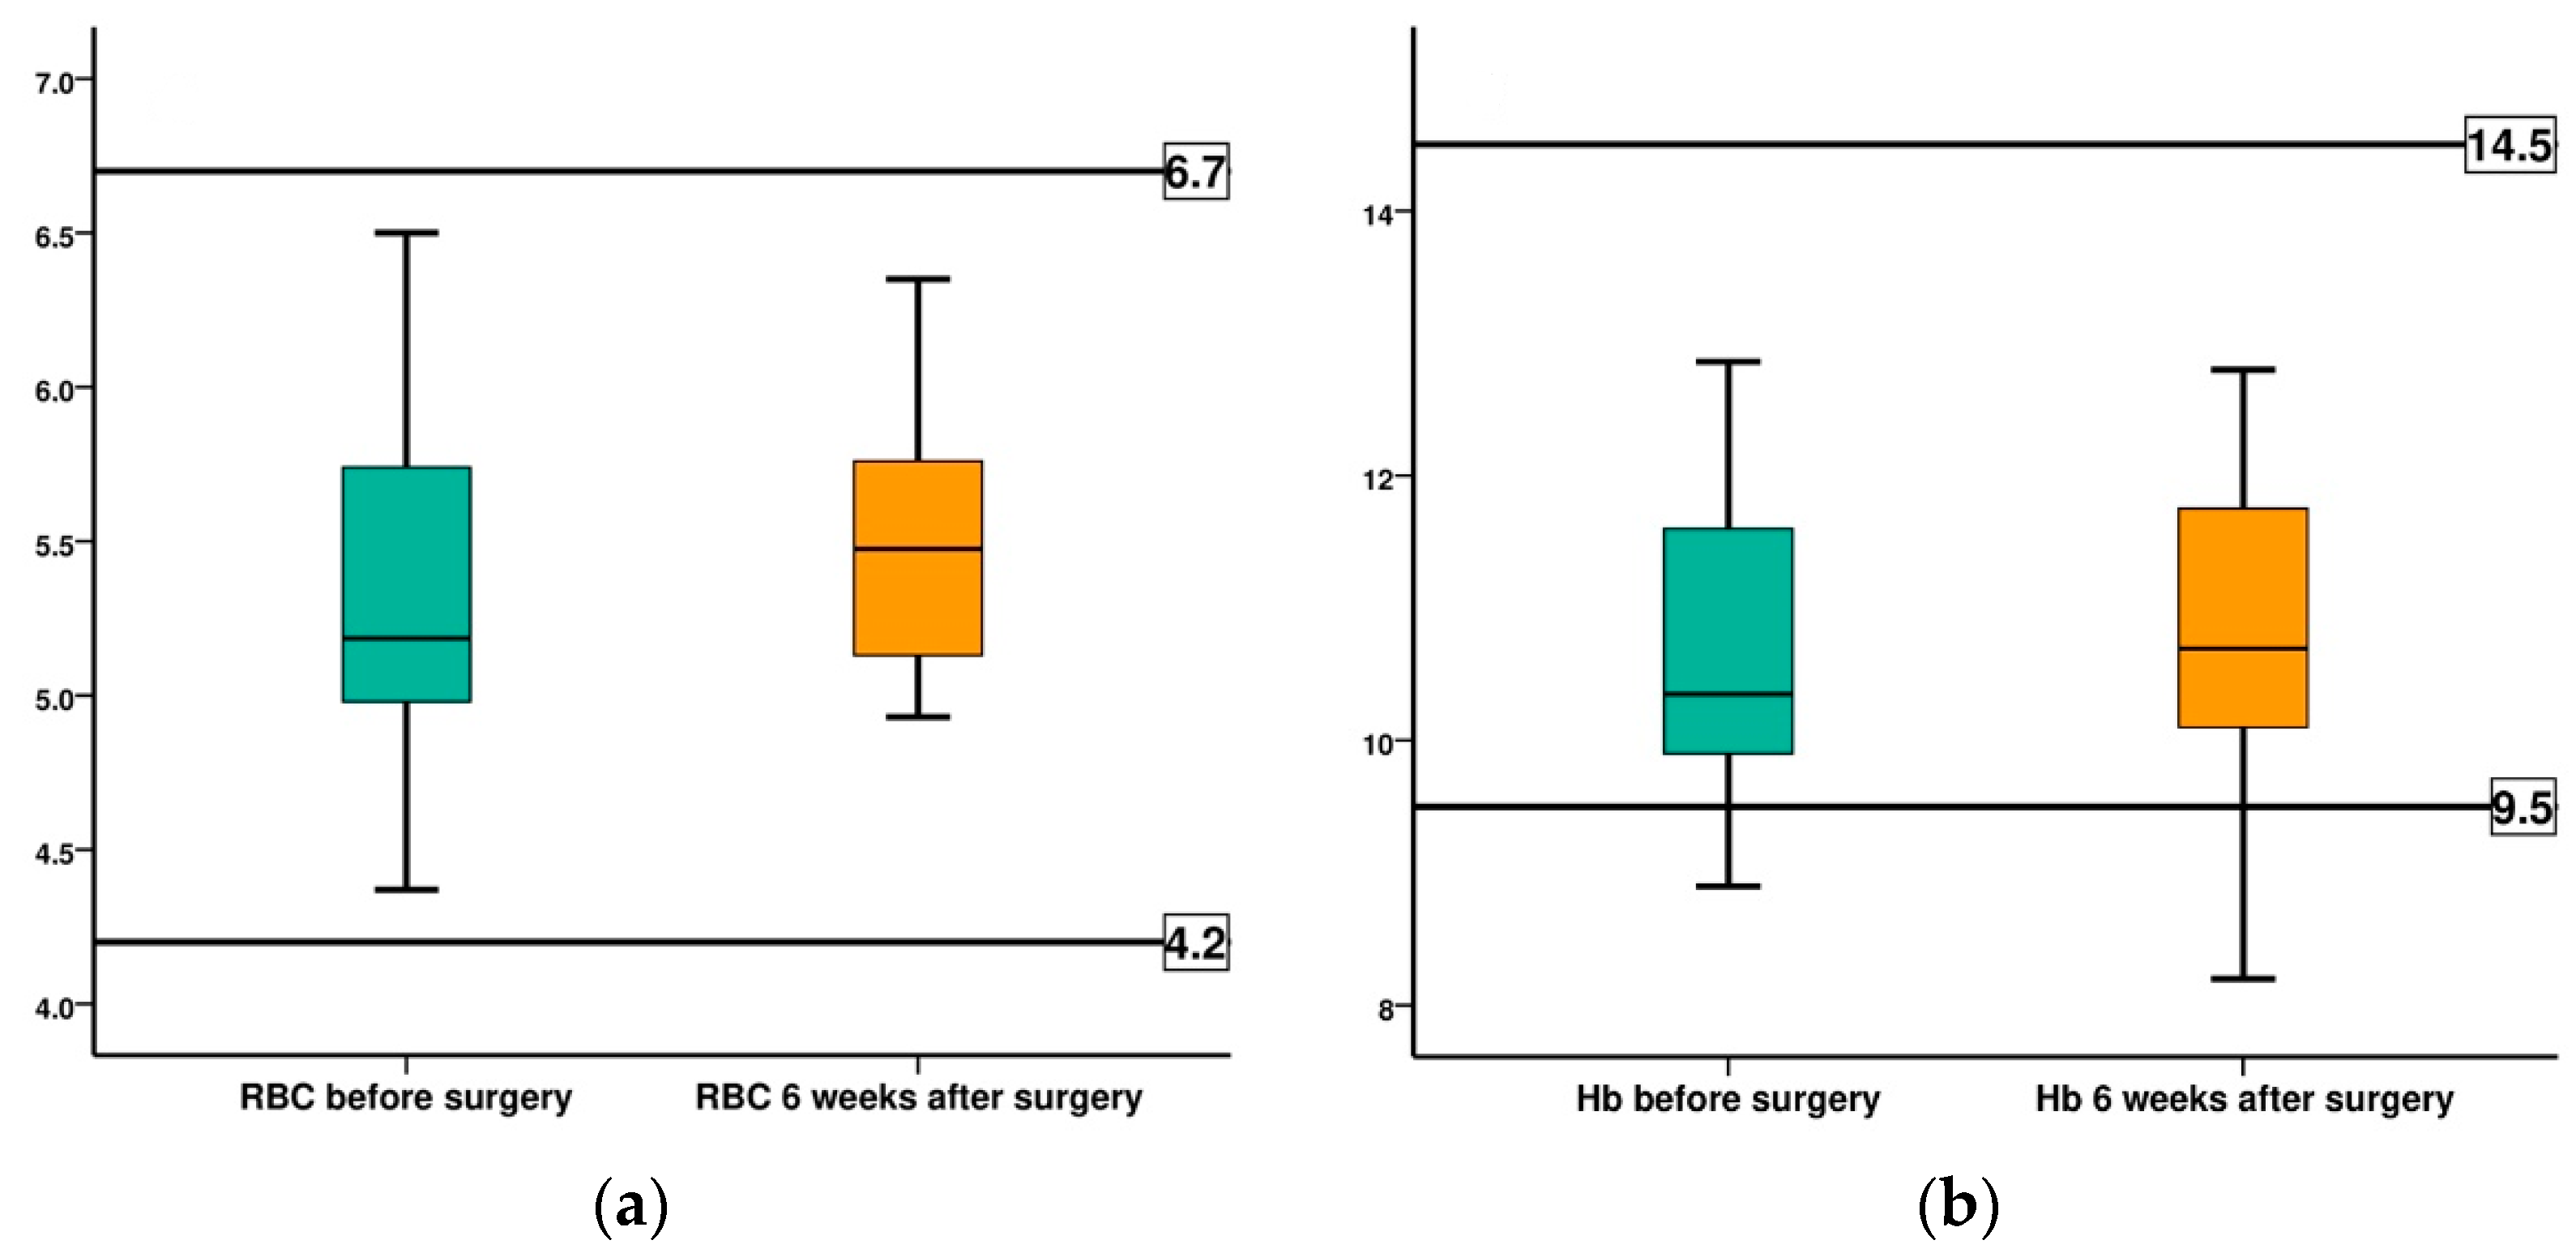
| CBC | Red blood cells (RBC) | 4.2–6.7 (M/μL) |
| Hemoglobin (HGB) | 9.5–14.5 (g/dL) | |
| Hematocrit (HCT) | 27.1–45.9 (%) | |
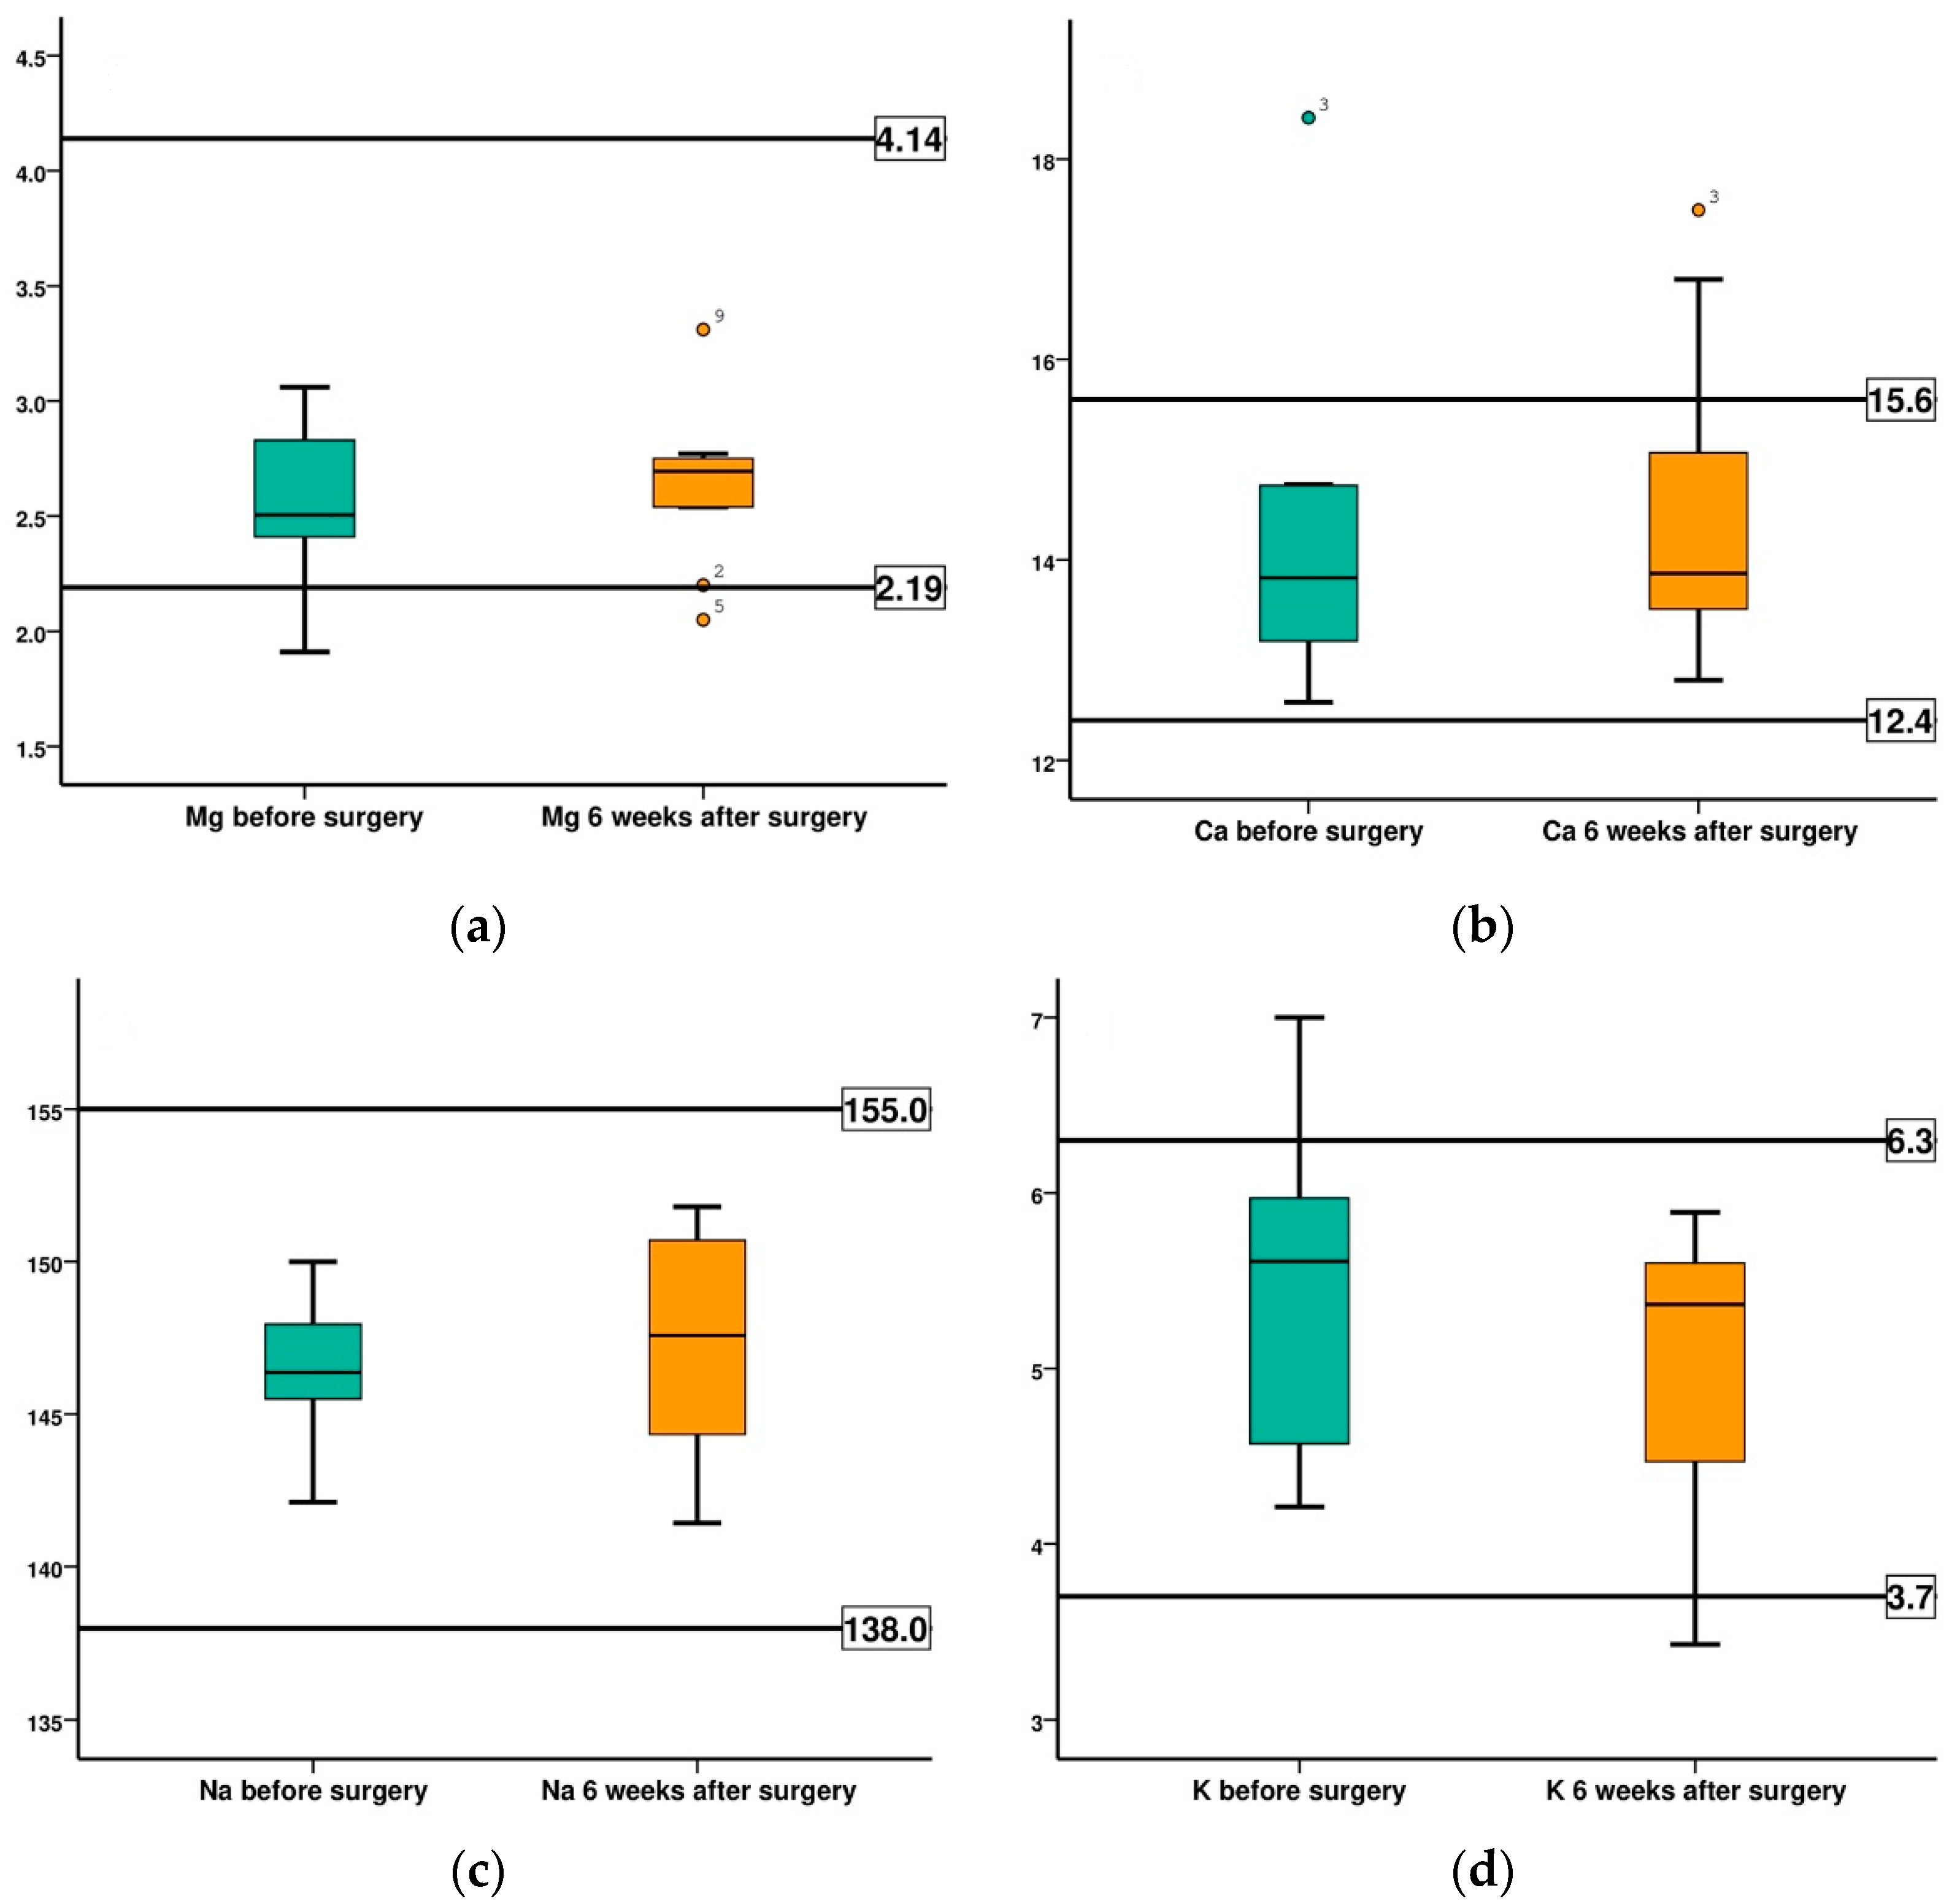
| SE | Magnesium (Mg) | 2.19–4.14 (mg/dL) |
| Calcium (Ca) | 12.4–15.6 (mg/dL) | |
| Seric iron | 111.7–329.6 (µg/dL) | |
| Sodium (Na+) | 138–155 (mmol/L) | |
| Potassium (K+) | 3.7–6.3 (mmol/L) | |
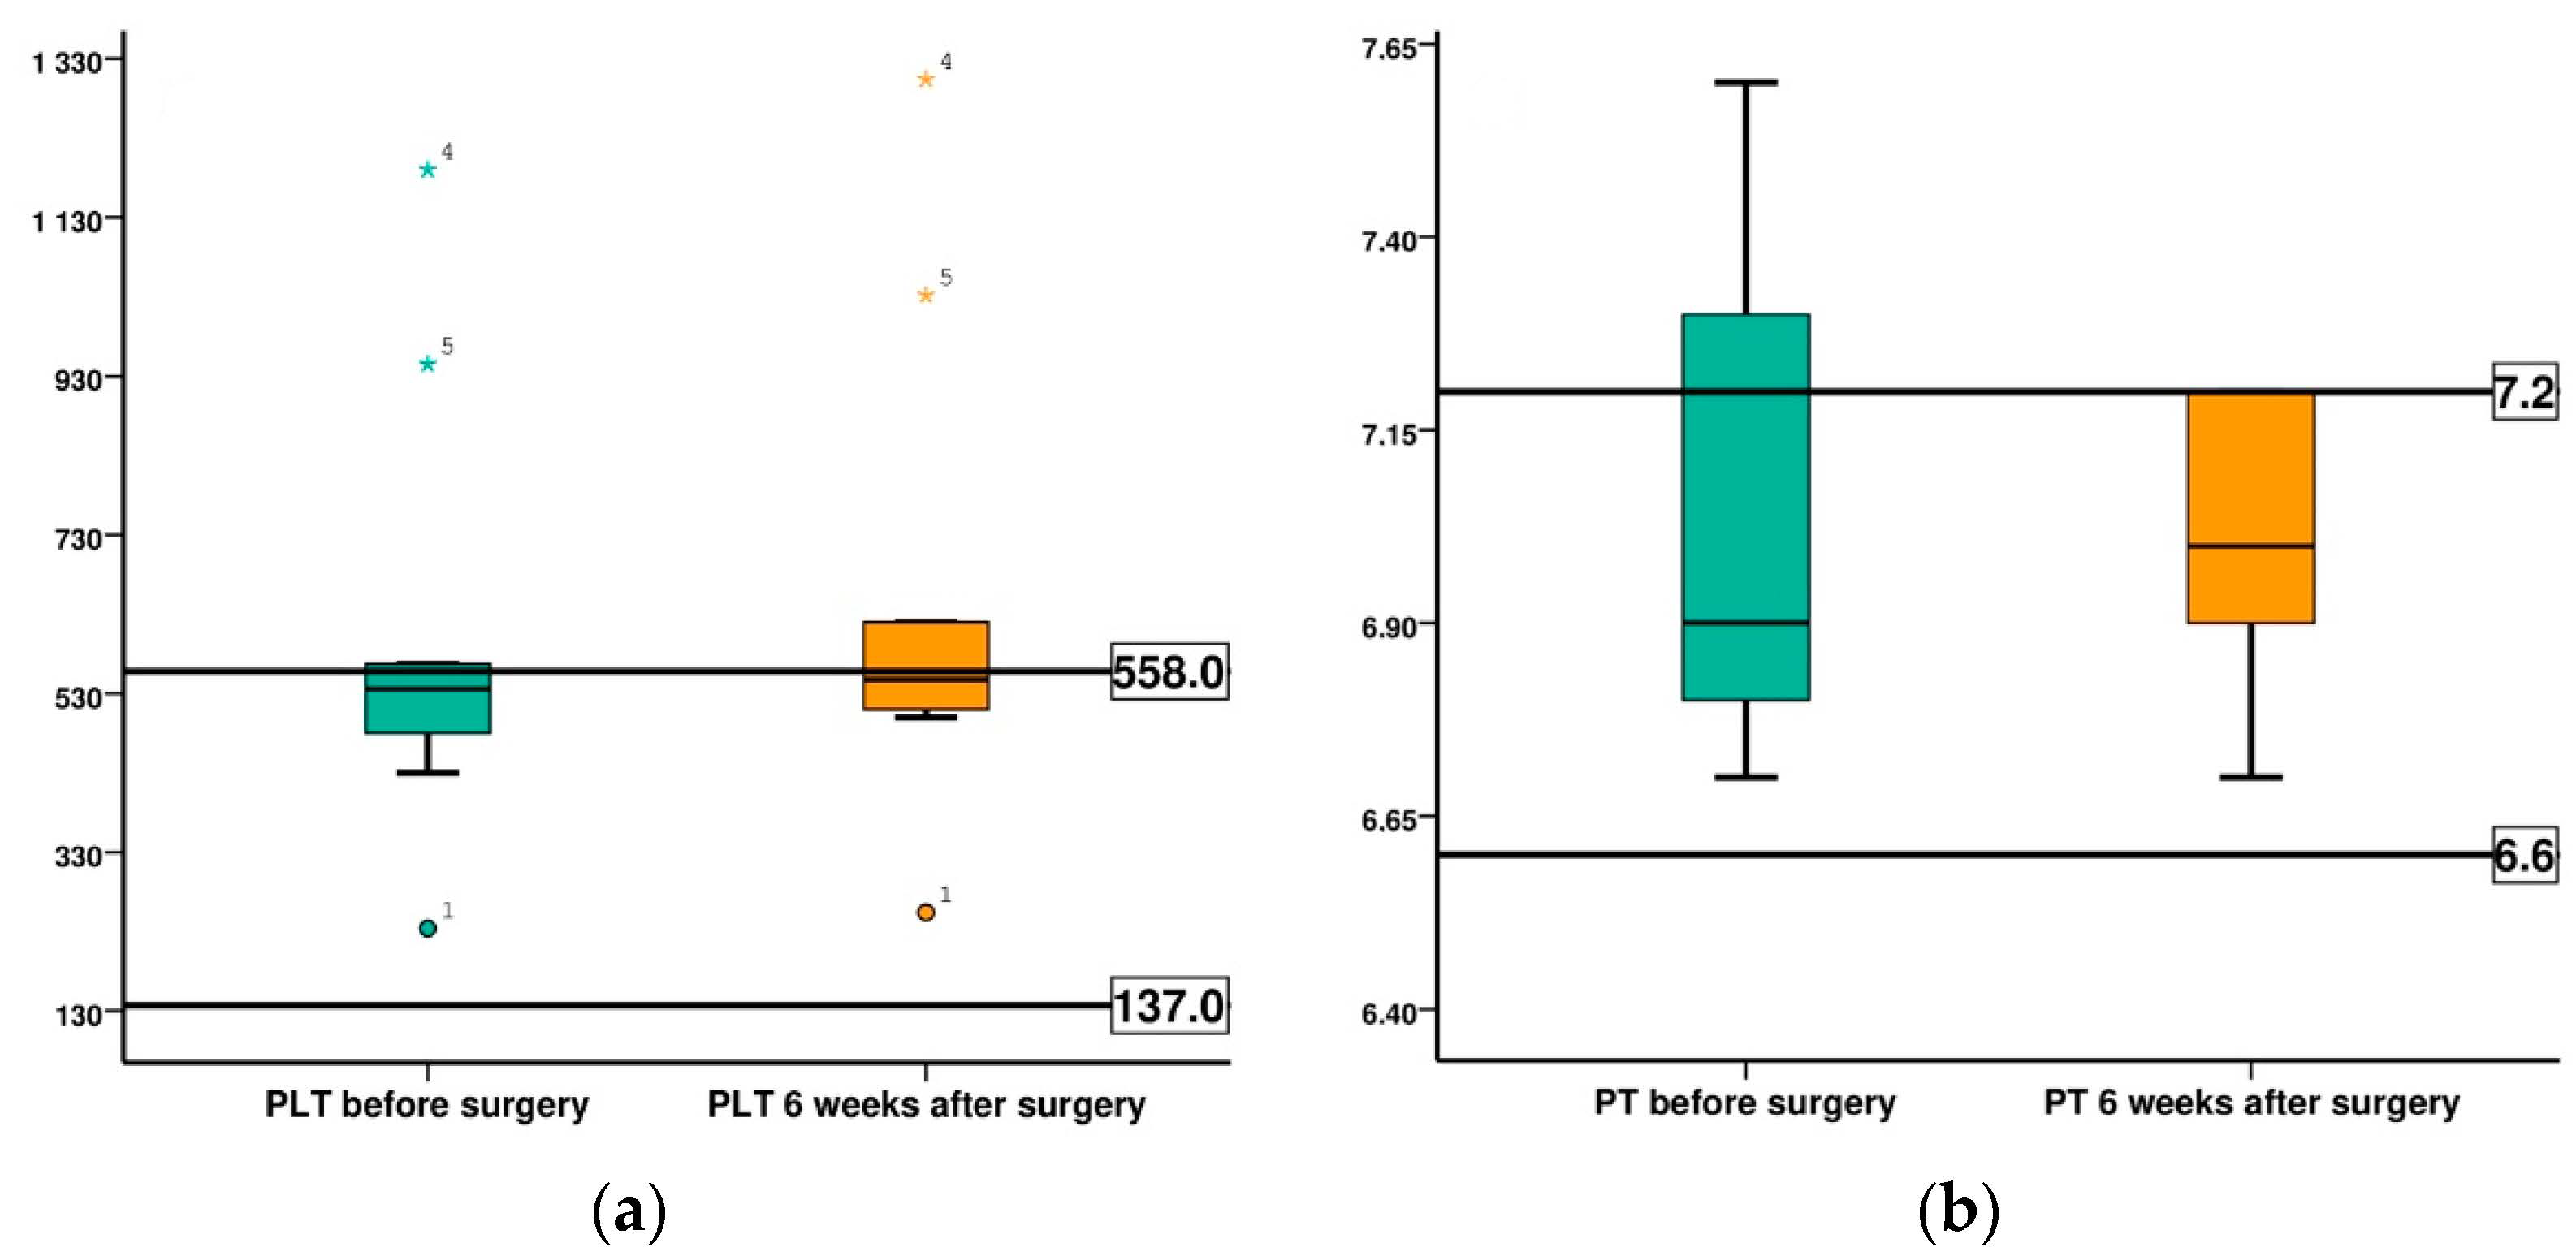
| Coagulation markers | Thrombocytes (PLT) | 137–558 (K/μL) |
| Prothrombin Time (PT) | 6.6–7.2 sec | |
| Partially Activated Thromboplastin Time (aPTT) | 20–22 sec | |
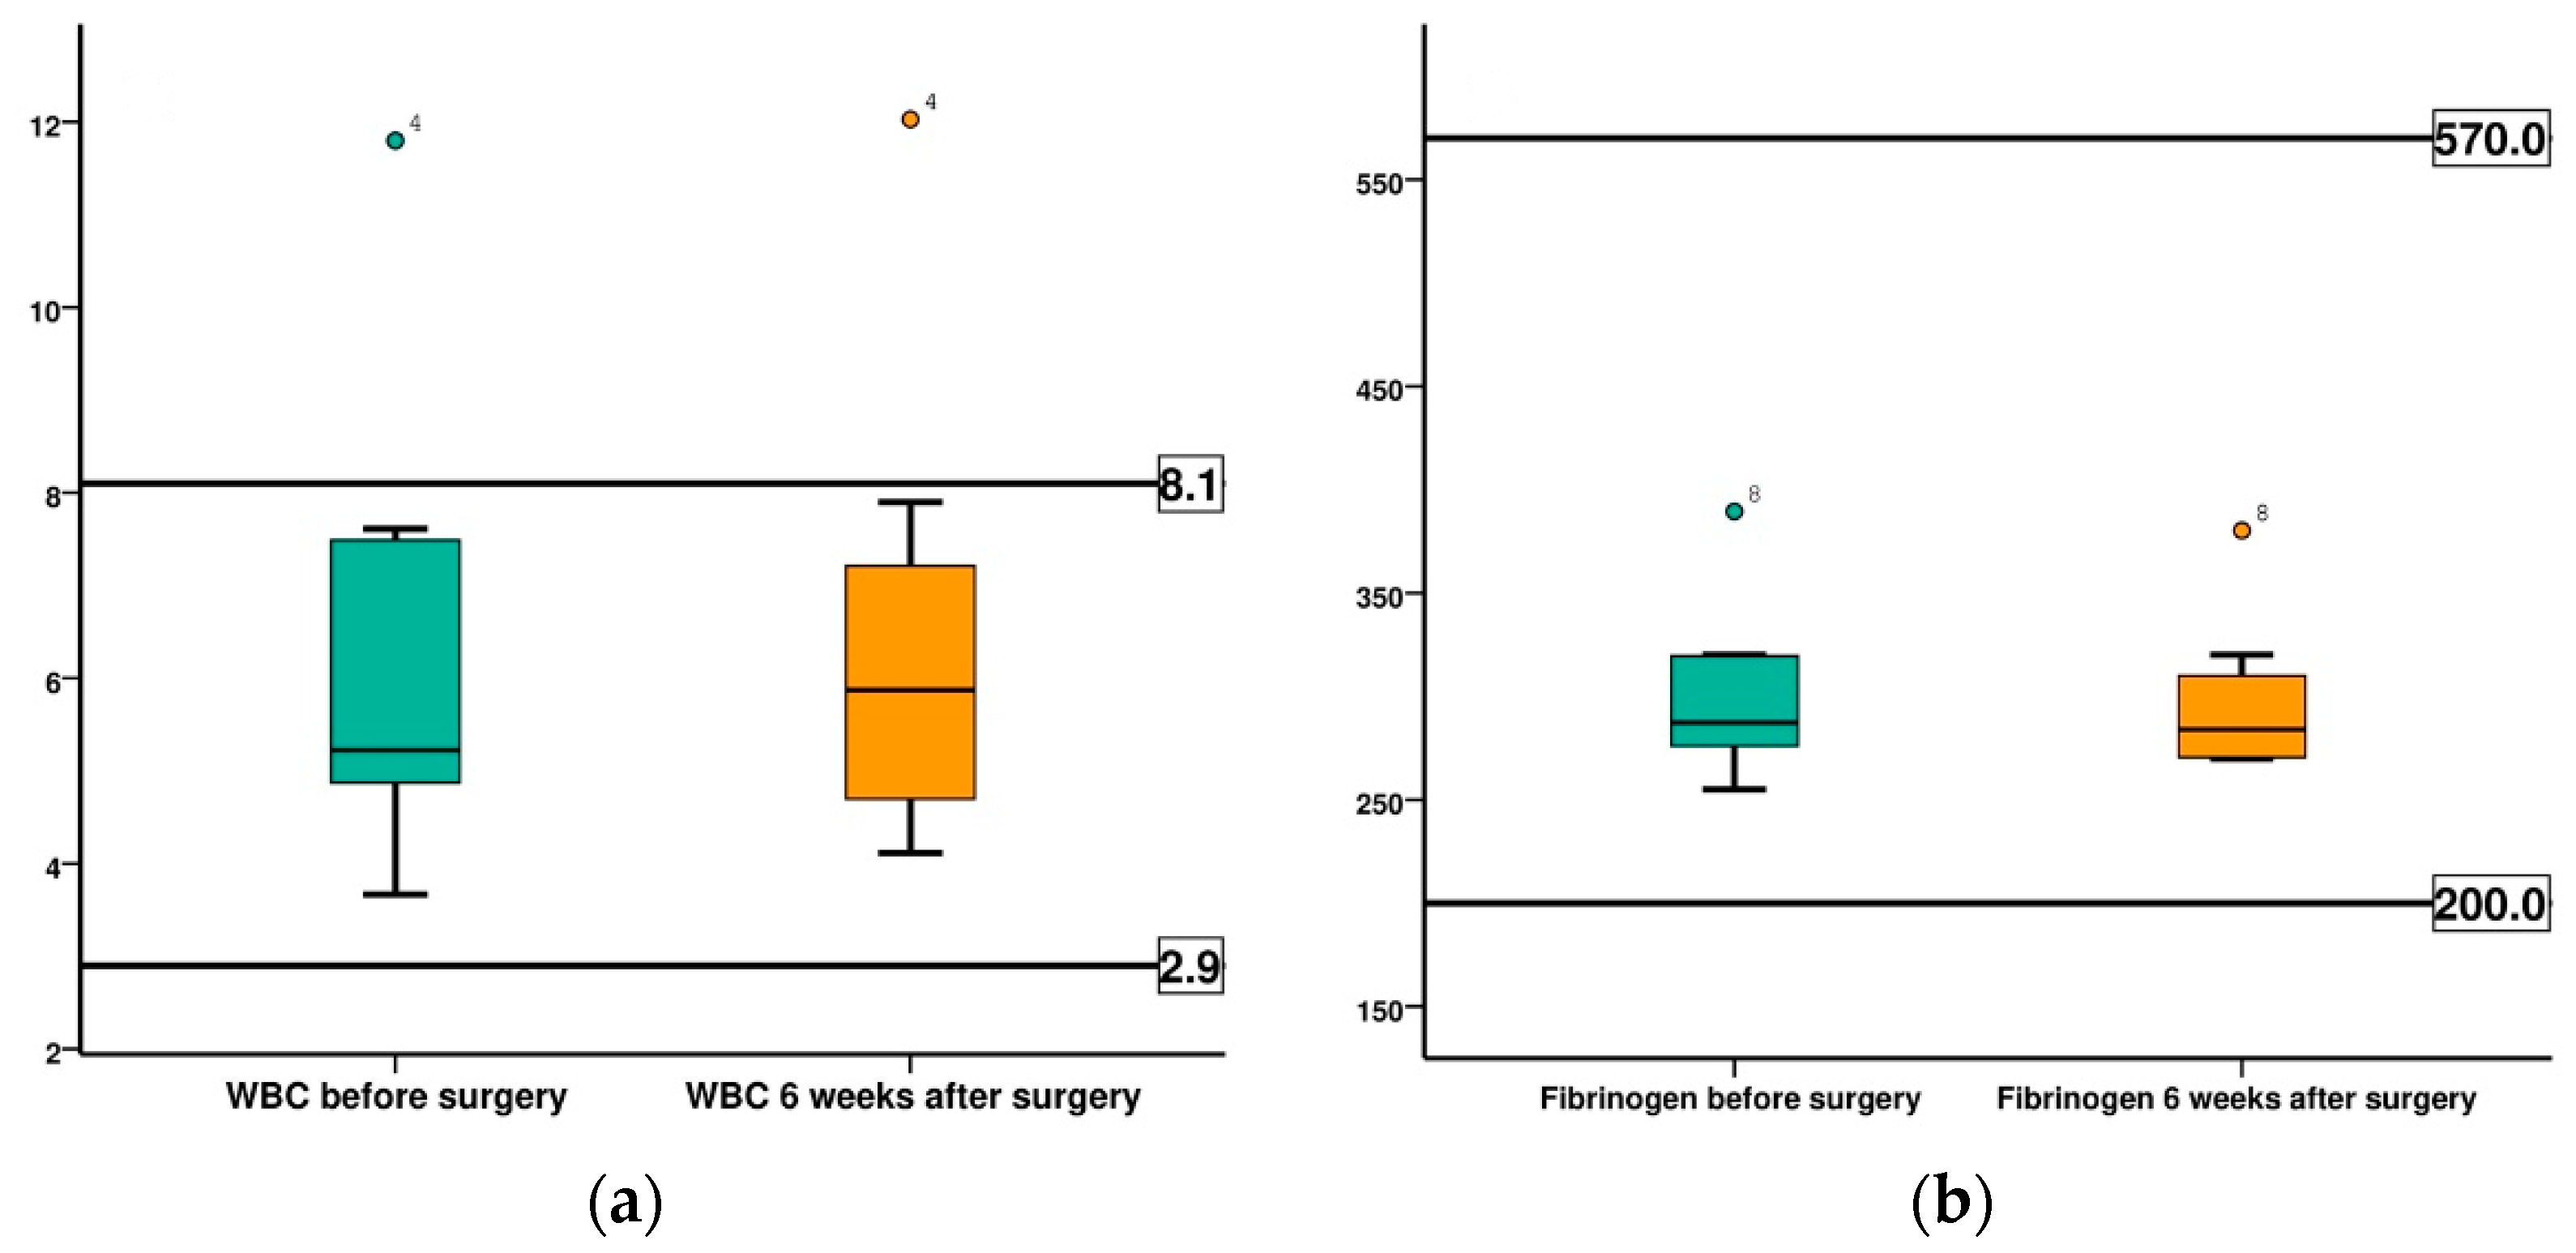
| Inflammatory markers | Leukocyte (WBC) | 2.9–8.1 (K/μL) |
| Fibrinogen | 200–570 (mg/dL) | |
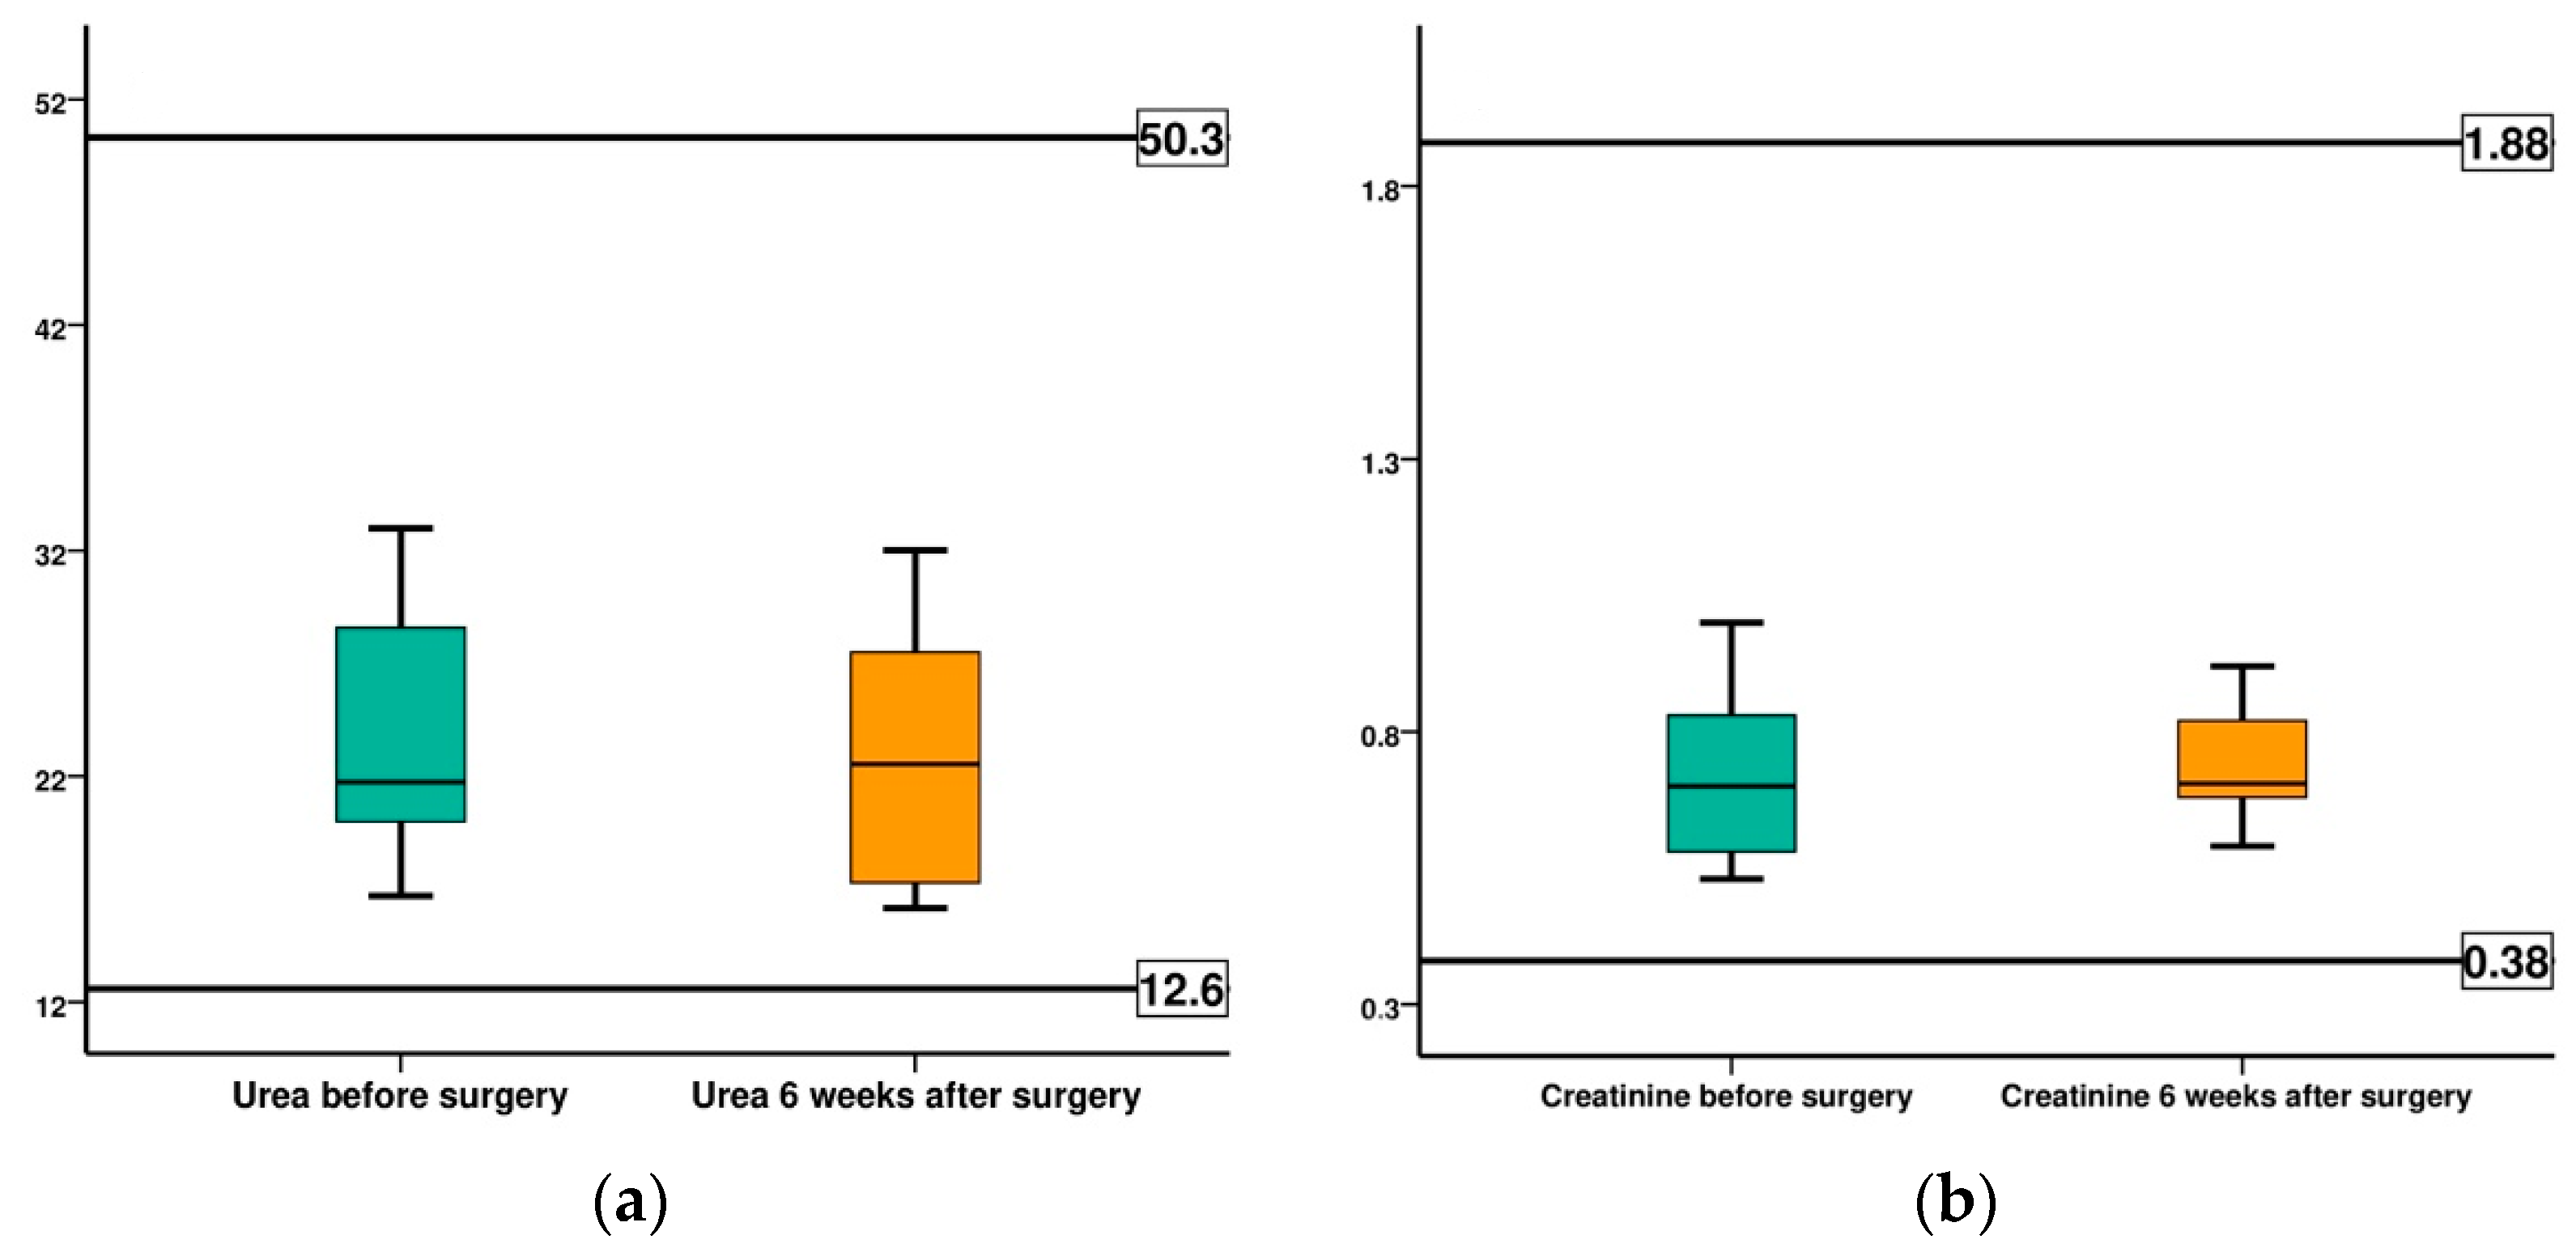
| Functional markers | Serum Urea | 12.6–50.3 (mg/dL) |
| Creatinine | 0.38–1.88 (mg/dL) | |
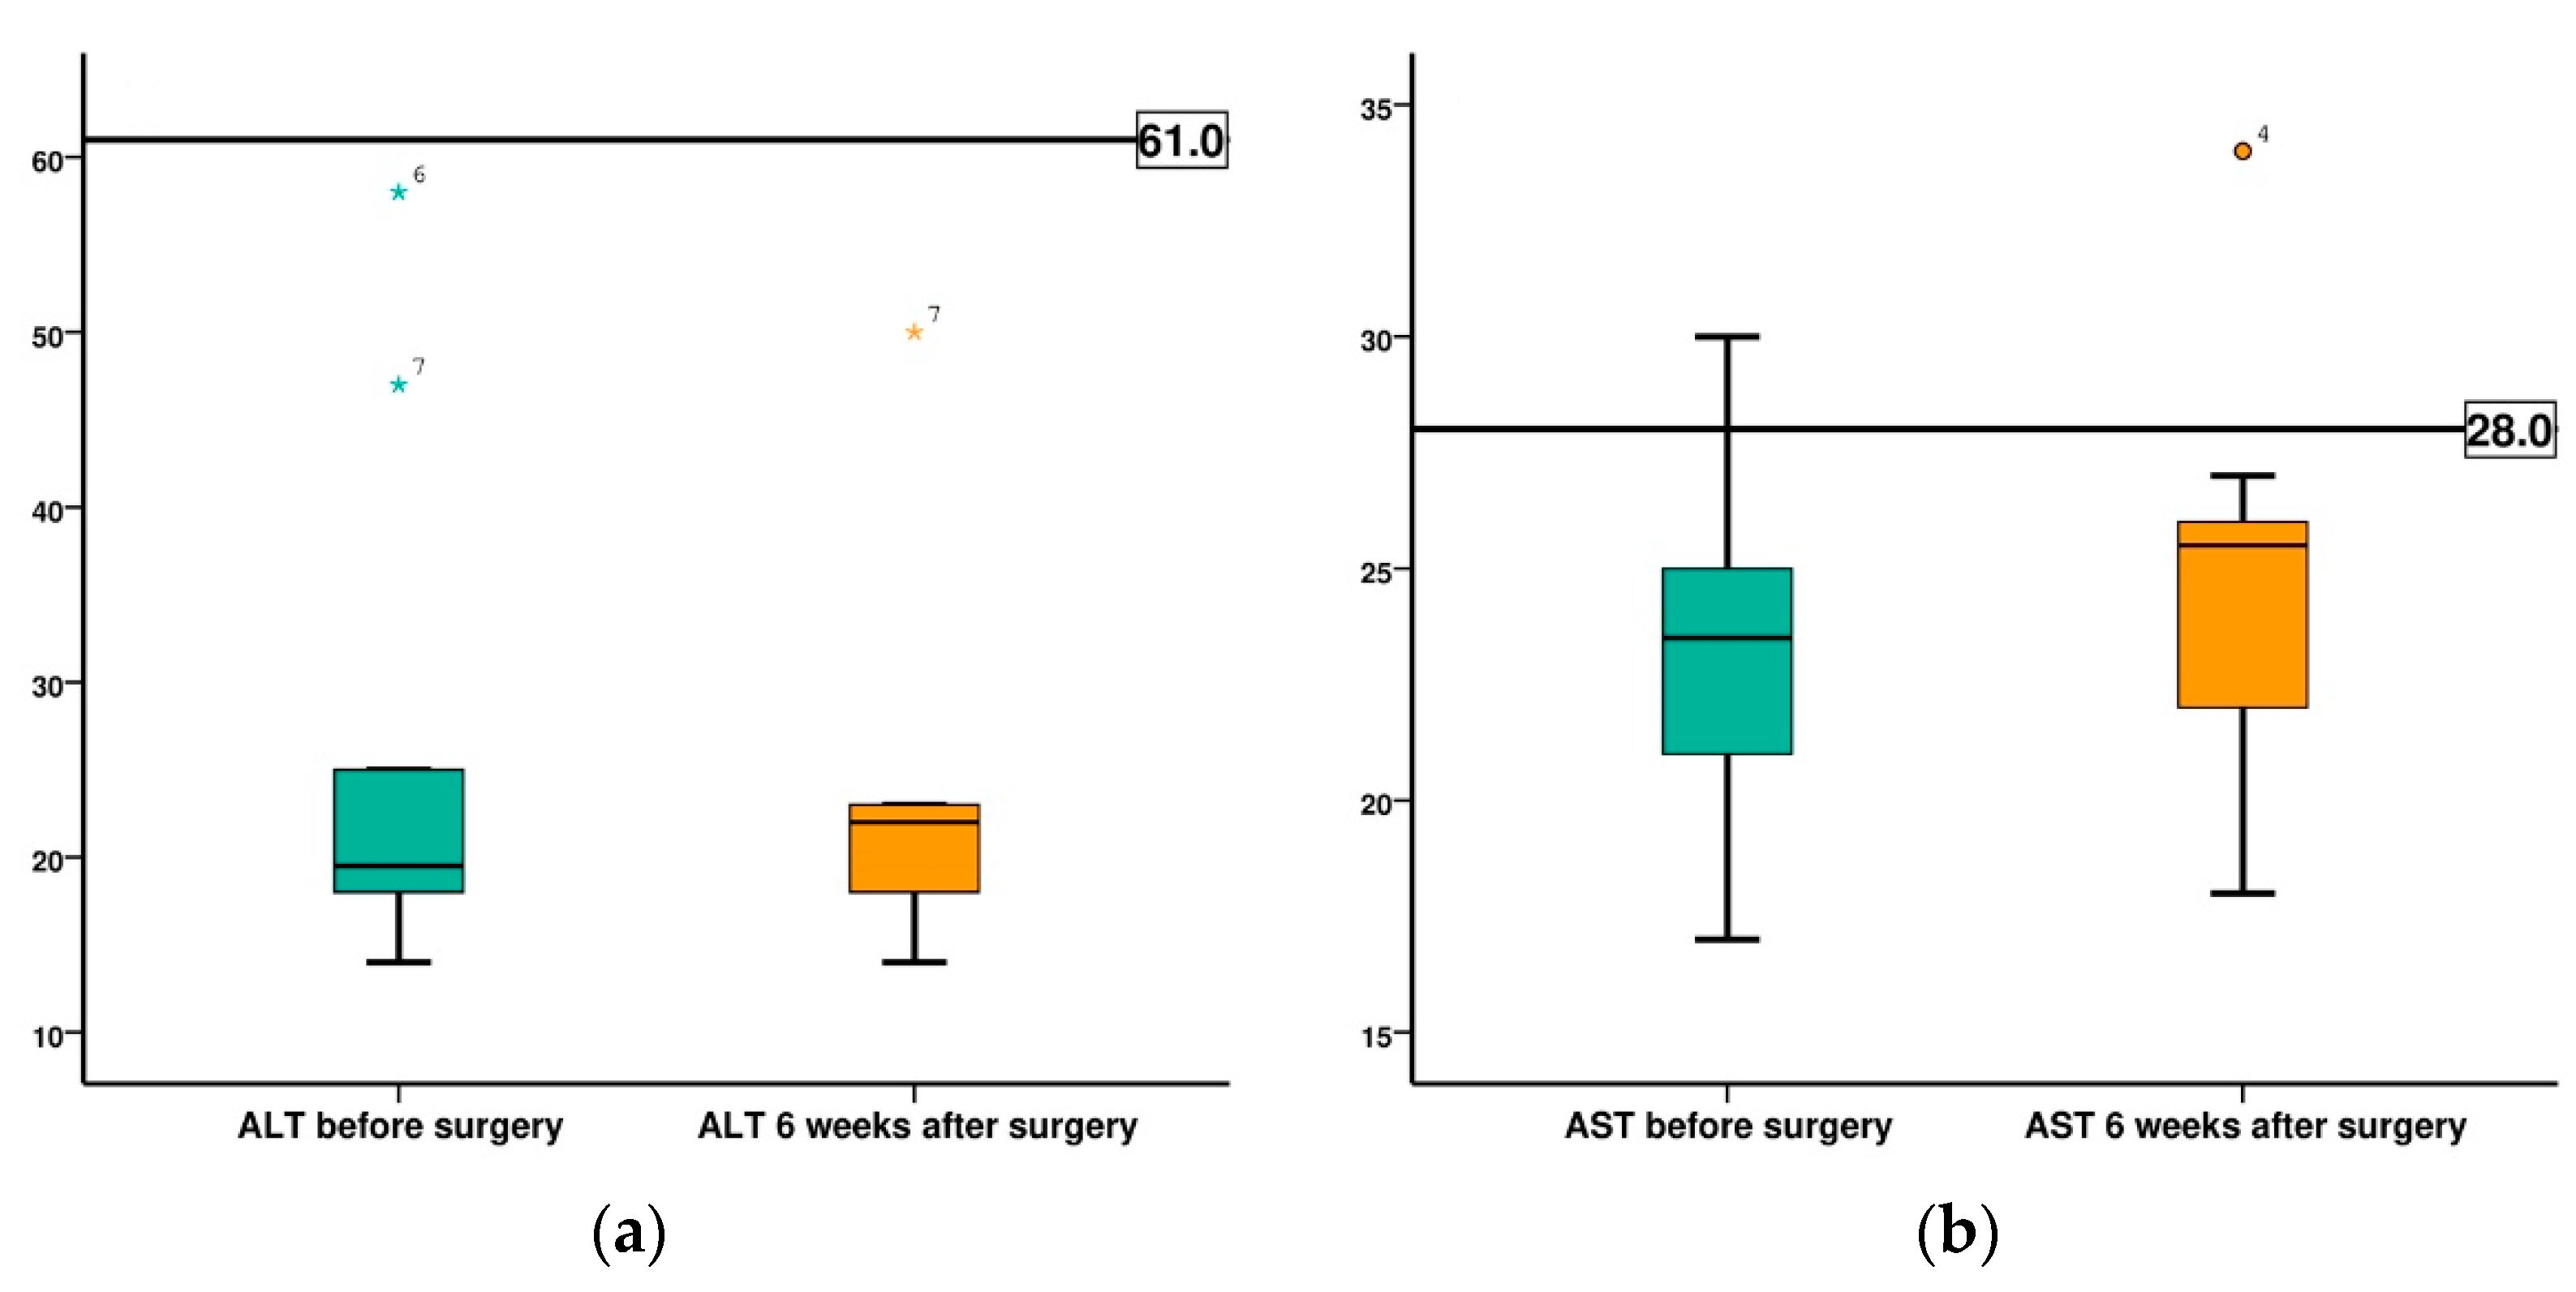
| Alanine transaminase (ALT) | <61 (UI/L) | |
| Aspartate aminotransferase (AST) | <28 (UI/L) | |
| Alkaline phosphatase (ALP) | <397 (UI/L) |
| Specimen No. | Before Surgery (BS) (Kg) | 2 Weeks after Surgery (AS) (Kg) | 4 Weeks after Surgery (AS) (Kg) | 6 Weeks after Surgery (AS) (Kg) |
|---|---|---|---|---|
| 1 | 4.1 | 3.7 | 3.5 | 3.7 |
| 2 | 3.5 | 3.4 | 3.4 | 3.5 |
| 3 | 4.2 | 3.9 | 4.0 | 4.1 |
| 4 | 5.7 | 5.1 | 4.9 | 5.1 |
| 5 | 5.2 | 4.8 | 4.9 | 5.1 |
| 6 | 7.0 | 6.3 | 6.3 | 6.5 |
| Specimen No. | Before Surgery (BS) (Kg) | 2 Weeks after Surgery (AS) (Kg) | 4 Weeks after Surgery (AS) (Kg) | 6 Weeks after Surgery (AS) (Kg) |
|---|---|---|---|---|
| 7 | 6.8 | 6.6 | 6.5 | 6.6 |
| 8 | 5.0 | 4.6 | 4.8 | 5.0 |
| 9 | 4.4 | 4.0 | 4.2 | 4.3 |
| 10 | 3.8 | 3.4 | 3.6 | 3.7 |
| Specimen No. | Before Surgery (BS) | 2 Weeks after Surgery (AS) | 4 Weeks after Surgery (AS) | 6 Weeks after Surgery (AS) |
|---|---|---|---|---|
| 1 | 0 | 11 | 15 | 6 |
| 2 | 0 | 6 | 6 | 1 |
| 3 | 0 | 6 | 1 | 1 |
| 4 | 0 | 15 | 11 | 6 |
| 5 | 0 | 11 | 6 | 1 |
| 6 | 0 | 15 | 11 | 6 |
| Specimen No. | Before Surgery (BS) | 2 Weeks after Surgery (AS) | 4 Weeks after Surgery (AS) | 6 Weeks after Surgery (AS) |
|---|---|---|---|---|
| 7 | 0 | 11 | 10 | 6 |
| 8 | 0 | 11 | 5 | 6 |
| 9 | 0 | 11 | 6 | 1 |
| 10 | 0 | 12 | 6 | 1 |
| Parameter | Time | Rabbit 1 | Rabbit 2 | Rabbit 3 | Rabbit 4 | Rabbit 5 | Rabbit 6 | Rabbit 7 | Rabbit 8 | Rabbit 9 | Rabbit 10 |
|---|---|---|---|---|---|---|---|---|---|---|---|
| Mg (mg/dL) | BS | 2.41 | 2.99 | 2.55 | 2.44 | 1.91 | 2.40 | 2.46 | 2.76 | 3.06 | 2.83 |
| 6 weeks AS | 2.72 | 2.20 | 2.67 | 2.77 | 2.05 | 2.75 | 2.57 | 2.74 | 3.31 | 2.54 | |
| Ca (mg/dL) | BS | 14.75 | 13.78 | 18.41 | 14.74 | 13.19 | 12.58 | 12.89 | 13.86 | 14.32 | 13.58 |
| 6 weeks AS | 13.75 | 16.80 | 17.49 | 15.07 | 14.51 | 12.80 | 13.51 | 12.97 | 13.98 | 13.72 | |
| Seric iron (µg/dL) | BS | 185.51 | 109.86 | 111.41 | 130.69 | 93.28 | 123.45 | 115.34 | 127.80 | 130.62 | 129.40 |
| 6 weeks AS | 180.2 | 175.2 | 120.8 | 140.65 | 131.82 | 127.8 | 113.74 | 130.2 | 126.75 | 130.45 | |
| Na+ (mmol/L) | BS | 146.31 | 150 | 147.95 | 145.50 | 148.20 | 145.98 | 143.56 | 146.43 | 147.80 | 142.12 |
| 6 weeks AS | 151.80 | 151.20 | 150.70 | 150.20 | 144.55 | 141.43 | 144.34 | 145.67 | 149.50 | 143.65 | |
| K+ (mmol/L) | BS | 7 | 4.24 | 6.13 | 5.88 | 5.41 | 5.97 | 5.81 | 4.57 | 4.21 | 5.27 |
| 6 weeks AS | 3.43 | 4.47 | 5.89 | 5.76 | 5.34 | 5.60 | 5.52 | 4.79 | 4.30 | 5.39 |
| Statistic Test | Mg at 6 Weeks—Mg, BS | Ca, at 6 Weeks—Ca, BS | Na, at 6 Weeks—Na, BS | K, at 6 Weeks—K, BS |
|---|---|---|---|---|
| Z | −1.070 b | −0.255 b | −1.172 b | −1.122 c |
| Asymp. Sig. (2-tailed) | 0.285 | 0.799 | 0.241 | 0.262 |
| Parameter | Time | Rabbit 1 | Rabbit 2 | Rabbit 3 | Rabbit 4 | Rabbit 5 | Rabbit 6 | Rabbit 7 | Rabbit 8 | Rabbit 9 | Rabbit 10 |
|---|---|---|---|---|---|---|---|---|---|---|---|
| Erythrocyte (RBC) (M/μL) | BS | 5.50 | 5.10 | 4.90 | 5.25 | 4.37 | 6.50 | 5.12 | 4.98 | 5.84 | 5.74 |
| 6 weeks AS | 5.70 | 5.00 | 5.20 | 5.32 | 4.93 | 6.35 | 5.76 | 5.13 | 6.15 | 5.63 | |
| Hemoglobin (HGB) (g/dL) | BS | 12.86 | 11.50 | 10.40 | 9.75 | 8.90 | 9.90 | 10.30 | 12.40 | 11.60 | 10.30 |
| 6 weeks AS | 12.80 | 11.75 | 10.20 | 10.00 | 8.20 | 10.10 | 10.79 | 12.60 | 11.65 | 10.60 | |
| Hematocrit (HCT) (%) | BS | 35.60 | 29.0 | 30.4 | 32.10 | 27.80 | 38.90 | 32.60 | 25.60 | 33.60 | 35.76 |
| 6 weeks AS | 37.30 | 32.60 | 31.70 | 31.90 | 26.90 | 39.90 | 31.70 | 25.40 | 32.10 | 34.90 | |
| Leucocyte (WBC) (K/μL) | BS | 4.87 | 5.67 | 4.77 | 11.80 | 7.61 | 5.44 | 7.49 | 3.67 | 4.98 | 5.01 |
| 6 weeks AS | 4.66 | 6.50 | 6.43 | 12.03 | 7.21 | 5.32 | 7.90 | 4.12 | 4.70 | 5.20 |
| Parameter | Time | Rabbit 1 | Rabbit 2 | Rabbit 3 | Rabbit 4 | Rabbit 5 | Rabbit 6 | Rabbit 7 | Rabbit 8 | Rabbit 9 | Rabbit 10 |
|---|---|---|---|---|---|---|---|---|---|---|---|
| Serum Urea (mg/dL) | BS | 16.70 | 28.60 | 33.00 | 32.00 | 22.00 | 20.00 | 28.00 | 21.50 | 18.90 | 20.20 |
| 6 weeks AS | 17.20 | 27.50 | 16.17 | 24.00 | 32.00 | 31.30 | 27.10 | 19.80 | 17.30 | 21.10 | |
| Creatinine (mg/dL) | BS | 0.56 | 0.69 | 0.53 | 0.83 | 0.71 | 0.79 | 1.00 | 0.67 | 0.98 | 0.58 |
| 6 weeks AS | 0.59 | 0.72 | 0.70 | 0.92 | 0.69 | 0.82 | 0.71 | 0.65 | 0.91 | 0.68 | |
| ALT (UI/L) | BS | 21.00 | 18.00 | 17.00 | 19.00 | 14.00 | 58.00 | 47.00 | 19.00 | 25.00 | 20.00 |
| 6 weeks AS | 23.00 | 19.00 | 23.00 | 14.00 | 18.00 | 22.00 | 50.00 | 18.00 | 23.00 | 22.00 | |
| AST (UI/L) | BS | 22.00 | 27.00 | 25.00 | 30.00 | 17.00 | 24.00 | 19.00 | 21.00 | 25.00 | 23.00 |
| 6 weeks AS | 23.00 | 25.00 | 26.00 | 34.00 | 27.00 | 26.00 | 18.00 | 22.00 | 26.00 | 21.00 | |
| ALP (UI/L) | BS | 21.45 | 34.55 | 16.00 | 36.89 | 47.76 | 29.03 | 68.80 | 43.60 | 48.36 | 38.75 |
| 6 weeks AS | 22.88 | 32.15 | 15.00 | 34.61 | 45.90 | 30.20 | 70.62 | 44.23 | 47.87 | 37.60 | |
| 6 weeks AS | 16.70 | 28.60 | 33.00 | 32.00 | 22.00 | 20.00 | 28.00 | 21.50 | 18.90 | 20.20 |
| Parameter | Time | Rabbit 1 | Rabbit 2 | Rabbit 3 | Rabbit 4 * | Rabbit 5 * | Rabbit 6 | Rabbit 7 | Rabbit 8 | Rabbit 9 | Rabbit 10 |
|---|---|---|---|---|---|---|---|---|---|---|---|
| Thrombocyte (PLT) (K/μL) | BS | 234 | 480 | 550 | 1190 | 945 | 430 | 550 | 522 | 490 | 567 |
| 6 weeks AS | 254 | 550 | 620 | 1304 | 1032 | 500 | 545 | 530 | 510 | 554 | |
| Prothrombin time (PT) (s) | BS | 6.9 | 6.7 | 7.2 | 7.3 | 6.8 | 7.3 | 7.6 | 6.9 | 6.9 | 6.8 |
| 6 weeks AS | 7 | 6.8 | 7.1 | 6.9 | 7 | 7.2 | 7.2 | 7.2 | 6.7 | 6.9 | |
| aPTT (s) | BS | 17.9 | 18.4 | 19.3 | 19.8 | 20.1 | 18.2 | 17.5 | 16.6 | 18.9 | 19.1 |
| 6 weeks AS | 18.2 | 18.7 | 19.2 | 19.9 | 19.9 | 18.1 | 17.9 | 17.0 | 18.8 | 19.2 | |
| Fibrinogen (mg/dL) | BS | 320 | 276 | 279 | 295.5 | 301.3 | 278 | 319.6 | 389.4 | 260 | 255 |
| 6 weeks AS | 310 | 270.6 | 290.9 | 283 | 269.9 | 281 | 320 | 380.2 | 285 | 270 |
Publisher’s Note: MDPI stays neutral with regard to jurisdictional claims in published maps and institutional affiliations. |
© 2022 by the authors. Licensee MDPI, Basel, Switzerland. This article is an open access article distributed under the terms and conditions of the Creative Commons Attribution (CC BY) license (https://creativecommons.org/licenses/by/4.0/).
Share and Cite
Adam, R.; Antoniac, I.; Negoiță, S.; Moldovan, C.; Rusu, E.; Orban, C.; Tudorache, S.; Hârșovescu, T. In Vivo Study of Local and Systemic Responses to Clinical Use of Mg–1Ca Bioresorbable Orthopedic Implants. Diagnostics 2022, 12, 1966. https://doi.org/10.3390/diagnostics12081966
Adam R, Antoniac I, Negoiță S, Moldovan C, Rusu E, Orban C, Tudorache S, Hârșovescu T. In Vivo Study of Local and Systemic Responses to Clinical Use of Mg–1Ca Bioresorbable Orthopedic Implants. Diagnostics. 2022; 12(8):1966. https://doi.org/10.3390/diagnostics12081966
Chicago/Turabian StyleAdam, Răzvan, Iulian Antoniac, Silviu Negoiță, Cosmin Moldovan, Elena Rusu, Carmen Orban, Sorin Tudorache, and Tudor Hârșovescu. 2022. "In Vivo Study of Local and Systemic Responses to Clinical Use of Mg–1Ca Bioresorbable Orthopedic Implants" Diagnostics 12, no. 8: 1966. https://doi.org/10.3390/diagnostics12081966