
Integrating Health Data-Driven Machine Learning Algorithms to Evaluate Risk Factors of Early Stage Hypertension at Different Levels of HDL and LDL Cholesterol


 , , and
Abstract
:1. Introduction
2. Materials and Methods
2.1. Data
2.2. Proposed Multi-Stage Machine Learning Algorithm-Based Scheme
3. Results
4. Discussion
5. Limitations
6. Conclusions
Author Contributions
Funding
Institutional Review Board Statement
Informed Consent Statement
Data Availability Statement
Conflicts of Interest
References
- Kannel, W.B.; Gordon, T.; Schwartz, M.J. Systolic versus diastolic blood pressure and risk of coronary heart disease: The Framingham study. Am. J. Cardiol. 1971, 27, 335–346. [Google Scholar] [CrossRef]
- Ettehad, D.; Emdin, C.A.; Kiran, A.; Anderson, S.G.; Callender, T.; Emberson, J.; Chalmers, J.; Rodgers, A.; Rahimi, K. Blood pressure lowering for prevention of cardiovascular disease and death: A systematic review and meta-analysis. Lancet 2016, 387, 957–967. [Google Scholar] [CrossRef]
- Neaton, J.D. Serum cholesterol, blood pressure, cigarette smoking, and death from coronary heart disease. Overall findings and differences by age for 316,099 white men. Multiple Risk Factor Intervention Trial Research Group. Arch. Intern. Med. 1992, 152, 56–64. [Google Scholar] [CrossRef] [PubMed]
- Knuuti, J.; Wijns, W.; Saraste, A.; Capodanno, D.; Barbato, E.; Funck-Brentano, C.; Prescott, E.; Storey, R.F.; Deaton, C.; Cuisset, T.; et al. 2019 ESC Guidelines for the diagnosis and management of chronic coronary syndromes. Eur. Heart J. 2020, 41, 407–477. [Google Scholar] [CrossRef]
- Members, W.C.; Lawton, J.S.; Tamis-Holland, J.E.; Bangalore, S.; Bates, E.R.; Beckie, T.M.; Zwischenberger, B.A. 2021 ACC/AHA/SCAI guideline for coronary artery revascularization: A report of the American College of Cardiology/American Heart Association Joint Committee on Clinical Practice Guidelines. J. Am. Coll. Cardiol. 2022, 79, e21–e129. [Google Scholar] [CrossRef]
- Kleindorfer, D.O.; Towfighi, A.; Chaturvedi, S.; Cockroft, K.M.; Gutierrez, J.; Lombardi-Hill, D.; Kamel, H.; Kernan, W.N.; Kittner, S.J.; Leira, E.C.; et al. Guideline for the Prevention of Stroke in Patients with Stroke and Transient Ischemic Attack: A Guideline from the American Heart Association/American Stroke Association. Stroke 2021, 52, e364–e467. [Google Scholar] [CrossRef]
- Unger, T.; Borghi, C.; Charchar, F.; Khan, N.A.; Poulter, N.R.; Prabhakaran, D.; Ramirez, A.; Schlaich, M.; Stergiou, G.S.; Tomaszewski, M.; et al. 2020 International Society of Hypertension Global Hypertension Practice Guidelines. Hypertension 2020, 75, 1334–1357. [Google Scholar] [CrossRef]
- GBD 2016 Risk Factors Collaborators. Global, regional, and national comparative risk assessment of 84 behavioural, environmental and occupational, and metabolic risks or clusters of risks, 1990–2016: A systematic analysis for the Global Burden of Disease Study 2016. Lancet 2017, 390, 1345–1422. [Google Scholar] [CrossRef]
- Ferguson, T.S.; Younger, N.O.; Tulloch-Reid, M.K.; Wright, M.B.; Ward, E.M.; Ashley, D.E.; Wilks, R.J. Prevalence of prehypertension and its relationship to risk factors for cardiovascular disease in Jamaica: Analysis from a cross-sectional survey. BMC Cardiovasc. Disord. 2008, 8, 20. [Google Scholar] [CrossRef]
- Grotto, I.; Grossman, E.; Huerta, M.; Sharabi, Y. Prevalence of prehypertension and associated cardiovascular risk profiles among young Israeli adults. Hypertension 2006, 48, 254–259. [Google Scholar] [CrossRef]
- Yu, D.H.; Huang, J.F.; Hu, D.S.; Chen, J.C.; Cao, J.; Li, J.X.; Gu, D.F. Association between prehypertension and clustering of cardiovascular disease risk factors among Chinese adults. J. Cardiovasc. Pharm. 2009, 53, 388–400. [Google Scholar] [CrossRef]
- Bønaa, K.H.; Thelle, D.S. Association between blood pressure and serum lipids in a population. The Tromsø Study. Circulation 1991, 83, 1305–1314. [Google Scholar] [CrossRef]
- Cicero, A.F.; D’Addato, S.; Veronesi, M.; Rosticci, M.; Santi, F.; Dormi, A.; Borghi, C.; Brisighella Heart Study Group. Relationship between blood pressure, cholesterolemia and serum apolipoprotein B in a large population sample: The Brisighella Heart Study. J. Hypertens. 2012, 30, 492–496. [Google Scholar] [CrossRef]
- Chobanian, A.V.; Bakris, G.L.; Black, H.R.; Cushman, W.C.; Green, L.A.; Izzo, L., Jr.; Materson, B.J.; Oparil, S.; Wright, J.T., Jr.; Roccella, E.J. Seventh report of the joint national committee on prevention, detection, evaluation, and treatment of high blood pressure. Hypertension 2003, 42, 1206–1252. [Google Scholar] [CrossRef]
- Briasoulis, A.; Agarwal, V.; Valachis, A.; Messerli, F.H. Antihypertensive effects of statins: A meta-analysis of prospective controlled studies. J. Clin. Hypertens. 2013, 15, 310–320. [Google Scholar] [CrossRef]
- Borghi, C.; Cicero, A.F.; Saragoni, S.; Buda, S.; Cristofori, C.; Lilli, P.; Degli Esposti, L. Rate of control of LDL cholesterol and incident hypertension requiring antihypertensive treatment in hypercholesterolemic subjects in daily clinical practice. Ann. Med. 2014, 46, 97–102. [Google Scholar] [CrossRef]
- Chen, C.-L.; Liu, X.-C.; Liu, L.; Lo, K.; Yu, Y.-L.; Huang, J.-Y.; Huang, Y.-Q.; Chen, J.-Y. U-Shaped Association of High-Density Lipoprotein Cholesterol with All-Cause and Cardiovascular Mortality in Hypertensive Population. Risk Manag. Healthc. Policy 2020, 13, 2013–2025. [Google Scholar] [CrossRef]
- Ko, D.T.; Alter, D.A.; Guo, H.; Koh, M.; Lau, G.; Austin, P.C.; Booth, G.L.; Hogg, W.; Jackevicius, C.A.; Lee, D.S.; et al. High-density lipoprotein cholesterol and cause-specific mortality in individuals without previous cardiovascular conditions: The CANHEART study. J. Am. Coll. Cardiol. 2016, 68, 2073–2083. [Google Scholar] [CrossRef]
- Hirata, A.; Sugiyama, D.; Watanabe, M.; Kotani, K.; Ueshima, H.; Imai, Y.; Ohkubo, T.; Irie, F.; Iso, H.; Kitamura, A.; et al. Association of extremely high levels of high-density lipoprotein cholesterol with cardiovascular mortality in a pooled analysis of 9 cohort studies including 43,407 individuals: The EPOCH–JAPAN study. J. Clin. Lipidol. 2018, 12, 674–684. [Google Scholar] [CrossRef]
- DeGregory, K.W.; Kuiper, P.; DeSilvio, T.; Pleuss, J.D.; Miller, R.; Roginski, J.W.; Fisher, C.B.; Harness, D.; Viswanath, S.; Heymsfield, S.B.; et al. A review of machine learning in obesity. Obes. Rev. 2018, 19, 668–685. [Google Scholar] [CrossRef]
- Liu, Y.; Chen, P.-H.C.; Krause, J.; Peng, L. How to Read Articles That Use Machine Learning: Users’ Guides to the Medical Literature. JAMA 2019, 322, 1806–1816. [Google Scholar] [CrossRef] [PubMed]
- Triantafyllidis, A.K.; Tsanas, A. Applications of Machine Learning in Real-Life Digital Health Interventions: Review of the Literature. J. Med. Internet Res. 2019, 21, e12286. [Google Scholar] [CrossRef] [PubMed]
- Peiffer-Smadja, N.; Rawson, T.M.; Ahmad, R.; Buchard, A.; Georgiou, P.; Lescure, F.-X.; Birgand, G.; Holmes, A.H. Machine learning for clinical decision support in infectious diseases: A narrative review of current applications. Clin. Microbiol. Infect. 2020, 26, 584–595. [Google Scholar] [CrossRef] [PubMed]
- Chiu, Y.-L.; Jhou, M.-J.; Lee, T.-S.; Lu, C.-J.; Chen, M.-S. Health Data-Driven Machine Learning Algorithms Applied to Risk Indicators Assessment for Chronic Kidney Disease. Risk Manag. Healthc. Policy 2021, 14, 4401–4412. [Google Scholar] [CrossRef] [PubMed]
- Chang, C.-C.; Yeh, J.-H.; Chiu, H.-C.; Chen, Y.-M.; Jhou, M.-J.; Liu, T.-C.; Lu, C.-J. Utilization of Decision Tree Algorithms for Supporting the Prediction of Intensive Care Unit Admission of Myasthenia Gravis: A Machine Learning-Based Approach. J. Pers. Med. 2022, 12, 32. [Google Scholar] [CrossRef] [PubMed]
- Huang, Y.-C.; Cheng, Y.-C.; Jhou, M.-J.; Chen, M.; Lu, C.-J. Important Risk Factors in Patients with Nonvalvular Atrial Fibrillation Taking Dabigatran Using Integrated Machine Learning Scheme—A Post Hoc Analysis. J. Pers. Med. 2022, 12, 756. [Google Scholar] [CrossRef]
- Friedman, J. Stochastic gradient boosting. Comput. Stat. Data Anal. 2002, 38, 367–378. [Google Scholar] [CrossRef]
- Friedman, J.H. Multivariate adaptive regression splines. Ann. Stat. 1991, 19, 1–67. [Google Scholar] [CrossRef]
- Guindo, M.L.; Kabir, M.H.; Chen, R.; Liu, F. Particle Swarm Optimization and Multiple Stacked Generalizations to Detect Nitrogen and Organic-Matter in Organic-Fertilizer Using Vis-NIR. Sensors 2021, 21, 4882. [Google Scholar] [CrossRef]
- Dorogush, A.V.; Ershov, V.; Gulin, A. CatBoost: Gradient boosting with categorical features support. arXiv 2018, arXiv:1810.11363. [Google Scholar] [CrossRef]
- Gu, D.; Su, S.; Ge, D.; Chen, S.; Huang, J.; Li, B.; Chen, R.; Qiang, B. Association study with 33 single-nucleotide polymorphisms in 11 candidate genes for hypertension in Chinese. Hypertension 2006, 47, 1147–1154. [Google Scholar] [CrossRef]
- Ge, D.; Zhu, H.; Huang, Y.; Treiber, F.A.; Harshfield, G.A.; Snieder, H.; Dong, Y. Multilocus analyses of Renin-Angiotensin-aldosterone system gene variants on blood pressure at rest and during behavioral stress in young normotensive subjects. Hypertension 2007, 49, 107–112. [Google Scholar] [CrossRef]
- Hsu, C.-C.; Gu, M.; Lee, T.-S.; Lu, C.-J. The Effects of Daily Sleep Condition on Performances of Physical Fitness among Taiwanese Adults: A Cross-Sectional Study. Int. J. Environ. Res. Public Health 2020, 17, 1907. [Google Scholar] [CrossRef]
- Ong, M.S.; Klann, J.G.; Lin, K.J.; Maron, B.A.; Murphy, S.N.; Natter, M.D.; Mandl, K.D. Claims-Based Algorithms for Identifying Patients with Pulmonary Hypertension: A Comparison of Decision Rules and Machine-Learning Approaches. J. Am. Heart. Assoc. 2020, 9, e016648. [Google Scholar] [CrossRef]
- Chang, C.-C.; Yeh, J.-H.; Chen, Y.-M.; Jhou, M.-J.; Lu, C.-J. Clinical Predictors of Prolonged Hospital Stay in Patients with Myasthenia Gravis: A Study Using Machine Learning Algorithms. J. Clin. Med. 2021, 10, 4393. [Google Scholar] [CrossRef]
- Liu, X.; Zhang, Y.; Fu, C.; Zhang, R.; Zhou, F. EnRank: An Ensemble Method to Detect Pulmonary Hypertension Biomarkers Based on Feature Selection and Machine Learning Models. Front. Genet. 2021, 12, 636429. [Google Scholar] [CrossRef]
- Zhao, H.; Zhang, X.; Xu, Y.; Gao, L.; Ma, Z.; Sun, Y.; Wang, W. Predicting the Risk of Hypertension Based on Several Easy-to-Collect Risk Factors: A Machine Learning Method. Front. Public Health 2021, 9, 619429. [Google Scholar] [CrossRef]
- Lee, H.J.; Kim, H.; Kim, Y.T.; Won, K.; Czosnyka, M.; Kim, D.J. Prediction of Life-Threatening Intracranial Hypertension During the Acute Phase of Traumatic Brain Injury Using Machine Learning. IEEE J. Biomed. Health Inform. 2021, 25, 3967–3976. [Google Scholar] [CrossRef]
- Islam, S.; Talukder, A.; Awal, M.A.; Siddiqui, M.; Ahamad, M.M.; Ahammed, B.; Rawal, L.B.; Alizadehsani, R.; Abawajy, J.; Laranjo, L.; et al. Machine Learning Approaches for Predicting Hypertension and Its Associated Factors Using Population-Level Data from Three South Asian Countries. Front. Cardiovasc. Med. 2022, 9, 839379. [Google Scholar] [CrossRef]
- Hernandez-Pacheco, J.A.; Torres-Torres, J.; Martinez-Portilla, R.J.; Solis-Paredes, J.M.; Estrada-Gutierrez, G.; Mateu-Rogell, P.; Nares-Torices, M.A.; Lopez-Marenco, M.E.; Escobedo-Segura, K.R.; Posadas-Nava, A.; et al. sFlt-1 Is an Independent Predictor of Adverse Maternal Outcomes in Women With SARS-CoV-2 Infection and Hypertensive Disorders of Pregnancy. Front. Med. 2022, 9, 894633. [Google Scholar] [CrossRef]
- Chang, C.D.; Wang, C.C.; Jiang, B.C. Using data mining techniques for multi-diseases prediction modeling of hypertension and hyperlipidemia by common risk factors. Expert Syst. Appl. 2011, 38, 5507–5513. [Google Scholar] [CrossRef]
- Ang, L.; Yim, M.H.; Do, J.-H.; Lee, S. A Novel Method in Predicting Hypertension Using Facial Images. Appl. Sci. 2021, 11, 2414. [Google Scholar] [CrossRef]
- Shan, Y.; Li, Y.; Xu, X.; Feng, J.; Wu, X.; Gao, G. Evaluation of Intracranial Hypertension in Traumatic Brain Injury Patient: A Noninvasive Approach Based on Cranial Computed Tomography Features. J. Clin. Med. 2021, 10, 2524. [Google Scholar] [CrossRef]
- Chai, S.S.; Goh, K.L.; Cheah, W.L.; Chang, Y.H.R.; Ng, G.W. Hypertension Prediction in Adolescents Using Anthropometric Measurements: Do Machine Learning Models Perform Equally Well? Appl. Sci. 2022, 12, 1600. [Google Scholar] [CrossRef]
- Chen, M.S.; Chen, S.H. A data-driven assessment of the metabolic syndrome criteria for adult health management in Taiwan. Int. J. Environ. Res. Public Health 2019, 16, 92. [Google Scholar] [CrossRef]
- Liao, C.-M.; Lin, C.-M. Life course effects of socioeconomic and lifestyle factors on metabolic syndrome and 10-year risk of cardiovascular disease: A longitudinal study in taiwan adults. Int. J. Environ. Res. Public Health 2018, 15, 2178. [Google Scholar] [CrossRef]
- Chen, M.S.; Chiu, C.H.; Chen, S.H. Risk assessment of metabolic syndrome prevalence involving sedentary occupations and socioeconomic status. BMJ Open 2021, 11, e042802. [Google Scholar] [CrossRef]
- Chan, T.C.; Zhang, Z.; Lin, B.C.; Lin, C.; Deng, H.B.; Chuang, Y.C.; Chan, J.W.M.; Jiang, W.K.; Tam, T.; Chang, L.Y.; et al. Long-Term Exposure to Ambient Fine Particulate Matter and Chronic Kidney Disease: A Cohort Study. Environ. Health Perspect. 2018, 126, 107002. [Google Scholar] [CrossRef]
- Friedman, J. Greedy function approximation: A gradient boosting machine. Ann. Stat. 2001, 29, 1189–1232. [Google Scholar] [CrossRef]
- Hastie, T.; Tibshirani, R.; Wainwright, M. Statistical Learning with Sparsity: The Lasso and Generalizations; CRC Press: Boca Raton, FL, USA, 2015. [Google Scholar] [CrossRef]
- Kwon, S.; Lee, S.; Na, O. Tuning parameter selection for the adaptive Lasso in the autoregressive model. J. Korean Stat. Soc. 2017, 46, 285–297. [Google Scholar] [CrossRef]
- Hoerl, A.E.; Kennard, R.W. Ridge regression: Biased estimation for non-orthogonal problems. Technometrics 1970, 12, 55–67. [Google Scholar] [CrossRef]
- Prokhorenkova, L.; Gusev, G.; Vorobev, A.; Dorogush, A.V.; Gulin, A. Catboost: Unbiased boosting with categorical features. In Advances in Neural Information Processing Systems 31, Proceedings of the 32nd International Conference on Neural Information Processing Systems, Montréal, QC, Canada, 3–8 December 2018; Curran Associates Inc.: Red Hook, NY, USA, 2018; pp. 6639–6649. [Google Scholar]
- Meng, J.; Hao, H.; Luan, Y. Classifier ensemble selection based on affinity propagation clustering. J. Biomed. Inform. 2016, 60, 234–242. [Google Scholar] [CrossRef] [PubMed]
- Tripathi, D.; Edla, D.R.; Cheruku, R.; Kuppili, V. A novel hybrid credit scoring model based on ensemble feature selection and multilayer ensemble classification. Comput. Intell. 2019, 35, 371–394. [Google Scholar] [CrossRef]
- Woloshuk, A.; Khochare, S.; Almulhim, A.F.; McNutt, A.T.; Dean, D.; Barwinska, D.; Ferkowicz, M.J.; Eadon, M.T.; Kelly, K.J.; Dunn, K.W.; et al. In Situ Classification of Cell Types in Human Kidney Tissue Using 3D Nuclear Staining. Cytom. Part A 2021, 99, 707–721. [Google Scholar] [CrossRef] [PubMed]
- Larner, A.J. Accuracy of cognitive screening instruments reconsidered: Overall, balanced or unbiased accuracy? Neurodegener. Dis. Manag. 2022, 12, 67–76. [Google Scholar] [CrossRef] [PubMed]
- Greenwell, B.; Boehmke, B.; Cunningham, J. Gbm: Generalized Boosted Regression Models. R Package Version, 2.1.8. 2020. Available online: https://CRAN.R-project.org/package=gbm (accessed on 25 May 2022).
- Milborrow, S. Derived from Mda: MARS by T. Hastie and R. Tibshirani. Earth: Multivariate Adaptive Regression Splines. R Package Version, 5.3.1. 2021. Available online: http://CRAN.R-project.org/package=earth (accessed on 25 May 2022).
- Friedman, J.; Hastie, T.; Tibshirani, R.; Narasimhan, B.; Tay, K.; Simon, N.; Qian, J.; Yang, J. Glmnet: Lasso and Elastic-Net Regularized Generalized Linear Models. R Package Version, 4.1-4. 2022. Available online: https://CRAN.R-project.org/package=glmnet (accessed on 25 May 2022).
- Yandex Technologies. CatBoost: Unbiased Boosting with Categorical Features. R Package Version, 1.0.6. 2022. Available online: https://github.com/catboost/catboost/ (accessed on 25 May 2022).
- Kuhn, M. Caret: Classification and Regression Training. R Package Version, 6.0-92. 2022. Available online: https://CRAN.R-project.org/package=caret (accessed on 25 May 2022).
- DeLong, E.R.; DeLong, D.M.; Clarke-Pearson, D.L. Comparing the areas under two or more correlated receiver operating characteristic curves: A nonparametric approach. Biometrics 1988, 44, 837–845. [Google Scholar] [CrossRef] [PubMed]
- Mainous, A.G., III; Everett, C.J.; Liszka, H.; King, D.E.; Egan, B.M. Prehypertension and mortality in a nationally representative cohort. Am. J. Cardiol. 2004, 94, 1496–1500. [Google Scholar] [CrossRef]
- Hsia, J.; Margolis, K.L.; Eaton, C.B.; Wenger, N.K.; Allison, M.; Wu, L.; LaCroix, A.Z.; Black, H.R.; Women’s Health Initiative Investigators. Prehypertension and cardiovascular disease risk in the Women’s Health Initiative. Circulation 2007, 115, 855–860. [Google Scholar] [CrossRef]
- Gu, D.; Chen, J.; Wu, X.; Duan, X.; Jones, D.W.; Huang, J.F.; Chen, C.S.; Chen, J.C.; Kelly, T.N.; Whelton, P.K.; et al. Prehypertension and risk of cardiovascular disease in Chinese adults. J. Hypertens. 2009, 27, 721–729. [Google Scholar] [CrossRef]
- Hozawa, A.; Kuriyama, S.; Kakizaki, M.; Ohmori-Matsuda, K.; Ohkubo, T.; Tsuji, I. Attributable risk fraction of prehypertension on cardiovascular disease mortality in the Japanese population: The Ohsaki Study. Am. J. Hypertens. 2009, 22, 267–272. [Google Scholar] [CrossRef]
- Tsai, P.S.; Ke, T.L.; Huang, C.J.; Tsai, J.C.; Chen, P.L.; Wang, S.Y.; Shyu, Y.K. Prevalence and determinants of prehypertension status in the Taiwanese general population. J. Hypertens. 2005, 23, 1355–1360. [Google Scholar] [CrossRef]
- Kim, N.H.; Cho, H.J.; Kim, Y.J.; Cho, M.J.; Choi, H.Y.; Eun, C.R.; Kim, J.H.; Yang, S.J.; Yoo, H.J.; Kim, H.Y.; et al. Combined effect of high-normal blood pressure and low HDL cholesterol on mortality in an elderly Korean population: The South-West Seoul (SWS) study. Am. J. Hypertens. 2011, 24, 918–923. [Google Scholar] [CrossRef]
- Nakajima, K.; Igata, M.; Higuchi, R.; Tanaka, K.; Mizusawa, K.; Nakamura, T. Association of Serum High-Density Lipoprotein Cholesterol with High Blood Pressures at Checkup: Results of Kanagawa Investigation of Total Checkup Data from the National Database-9 (KITCHEN-9). J. Clin. Med. 2021, 10, 5118. [Google Scholar] [CrossRef]
- Otocka-Kmiecik, A.; Mikhailidis, D.P.; Nicholls, S.J.; Davidson, M.; Rysz, J.; Banach, M. Dysfunctional HDL: A novel important diagnostic and therapeutic target in cardiovascular disease? Prog. Lipid Res. 2012, 51, 314–324. [Google Scholar] [CrossRef]
- Barter, P.J.; Caulfield, M.; Eriksson, M.; Grundy, S.M.; Kastelein, J.J.P.; Komajda, M.; Lopez-Sendon, J.; Mosca, L.; Tardif, J.-C.; Waters, D.D.; et al. Effects of torcetrapib in patients at high risk for coronary events. N. Engl. J. Med. 2007, 357, 2109–2122. [Google Scholar] [CrossRef]
- Lincoff, A.M.; Nicholls, S.J.; Riesmeyer, J.S.; Barter, P.J.; Brewer, H.B.; Fox, K.A.A.; Gibson, C.M.; Granger, C.; Menon, V.; Montalescot, G.; et al. Evacetrapib and Cardiovascular Outcomes in High-Risk Vascular Disease. N. Engl. J. Med. 2017, 376, 1933–1942. [Google Scholar] [CrossRef]
- Chruściel, P.; Stemplewska, P.; Stemplewski, A.; Wattad, M.; Bielecka-Dąbrowa, A.; Maciejewski, M.; Penson, P.; Bartlomiejczyk, M.A.; Banach, M. Associations between the lipid profile and the development of hypertension in young individuals-the preliminary study. Arch. Med. Sci. 2019, 18, 25–35. [Google Scholar] [CrossRef]
- Otsuka, T.; Takada, H.; Nishiyama, Y.; Kodani, E.; Saiki, Y.; Kato, K.; Kawada, T. Dyslipidemia and the Risk of Developing Hypertension in a Working-Age Male Population. J. Am. Heart Assoc. 2016, 5, e003053. [Google Scholar] [CrossRef]
- Wen, C.J.; Lee, Y.S.; Lin, W.Y.; Huang, H.L.; Yao, C.A.; Sung, P.K.; Huang, K.C. The metabolic syndrome increases cardiovascular mortality in Taiwanese elderly. Eur. J. Clin. Investig. 2008, 38, 469–475. [Google Scholar] [CrossRef]
- Shin, C.Y.; Yun, K.E.; Park, H.S. Blood pressure has a greater impact on cardiovascular mortality than other components of metabolic syndrome in Koreans. Atherosclerosis 2009, 205, 614–619. [Google Scholar] [CrossRef]
- ACCORD Study Group; Cushman, W.C.; Evans, G.W.; Byington, R.P.; Goff, D.C.; Grimm, R.H.; Cutler, J.A.; Simsons-Morton, D.G.; Basile, J.N.; Corson, M.A.; et al. Effects of intensive blood-pressure control in type 2 diabetes mellitus. N. Engl. J. Med. 2010, 362, 1575–1585. [Google Scholar] [CrossRef] [PubMed]
- SPRINT Research Group; Wright, J.T.; Williamson, J.D.; Whelton, P.K.; Snyder, J.K.; Sink, K.M.; Rocco, M.V.; Reboussin, D.M.; Rahman, M.; Oparil, S.; et al. A Randomized Trial of Intensive versus Standard Blood-Pressure Control. N. Engl. J. Med. 2015, 373, 2103–2116. [Google Scholar] [CrossRef] [PubMed]
- Atsma, F.; Veldhuizen, I.; de Kort, W.; van Kraaij, M.; Pasker-de Jong, P.; Deinum, J. Hemoglobin level is positively associated with blood pressure in a large cohort of healthy individuals. Hypertension 2012, 60, 936–941. [Google Scholar] [CrossRef] [PubMed]
- Kawamoto, R.; Tabara, Y.; Kohara, K.; Miki, T.; Kusunoki, T.; Katoh, T.; Ohtsuka, N.; Takayama, S.; Abe, M. A slightly low hemoglobin level is beneficially associated with arterial stiffness in Japanese community-dwelling women. Clin. Exp. Hypertens. 2012, 34, 92–98. [Google Scholar] [CrossRef]
- Cabrales, P.; Han, G.; Nacharaju, P.; Friedman, A.J.; Friedman, J.M. Reversal of hemoglobin-induced vasoconstriction with sustained release of nitric oxide. Am. J. Physiol.-Heart Circ. Physiol. 2011, 300, H49–H56. [Google Scholar] [CrossRef]
- Hage, F.G. C-reactive protein and hypertension. J. Hum. Hypertens. 2014, 28, 410–415. [Google Scholar] [CrossRef]
- Davey, S.G.; Lawlor, D.A.; Harbord, R.; Timpson, N.; Rumley, A.; Lowe, G.D.; Day, I.N.; Ebrahim, S. Association of C-reactive protein with blood pressure and hypertension: Life course confounding and mendelian randomization tests of causality. Arterioscler. Thromb. Vasc. Biol. 2005, 25, 1051–1056. [Google Scholar] [CrossRef]


| Abbreviation | Variable (Unit) | Description/Reference Range (RR) |
|---|---|---|
| SEX | Gender (sex) | (1) Male; (2) Female |
| Age | Age (y/o) | Number; Years old (y/o) |
| MS | Marital status | (1) Single; (2) Married, remarried, cohabiting; (3) Divorced; (4) Widowed |
| EL | Education level | (1) No formal education; (2) Elementary school; (3) Secondary school; (4) High school; (5) College; (6) University; (7) Graduate school |
| FI | Family income (NTD) | (1) Unwaged; (2) ≤200,000; (3) 200,001–400,000; (4) 400,001–800,000; (5) 800,001–1,200,000; (6) 1,200,001–1,600,000; (7) 1,600,001–2,000,000; (8) >2,000,000 |
| BMI | Body mass index (kg/m2) | Number; Body weight/Body height2 |
| BF | Body fat (%) | Number; Data collection from ©OMRON: HBF–702t |
| WC | Waist circumference (cm) | Number; WC measured with a tape measure by SOP. |
| HC | Hip circumference (cm) | Number; HC measured with a tape measure by SOP. |
| WHR | Waist-to-hip ratio (%) | Number; Waist circumference/Hip Circumference |
| Hb | Hemoglobin (g/dl) | Number; RR: Male: 13.5 < Hb < 17.5; Female: 12.0 < Hb < 16.0 |
| FPG | Fasting plasma glucose (mg/dL) | Number; RR: 70 < FPG < 100 |
| TG | Triglycerides (mg/dL) | Number; RR: TG ≤ 150 |
| T-Cho | Total cholesterol (mg/dL) | Number; RR: 130 < T-Cho < 200 |
| FT4 | Free thyroxine 4 (ng/dL) | Number; RR: 0.70 < FT4 < 1.48 |
| TSH | Thyroid-stimulating hormone (μIU/mL) | Number; RR: 0.47 < TSH < 5.00 |
| CRP | C-reactive protein (mg/dL) | Number, RR: CRP < 0.5 |
| UP | Urine protein | Qualitative test; (1) none (2) trace (+/−) (3) + (4) ++ (5) +++ (6) ++++ |
| CS | Current smoker | (1) Never; (2) Passive smoking; (3) Quit; (4) Occasional; (5) Addicted |
| AD | Alcohol drinker | (1) Never; (2) Quit; (3) 1–2 times a week; (4) 3–4 times a week; (5) 5–6 times a week; (6) Addicted |
| CBN | Chews betel nut (Areca catechu) | (1) Never; (2) Quit; (3) 1–3 times a week; (4) 4–5 times a week; (5) Addicted |
| MB | Mealtime behavior | (0) Irregular; (1) Regular |
| ET | Excise time (hours) | Time spent exercising in the past two weeks. (1) <0.5; (2) 0.5–1; (3) 1–2; (4) >2 |
| ST | Sleep time (hours) | Average sleeping time at night. (1) <4; (2) 4–6; (3) 6–7; (4) 7–8; (5) 8–9; (6) >9 |
| HDL-C | High-density lipoprotein cholesterol (mg/dL) | Number; RR: Male: HDL-C > 40; Female: HDL-C > 50. IRR–HDL and/or ORR–HDL: the different RR values for males and females were considered. |
| LDL-C | Low-density lipoprotein cholesterol (mg/dL) | Number, RR: LDL-C < 130 |
| HTN | Hypertension in early stage # SBP: Systolic blood pressure (mmHg) DBP: Diastolic blood pressure (mmHg) | (0) Normal subjects: SBP < 120 and DBP < 80 (1) HTN subjects: SBP ≥ 120 and DBP ≥ 80 |
| Ordinal Variable (Unit) | N (%) | Ordinal Variable (Unit) | N (%) | ||
|---|---|---|---|---|---|
| Gender | Male | 15,628 (51.65%) | Chews betel nut (Areca catechu) | Never | 28,784 (95.14%) |
| Female | 14,627 (48.35%) | Quit | 1053 (3.48%) | ||
| Marital status | Single | 4906 (16.22%) | 1–3 times a week | 264 (0.87%) | |
| Married, remarried, cohabiting | 22,948 (75.85%) | 4–5 times a week | 50 (0.17%) | ||
| Divorced | 1144 (3.78%) | Addicted | 104 (0.34%) | ||
| Widowed | 1257 (4.15%) | Mealtime behavior | Irregular | 8384 (27.71%) | |
| Education level | No formal education | 438 (1.45%) | Regular | 21,871 (72.29%) | |
| Elementary school | 1958 (6.47%) | Excise time (hours) | <0.5 | 8361 (27.64%) | |
| Secondary school | 1251 (4.13%) | 0.5–1 | 13,513 (44.66%) | ||
| High school | 5655 (18.69%) | 1–2 | 6409 (21.18%) | ||
| College | 6394 (21.13%) | >2 | 1972 (6.52%) | ||
| University | 9362 (30.94%) | Sleep time (hours) | <4 | 471 (1.56%) | |
| Graduate school | 5197 (17.18%) | 4–6 | 7375 (24.38%) | ||
| Family income (NTD) | Unwaged | 1787 (5.91%) | 6–7 | 14,787 (48.87%) | |
| ≤200,000 | 2878 (9.51%) | 7–8 | 6499 (21.48%) | ||
| 200,001–400,000 | NA | 8–9 | NA | ||
| 400,001–800,000 | 6950 (22.97%) | >9 | NA | ||
| 800,001–1,200,000 | 8256 (27.29%) | Interval Variable (Unit) | Mean ± SD | ||
| 1,200,001–1,600,000 | 4008 (13.25%) | Age (y/o) | 47.25 ± 12.41 | ||
| 1,600,001–2,000,000 | 2601 (8.60%) | Body mass index (kg/m2) | 23.66 ± 3.59 | ||
| >2,000,000 | 3775 (12.48%) | Body fat (%) | 26.76 ± 6.86 | ||
| Urine protein | none | 29,364 (97.06%) | Waist circumference (cm) | 78.84 ± 10.17 | |
| trace (+/−) | 521 (1.72%) | Hip circumference (cm) | 95.37 ± 6.31 | ||
| + | 254 (0.84%) | Waist-to-hip ratio (%) | 0.83 ± 0.08 | ||
| ++ | 87 (0.29%) | Hemoglobin (g/dL) | 14.14 ± 1.51 | ||
| +++ | 29 (0.10%) | Fasting plasma glucose (mg/dL) | 103.2 ± 19.35 | ||
| ++++ | NA | Triglycerides (mg/dL) | 115.79 ± 89.01 | ||
| Current smoker | Never | 22,339 (73.84%) | Total cholesterol (mg/dL) | 196.99 ± 34.40 | |
| Passive smoking | 1066 (3.52%) | Free thyroxine 4 (ng/dL) | 1.08 ± 0.15 | ||
| Quit | 2450 (8.10%) | Thyroid-stimulating hormone (μIU/mL) | 1.73 ± 1.77 | ||
| Occasional | 1062 (3.51%) | C-reactive protein (mg/dL) | 0.21 ± 0.39 | ||
| Addicted | 3338 (11.03%) | ||||
| Alcohol drinker | Never | 24,832 (82.08%) | Control Variable (Unit) | Mean ± SD | |
| Quit | 650 (2.15%) | High-density lipoprotein cholesterol (mg/dL) | 59.01 ± 14.92 | ||
| 1–2 times a week | 3225 (10.66%) | Low-density lipoprotein cholesterol (mg/dL) | 118.77 ± 32.2 | ||
| 3–4 times a week | 1045 (3.45%) | Dependent Variable (Unit) | N (%) | ||
| 5–6 times a week | NA | Hypertension in early stage (HTN) | SBP < 120 and DBP < 80 | 23,180 (76.62%) | |
| Addicted | 503 (1.66%) | SBP ≥ 120 and DBP ≥ 80 | 7075 (23.38%) | ||
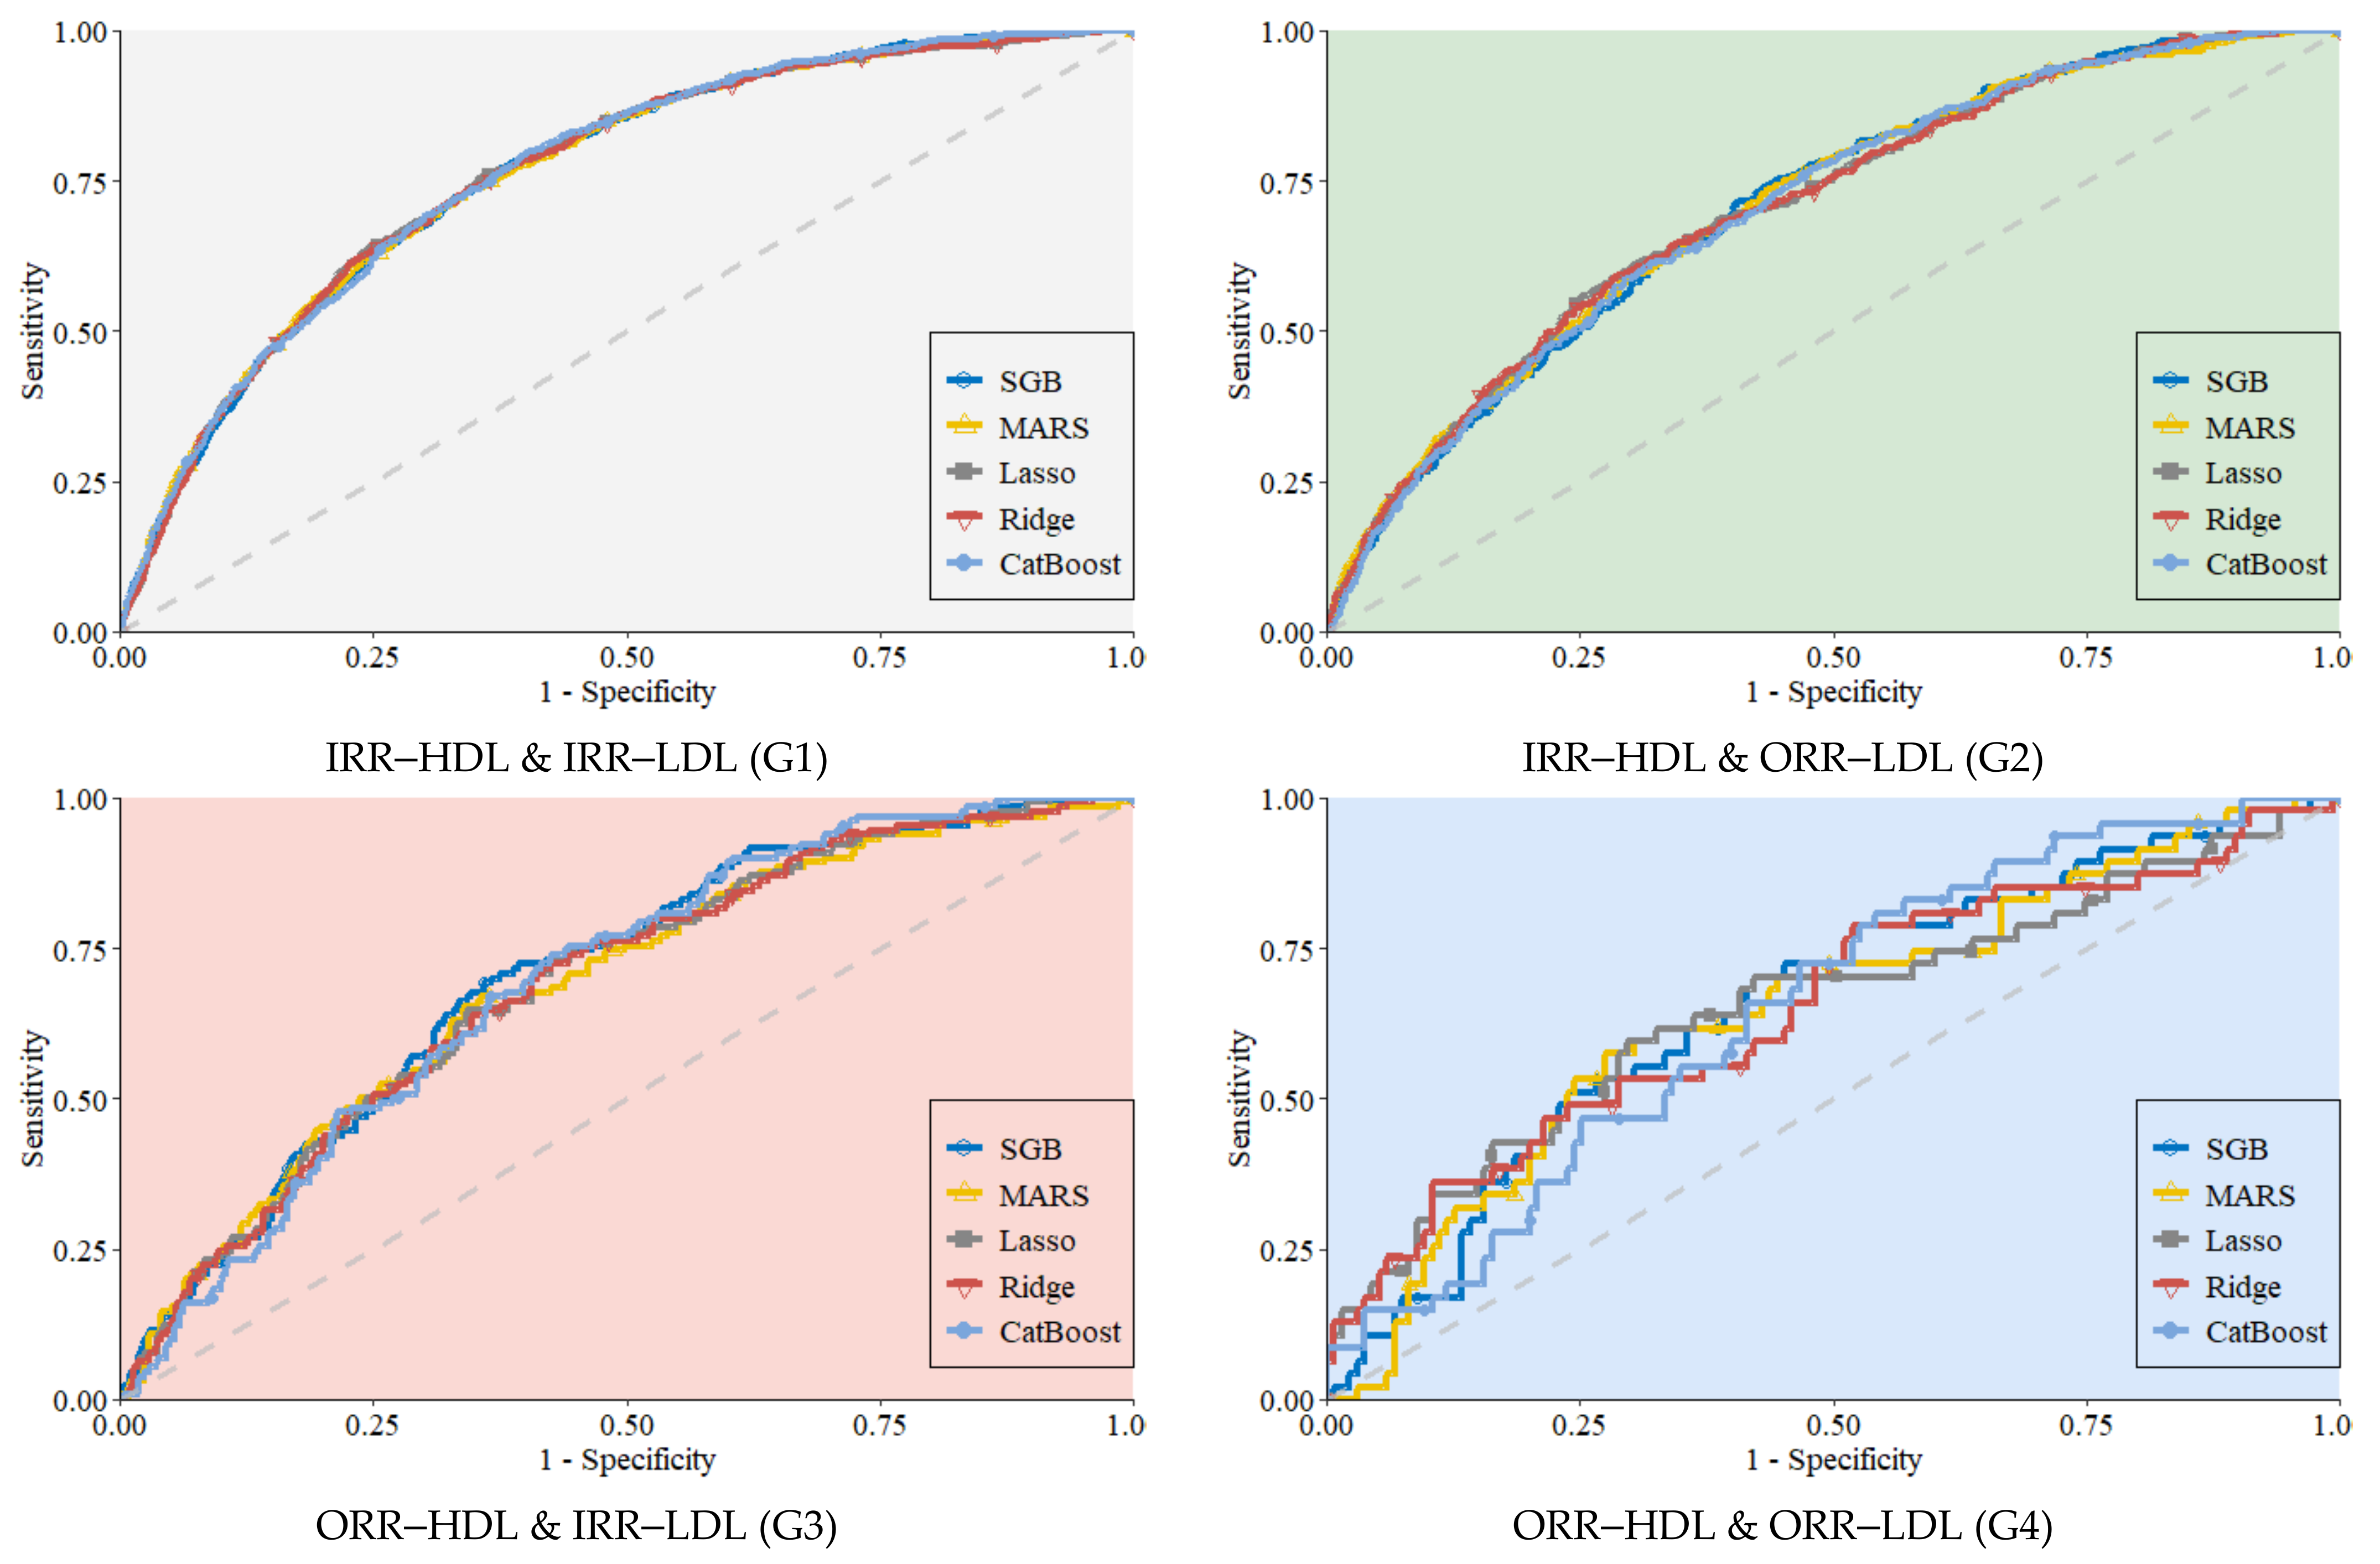
| Subgroup, Total N = 30,255 | Method | Sensitivity | Specificity | AUC | BA | GM |
|---|---|---|---|---|---|---|
| IRR–HDL & IRR–LDL (G1) n = 17,327 (57.27%) | SGB | 0.625 | 0.770 | 0.762 | 0.698 | 0.694 |
| MARS | 0.659 | 0.732 | 0.762 | 0.695 | 0.694 | |
| Lasso | 0.645 | 0.755 | 0.762 | 0.700 | 0.698 | |
| Ridge | 0.668 | 0.725 | 0.761 | 0.696 | 0.696 | |
| CatBoost | 0.605 | 0.791 | 0.764 | 0.698 | 0.692 | |
| IRR–HDL & ORR–LDL (G2) n = 9492 (31.37%) | SGB | 0.595 | 0.715 | 0.705 | 0.655 | 0.652 |
| MARS | 0.567 | 0.735 | 0.707 | 0.651 | 0.645 | |
| Lasso | 0.691 | 0.617 | 0.705 | 0.654 | 0.653 | |
| Ridge | 0.713 | 0.594 | 0.705 | 0.653 | 0.650 | |
| CatBoost | 0.682 | 0.613 | 0.703 | 0.648 | 0.647 | |
| ORR–HDL & IRR–LDL (G3) n = 2525 (8.35%) | SGB | 0.642 | 0.695 | 0.702 | 0.668 | 0.668 |
| MARS | 0.660 | 0.649 | 0.685 | 0.655 | 0.655 | |
| Lasso | 0.572 | 0.733 | 0.688 | 0.653 | 0.648 | |
| Ridge | 0.583 | 0.718 | 0.687 | 0.650 | 0.647 | |
| CatBoost | 0.575 | 0.741 | 0.693 | 0.658 | 0.652 | |
| ORR–HDL & ORR–LDL (G4) n = 911 (3.01%) | SGB | 0.581 | 0.702 | 0.658 | 0.642 | 0.639 |
| MARS | 0.728 | 0.575 | 0.649 | 0.651 | 0.647 | |
| Lasso | 0.706 | 0.596 | 0.653 | 0.651 | 0.649 | |
| Ridge | 0.478 | 0.787 | 0.653 | 0.633 | 0.613 | |
| CatBoost | 0.456 | 0.809 | 0.650 | 0.632 | 0.607 |
| Subgroup | Methods | SGB | MARS | Lasso | Ridge |
|---|---|---|---|---|---|
| IRR–HDL & IRR–LDL (G1) | SGB | – | |||
| MARS | 0.467 | – | |||
| Lasso | 0.286 | 0.716 | – | ||
| Ridge | 0.164 | 0.517 | 0.085 | – | |
| CatBoost | 0.068 | 0.350 | 0.647 | 0.912 | |
| IRR–HDL & ORR–LDL (G2) | SGB | – | |||
| MARS | 0.643 | – | |||
| Lasso | 0.874 | 0.778 | – | ||
| Ridge | 0.957 | 0.711 | 0.494 | – | |
| CatBoost | 0.589 | 0.410 | 0.588 | 0.664 | |
| ORR–HDL & IRR–LDL (G3) | SGB | – | |||
| MARS | 0.273 | – | |||
| Lasso | 0.319 | 0.857 | – | ||
| Ridge | 0.288 | 0.933 | 0.477 | – | |
| CatBoost | 0.436 | 0.653 | 0.742 | 0.933 | |
| ORR–HDL & ORR–LDL (G4) | SGB | – | |||
| MARS | 0.774 | – | |||
| Lasso | 0.899 | 0.904 | – | ||
| Ridge | 0.906 | 0.910 | 0.992 | – | |
| CatBoost | 0.865 | 0.967 | 0.960 | 0.957 |
| Rank\Subgroup | IRR–HDL & IRR–LDL (G1) | IRR–HDL & ORR–LDL(G2) | ORR–HDL & IRR–LDL (G3) | ORR–HDL & ORR–LDL (G4) |
|---|---|---|---|---|
| 1 | WHR | BMI | BMI | Hb |
| 2 | Age | Hb | Hb | CRP |
| 3 | Hb | TG | WHR | BMI |
| 4 | BMI | WHR | Age | WC |
| 5 | FPG | Age | FPG | WHR |
| 6 | WC | CRP | TG | Age |
| 7 | FT4 | FPG | WC | HC |
| 8 | UP | UP | UP | FPG |
| 9 | AD | WC | FI | ET |
| 10 | CS | CS | TSH | FT4 |
| Subgroup | IRR–HDL & IRR–LDL (G1) | IRR–HDL & ORR–LDL(G2) | ORR–HDL & IRR–LDL (G3) | ORR–HDL & ORR–LDL (G4) |
|---|---|---|---|---|
| IRR–HDL & IRR–LDL (G1) | 1 | |||
| IRR–HDL & ORR–LDL (G2) | 0.622 | 1 | ||
| ORR–HDL & IRR–LDL (G3) | 0.633 | 0.899 | 1 | |
| ORR–HDL & ORR–LDL (G4) | 0.371 | 0.707 | 0.602 | 1 |
Publisher’s Note: MDPI stays neutral with regard to jurisdictional claims in published maps and institutional affiliations. |
© 2022 by the authors. Licensee MDPI, Basel, Switzerland. This article is an open access article distributed under the terms and conditions of the Creative Commons Attribution (CC BY) license (https://creativecommons.org/licenses/by/4.0/).
Share and Cite
Liao, P.-C.; Chen, M.-S.; Jhou, M.-J.; Chen, T.-C.; Yang, C.-T.; Lu, C.-J. Integrating Health Data-Driven Machine Learning Algorithms to Evaluate Risk Factors of Early Stage Hypertension at Different Levels of HDL and LDL Cholesterol. Diagnostics 2022, 12, 1965. https://doi.org/10.3390/diagnostics12081965
Liao P-C, Chen M-S, Jhou M-J, Chen T-C, Yang C-T, Lu C-J. Integrating Health Data-Driven Machine Learning Algorithms to Evaluate Risk Factors of Early Stage Hypertension at Different Levels of HDL and LDL Cholesterol. Diagnostics. 2022; 12(8):1965. https://doi.org/10.3390/diagnostics12081965
Chicago/Turabian StyleLiao, Pen-Chih, Ming-Shu Chen, Mao-Jhen Jhou, Tsan-Chi Chen, Chih-Te Yang, and Chi-Jie Lu. 2022. "Integrating Health Data-Driven Machine Learning Algorithms to Evaluate Risk Factors of Early Stage Hypertension at Different Levels of HDL and LDL Cholesterol" Diagnostics 12, no. 8: 1965. https://doi.org/10.3390/diagnostics12081965