
Individual Evaluation of the Common Extensor Tendon and Lateral Collateral Ligament Improves the Severity Diagnostic Accuracy of Magnetic Resonance Imaging for Lateral Epicondylitis

 , , ,
, , ,
Abstract
:
1. Introduction
2. Materials and Methods
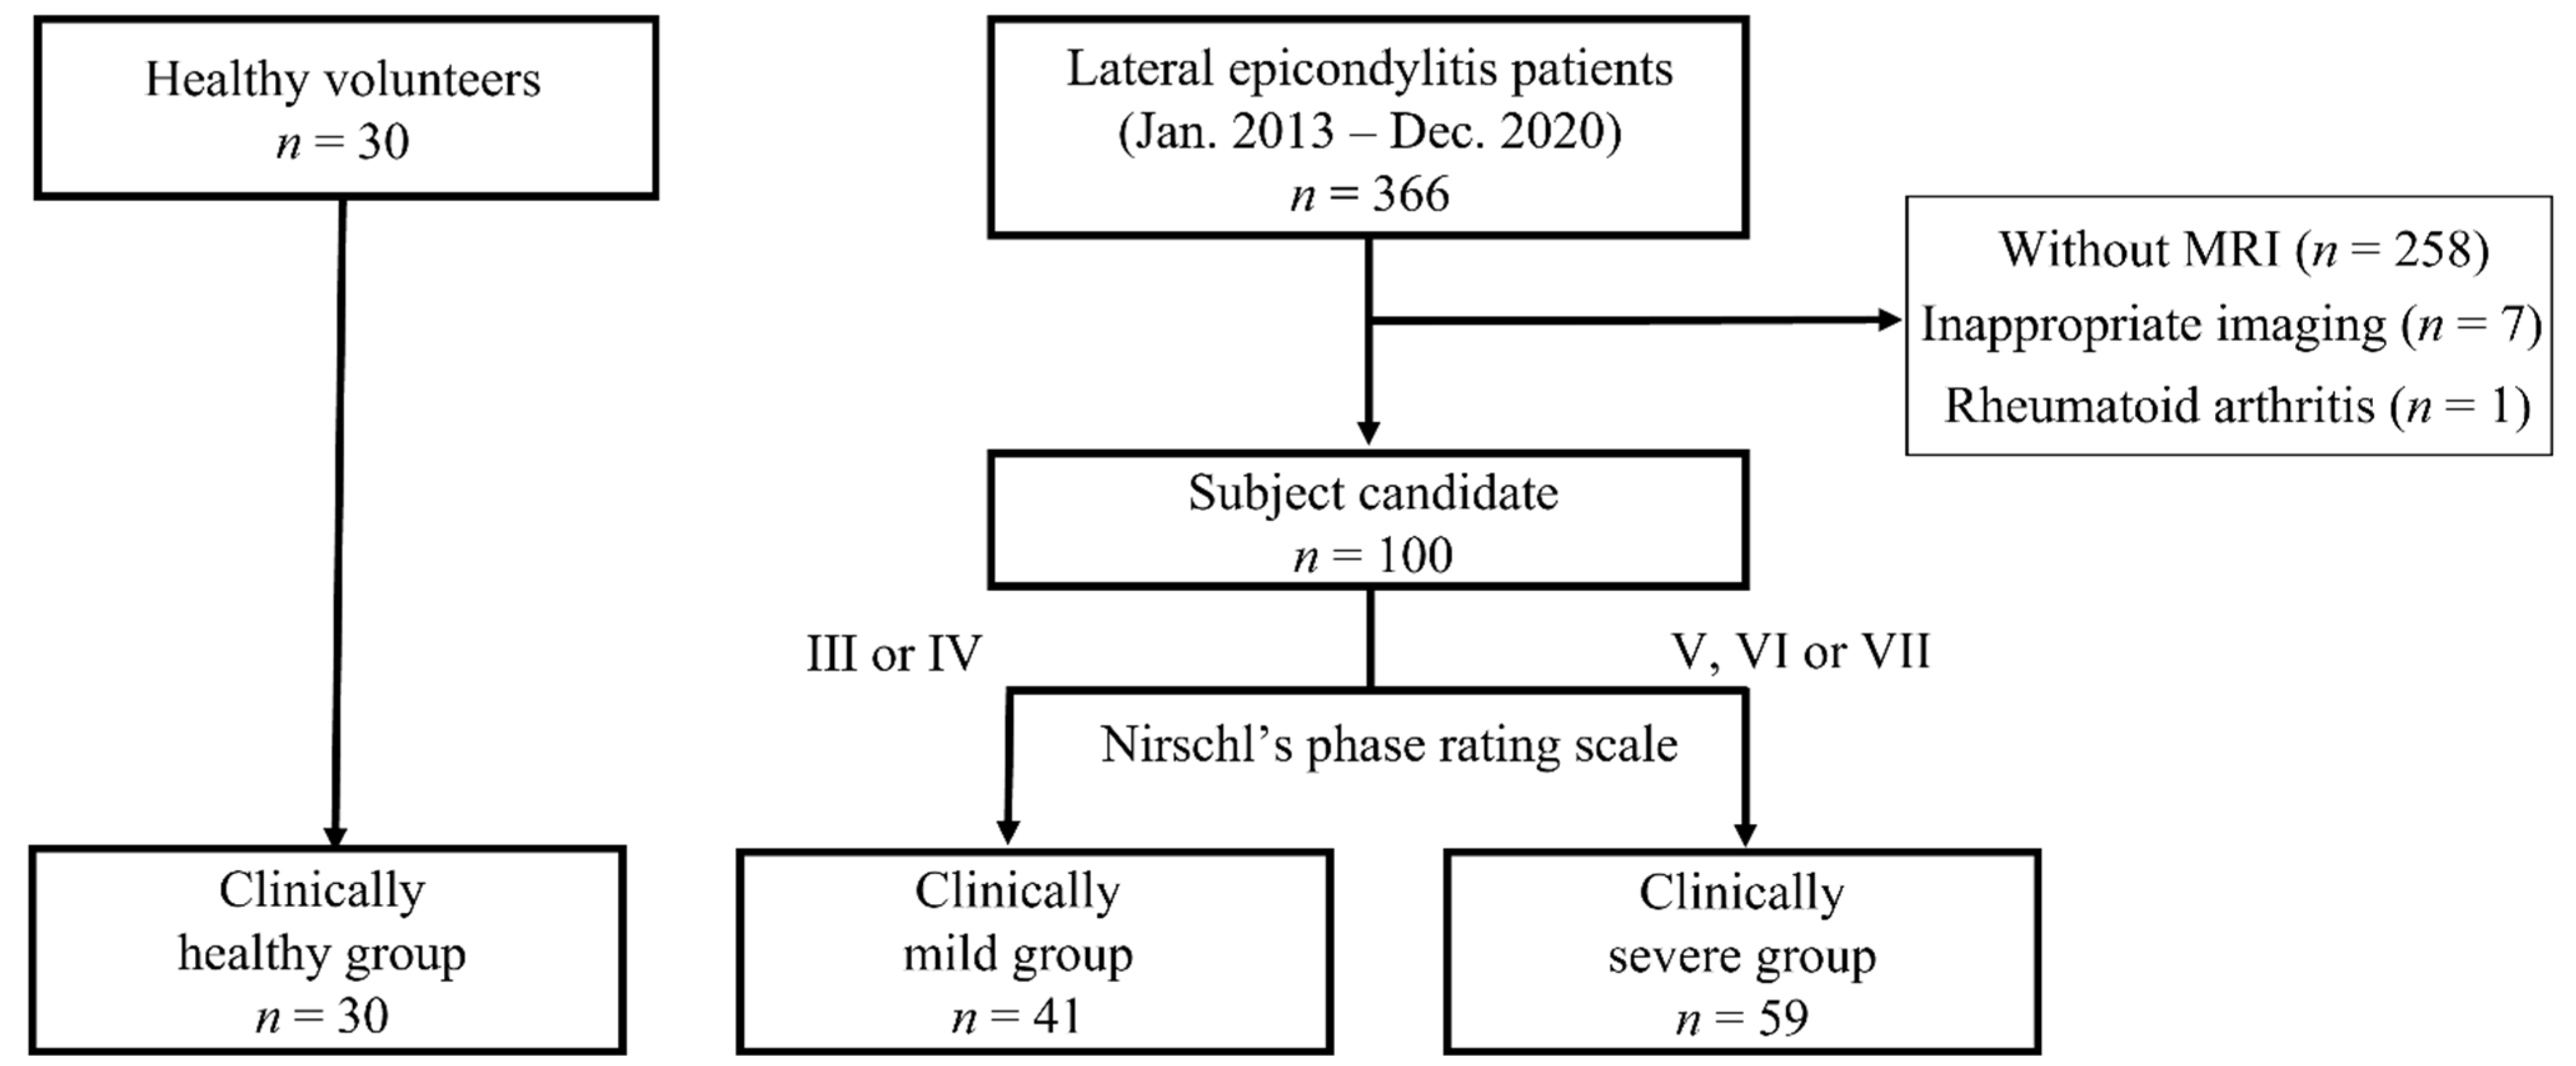
2.1. Study Design and Participants
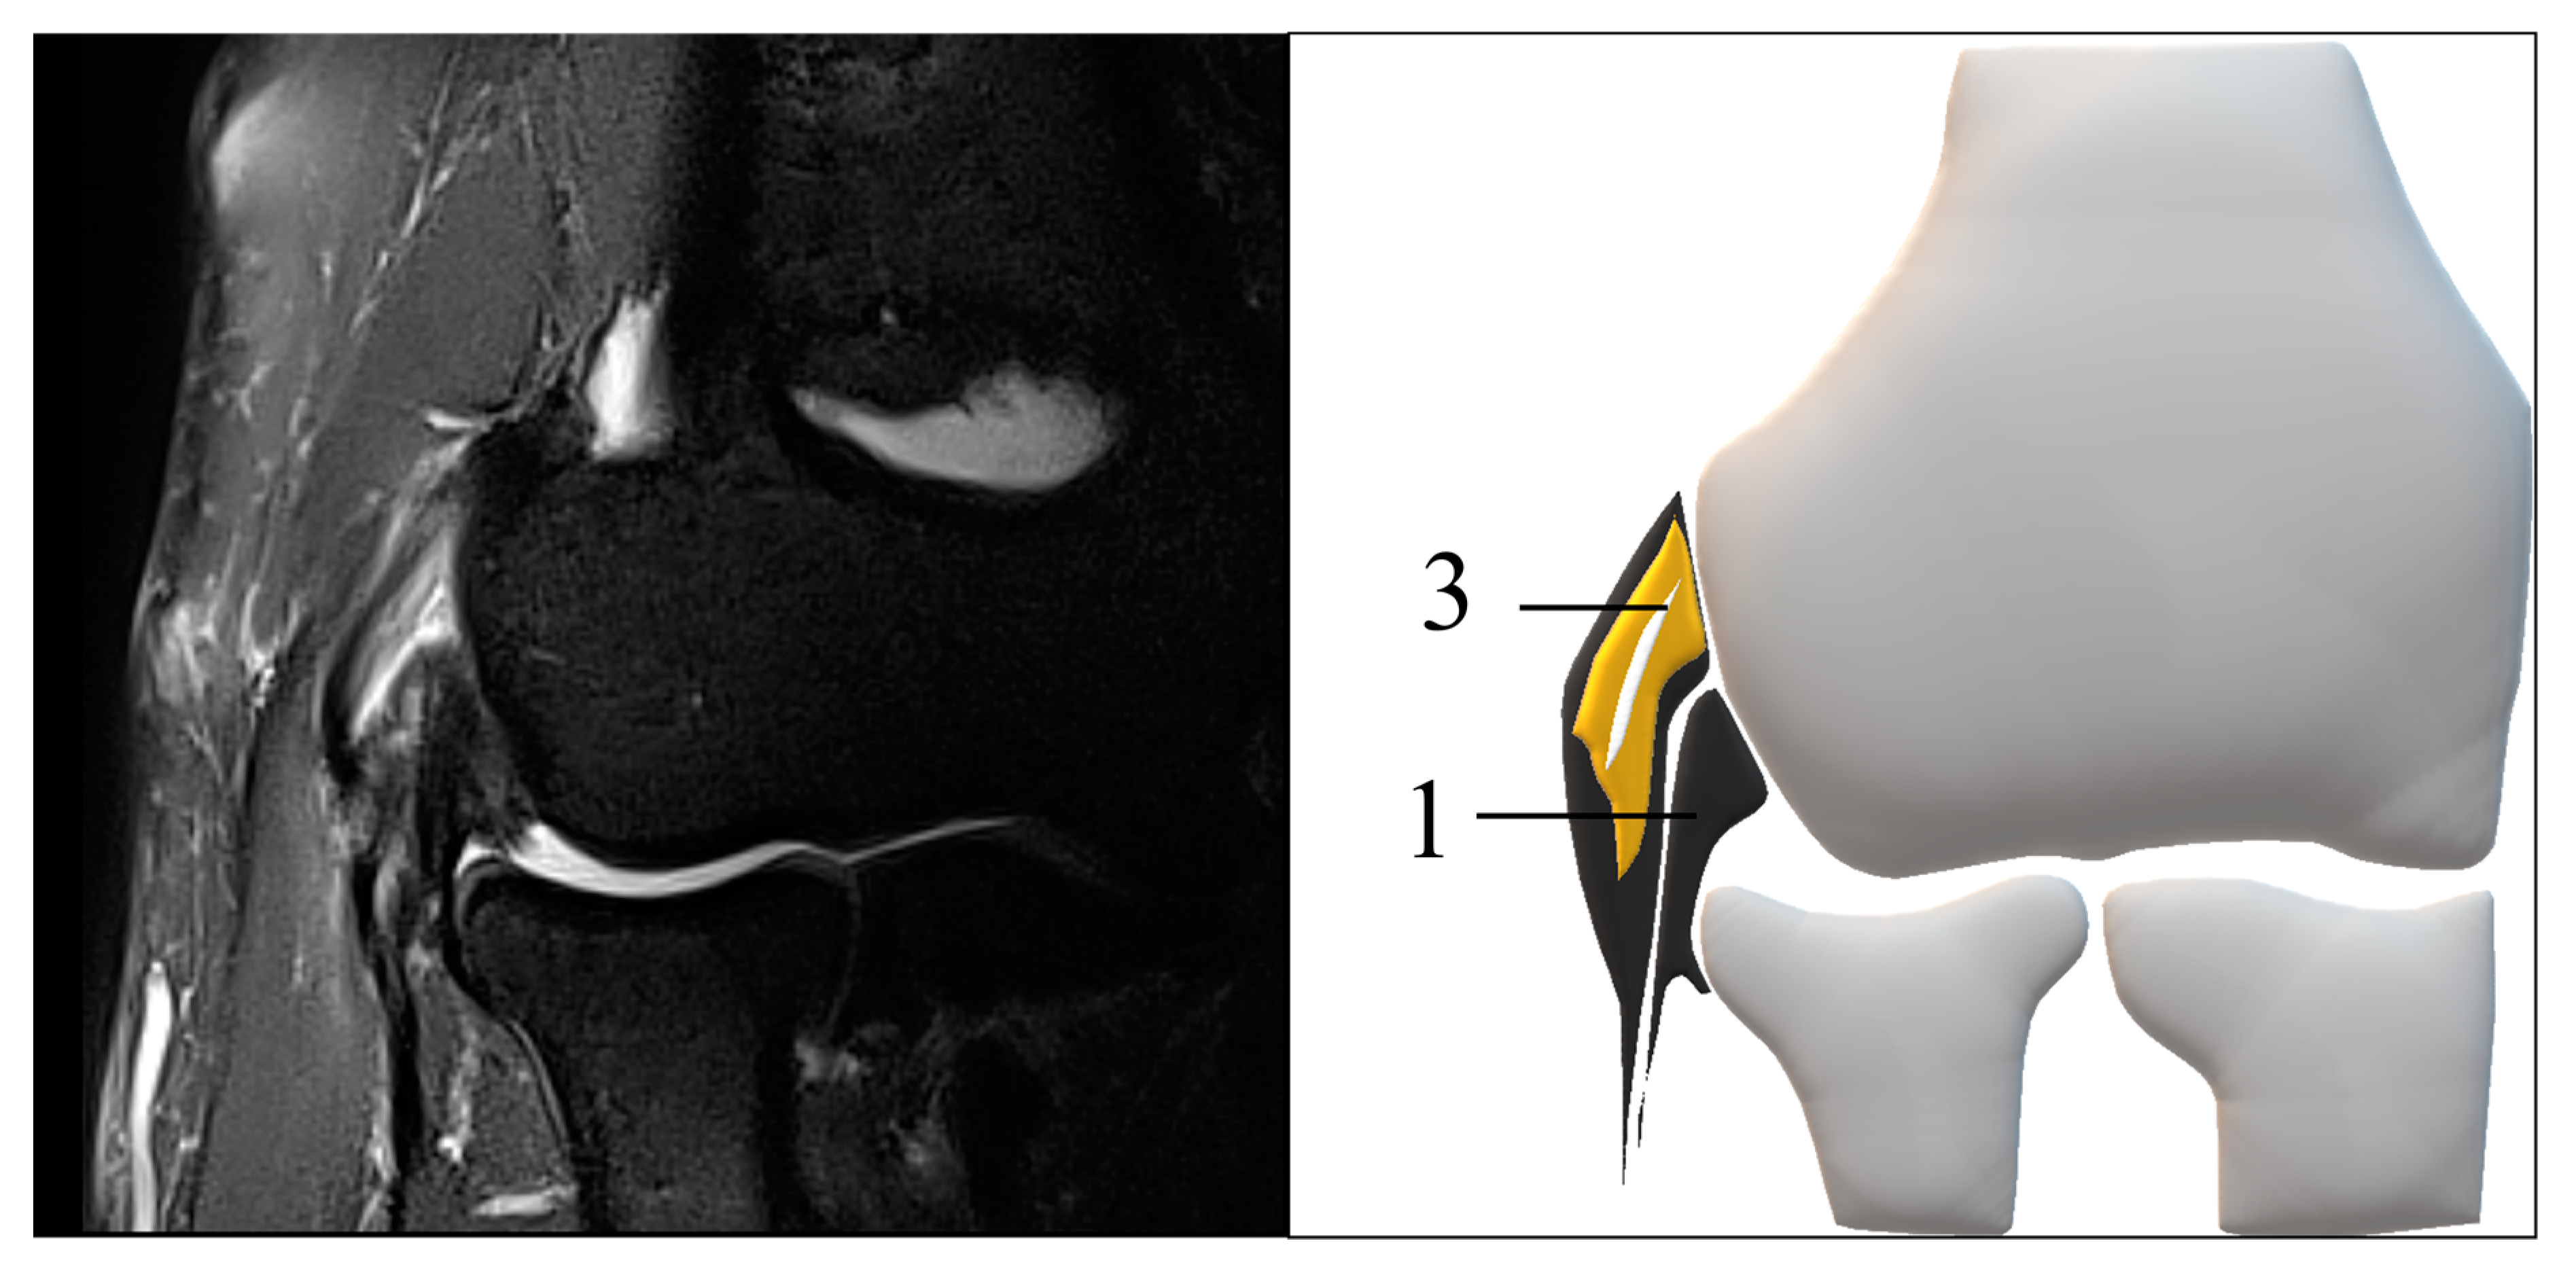
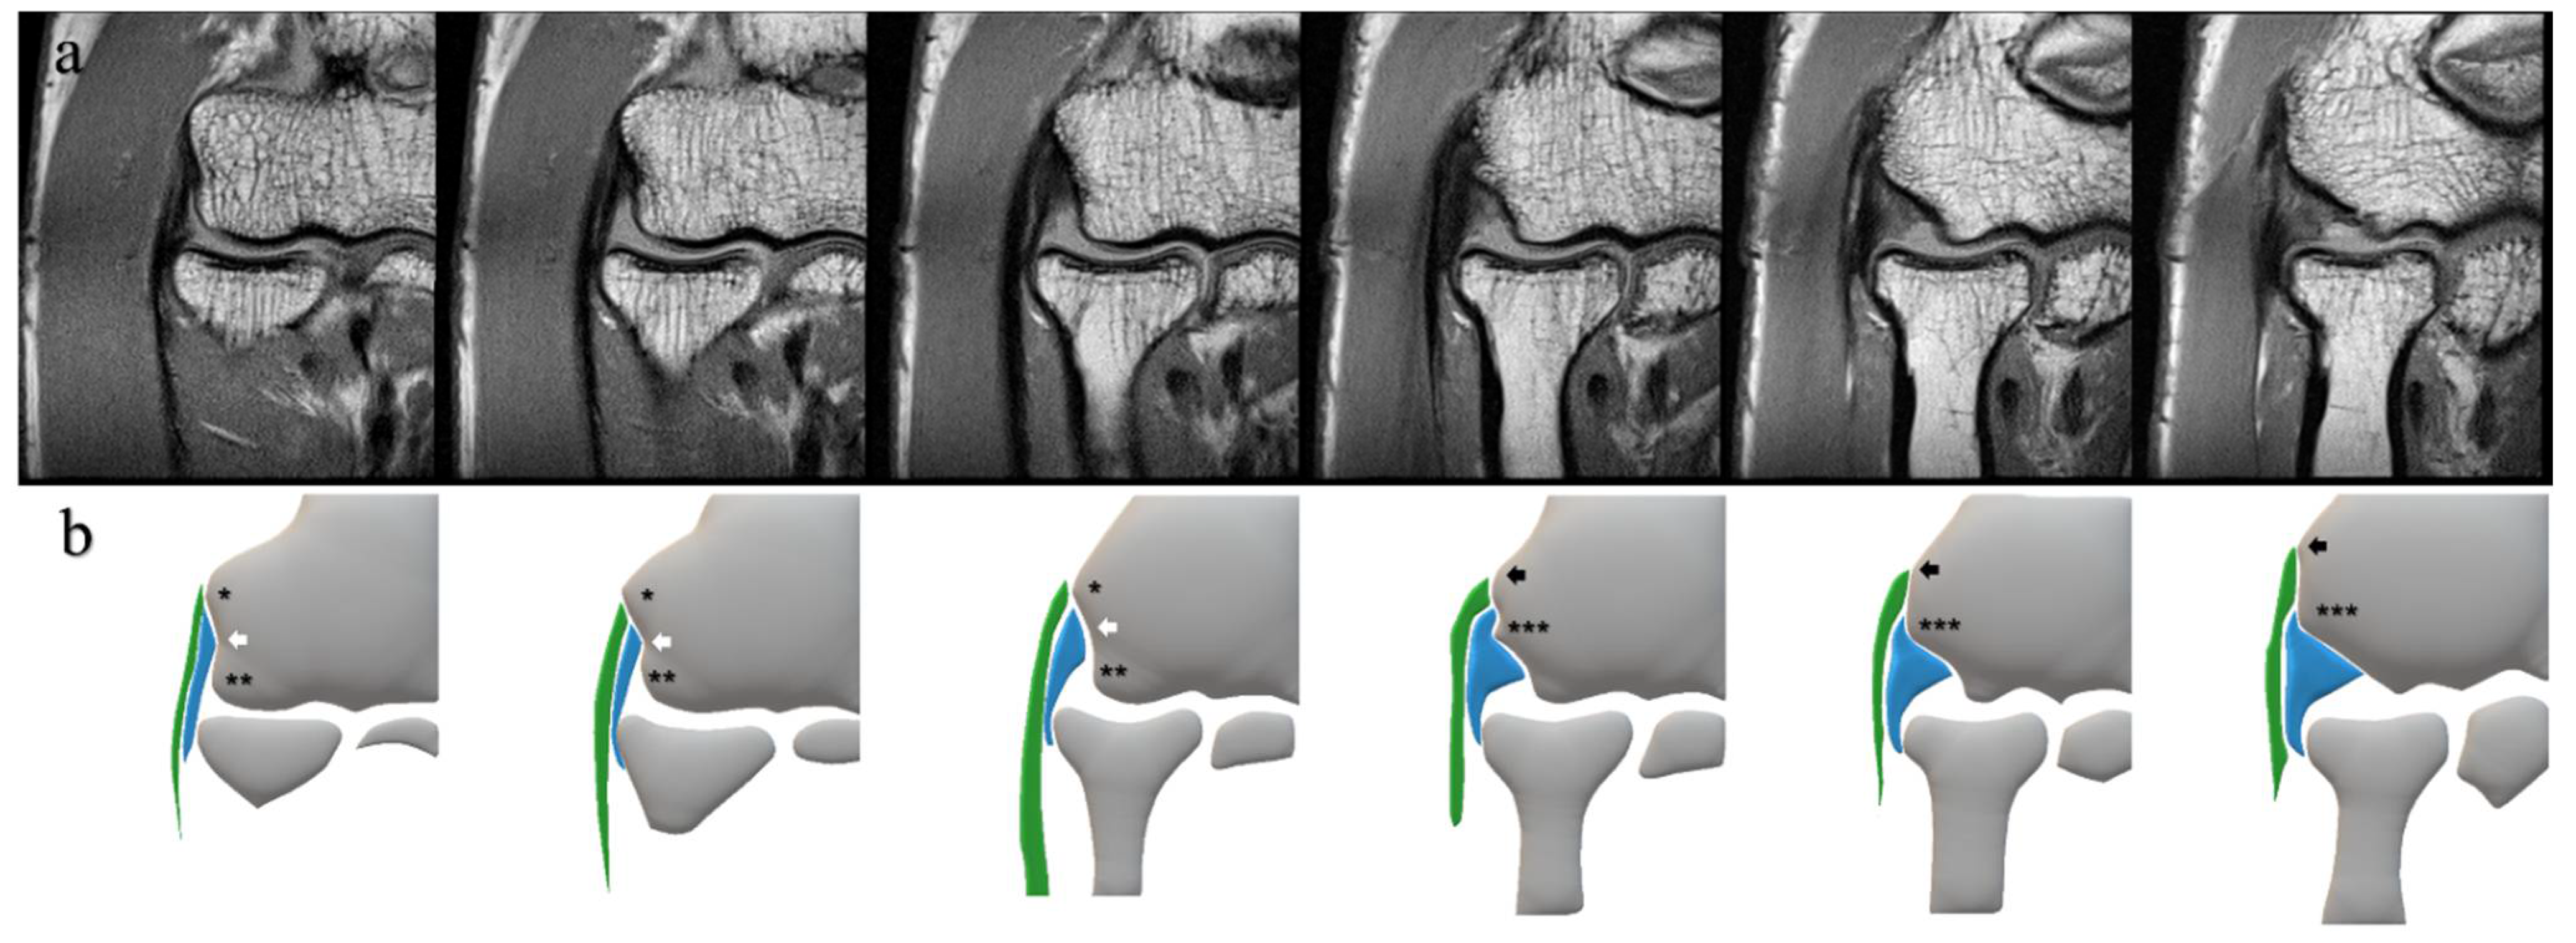
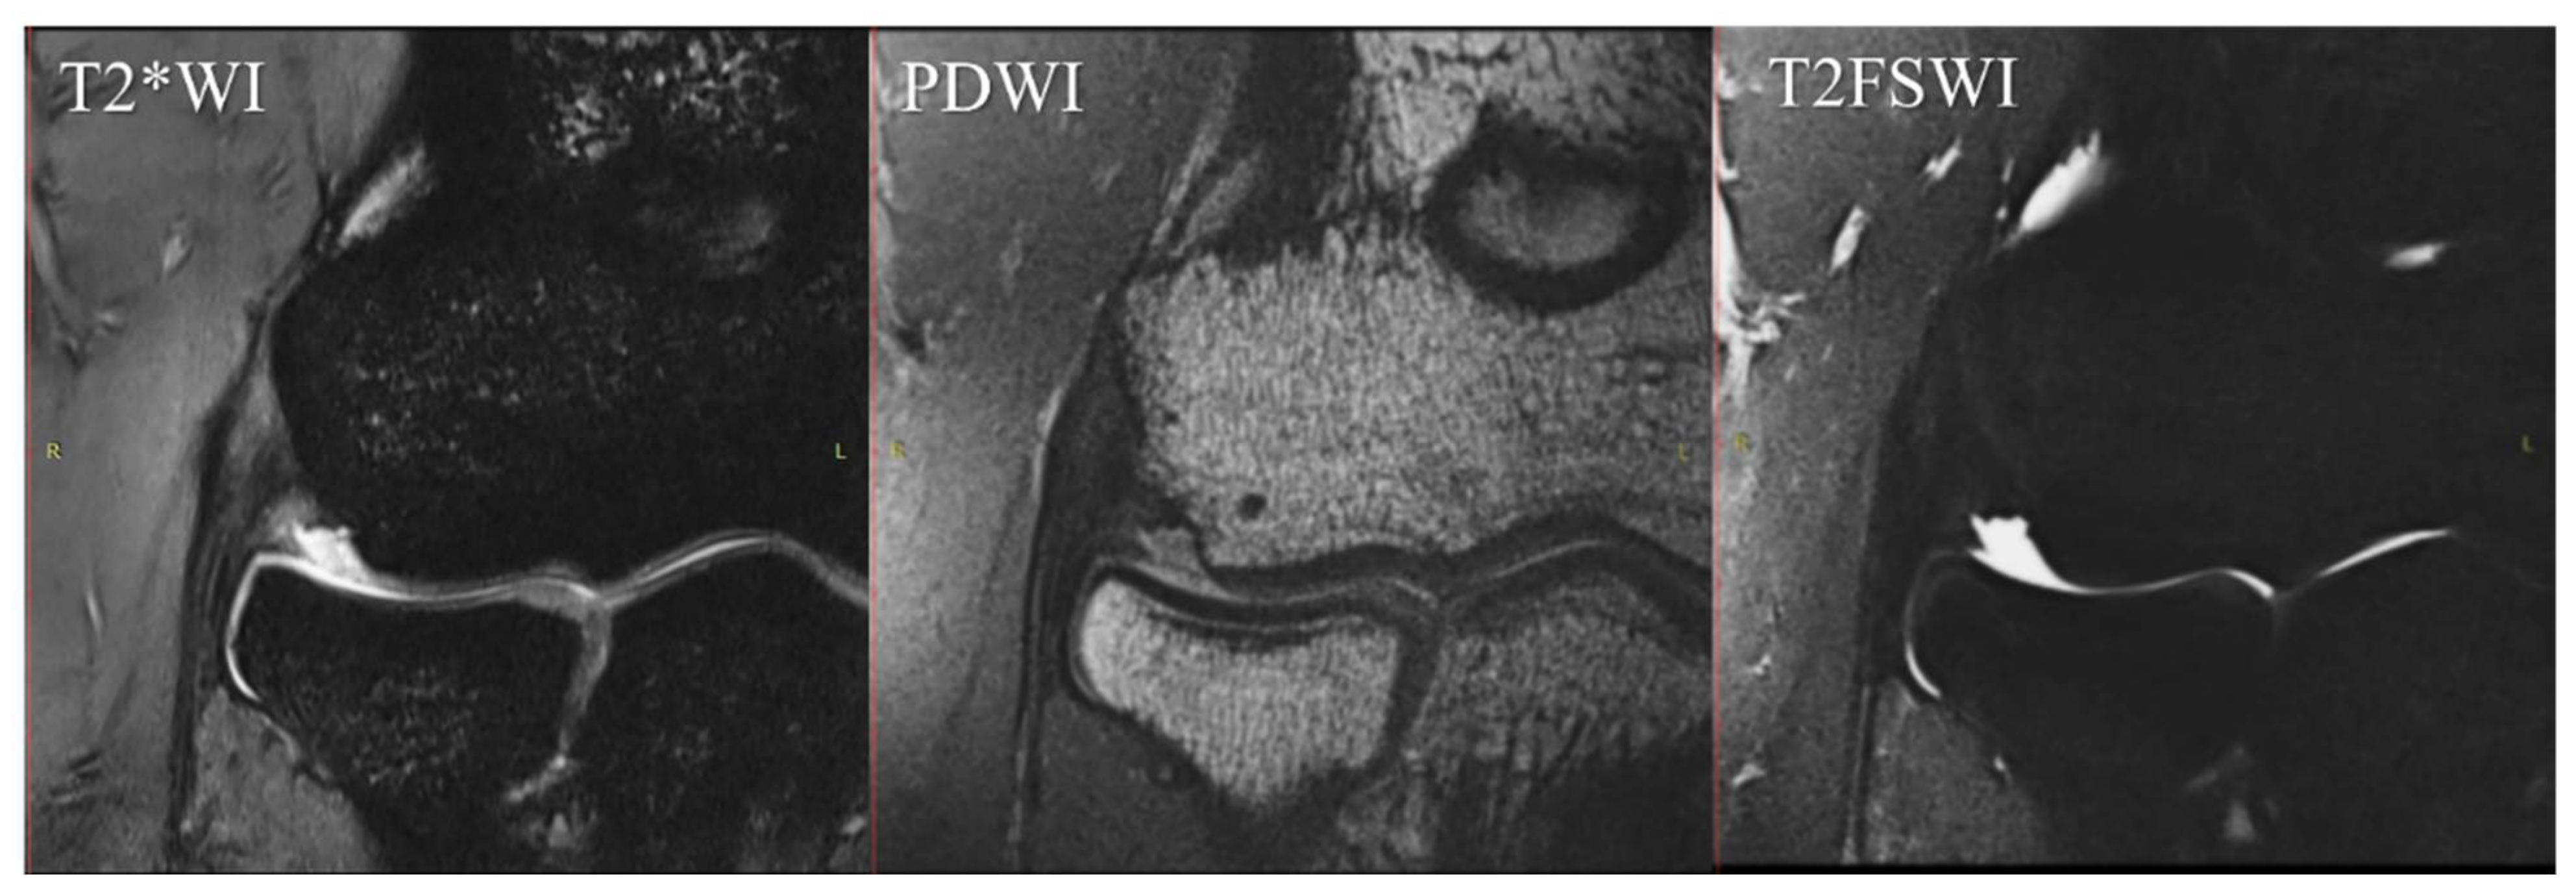
2.2. MRI Protocol and Definition of the Structures
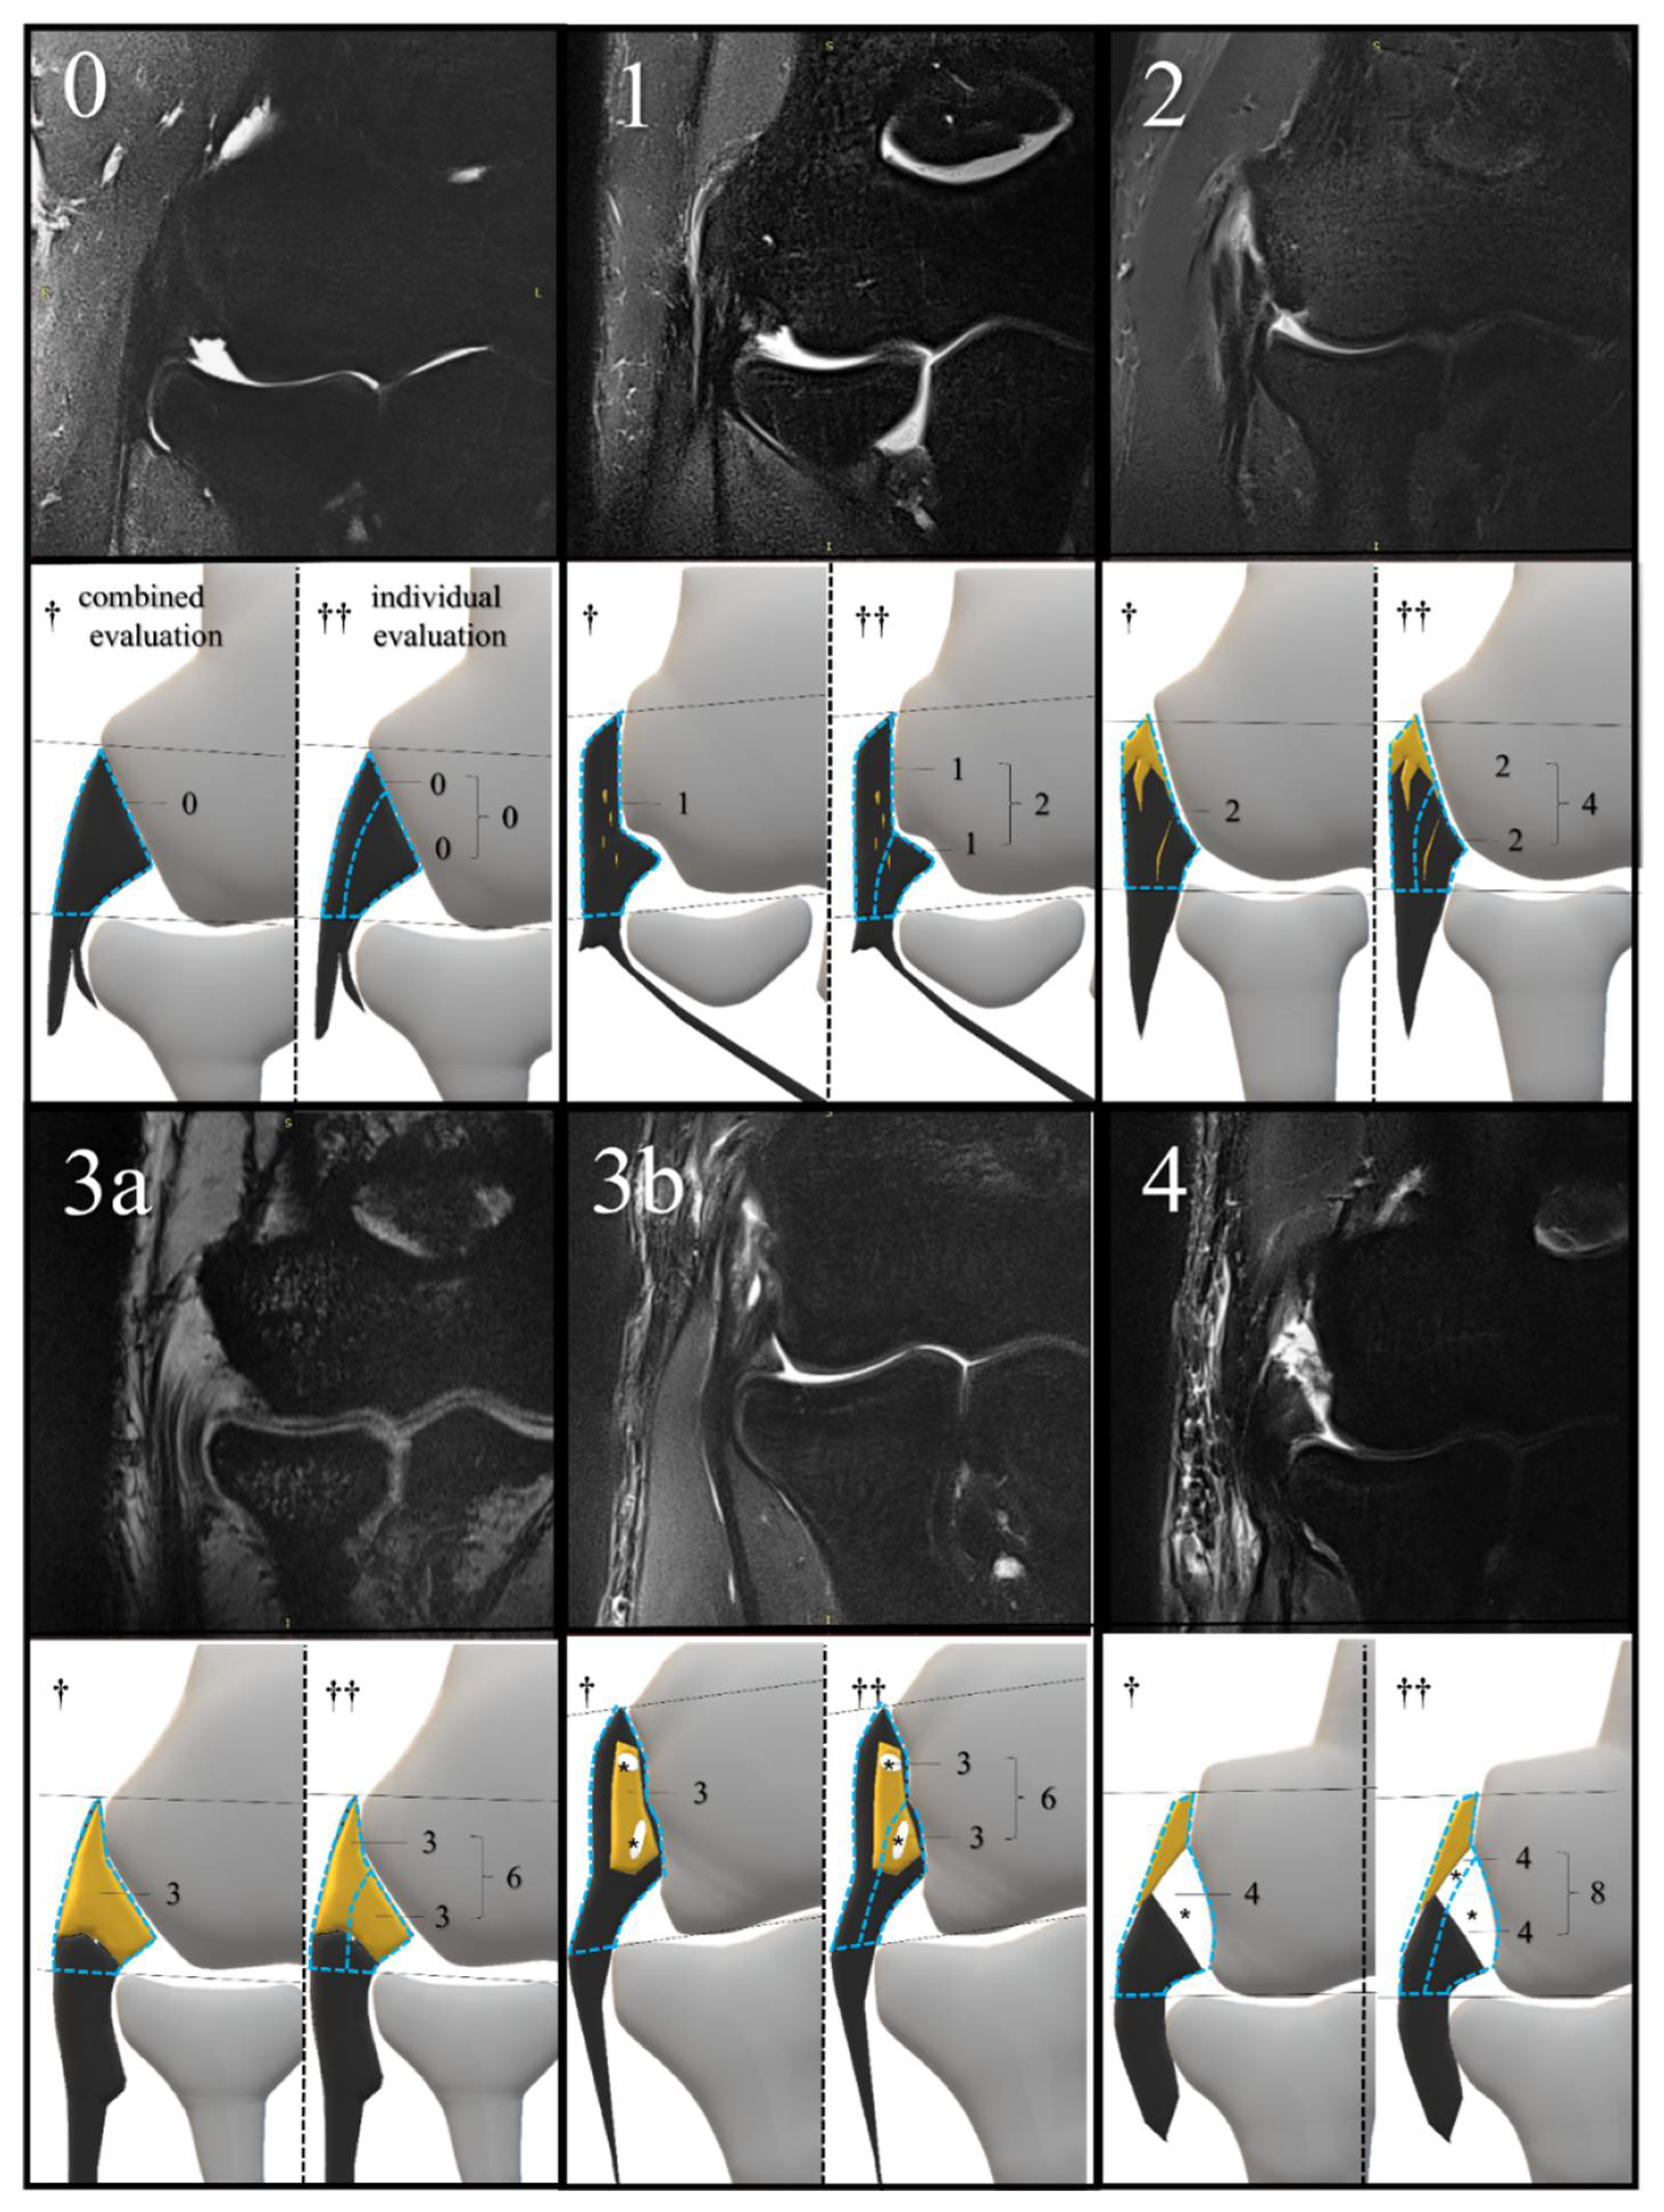
2.3. MRI Scoring and Evaluation
2.4. Statistical Analysis
2.5. Sample Size
3. Results
3.1. Demographic and Clinical Characteristics
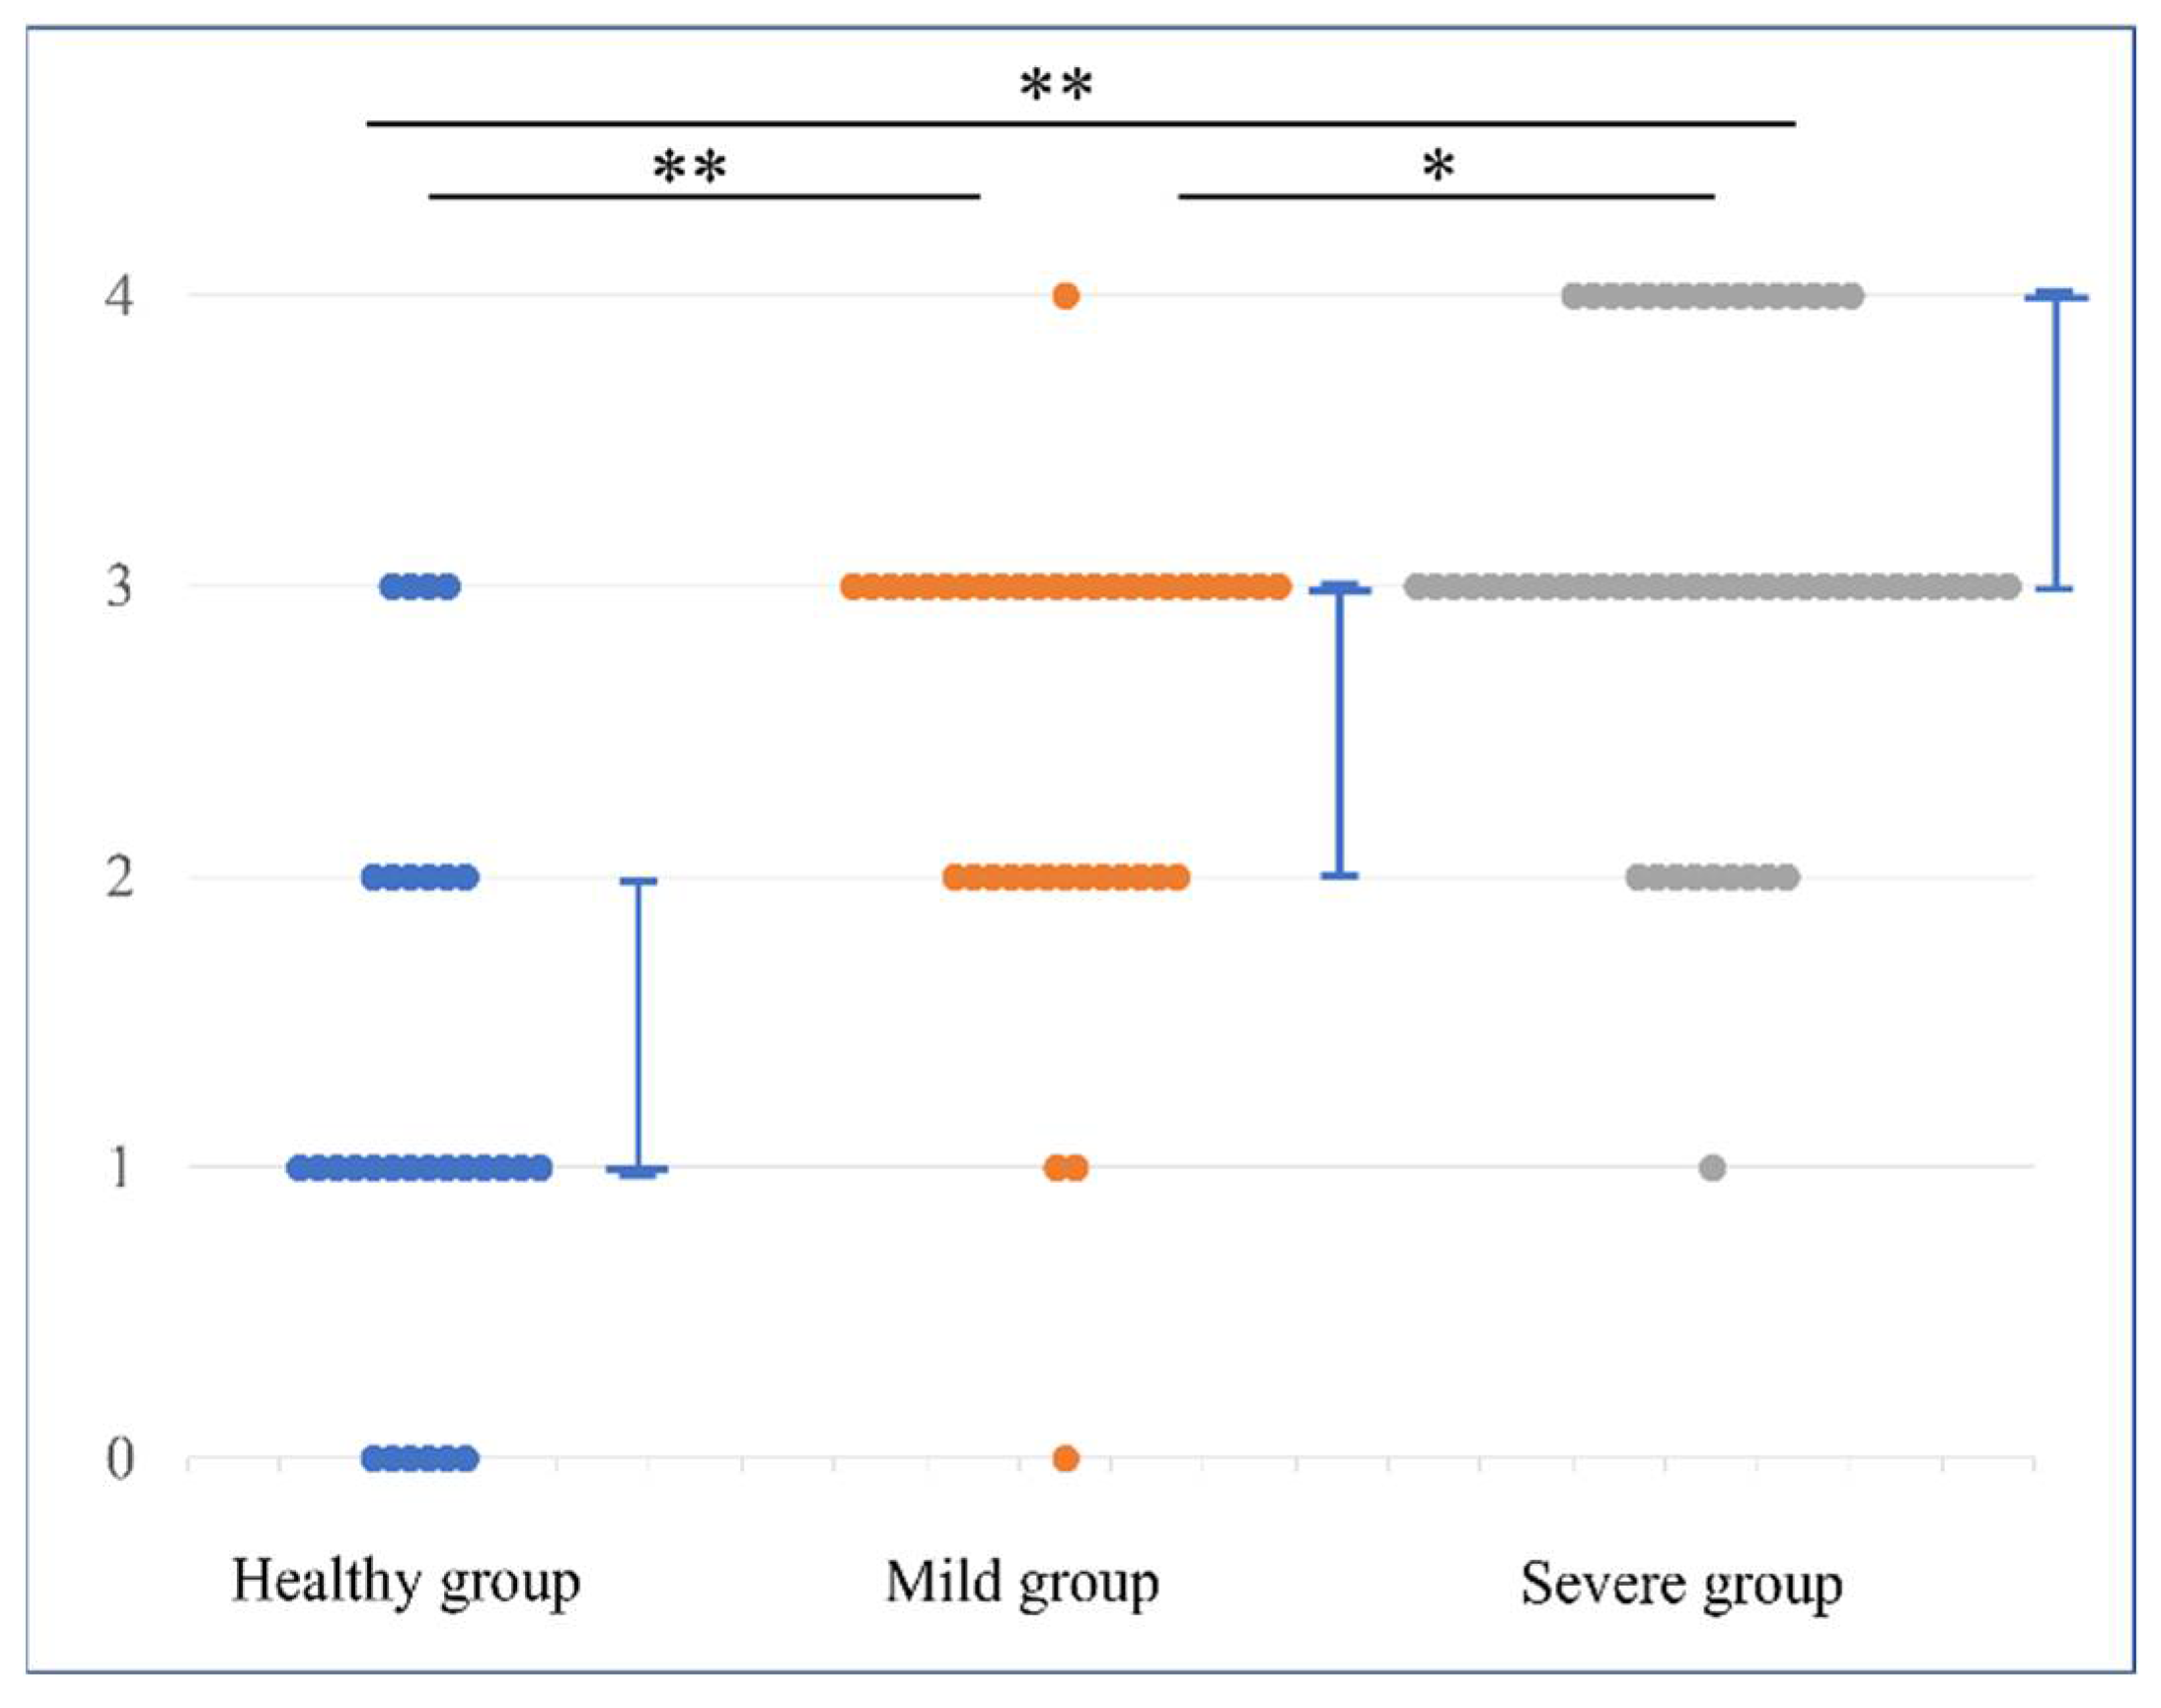
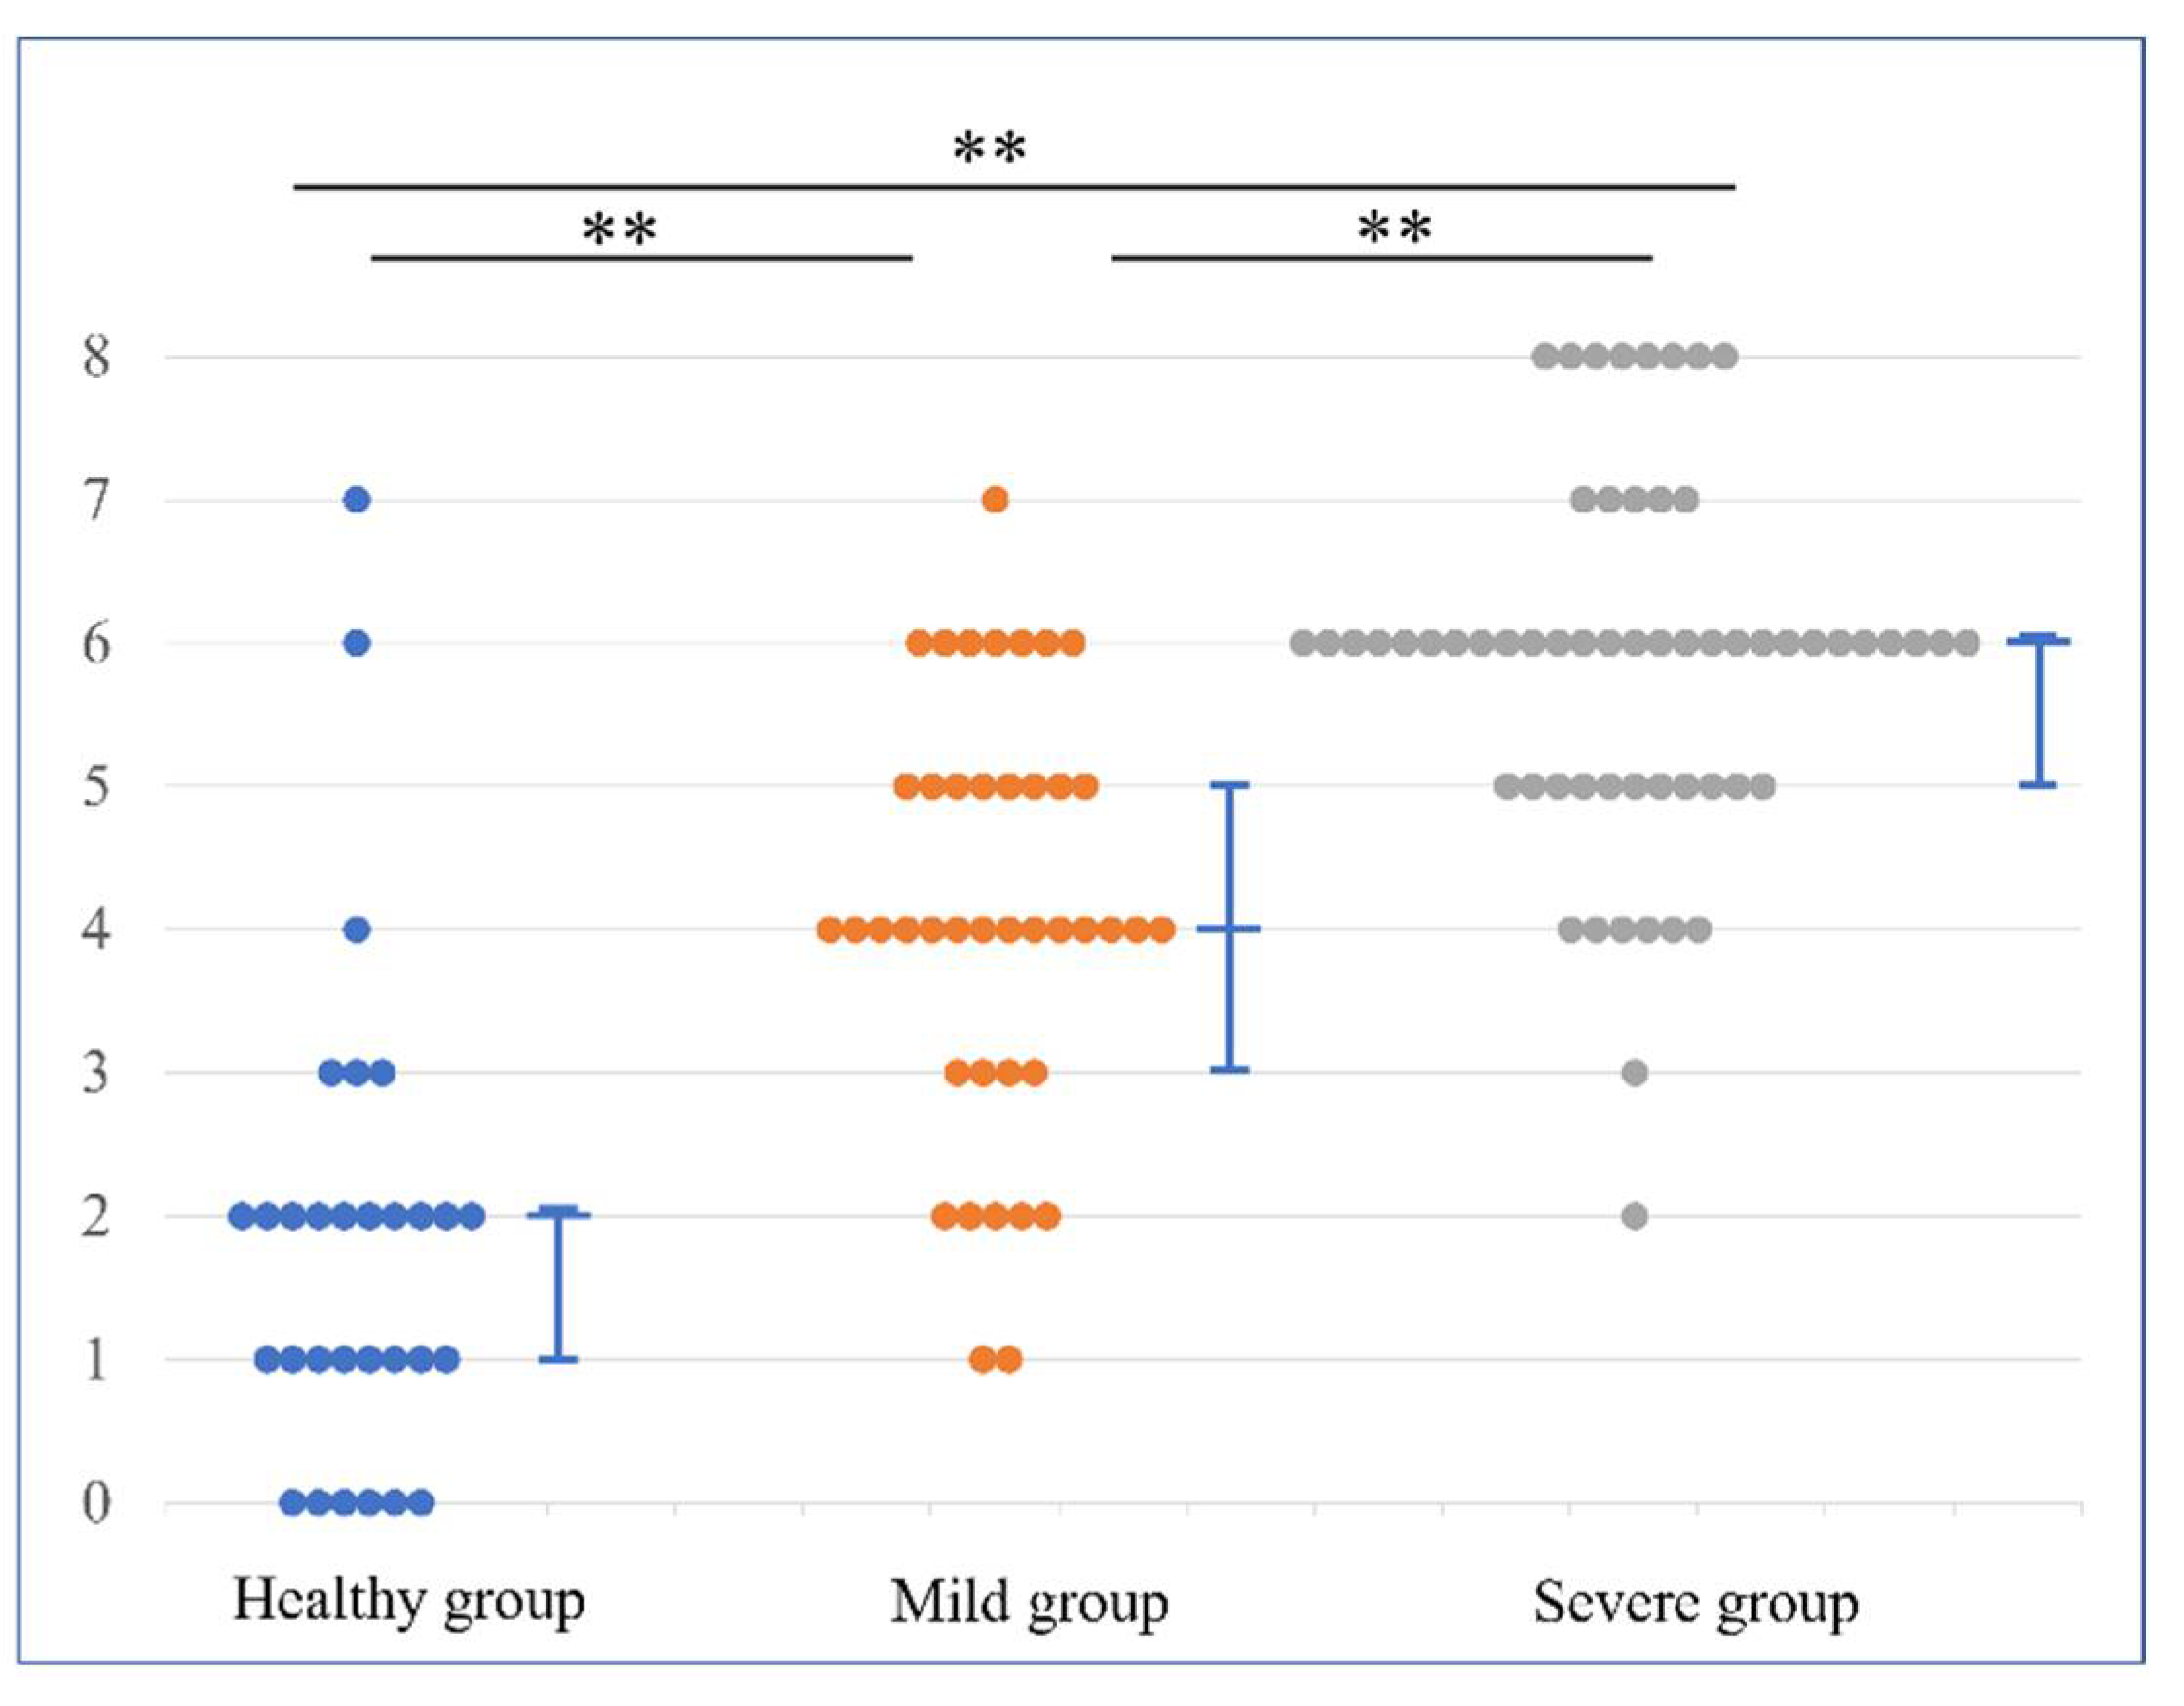
3.2. MRI Scoring
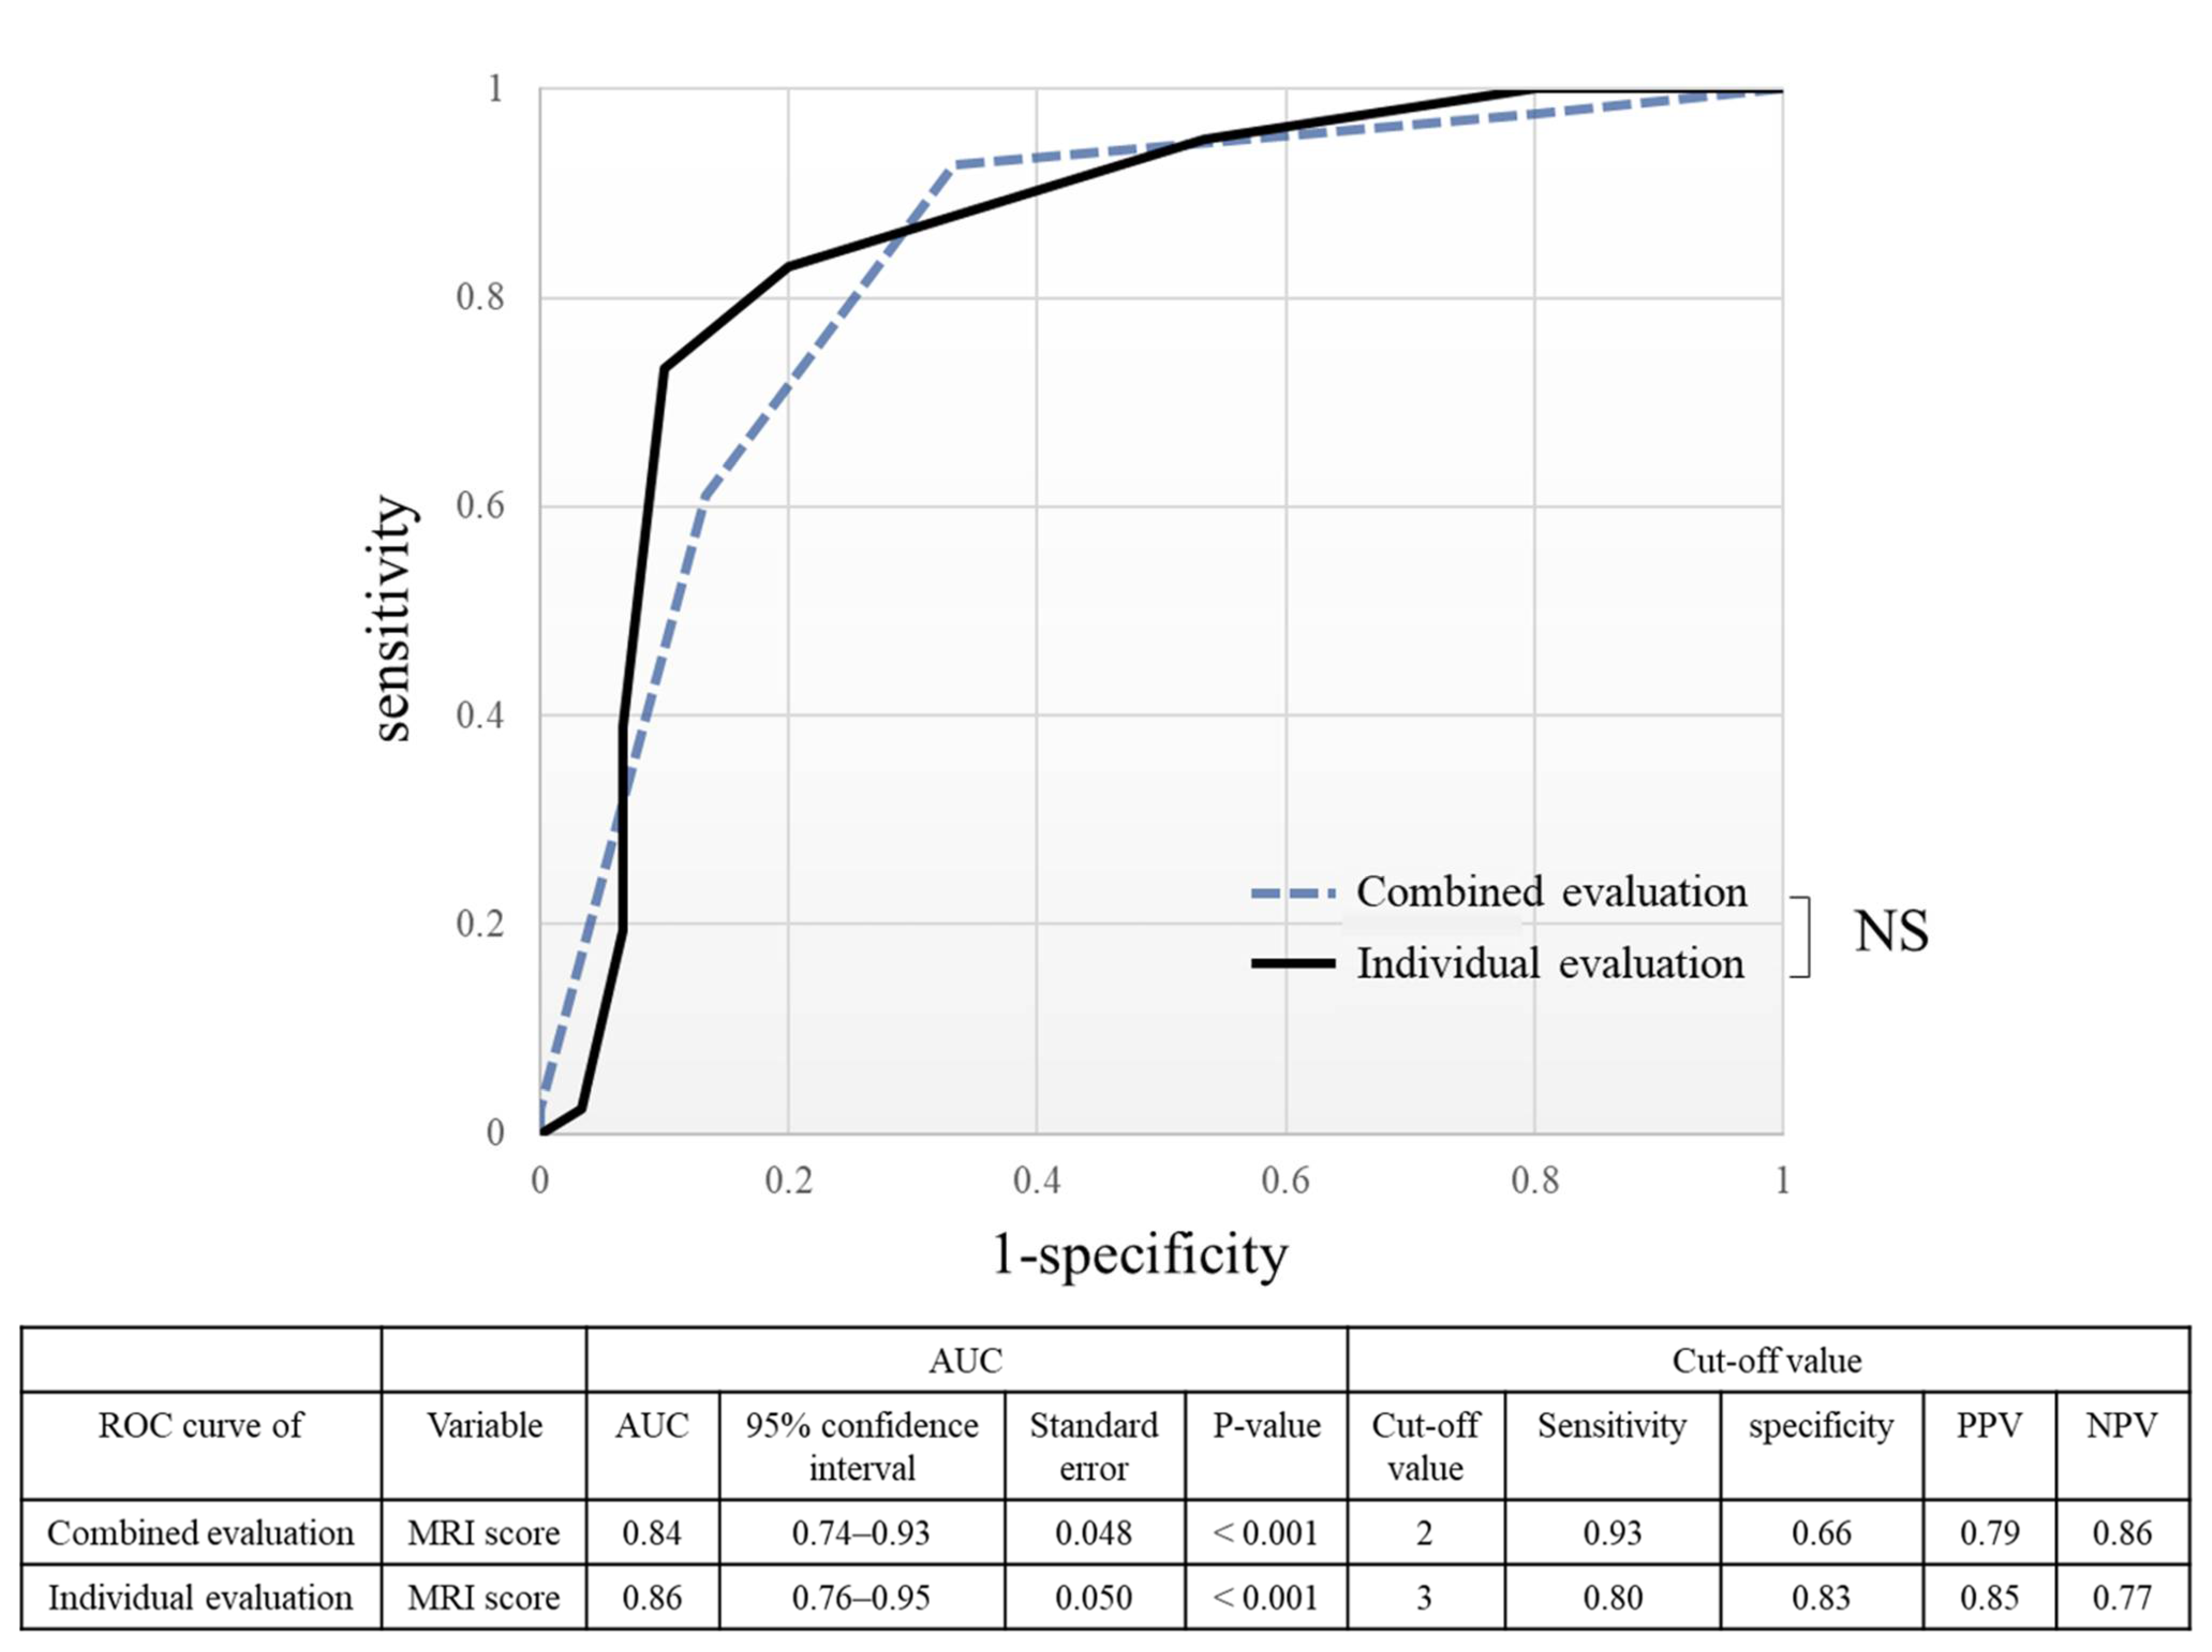
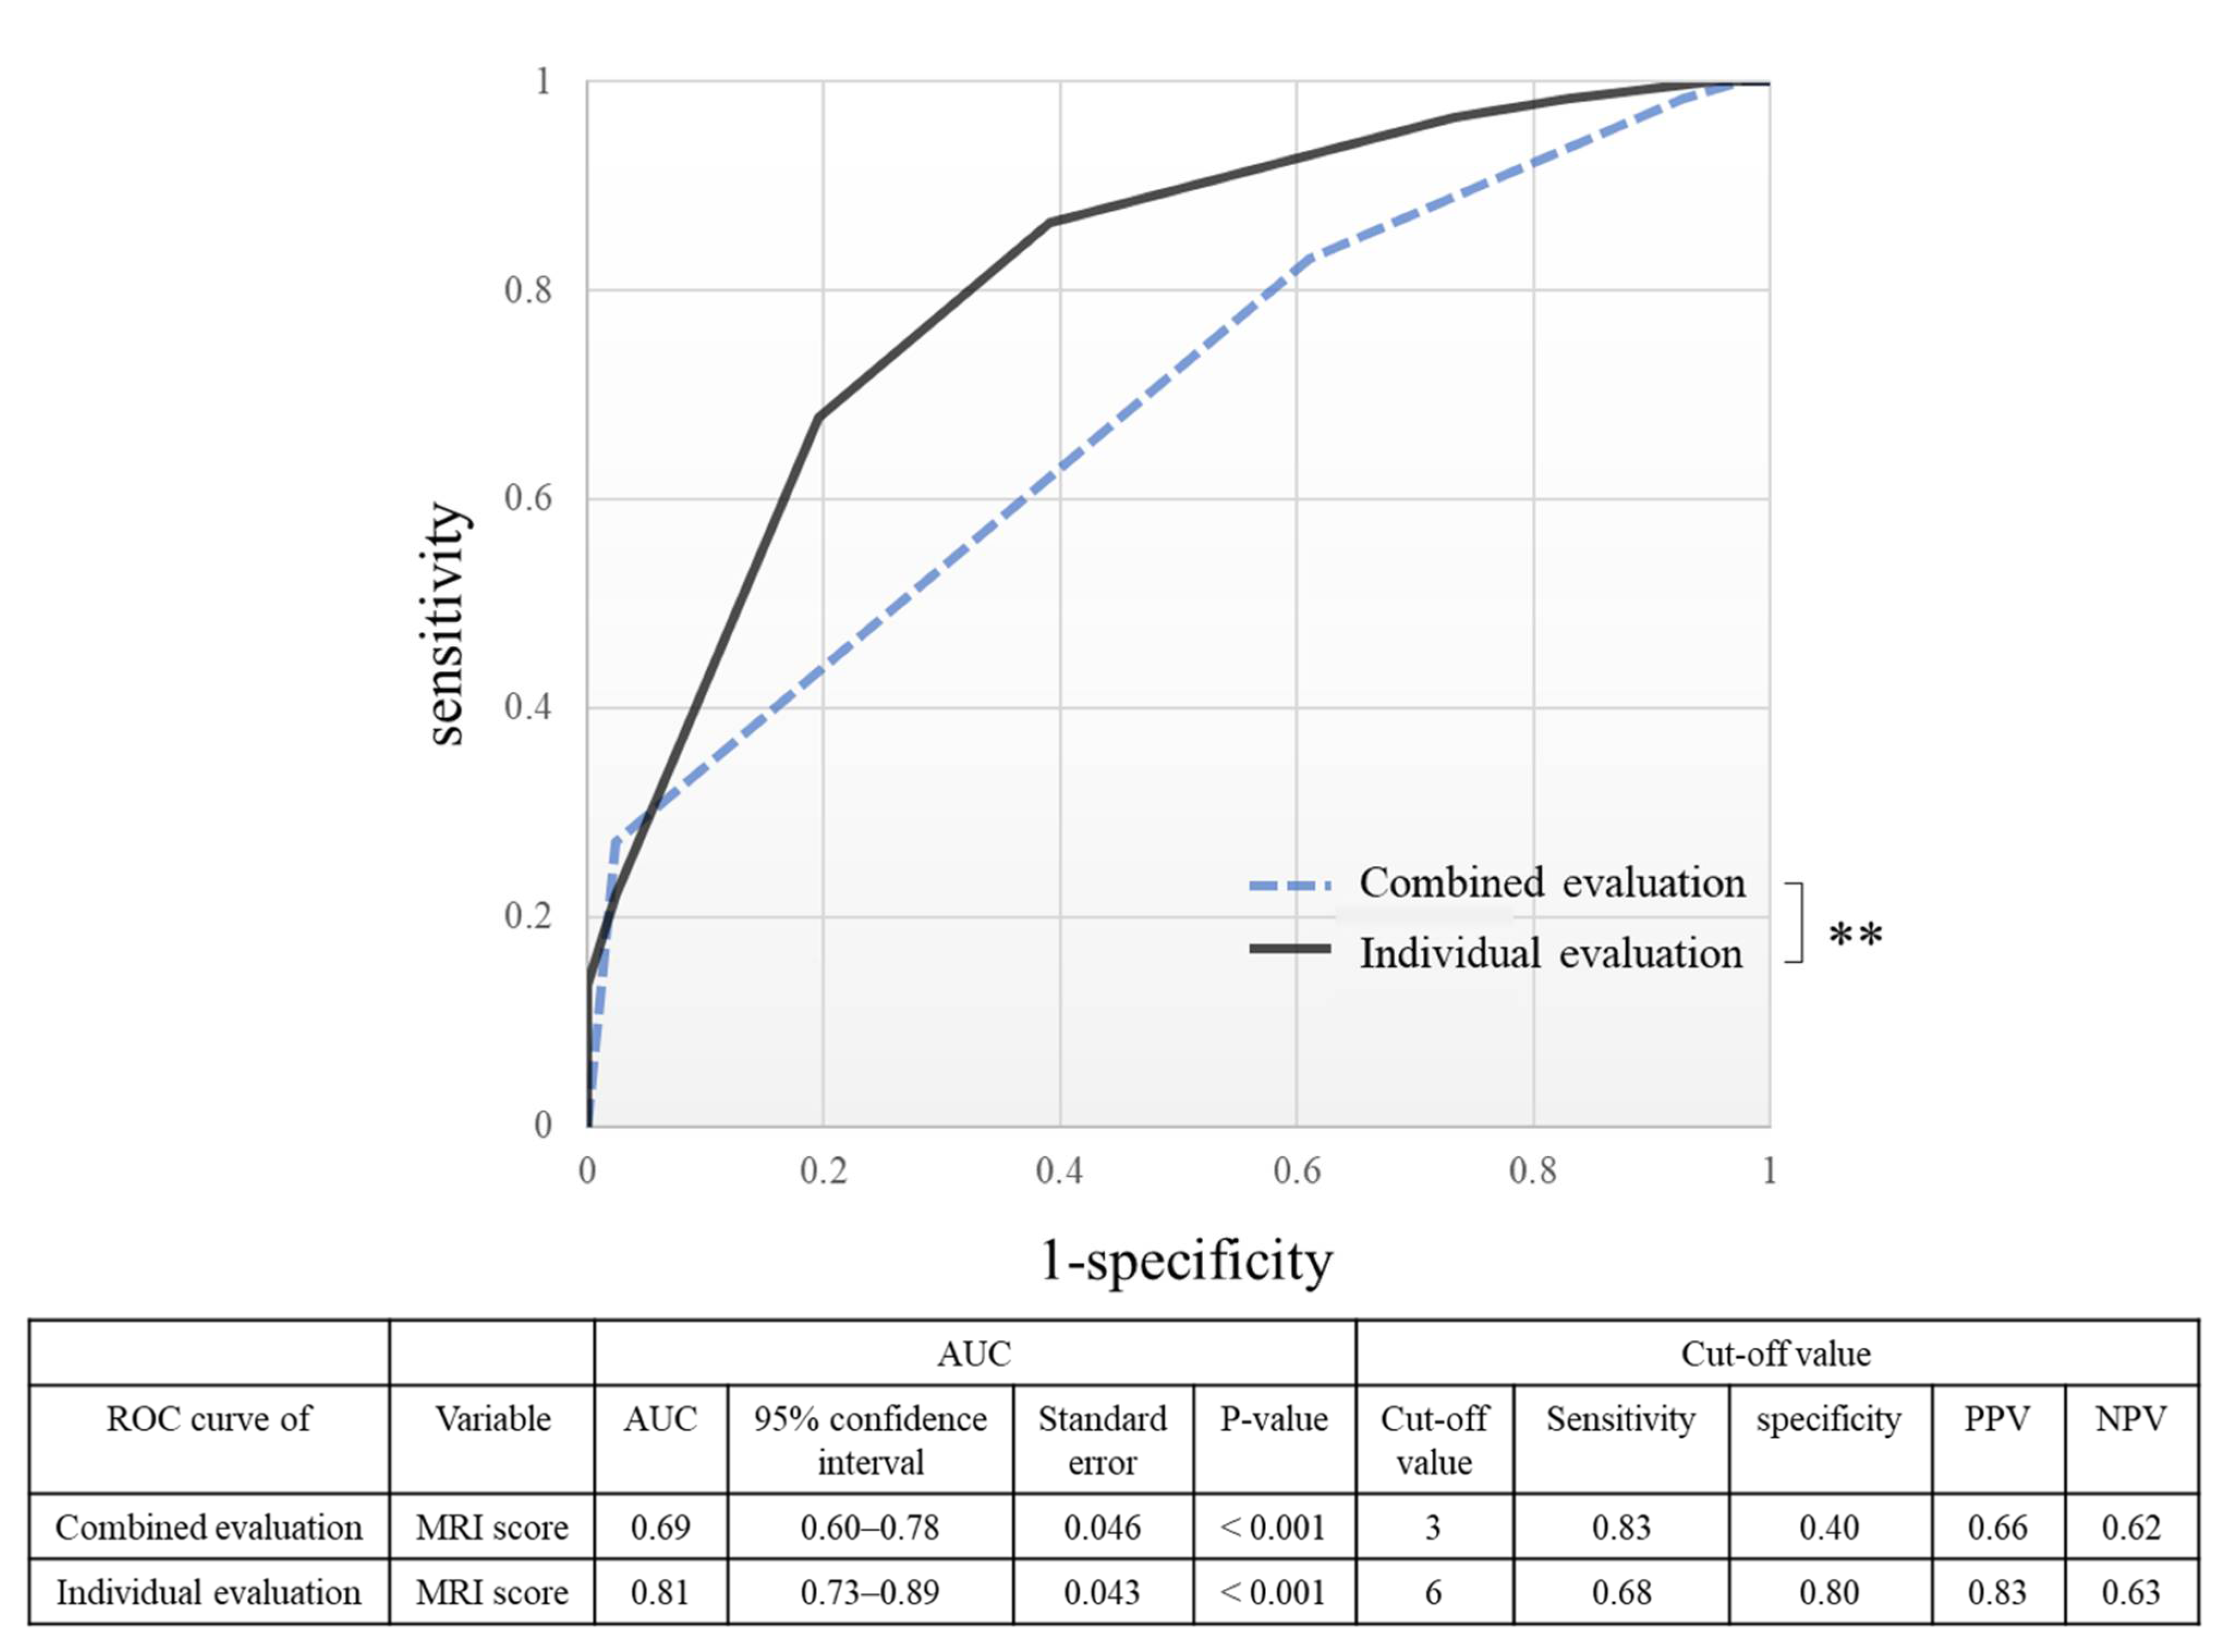
3.3. ROC Curve
3.4. Repeatability of MRI Scoring in This Study
4. Discussion
Supplementary Materials
Author Contributions
Funding
Institutional Review Board Statement
Informed Consent Statement
Data Availability Statement
Acknowledgments
Conflicts of Interest
References
- Ahmad, Z.; Siddiqui, N.; Malik, S.S.; Abdus-Samee, M.; Tytherleigh-Strong, G.; Rushton, N. Lateral epicondylitis: A review of pathology and management. Bone Jt. J. 2013, 95B, 1158–1164. [Google Scholar] [CrossRef] [PubMed]
- Runge, F. Zur Genese und Behandlung des schreibe Kranfes. Bed. Klin. Worchenschr. 1873, 10, 245–248. [Google Scholar]
- Shiri, R.; Viikari-Juntura, E. Lateral and medial epicondylitis: Role of occupational factors. Best. Pract. Res. Clin. Rheumatol. 2011, 25, 43–57. [Google Scholar] [CrossRef] [PubMed]
- Wolf, J.M.; Mountcastle, S.; Burks, R.; Sturdivant, R.X.; Owens, B.D. Epidemiology of lateral and medial epicondylitis in a military population. Mil. Med. 2010, 175, 336–339. [Google Scholar] [CrossRef] [Green Version]
- Fan, Z.J.; Silverstein, B.A.; Bao, S.; Bonauto, D.K.; Howard, N.L.; Spielholz, P.O.; Smith, C.K.; Polissar, N.L.; Viikari-Juntura, E. Quantitative exposure-response relations between physical workload and prevalence of lateral epicondylitis in a working population. Am. J. Ind. Med. 2009, 52, 479–490. [Google Scholar] [CrossRef]
- Shiri, R.; Viikari-Juntura, E.; Varonen, H.; Heliövaara, M. Prevalence and determinants of lateral and medial epicondylitis: A population study. Am. J. Epidemiol. 2006, 164, 1065–1074. [Google Scholar] [CrossRef]
- Cha, Y.K.; Kim, S.J.; Park, N.H.; Kim, J.Y.; Kim, J.H.; Park, J.Y. Magnetic resonance imaging of patients with lateral epicondylitis: Relationship between pain and severity of imaging features in elbow joints. Acta. Orthop. Traumatol. Turc. 2019, 53, 366–371. [Google Scholar] [CrossRef]
- Bredella, M.A.; Tirman, P.F.; Fritz, R.C.; Feller, J.F.; Wischer, T.K.; Genant, H.K. MR imaging findings of lateral ulnar collateral ligament abnormalities in patients with lateral epicondylitis. AJR Am. J. Roentgenol. 1999, 173, 1379–1382. [Google Scholar] [CrossRef]
- Kalainov, D.M.; Cohen, M.S. Posterolateral rotatory instability of the elbow in association with lateral epicondylitis. A report of three cases. J. Bone Joint Surg. Am. 2005, 87, 1120–1125. [Google Scholar] [CrossRef]
- Dones, V.C., 3rd; Grimmer, K.; Thoirs, K.; Suarez, C.G.; Luker, J. The diagnostic validity of musculoskeletal ultrasound in lateral epicondylalgia: A systematic review. BMC Med. Imaging 2014, 14, e10. [Google Scholar] [CrossRef] [Green Version]
- Latham, S.K.; Smith, T.O. The diagnostic test accuracy of ultrasound for the detection of lateral epicondylitis: A systematic review and meta-analysis. Orthop. Traumatol. Surg. Resarch 2014, 100, 281–286. [Google Scholar] [CrossRef] [Green Version]
- Khattab, E.M.; Abowarda, M.H. Role of Ultrasound Guided Platelet-Rich Plasma (PRP) Injection in Treatment of Lateral Epicondylitis. Egypt. J. Radiol. Nucl. Med. 2017, 48, 403–413. [Google Scholar] [CrossRef]
- Ruiz, A.G.; Diaz, G.V.; Fernandez, B.R.; Vargas, C.E.R.D. Effects of Ultrasound-Guided Administration of Botulinum Toxin (IncobotulinumtoxinA) in Patients with Lateral Epicondylitis. Toxins 2019, 46, e11010046. [Google Scholar]
- Casu, E.; Obradov-Rajic, M. Ultrasound Guided Standalone Percutaneous Needle Tenotomy for Chronic Lateral Epicondylitis: A Systematic Review. Adv. Tech. Musculoskelet. Surg. 2018, 2, 18–28. [Google Scholar]
- Jeon, J.Y.; Lee, M.H.; Jeon, I.H.; Chung, H.W.; Lee, S.H.; Shin, M.J. Lateral epicondylitis: Associations of MR imaging and clinical assessments with treatment options in patients receiving conservative and arthroscopic management. Eur. Radiol. 2018, 28, 972–981. [Google Scholar] [CrossRef]
- Lombardi, A.; Ashir, A.; Gorbachova, T.; Taljanovic, M.; Chang, E.Y. Magnetic resonance imaging of the elbow. Pol. J. Radiol. 2020, 85, e440–e460. [Google Scholar] [CrossRef]
- Waseem, M.; Nuhmani, S.; Ram, C.S.; Sachin, Y. Lateral epicondylitis: A review of the literature. J. Back Musculoskelet. Rehabil. 2012, 25, 131–142. [Google Scholar] [CrossRef] [Green Version]
- Nirschl, R.P.; Ashman, E.S. Elbow tendinopathy: Tennis elbow. Clin. Sports Med. 2003, 22, 813–836. [Google Scholar] [CrossRef]
- Ma, K.L.; Wang, H.Q. Management of Lateral Epicondylitis: A Narrative Literature Review. Pain Res. Manag. 2020, 2020, e6965381. [Google Scholar] [CrossRef]
- Pasternack, I.; Tuovinen, E.M.; Lohman, M.; Vehmas, T.; Malmivaara, A. MR findings in humeral epicondylitis. A systematic review. Acta. Radiol. 2001, 42, 434–440. [Google Scholar]
- Regan, W.; Wold, L.E.; Coonrad, R.; Morrey, B.F. Microscopic histopathology of chronic refractory lateral epicondylitis. Am. J. Sports Med. 1992, 20, 746–749. [Google Scholar] [CrossRef]
- Savnik, A.; Jensen, B.; Nørregaard, J.; Egund, N.; Danneskiold-Samsøe, B.; Bliddal, H. Magnetic resonance imaging in the evaluation of treatment response of lateral epicondylitis of the elbow. Eur. Radiol. 2004, 14, 964–969. [Google Scholar] [CrossRef]
- Walton, M.J.; Mackie, K.; Fallon, M.; Butler, R.; Breidahl, W.; Zheng, M.H.; Wang, A. The reliability and validity of magnetic resonance imaging in the assessment of chronic lateral epicondylitis. J. Hand Surg. Am. 2011, 36, 475–479. [Google Scholar] [CrossRef]
- Elisa, L.Z.; Matthijs, P.S.; Francois, M.; Jelle, H.; Denise, E.; Michel, P.B. Physical examination of the elbow, what is the evidence? A systematic literature review. Br. J. Sports Med. 2018, 52, 1253–1260. [Google Scholar]
- Zoner, C.S.; Buck, F.M.; Cardoso, F.N.; Gheno, R.; Trudell, D.J.; Randall, T.D.; Resnick, D. Detailed MRI-anatomic study of the lateral epicondyle of the elbow and its tendinous and ligamentous attachments in cadavers. Am. J. Roentgenol. 2010, 195, 629–636. [Google Scholar] [CrossRef] [PubMed]
- Nimura, A.; Fujishiro, H.; Wakabayashi, Y.; Imatani, J.; Sugaya, H.; Akita, K. Joint capsule attachment to the extensor carpi. J. Hand Surg. Am. 2014, 39, 219–225. [Google Scholar] [CrossRef] [PubMed]
- Bydder, M.; Rahal, A.; Fullerton, G.D.; Bydder, G.M. The magic angle effect: A source of artifact, determinant of image contrast, and technique for imaging. J. Magn. Reson. Imaging 2007, 25, 290–300. [Google Scholar] [CrossRef] [PubMed]
- Du, J.; Pak, B.C.; Znamirowski, R.; Statum, S.; Takahashi, A.; Chung, C.B.; Bydder, G.M. Magic angle effect in magnetic resonance imaging of the Achilles tendon and enthesis. Magn. Reson. Imaging 2009, 27, 557–564. [Google Scholar] [CrossRef]
- Zurlo, J.V.; Blacksin, M.F.; Karimi, S. The influence of flip angle on the magic angle effect. Skeltal Radiolol. 2000, 29, 593–596. [Google Scholar] [CrossRef]
- Steinborn, M.; Heuck, A.; Jessel, C.; Bonel, H.; Reiser, M. Magnetic resonance imaging of lateral epicondylitis of the elbow with a 0.2-T dedicated system. Eur. Radiol. 1999, 9, 1376–1380. [Google Scholar] [CrossRef]
- Qi, L.; Zhang, Y.-D.; Yu, R.-B.; Shi, H.-B. Magnetic resonance imaging of patients with chronic lateral epicondylitis: Is there a relationship between magnetic resonance imaging abnormalities of the common extensor tendon and the patient’s clinical symptom? Medicine 2016, 95, e2681. [Google Scholar] [CrossRef]
- Gatz, M.; Bode, D.; Betsch, M.; Quack, V.; Tingart, M.; Kuhl, C.; Schrading, S.; Dirrichs, T. Multimodal ultrasound Versus MRI for the diagnosis and monitoring of Ahilles tendinopathy: A prospective longitudinal study. Orthop. J. Sport Med. 2021, 9, 23259671211006826. [Google Scholar] [CrossRef]
- Qi, L.; Zhu, Z.-F.; Li, F.; Wang, R.-F. MR imaging of patients with lateral epicondylitis of the elbow: Is the common extensor tendon an isolated lesion? PLoS ONE. 2013, 8, e79498. [Google Scholar] [CrossRef] [Green Version]
- Chang, K.V.; Mezian, K.; Nanka, O.; Wu, W.T.; Lou, Y.M.; Wang, J.C.; Martinoli, C.; Ozcakar, L. Ultrasound Imaging for the Cutaneous Nerves of the Extremities and Relevant Entrapment Syndromes: From Anatomy to Clinical Implications. J. Clin. Med. 2018, 7, e7110457. [Google Scholar] [CrossRef] [Green Version]
- Wagle, S.; Glazebrook, K.; Moynagh, M.; Smith, J.; Sellon, J.; Skinner, J.; Morrey, M. Role of ultrasound-guided perineural injection of the posterior antebrachial cutaneous nerve for diagnosis and potential treatment of chronic lateral elbow pain. Skeltal Radiol. 2021, 50, 425–430. [Google Scholar] [CrossRef]
- Ahmed, A.F.; Rayyan, R.; Zikria, B.; Salameh, M. Lateral epicondylitis of the elbow: An up-to-date review of management. Eur. J. Orthop. Surg. Traumatol. 2022, 21, e03181. [Google Scholar] [CrossRef]
- Kraushaar, B.S.; Nirschl, R.P. Tendinosis of the elbow (Tennis elbow): Clinical features and findings of histological, immunohistochemical, and electron microscopy studies. J. Bone Jt. Surg. Ser. A. 1999, 81, 259–278. [Google Scholar] [CrossRef]
- Aurelie, A.; Lieven, D.W.; Nadine, H.; Carlos, H.; Marc, V.; Koen, P.; Alexander, V.T. Tennis elbow: Associated psychological factors. J. Shoulder Elb. Surg. 2018, 27, 387–392. [Google Scholar]
- Van, R.R.M.; Huisstede, B.M.; Koes, B.W.; Burdorf, A.B. Associations between work-related factors and specific disorders at the elbow: A systematic literature review. Rheumatology 2009, 48, 528–536. [Google Scholar]
- Bhabra, G.; Wang, A.; Ebert, J.R.; Edwards, P.; Zheng, M.; Zheng, M.H. Lateral Elbow Tendinopathy: Development of a Pathophysiology-Based Treatment Algorithm. Orthop. J. Sports Med. 2016, 4, 2325967116670635. [Google Scholar] [CrossRef]
- Kwak, S.H.; Lee, S.J.; Jeong, H.S.; Do, M.U.; Suh, K.T. Subtle elbow instability associated with lateral epicondylitis. BMC Musculoskeltal Disord. 2018, 19, 136. [Google Scholar] [CrossRef]
- Noh, Y.M.; Kong, G.M.; Moon, S.W.; Jang, H.S.; Kim, S.; Bak, G.G.; Kim, Y. Lateral ulnar collateral ligament (LUCL) reconstruction for the treatment of recalcitrant lateral epicondylitis of the elbow: A comparison with open débridement of the extensor origin. JSES Int. 2021, 16, 578–587. [Google Scholar] [CrossRef]


| Sequence | T2*WI | PDWI | T2FSWI |
|---|---|---|---|
| Voxel size | 0.2 × 0.2 × 1.5 | 0.2 × 0.2 × 1.5 | 0.2 × 0.2 × 1.5 |
| Matrix | 160 × 320 | 240 × 320 | 256 × 256 |
| FOV | 60 mm | 60 mm | 60 mm |
| Base resolution | 320 | 320 | 256 |
| Phase resolution | 50% | 50% | 50% |
| Slice thickness | 1.5 mm | 1.5 mm | 1.5 mm |
| TR | 553.0 ms | 553.0 ms | 3000.0 ms |
| TE | 24 ms | 24 ms | 94 ms |
| Bandwidth | 180 Hz/Px | 180 Hz/Px | 145 Hz/Px |
| Flip angle | 30 | 170 | 122 |
| Healthy Group | Mild Group | Severe Group | p-Value | |
|---|---|---|---|---|
| Sex Male | 12 | 21 | 31 | p = 0.51 |
| Female | 18 | 20 | 28 | |
| Age (y) † | 49 (27–69) | 49 (34–77) | 49 (23–78) | p = 0.27 |
| Injection therapy | - | p < 0.001 | ||
| 0 | 21 | 6 | ||
| 1–2 | 17 | 29 | ||
| 3≤ | 3 | 24 | ||
| unidentified | 0 | 0 | ||
| Duration of pain (months) † | - | 6.4 (2.1–81.0) | 12.5 (1.4–133.1) | p = 0.032 |
| 0–1 month | 0 | 0 | ||
| 1–3 months | 6 | 4 | ||
| 3–6 months | 12 | 12 | ||
| 6–12 months | 12 | 12 | ||
| >12 months | 9 | 31 | ||
| Unidentified | 2 | 0 | ||
| Required surgery †† | - | 0/41 | 50/59 | p < 0.001 |
Publisher’s Note: MDPI stays neutral with regard to jurisdictional claims in published maps and institutional affiliations. |
© 2022 by the authors. Licensee MDPI, Basel, Switzerland. This article is an open access article distributed under the terms and conditions of the Creative Commons Attribution (CC BY) license (https://creativecommons.org/licenses/by/4.0/).
Share and Cite
Ikeda, K.; Ogawa, T.; Ikumi, A.; Yoshii, Y.; Kohyama, S.; Ikeda, R.; Yamazaki, M. Individual Evaluation of the Common Extensor Tendon and Lateral Collateral Ligament Improves the Severity Diagnostic Accuracy of Magnetic Resonance Imaging for Lateral Epicondylitis. Diagnostics 2022, 12, 1871. https://doi.org/10.3390/diagnostics12081871
Ikeda K, Ogawa T, Ikumi A, Yoshii Y, Kohyama S, Ikeda R, Yamazaki M. Individual Evaluation of the Common Extensor Tendon and Lateral Collateral Ligament Improves the Severity Diagnostic Accuracy of Magnetic Resonance Imaging for Lateral Epicondylitis. Diagnostics. 2022; 12(8):1871. https://doi.org/10.3390/diagnostics12081871
Chicago/Turabian StyleIkeda, Kazuhiro, Takeshi Ogawa, Akira Ikumi, Yuichi Yoshii, Sho Kohyama, Reimi Ikeda, and Masashi Yamazaki. 2022. "Individual Evaluation of the Common Extensor Tendon and Lateral Collateral Ligament Improves the Severity Diagnostic Accuracy of Magnetic Resonance Imaging for Lateral Epicondylitis" Diagnostics 12, no. 8: 1871. https://doi.org/10.3390/diagnostics12081871