
Radiomics in Cross-Sectional Adrenal Imaging: A Systematic Review and Quality Assessment Study

 ,
,  , , ,
, , ,
Abstract
:1. Introduction
2. Materials and Methods
2.1. Search Strategy and Eligibility Criteria
2.2. Data Collection and Study Evaluation
2.3. Statistical Analysis
3. Results
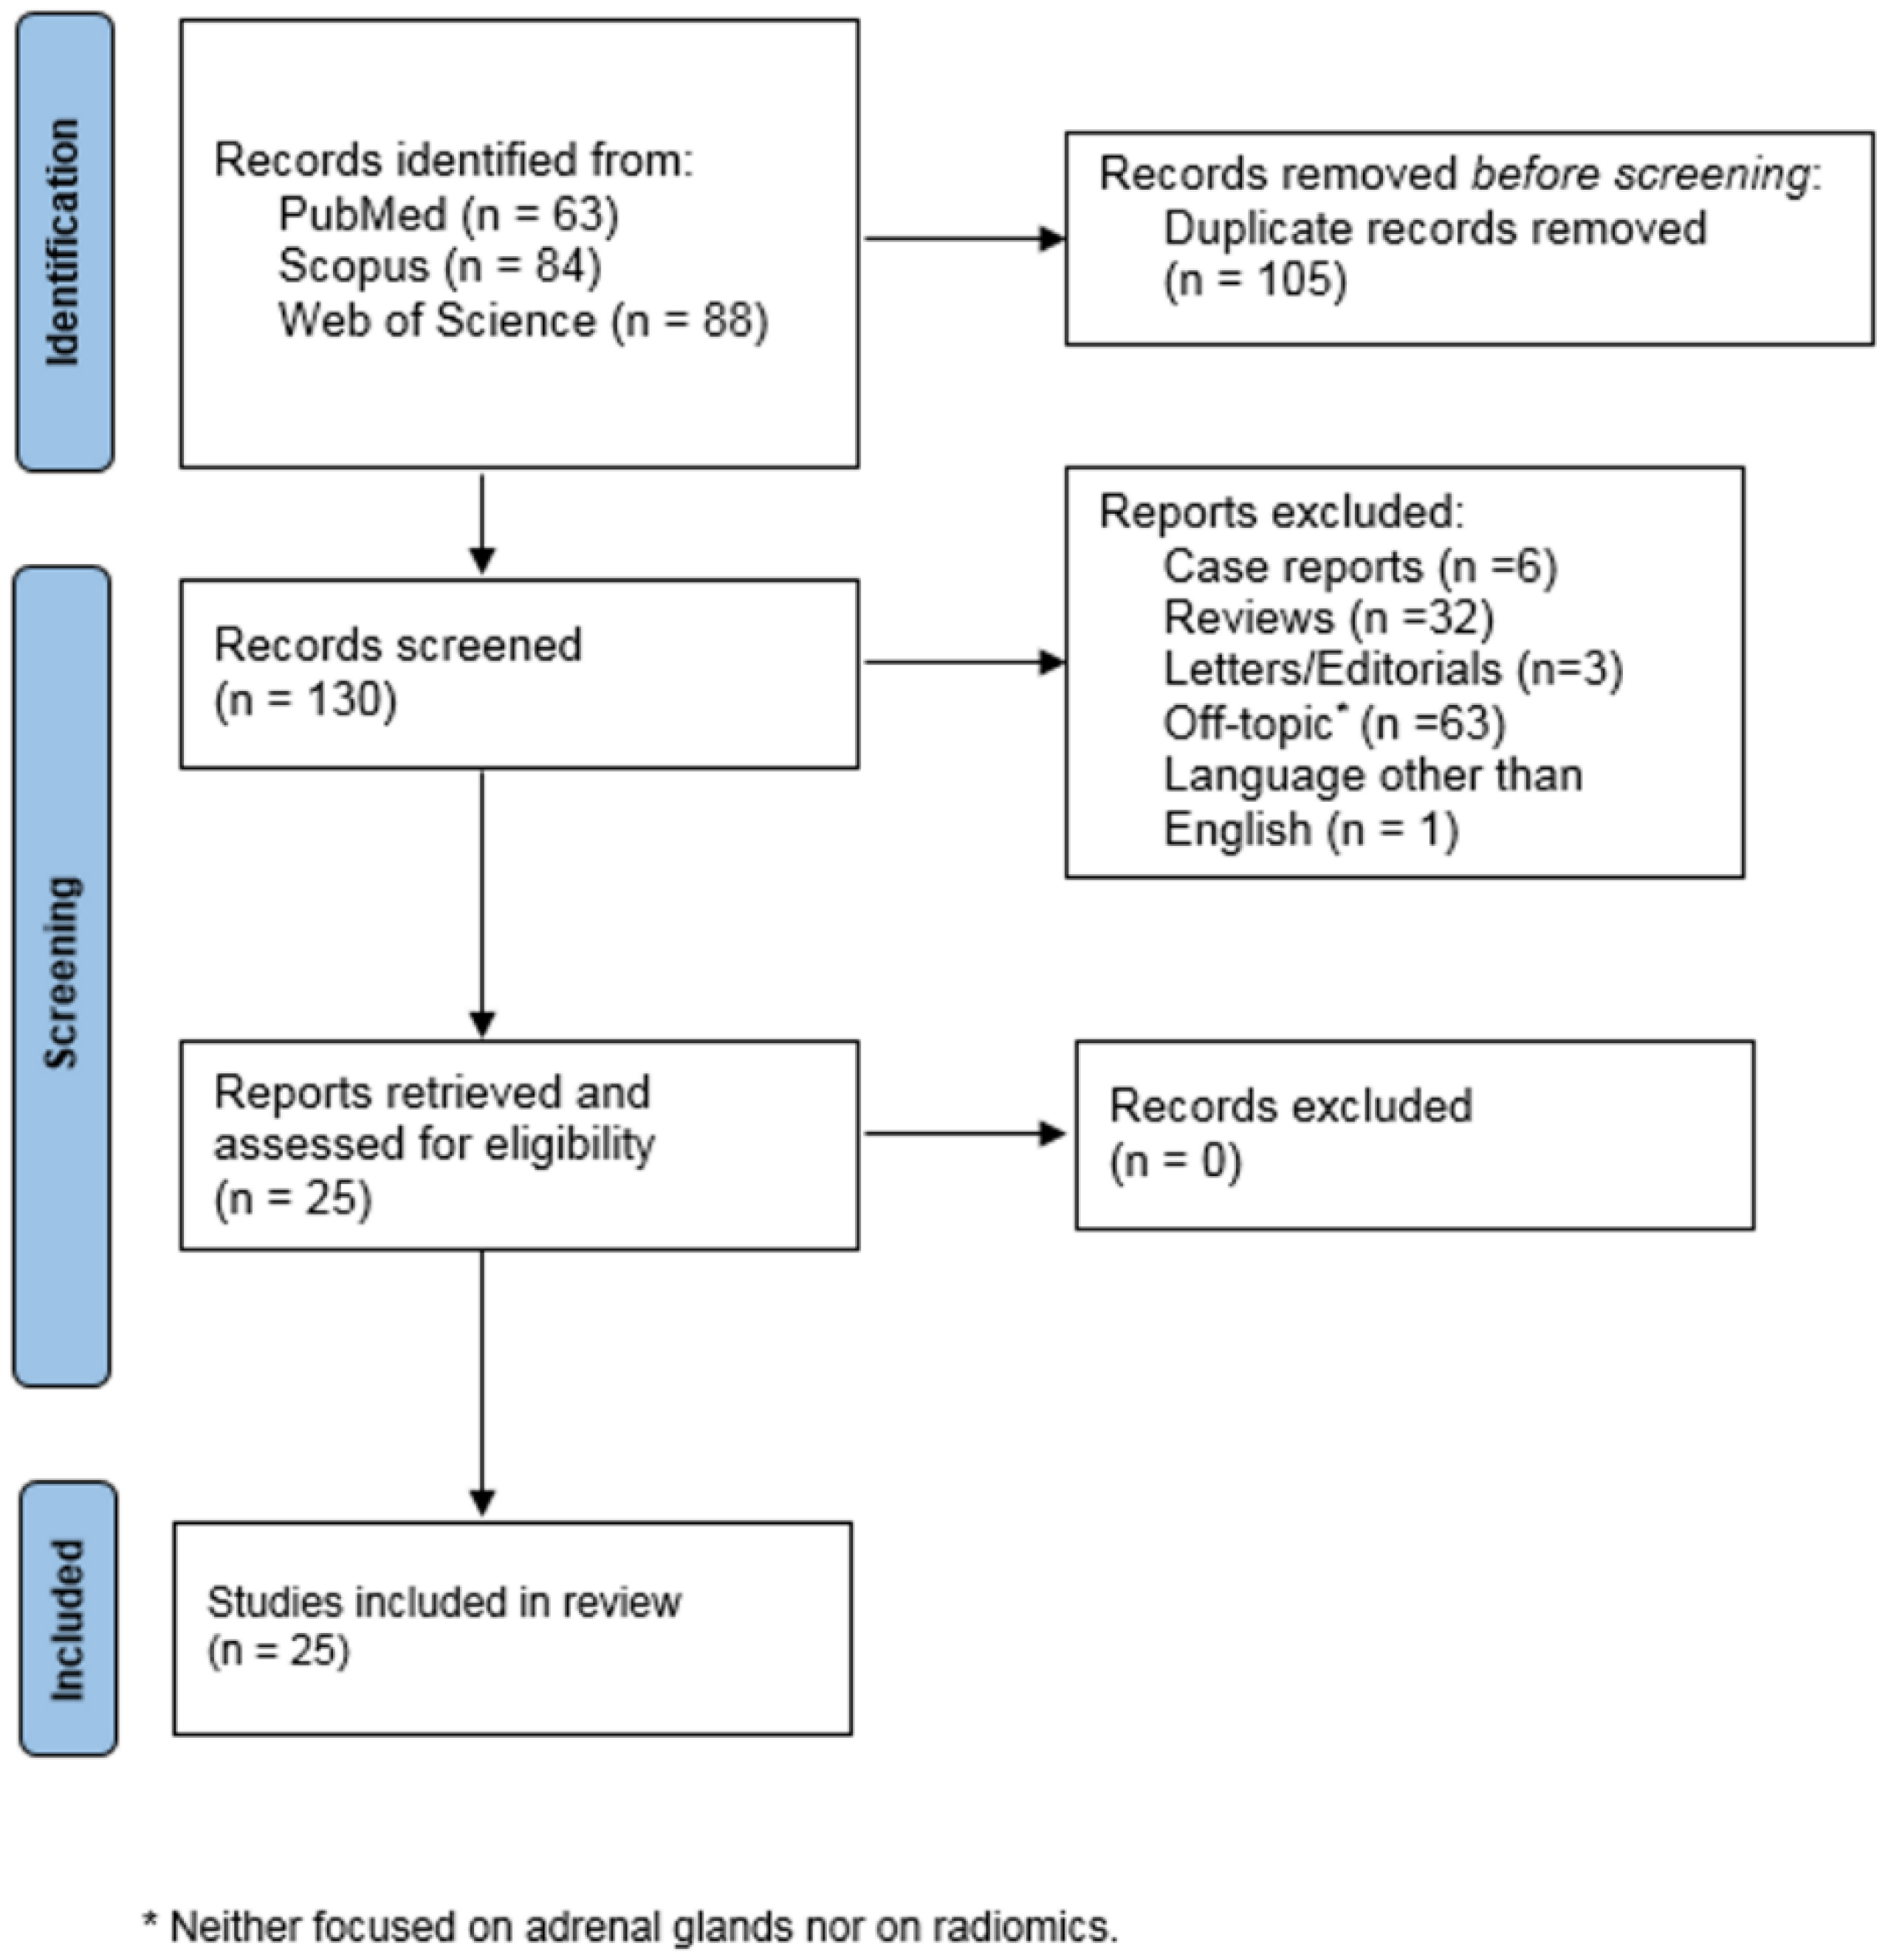
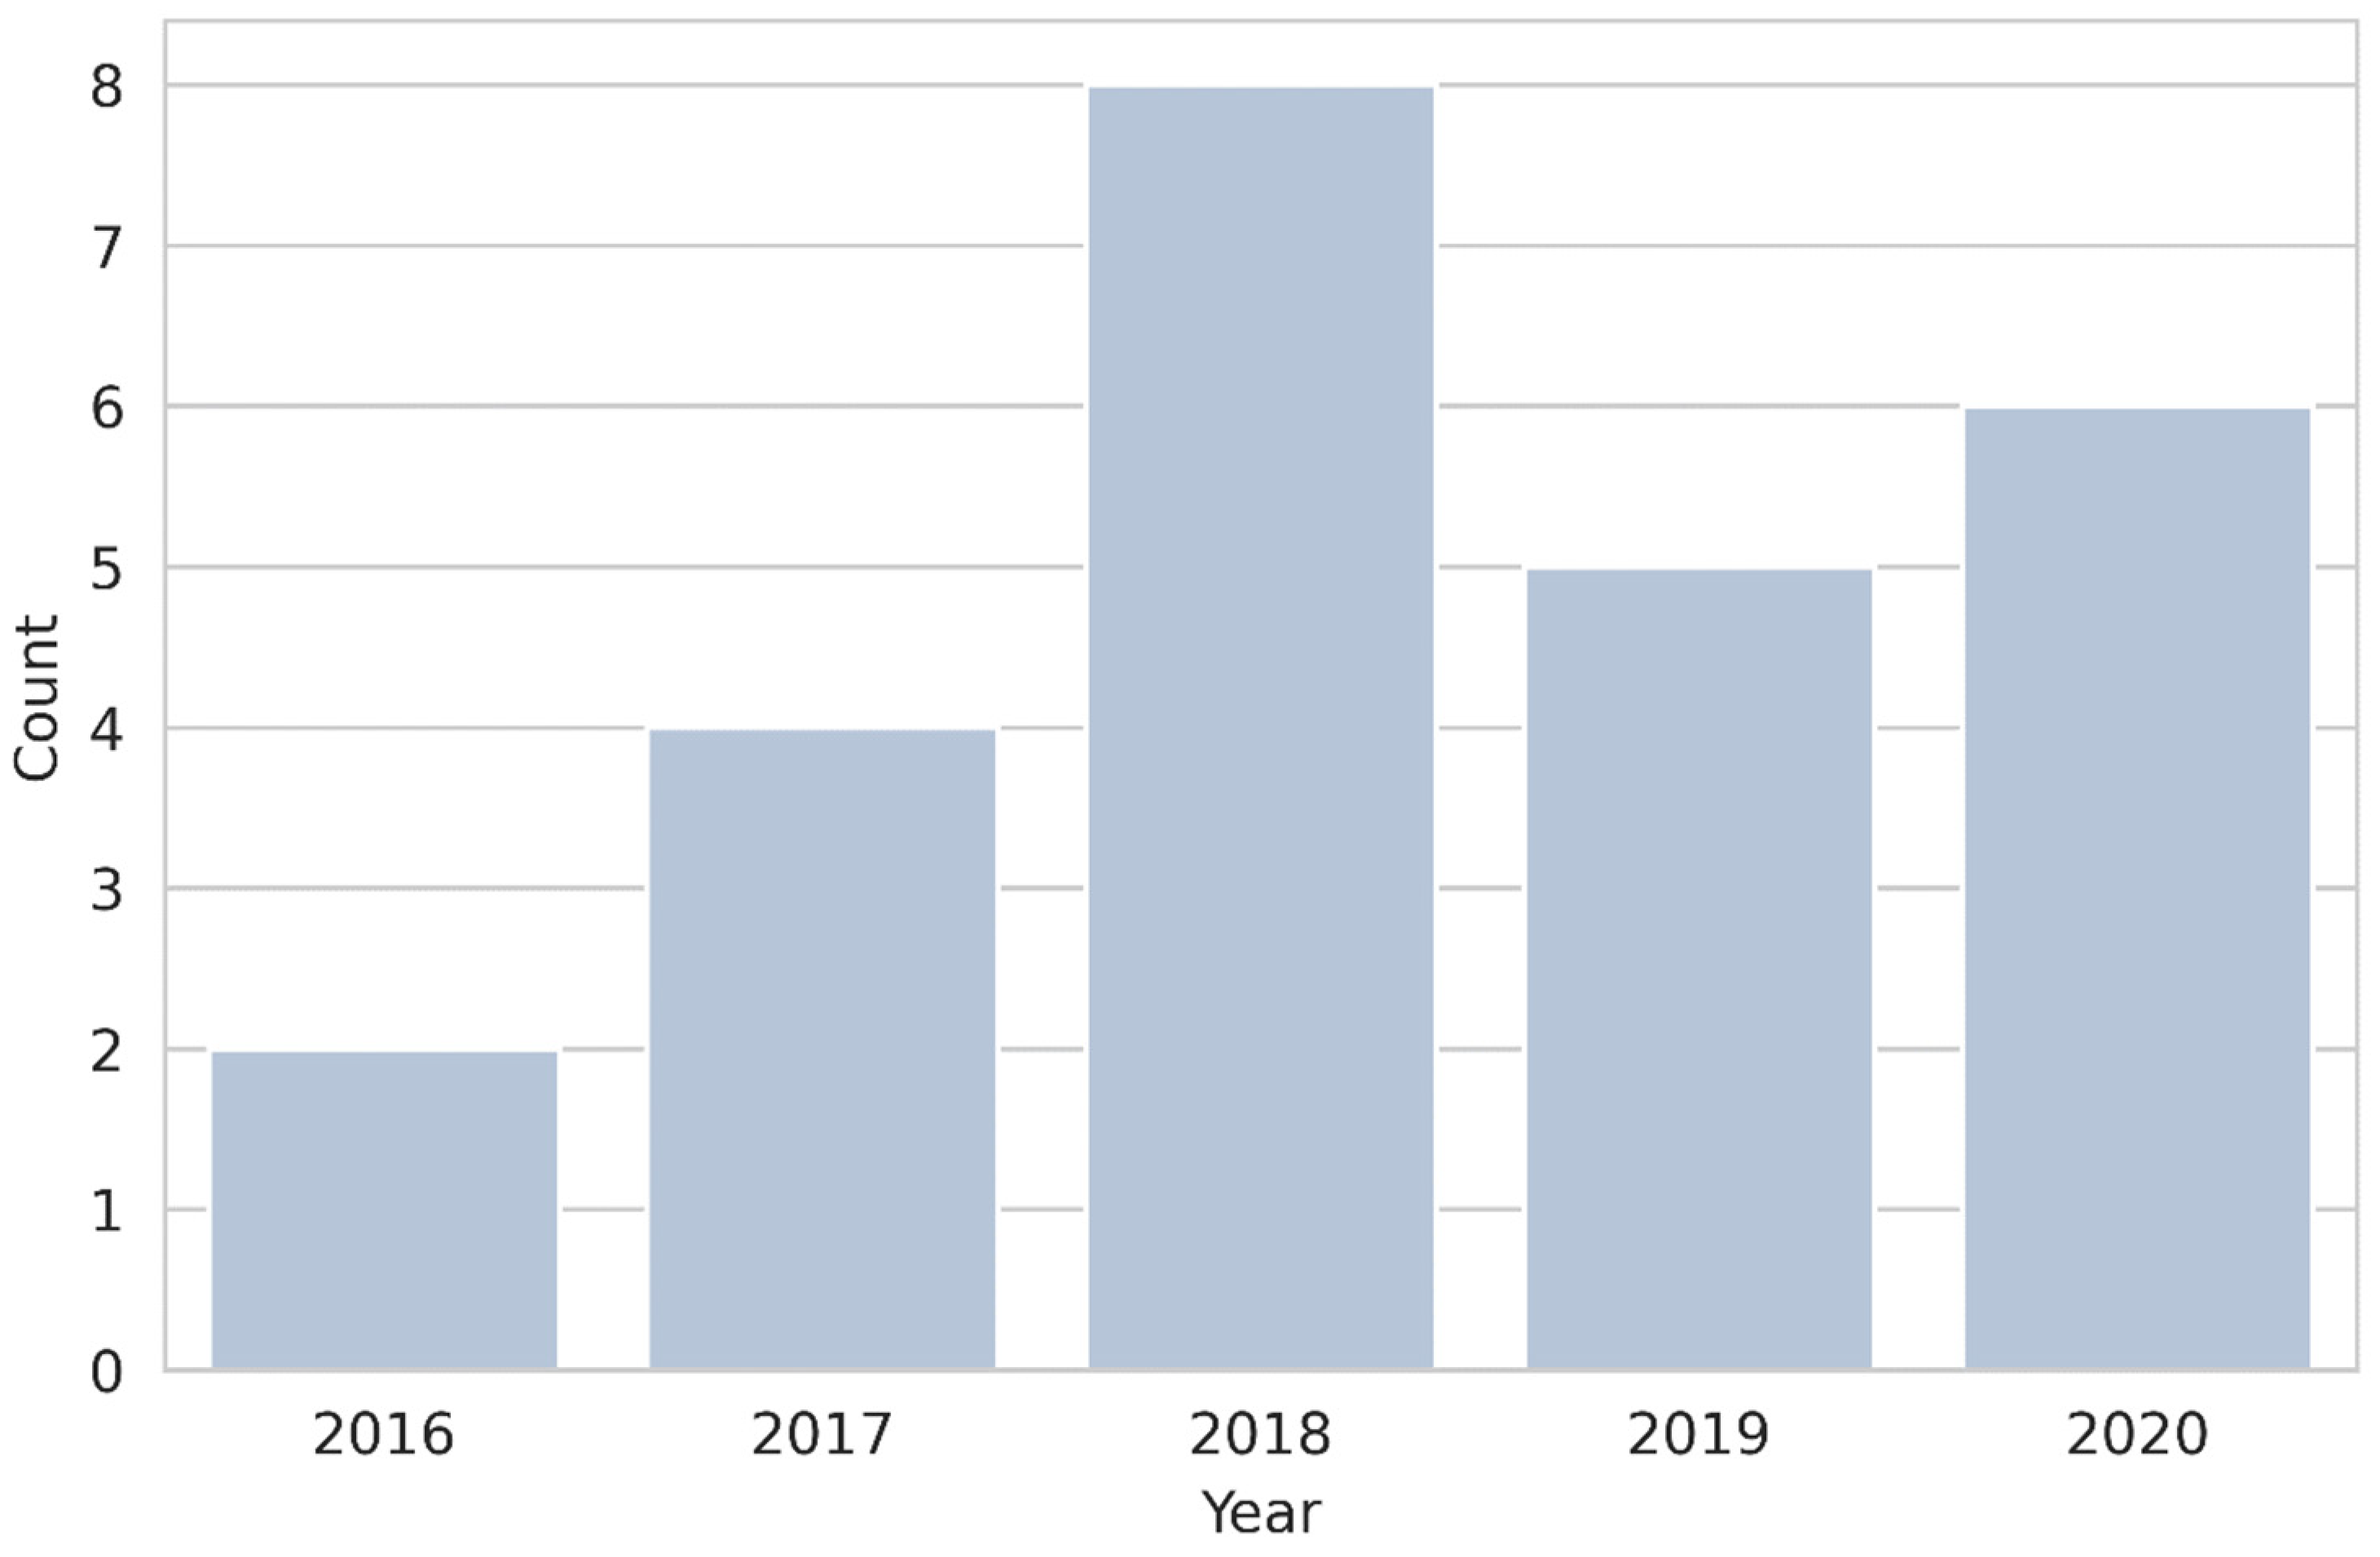
3.1. Literature Search
3.2. Qualitative Synthesis of Included Studies
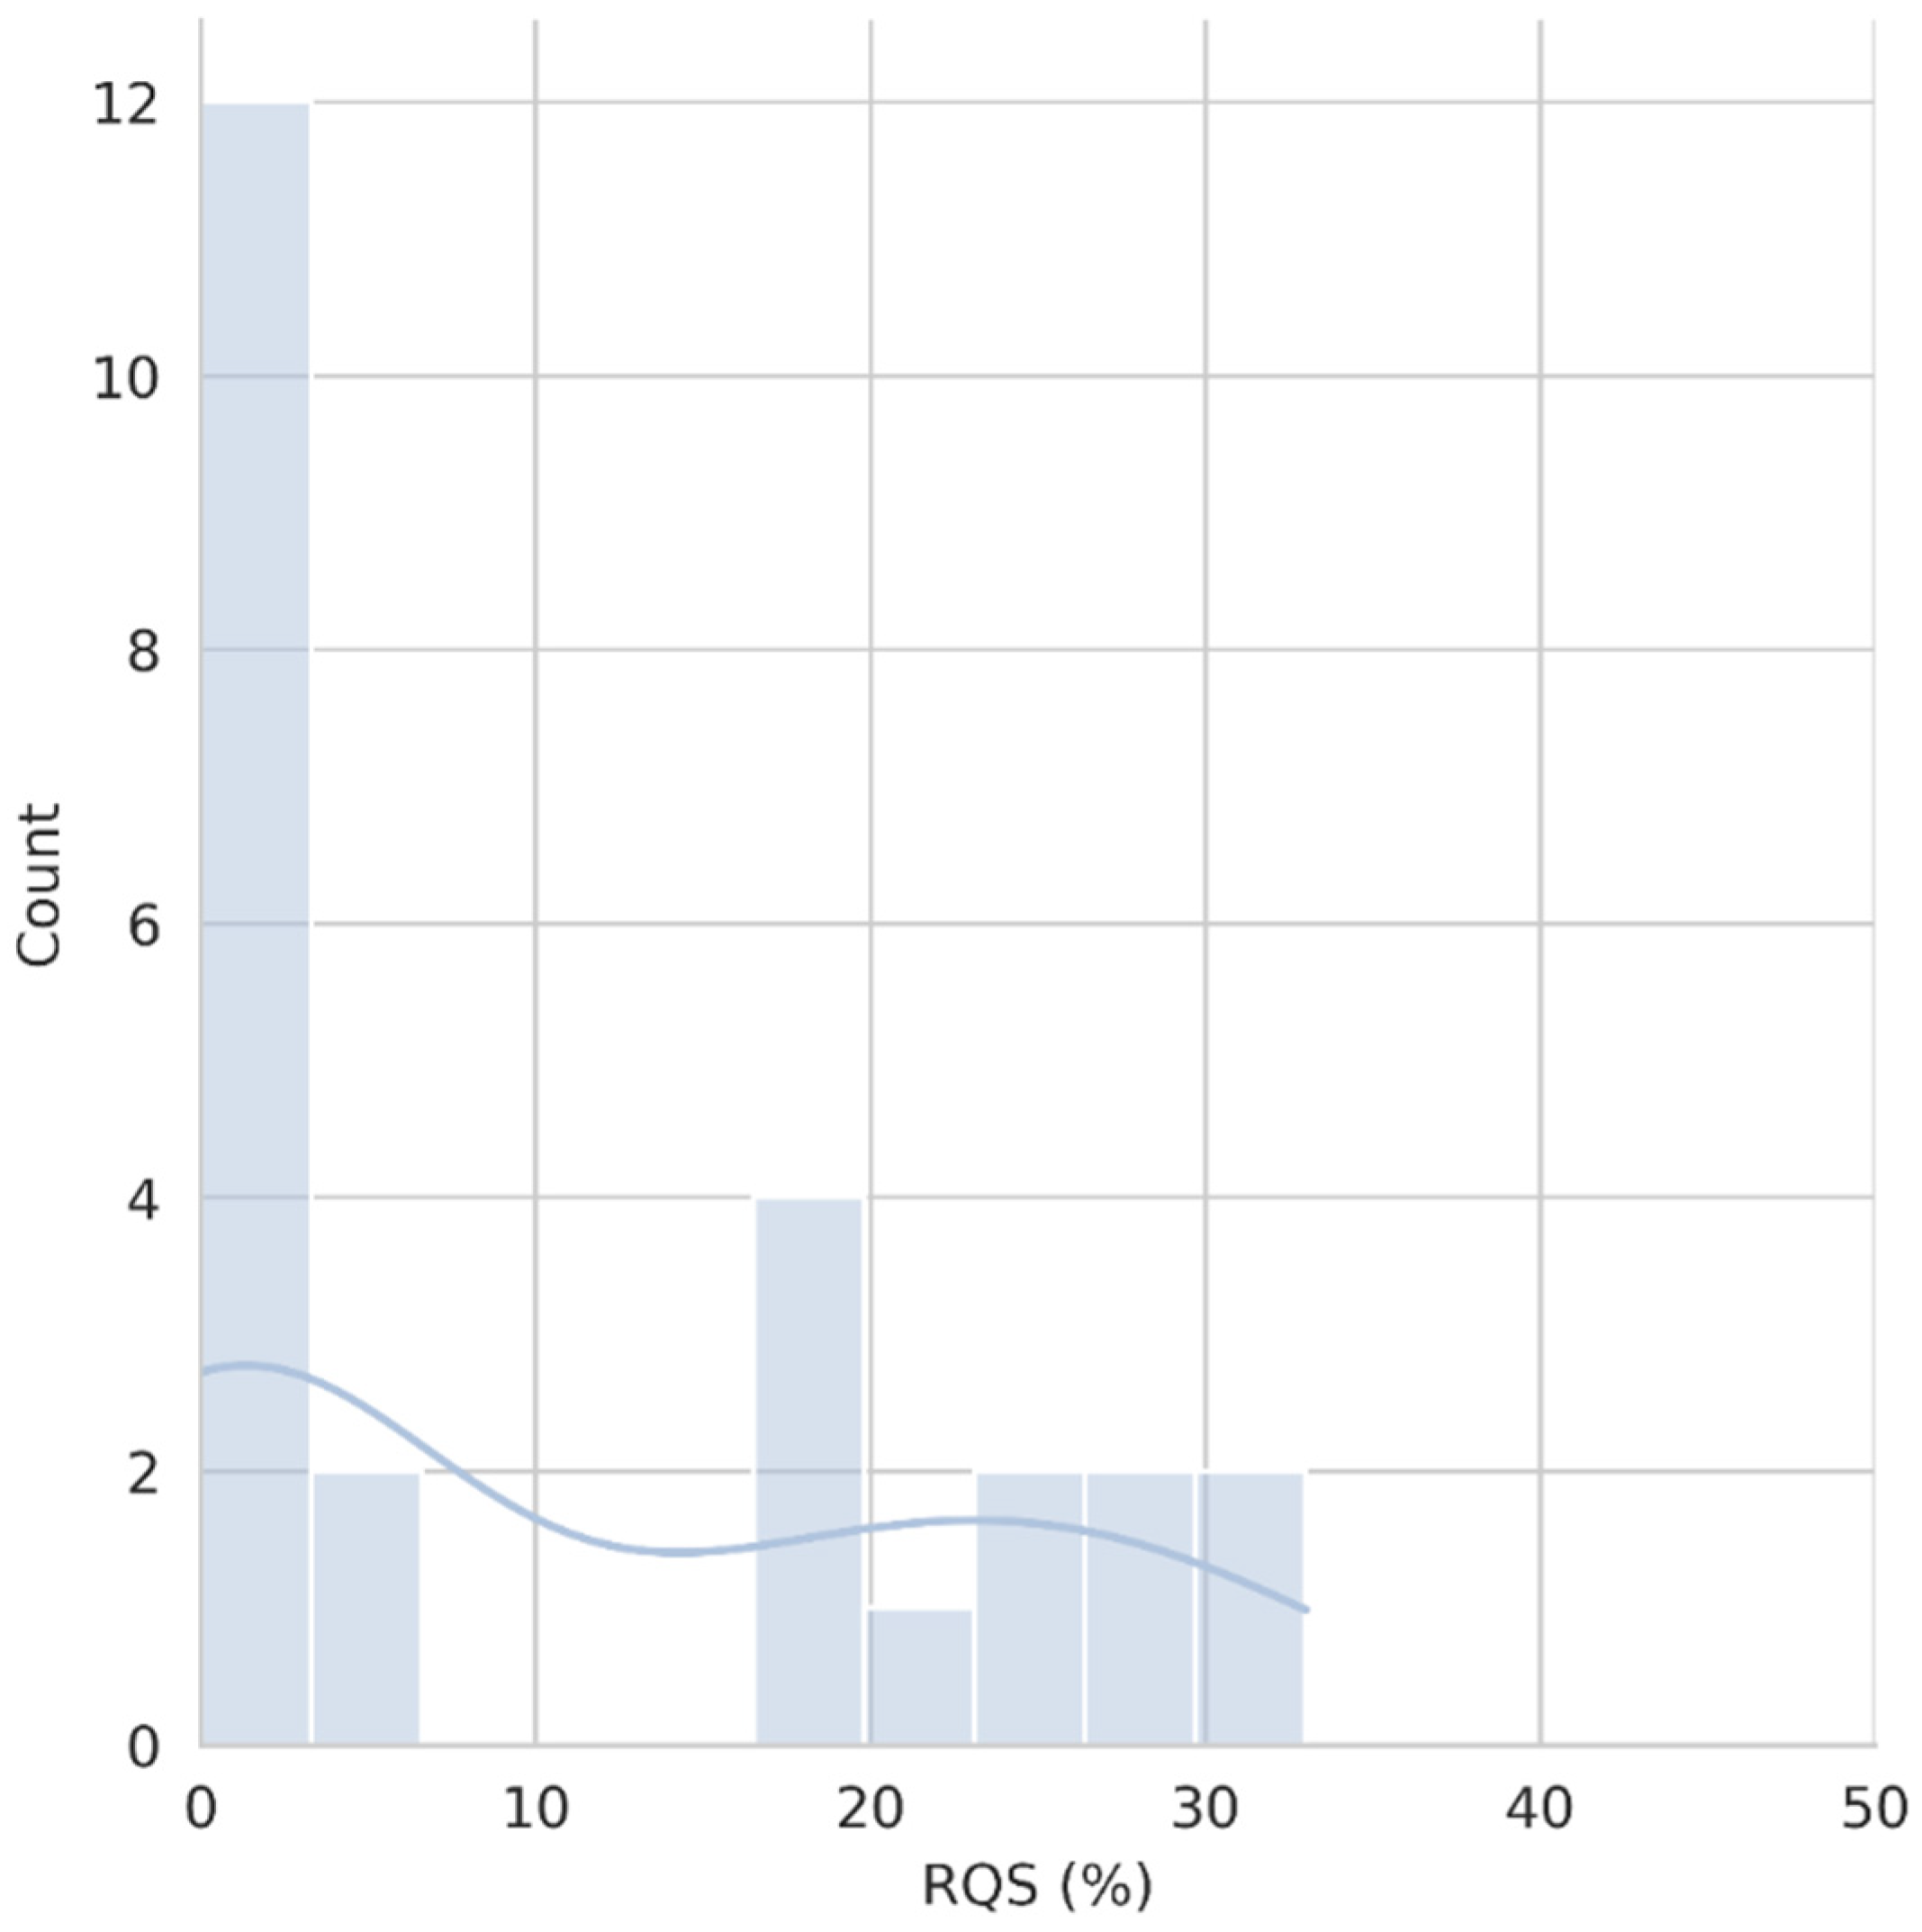
3.3. RQS Assessment
4. Discussion
Supplementary Materials
Author Contributions
Funding
Institutional Review Board Statement
Informed Consent Statement
Data Availability Statement
Conflicts of Interest
References
- Udare, A.; Agarwal, M.; Siegelman, E.; Schieda, N. CT and MR imaging of acute adrenal disorders. Abdom. Radiol. 2021, 46, 290–302. [Google Scholar] [CrossRef] [PubMed]
- Karaosmanoglu, A.D.; Onder, O.; Leblebici, C.B.; Sokmensuer, C.; Akata, D.; Ozmen, M.N.; Karcaaltincaba, M. Cross-sectional imaging features of unusual adrenal lesions: A radiopathological correlation. Abdom. Radiol. 2021, 46, 3974–3994. [Google Scholar] [CrossRef] [PubMed]
- Alshahrani, M.A.; Bin Saeedan, M.; Alkhunaizan, T.; Aljohani, I.M.; Azzumeea, F.M. Bilateral adrenal abnormalities: Imaging review of different entities. Abdom. Radiol. 2019, 44, 154–179. [Google Scholar] [CrossRef] [PubMed]
- Glazer, D.I.; Mayo-Smith, W.W. Management of incidental adrenal masses: An update. Abdom. Radiol. 2020, 45, 892–900. [Google Scholar] [CrossRef] [PubMed]
- Elsayes, K.M.; Elmohr, M.M.; Javadi, S.; Menias, C.O.; Remer, E.M.; Morani, A.C.; Shaaban, A.M. Mimics, pitfalls, and misdiagnoses of adrenal masses on CT and MRI. Abdom. Radiol. 2020, 45, 982–1000. [Google Scholar] [CrossRef]
- Albano, D.; Agnello, F.; Midiri, F.; Pecoraro, G.; Bruno, A.; Alongi, P.; Toia, P.; Di Buono, G.; Agrusa, A.; Sconfienza, L.M.; et al. Imaging features of adrenal masses. Insights Imaging 2019, 10, 1. [Google Scholar] [CrossRef] [Green Version]
- Hanafy, A.K.; Mujtaba, B.; Roman-Colon, A.M.; Elsayes, K.M.; Harrison, D.; Ramani, N.S.; Waguespack, S.G.; Morani, A.C. Imaging features of adrenal gland masses in the pediatric population. Abdom. Radiol. 2020, 45, 964–981. [Google Scholar] [CrossRef]
- Elbanan, M.G.; Javadi, S.; Ganeshan, D.; Habra, M.A.; Rao Korivi, B.; Faria, S.C.; Elsayes, K.M. Adrenal cortical adenoma: Current update, imaging features, atypical findings, and mimics. Abdom. Radiol. 2020, 45, 905–916. [Google Scholar] [CrossRef]
- Romeo, V.; Maurea, S.; Guarino, S.; Mainenti, P.P.; Liuzzi, R.; Petretta, M.; Cozzolino, I.; Klain, M.; Brunetti, A. The role of dynamic post-contrast T1-w MRI sequence to characterize lipid-rich and lipid-poor adrenal adenomas in comparison to non-adenoma lesions: Preliminary results. Abdom. Radiol. 2018, 43, 2119–2129. [Google Scholar] [CrossRef]
- Gillies, R.J.; Kinahan, P.E.; Hricak, H. Radiomics: Images Are More than Pictures, They Are Data. Radiology 2016, 278, 563–577. [Google Scholar] [CrossRef] [Green Version]
- Rizzo, S.; Botta, F.; Raimondi, S.; Origgi, D.; Fanciullo, C.; Morganti, A.G.; Bellomi, M. Radiomics: The facts and the challenges of image analysis. Eur. Radiol. Exp. 2018, 2, 36. [Google Scholar] [CrossRef] [PubMed]
- Cuocolo, R.; Caruso, M.; Perillo, T.; Ugga, L.; Petretta, M. Machine Learning in oncology: A clinical appraisal. Cancer Lett. 2020, 481, 55–62. [Google Scholar] [CrossRef] [PubMed]
- Stanzione, A.; Cuocolo, R.; Verde, F.; Galatola, R.; Romeo, V.; Mainenti, P.P.; Aprea, G.; Guadagno, E.; Del Basso De Caro, M.; Maurea, S. Handcrafted MRI radiomics and machine learning: Classification of indeterminate solid adrenal lesions. Magn. Reson. Imaging 2021, 79, 52–58. [Google Scholar] [CrossRef] [PubMed]
- Van Timmeren, J.E.; Cester, D.; Tanadini-Lang, S.; Alkadhi, H.; Baessler, B. Radiomics in medical imaging—“How-to” guide and critical reflection. Insights Imaging 2020, 11, 91. [Google Scholar] [CrossRef] [PubMed]
- Park, J.E.; Kim, D.; Kim, H.S.; Park, S.Y.; Kim, J.Y.; Cho, S.J.; Shin, J.H.; Kim, J.H. Quality of science and reporting of radiomics in oncologic studies: Room for improvement according to radiomics quality score and TRIPOD statement. Eur. Radiol. 2020, 30, 523–536. [Google Scholar] [CrossRef] [PubMed]
- Spadarella, G.; Calareso, G.; Garanzini, E.; Ugga, L.; Cuocolo, A.; Cuocolo, R. MRI based radiomics in nasopharyngeal cancer: Systematic review and perspectives using radiomic quality score (RQS) assessment. Eur. J. Radiol. 2021, 140, 109744. [Google Scholar] [CrossRef]
- Ugga, L.; Perillo, T.; Cuocolo, R.; Stanzione, A.; Romeo, V.; Green, R.; Cantoni, V.; Brunetti, A. Meningioma MRI radiomics and machine learning: Systematic review, quality score assessment, and meta-analysis. Neuroradiology 2021, 63, 1293–1304. [Google Scholar] [CrossRef]
- Lambin, P.; Leijenaar, R.T.H.; Deist, T.M.; Peerlings, J.; de Jong, E.E.C.; van Timmeren, J.; Sanduleanu, S.; Larue, R.T.H.M.; Even, A.J.G.; Jochems, A.; et al. Radiomics: The bridge between medical imaging and personalized medicine. Nat. Rev. Clin. Oncol. 2017, 14, 749–762. [Google Scholar] [CrossRef]
- Moher, D.; Liberati, A.; Tetzlaff, J.; Altman, D.G. Preferred reporting items for systematic reviews and meta-analyses: The PRISMA statement. BMJ 2009, 339, b2535. [Google Scholar] [CrossRef] [Green Version]
- Akai, H.; Yasaka, K.; Kunimatsu, A.; Ohtomo, K.; Abe, O.; Kiryu, S. Application of CT texture analysis to assess the localization of primary aldosteronism. Sci. Rep. 2020, 10, 472. [Google Scholar] [CrossRef] [Green Version]
- Ahmed, A.A.; Elmohr, M.M.; Fuentes, D.; Habra, M.A.; Fisher, S.B.; Perrier, N.D.; Zhang, M.; Elsayes, K.M. Radiomic mapping model for prediction of Ki-67 expression in adrenocortical carcinoma. Clin. Radiol. 2020, 75, 479.e17–479.e22. [Google Scholar] [CrossRef] [PubMed]
- Ansquer, C.; Drui, D.; Mirallié, E.; Renaudin-Autain, K.; Denis, A.; Gimenez-Roqueplo, A.-P.; Leux, C.; Toulgoat, F.; Kraeber-Bodéré, F.; Carlier, T. Usefulness of FDG-PET/CT-Based Radiomics for the Characterization and Genetic Orientation of Pheochromocytomas Before Surgery. Cancers 2020, 12, 2424. [Google Scholar] [CrossRef] [PubMed]
- Chen, N.; Ng, C.; Hobbs, B.P. Bayesian classifiers of solid lesions with dynamic CT: Integrating enhancement density with washout density and delay interval. In Proceedings of the 2018 IEEE 15th International Symposium on Biomedical Imaging (ISBI 2018), Washington, DC, USA, 4–7 April 2018; IEEE: Piscataway, NJ, USA, 2018; pp. 236–239. [Google Scholar]
- Daye, D.; Staziaki, P.V.; Furtado, V.F.; Tabari, A.; Fintelmann, F.J.; Frenk, N.E.; Shyn, P.; Tuncali, K.; Silverman, S.; Arellano, R.; et al. CT Texture Analysis and Machine Learning Improve Post-ablation Prognostication in Patients with Adrenal Metastases: A Proof of Concept. Cardiovasc. Interv. Radiol. 2019, 42, 1771–1776. [Google Scholar] [CrossRef] [PubMed]
- Elmohr, M.M.; Fuentes, D.; Habra, M.A.; Bhosale, P.R.; Qayyum, A.A.; Gates, E.; Morshid, A.I.; Hazle, J.D.; Elsayes, K.M. Machine learning-based texture analysis for differentiation of large adrenal cortical tumours on CT. Clin. Radiol. 2019, 74, 818.e1–818.e7. [Google Scholar] [CrossRef] [PubMed]
- Ho, L.M.; Samei, E.; Mazurowski, M.A.; Zheng, Y.; Allen, B.C.; Nelson, R.C.; Marin, D. Can Texture Analysis Be Used to Distinguish Benign From Malignant Adrenal Nodules on Unenhanced CT, Contrast-Enhanced CT, or In-Phase and Opposed-Phase MRI? Am. J. Roentgenol. 2019, 212, 554–561. [Google Scholar] [CrossRef] [PubMed]
- Koyuncu, H.; Ceylan, R.; Asoglu, S.; Cebeci, H.; Koplay, M. An extensive study for binary characterisation of adrenal tumours. Med. Biol. Eng. Comput. 2019, 57, 849–862. [Google Scholar] [CrossRef] [PubMed]
- Li, X.; Guindani, M.; Ng, C.S.; Hobbs, B.P. Classification of adrenal lesions through spatial Bayesian modeling of GLCM. In Proceedings of the 2017 IEEE 14th International Symposium on Biomedical Imaging (ISBI 2017), Melbourne, Australia, 18–21 April 2017; IEEE: Piscataway, NJ, USA, 2017; pp. 147–151. [Google Scholar]
- Li, X.; Guindani, M.; Ng, C.S.; Hobbs, B.P. Spatial Bayesian modeling of GLCM with application to malignant lesion characterization. J. Appl. Stat. 2019, 46, 230–246. [Google Scholar] [CrossRef]
- Li, X.; Guindani, M.; Ng, C.S.; Hobbs, B.P. A Bayesian nonparametric model for textural pattern heterogeneity. J. R. Stat. Soc. Ser. C Appl. Stat. 2021, 70, 459–480. [Google Scholar] [CrossRef]
- Liu, J.; Xue, K.; Li, S.; Zhang, Y.; Cheng, J. Combined Diagnosis of Whole-Lesion Histogram Analysis of T1- and T2-Weighted Imaging for Differentiating Adrenal Adenoma and Pheochromocytoma: A Support Vector Machine-Based Study. Can. Assoc. Radiol. J. 2021, 72, 452–459. [Google Scholar] [CrossRef] [Green Version]
- Nakajo, M.; Jinguji, M.; Nakajo, M.; Shinaji, T.; Nakabeppu, Y.; Fukukura, Y.; Yoshiura, T. Texture analysis of FDG PET/CT for differentiating between FDG-avid benign and metastatic adrenal tumors: Efficacy of combining SUV and texture parameters. Abdom. Radiol. 2017, 42, 2882–2889. [Google Scholar] [CrossRef]
- Romeo, V.; Maurea, S.; Cuocolo, R.; Petretta, M.; Mainenti, P.P.; Verde, F.; Coppola, M.; Dell’Aversana, S.; Brunetti, A. Characterization of Adrenal Lesions on Unenhanced MRI Using Texture Analysis: A Machine-Learning Approach. J. Magn. Reson. Imaging 2018, 48, 198–204. [Google Scholar] [CrossRef] [PubMed]
- Shi, B.; Zhang, G.-M.-Y.; Xu, M.; Jin, Z.-Y.; Sun, H. Distinguishing metastases from benign adrenal masses: What can CT texture analysis do? Acta Radiol. 2019, 60, 1553–1561. [Google Scholar] [CrossRef] [PubMed]
- Schieda, N.; Krishna, S.; McInnes, M.D.F.; Moosavi, B.; Alrashed, A.; Moreland, R.; Siegelman, E.S. Utility of MRI to Differentiate Clear Cell Renal Cell Carcinoma Adrenal Metastases From Adrenal Adenomas. Am. J. Roentgenol. 2017, 209, W152–W159. [Google Scholar] [CrossRef] [PubMed]
- Shoemaker, K.; Hobbs, B.P.; Bharath, K.; Ng, C.S.; Baladandayuthapani, V. Tree-based Methods for Characterizing Tumor Density Heterogeneity. Pac. Symp. Biocomput. 2018, 23, 216–227. [Google Scholar]
- Tu, W.; Verma, R.; Krishna, S.; McInnes, M.D.F.; Flood, T.A.; Schieda, N. Can Adrenal Adenomas Be Differentiated From Adrenal Metastases at Single-Phase Contrast-Enhanced CT? Am. J. Roentgenol. 2018, 211, 1044–1050. [Google Scholar] [CrossRef]
- Umanodan, T.; Fukukura, Y.; Kumagae, Y.; Shindo, T.; Nakajo, M.; Takumi, K.; Nakajo, M.; Hakamada, H.; Umanodan, A.; Yoshiura, T. ADC histogram analysis for adrenal tumor histogram analysis of apparent diffusion coefficient in differentiating adrenal adenoma from pheochromocytoma. J. Magn. Reson. Imaging 2017, 45, 1195–1203. [Google Scholar] [CrossRef]
- Wang, M.; Xu, H.; Xiao, L.; Song, W.; Zhu, S.; Ma, X. Prognostic Value of Functional Parameters of 18 F-FDG-PET Images in Patients with Primary Renal/Adrenal Lymphoma. Contrast Media Mol. Imaging 2019, 2019, 2641627. [Google Scholar] [CrossRef] [Green Version]
- Werner, R.A.; Kroiss, M.; Nakajo, M.; Mügge, D.O.; Hahner, S.; Fassnacht, M.; Schirbel, A.; Bluemel, C.; Higuchi, T.; Papp, L.; et al. Assessment of tumor heterogeneity in treatment-naïve adrenocortical cancer patients using 18F-FDG positron emission tomography. Endocrine 2016, 53, 791–800. [Google Scholar] [CrossRef]
- Yi, X.; Guan, X.; Chen, C.; Zhang, Y.; Zhang, Z.; Li, M.; Liu, P.; Yu, A.; Long, X.; Liu, L.; et al. Adrenal incidentaloma: Machine learning-based quantitative texture analysis of unenhanced CT can effectively differentiate sPHEO from lipid-poor adrenal adenoma. J. Cancer 2018, 9, 3577–3582. [Google Scholar] [CrossRef] [Green Version]
- Yi, X.; Guan, X.; Zhang, Y.; Liu, L.; Long, X.; Yin, H.; Wang, Z.; Li, X.; Liao, W.; Chen, B.T.; et al. Radiomics improves efficiency for differentiating subclinical pheochromocytoma from lipid-poor adenoma: A predictive, preventive and personalized medical approach in adrenal incidentalomas. EPMA J. 2018, 9, 421–429. [Google Scholar] [CrossRef]
- Yu, H.; Parakh, A.; Blake, M.; McDermott, S. Texture Analysis as a Radiomic Marker for Differentiating Benign From Malignant Adrenal Tumors. J. Comput. Assist. Tomogr. 2020, 44, 766–771. [Google Scholar] [CrossRef] [PubMed]
- Zhang, G.-M.-Y.; Shi, B.; Sun, H.; Jin, Z.-Y.; Xue, H.-D. Differentiating pheochromocytoma from lipid-poor adrenocortical adenoma by CT texture analysis: Feasibility study. Abdom. Radiol. 2017, 42, 2305–2313. [Google Scholar] [CrossRef] [PubMed]
- Sanduleanu, S.; Woodruff, H.C.; de Jong, E.E.C.; van Timmeren, J.E.; Jochems, A.; Dubois, L.; Lambin, P. Tracking tumor biology with radiomics: A systematic review utilizing a radiomics quality score. Radiother. Oncol. 2018, 127, 349–360. [Google Scholar] [CrossRef] [PubMed]
- Vallières, M.; Zwanenburg, A.; Badic, B.; Cheze Le Rest, C.; Visvikis, D.; Hatt, M. Responsible Radiomics Research for Faster Clinical Translation. J. Nucl. Med. 2018, 59, 189–193. [Google Scholar] [CrossRef]
- Zwanenburg, A.; Vallières, M.; Abdalah, M.A.; Aerts, H.J.W.L.; Andrearczyk, V.; Apte, A.; Ashrafinia, S.; Bakas, S.; Beukinga, R.J.; Boellaard, R.; et al. The Image Biomarker Standardization Initiative: Standardized Quantitative Radiomics for High-Throughput Image-based Phenotyping. Radiology 2020, 295, 328–338. [Google Scholar] [CrossRef] [PubMed] [Green Version]
- Shur, J.D.; Doran, S.J.; Kumar, S.; Ap Dafydd, D.; Downey, K.; O’Connor, J.P.B.; Papanikolaou, N.; Messiou, C.; Koh, D.-M.; Orton, M.R. Radiomics in Oncology: A Practical Guide. RadioGraphics 2021, 41, 1717–1732. [Google Scholar] [CrossRef] [PubMed]
- Chetan, M.R.; Gleeson, F.V. Radiomics in predicting treatment response in non-small-cell lung cancer: Current status, challenges and future perspectives. Eur. Radiol. 2021, 31, 1049–1058. [Google Scholar] [CrossRef]
- Wakabayashi, T.; Ouhmich, F.; Gonzalez-Cabrera, C.; Felli, E.; Saviano, A.; Agnus, V.; Savadjiev, P.; Baumert, T.F.; Pessaux, P.; Marescaux, J.; et al. Radiomics in hepatocellular carcinoma: A quantitative review. Hepatol. Int. 2019, 13, 546–559. [Google Scholar] [CrossRef] [Green Version]
- Cuocolo, R.; Stanzione, A.; Castaldo, A.; De Lucia, D.R.; Imbriaco, M. Quality control and whole-gland, zonal and lesion annotations for the PROSTATEx challenge public dataset. Eur. J. Radiol. 2021, 138, 109647. [Google Scholar] [CrossRef]
- Oakden-Rayner, L. Exploring Large-scale Public Medical Image Datasets. Acad. Radiol. 2020, 27, 106–112. [Google Scholar] [CrossRef] [Green Version]
- Abunahel, B.M.; Pontre, B.; Kumar, H.; Petrov, M.S. Pancreas image mining: A systematic review of radiomics. Eur. Radiol. 2021, 31, 3447–3467. [Google Scholar] [CrossRef] [PubMed]
- Stanzione, A.; Gambardella, M.; Cuocolo, R.; Ponsiglione, A.; Romeo, V.; Imbriaco, M. Prostate MRI radiomics: A systematic review and radiomic quality score assessment. Eur. J. Radiol. 2020, 129, 109095. [Google Scholar] [CrossRef] [PubMed]
- Zhong, J.; Hu, Y.; Si, L.; Jia, G.; Xing, Y.; Zhang, H.; Yao, W. A systematic review of radiomics in osteosarcoma: Utilizing radiomics quality score as a tool promoting clinical translation. Eur. Radiol. 2021, 31, 1526–1535. [Google Scholar] [CrossRef] [PubMed]
- Song, J.; Yin, Y.; Wang, H.; Chang, Z.; Liu, Z.; Cui, L. A review of original articles published in the emerging field of radiomics. Eur. J. Radiol. 2020, 127, 108991. [Google Scholar] [CrossRef]
- Scapicchio, C.; Gabelloni, M.; Barucci, A.; Cioni, D.; Saba, L.; Neri, E. A deep look into radiomics. Radiol. Med. 2021, 126, 1296–1311. [Google Scholar] [CrossRef]
- Kocak, B.; Durmaz, E.S.; Ates, E.; Kilickesmez, O. Radiomics with artificial intelligence: A practical guide for beginners. Diagn. Interv. Radiol. 2019, 25, 485–495. [Google Scholar] [CrossRef]
- Chartrand, G.; Cheng, P.M.; Vorontsov, E.; Drozdzal, M.; Turcotte, S.; Pal, C.J.; Kadoury, S.; Tang, A. Deep Learning: A Primer for Radiologists. RadioGraphics 2017, 37, 2113–2131. [Google Scholar] [CrossRef] [Green Version]
- Buvat, I.; Orlhac, F. The Dark Side of Radiomics: On the Paramount Importance of Publishing Negative Results. J. Nucl. Med. 2019, 60, 1543–1544. [Google Scholar] [CrossRef]
- Adams, J.; Hillier-Brown, F.C.; Moore, H.J.; Lake, A.A.; Araujo-Soares, V.; White, M.; Summerbell, C. Searching and synthesising ‘grey literature’ and ‘grey information’ in public health: Critical reflections on three case studies. Syst. Rev. 2016, 5, 164. [Google Scholar] [CrossRef] [Green Version]


| Study ID | Year | Country | Aim | Mean Goal | Study Design | Patient Population (Number of Lesions) | Imaging Modality | Segmentation Method (Software/Algorithm) | Feature Extraction | ML | Features Type |
|---|---|---|---|---|---|---|---|---|---|---|---|
| Akai et al. [20] | 2020 | Japan | Detection | Localization of primary aldosteronism | Retrospective | 82 (82) | Unenhanced CT | Semi-automatic, 2D (TexRAD) | TexRAD; | No | First-order |
| Amhed et al. [21] | 2020 | USA | Characterization | Prediction of Ki-67 expression in ACC | Retrospective | 53 (53) | Contrast-enhanced CT | Manual, 3D (AMIRA) | PyRadiomics | No | Shape-based, first- and higher-order |
| Ansquer et al. [22] | 2020 | France | Characterization | Biological and genetic profiling of pheo | Retrospective | 49 (52) | 2-[18F]FDG PET/CT | Automatic, 3D (STAPLE) | Image Biomarker Standardization Initiative | No | Higher-order |
| Chen et al. [23] | 2018 | USA | DD | Benign vs. malignant | Retrospective | 222 (222) | Unenhanced and contrast-enhanced CT | NR | NR | Yes (Bayesian classifier) | NR |
| Daye et al. [24] | 2019 | USA | Prognosis | Local progression and survival in ablated adrenal metastasis | Retrospective | 21 (21) | Contrast-enhanced CT | Manual, 3D (NR) | MATLAB | Yes (support vector machine) | Higher-order |
| Elmohr et al. [25] | 2019 | USA | DD | Adenoma vs. ACC | Retrospective | 54 (54) | Unenhanced and contrast-enhanced CT | Manual, 3D (AMIRA) | PyRadiomics | Yes (random forest) | Shape-based, first- and higher-order |
| Ho et al. [26] | 2019 | USA | DD | Benign vs. malignant | Retrospective | 20 (23) | Unenhanced and contrast-enhanced CT and MRI 3T or 1,5T T1 IN-OUT | Manual 3D (Seg3D) | Image Biomarker Standardization Initiative | No | First- and higher-order |
| Koyuncu et al. [27] | 2018 | Turkey | DD | Benign vs. malignant | Retrospective | NR (114) * | Unenhanced and contrast-enhanced CT | Semi-automatic, 2D (AbSeg) | MATLAB | Yes (neural network) | First- and higher-order |
| Li et al. [28] | 2017 | USA | DD | Benign vs. malignant | Retrospective | 223 (230) | Unenhanced CT | Manual, 2D (NR) | NR | Yes (Bayesian) | Higher-order |
| Li et al. [29] | 2018 | USA | DD | Benign vs. malignant | Retrospective | 204 (210) | Unenhanced and contrast-enhanced CT | Manual, 2D (NR) | NR | Yes (Bayesian) | Higher-order |
| Li et al. [30] | 2020 | USA | DD | Benign vs. malignant | Retrospective | 204 (210) | Unenhanced and contrast-enhanced CT | Manual, 2D (NR) | NR | Yes (Bayesian) | Higher-order |
| Liu et al. [31] | 2020 | China | DD | Adenoma vs. pheo | Retrospective | 58 (60) | MRI 3T T1 IN-OUT, T2w | Manual, 3D (Mazda) | MaZda | Yes (support vector machine) | First-order |
| Nakajo et al. [32] | 2017 | Japan | DD | Benign vs. malignant | Retrospective | 31 (35) | 2-[18F]FDG PET/CT | Semi-automatic, 3D (Advantage Windows Workstation) | Python # | No | First-order |
| Romeo et al. [33] | 2018 | Italy | DD | Adenoma vs. non-adenoma | Retrospective | 60 (60) | MRI 3T T1 IN-OUT, T2w | Manual, 3D (3D Slicer) | 3D Slicer | Yes (decision tree) | First- and higher-order |
| Shi et al. [34] | 2019 | China | DD | Benign vs. malignant | Retrospective | 225 (265) | Unenhanced and contrast-enhanced CT | Manual, 2D (TexRAD) | TexRAD; | Yes (support vector machine) | First-order |
| Schieda et al. [35] | 2017 | Canada | DD | Adenoma vs. RCC metastasis | Retrospective | 39 (44) | MRI 3T or 1.5T T1 IN-OUT, T2w, GRE T1w pre- and post-contrast | Manual, 2D (Image J) | Image J | No | First-order |
| Shoemaker et al. [36] | 2018 | USA | DD/Characterization | Benign vs. malignant; calcified vs. non calcified; functioning vs. non functioning | Retrospective | 356 (379) | Unenhanced CT | NR | NR | Yes (decision tree) | First- and higher-order |
| Tu et al. [37] | 2018 | Canada | DD | Adenoma vs. lung cancer metastasis | Retrospective | 61 (76) | Contrast-enhanced CT | Manual, 2D (ImageJ) | ImageJ | No | First-order |
| Umanodan et al. [38] | 2016 | Japan | DD | Adenoma vs. pheo | Retrospective | 47 (52) | MRI 3T ADC | Manual, 2D (Synapse Vincent) | Synapse Vincent | No | First-order |
| Wang et al. [39] | 2019 | China | Prognosis | Survival in primary adrenal non-Hodgkin’s lymphoma | Retrospective | 19 (19) § | 2-[18F]FDG PET/CT | Manual, 3D (LifeX package) | LifeX package | No | First- and higher-order |
| Werner et al. [40] | 2016 | Germany | Prognosis | Disease progression and survival in ACC | Retrospective | 10 (10) | 2-[18F]FDG PET/CT | Manual, 3D (Interview Fusion Workstation) | Interview Fusion Workstation | No | First- and higher-order |
| Yi et al. [41] | 2018 | China | DD | Adenoma vs. pheo | Retrospective | 108 (110) | Unenhanced CT | Manual, 2D (MaZda) | MaZda | Yes (logistic regression) | First- and higher-order |
| Yi et al. [42] | 2018 | China | DD | Adenoma vs. pheo | Retrospective | 265 (265) | Unenhanced and contrast-enhanced CT | Manual, 2D (MaZda) | MaZda | No | First- and higher-order |
| Yu et al. [43] | 2020 | USA | DD | Benign vs. malignant | Retrospective | 125 (125) | Contrast-enhanced CT | Manual, 2D (TexRAD) | TexRAD, | No | First-order |
| Zhang et al. [44] | 2017 | China | DD | Adenoma vs. pheo | Retrospective | 155 (164) | Unenhanced and contrast-enhanced CT | Manual, 2D (TexRAD) | TexRAD, | No | First-order |
| Study ID | Item 1 | Item 2 | Item 3 | Item 4 | Item 5 | Item 6 | Item 7 | Item 8 | Item 9 | Item 10 | Item 11 | Item 12 | Item 13 | Item 14 | Item 15 | Item 16 | Total | (%) |
|---|---|---|---|---|---|---|---|---|---|---|---|---|---|---|---|---|---|---|
| Akai et al. [20] | 1 | 0 | 0 | 0 | 3 | 0 | 0 | 1 | 1 | 0 | 0 | −5 | 0 | 0 | 0 | 0 | 1 | 3% |
| Amhed et al. [21] | 1 | 0 | 0 | 0 | −3 | 0 | 0 | 1 | 1 | 0 | 0 | −5 | 0 | 0 | 0 | 0 | −5 | 0 |
| Ansquer et al. [22] | 1 | 1 | 0 | 0 | 3 | 1 | 1 | 1 | 2 | 0 | 0 | 2 | 0 | 0 | 0 | 0 | 12 | 33% |
| Chen et al. [23] | 0 | 0 | 0 | 0 | 3 | 0 | 0 | 0 | 1 | 0 | 0 | 2 | 0 | 0 | 0 | 0 | 6 | 17% |
| Daye et al. [24] | 1 | 0 | 0 | 0 | −3 | 0 | 0 | 0 | 2 | 0 | 0 | 2 | 0 | 0 | 0 | 0 | 2 | 6% |
| Elmohr et al. [25] | 1 | 1 | 0 | 0 | 3 | 0 | 0 | 0 | 2 | 0 | 0 | 2 | 2 | 0 | 0 | 0 | 11 | 31% |
| Ho et al. [26] | 1 | 0 | 0 | 0 | 3 | 0 | 0 | 0 | 1 | 0 | 0 | −5 | 0 | 0 | 0 | 0 | 0 | 0% |
| Koyuncu et al. [27] | 0 | 0 | 0 | 0 | 3 | 0 | 0 | 0 | 1 | 0 | 0 | 2 | 0 | 0 | 0 | 0 | 6 | 17% |
| Li et al. [28] | 0 | 0 | 0 | 0 | 3 | 0 | 0 | 0 | 1 | 0 | 0 | 2 | 0 | 0 | 0 | 0 | 6 | 17% |
| Li et al. [29] | 1 | 0 | 0 | 0 | 3 | 0 | 0 | 0 | 1 | 0 | 0 | 2 | 0 | 0 | 0 | 0 | 7 | 19% |
| Li et al. [30] | 0 | 0 | 0 | 0 | 3 | 0 | 0 | 0 | 1 | 0 | 0 | −5 | 0 | 0 | 0 | 0 | −1 | 0 |
| Liu et al. [31] | 1 | 1 | 0 | 0 | 3 | 0 | 0 | 1 | 1 | 0 | 0 | 2 | 0 | 0 | 0 | 0 | 9 | 25% |
| Nakajo et al. [32] | 1 | 0 | 0 | 0 | −3 | 0 | 0 | 1 | 1 | 0 | 0 | −5 | 0 | 0 | 0 | 0 | −5 | 0 |
| Romeo et al. [33] | 1 | 0 | 0 | 0 | 3 | 0 | 0 | 0 | 2 | 0 | 0 | 2 | 2 | 0 | 0 | 0 | 10 | 28% |
| Shi et al. [34] | 1 | 1 | 0 | 0 | 3 | 0 | 0 | 0 | 2 | 0 | 0 | 2 | 0 | 0 | 0 | 0 | 9 | 25% |
| Schieda et al. [35] | 1 | 0 | 0 | 0 | −3 | 1 | 0 | 0 | 1 | 0 | 0 | −5 | 0 | 0 | 0 | 0 | −5 | 0 |
| Shoemaker et al. [36] | 0 | 0 | 0 | 0 | 3 | 0 | 0 | 0 | 2 | 0 | 0 | 2 | 0 | 0 | 0 | 1 | 8 | 22% |
| Tu et al. [37] | 1 | 0 | 0 | 0 | −3 | 0 | 0 | 1 | 1 | 0 | 0 | −5 | 0 | 0 | 0 | 0 | −5 | 0 |
| Umanodan et al. [38] | 1 | 1 | 0 | 0 | −3 | 0 | 0 | 1 | 1 | 0 | 0 | −5 | 0 | 0 | 0 | 0 | −4 | 0 |
| Wang et al. [39] | 1 | 0 | 0 | 0 | 3 | 1 | 0 | 1 | 1 | 0 | 0 | −5 | 0 | 0 | 0 | 0 | 2 | 6% |
| Werner et al. [40] | 1 | 0 | 0 | 0 | −3 | 1 | 0 | 0 | 1 | 0 | 0 | −5 | 0 | 0 | 0 | 0 | −5 | 0 |
| Yi et al. [41] | 1 | 1 | 0 | 0 | 3 | 0 | 0 | 0 | 1 | 0 | 0 | −5 | 0 | 0 | 0 | 0 | 1 | 3% |
| Yi et al. [42] | 1 | 1 | 0 | 0 | 3 | 0 | 0 | 1 | 1 | 1 | 0 | 2 | 0 | 0 | 0 | 0 | 10 | 28% |
| Yu et al. [43] | 1 | 0 | 0 | 0 | −3 | 0 | 0 | 1 | 1 | 0 | 0 | −5 | 0 | 0 | 0 | 0 | −5 | 0 |
| Zhang et al. [44] | 1 | 0 | 0 | 0 | −3 | 0 | 0 | 1 | 1 | 0 | 0 | −5 | 0 | 0 | 0 | 0 | −5 | 0 |
Publisher’s Note: MDPI stays neutral with regard to jurisdictional claims in published maps and institutional affiliations. |
© 2022 by the authors. Licensee MDPI, Basel, Switzerland. This article is an open access article distributed under the terms and conditions of the Creative Commons Attribution (CC BY) license (https://creativecommons.org/licenses/by/4.0/).
Share and Cite
Stanzione, A.; Galatola, R.; Cuocolo, R.; Romeo, V.; Verde, F.; Mainenti, P.P.; Brunetti, A.; Maurea, S. Radiomics in Cross-Sectional Adrenal Imaging: A Systematic Review and Quality Assessment Study. Diagnostics 2022, 12, 578. https://doi.org/10.3390/diagnostics12030578
Stanzione A, Galatola R, Cuocolo R, Romeo V, Verde F, Mainenti PP, Brunetti A, Maurea S. Radiomics in Cross-Sectional Adrenal Imaging: A Systematic Review and Quality Assessment Study. Diagnostics. 2022; 12(3):578. https://doi.org/10.3390/diagnostics12030578
Chicago/Turabian StyleStanzione, Arnaldo, Roberta Galatola, Renato Cuocolo, Valeria Romeo, Francesco Verde, Pier Paolo Mainenti, Arturo Brunetti, and Simone Maurea. 2022. "Radiomics in Cross-Sectional Adrenal Imaging: A Systematic Review and Quality Assessment Study" Diagnostics 12, no. 3: 578. https://doi.org/10.3390/diagnostics12030578