Article

An Explainable Machine Learning Pipeline for Stroke Prediction on Imbalanced Data

by
Christos Kokkotis
1,
Georgios Giarmatzis
1,
Erasmia Giannakou
1,
Serafeim Moustakidis
2,
Themistoklis Tsatalas
3,
Dimitrios Tsiptsios
4,
Konstantinos Vadikolias
4 and
Nikolaos Aggelousis
1,*
1
Department of Physical Education and Sport Science, Democritus University of Thrace, 69100 Komotini, Greece
2
AIDEAS OÜ, Narva mnt 5, 10117 Tallinn, Estonia
3
Department of Physical Education and Sport Science, University of Thessaly, 38221 Trikala, Greece
4
Department of Neurology, School of Medicine, University Hospital of Alexandroupolis, Democritus University of Thrace, 68100 Alexandroupolis, Greece
*
Author to whom correspondence should be addressed.
Diagnostics 2022, 12(10), 2392; https://doi.org/10.3390/diagnostics12102392
Submission received: 2 August 2022 / Revised: 26 September 2022 / Accepted: 27 September 2022 / Published: 1 October 2022

Abstract

:
Stroke is an acute neurological dysfunction attributed to a focal injury of the central nervous system due to reduced blood flow to the brain. Nowadays, stroke is a global threat associated with premature death and huge economic consequences. Hence, there is an urgency to model the effect of several risk factors on stroke occurrence, and artificial intelligence (AI) seems to be the appropriate tool. In the present study, we aimed to (i) develop reliable machine learning (ML) prediction models for stroke disease; (ii) cope with a typical severe class imbalance problem, which is posed due to the stroke patients’ class being significantly smaller than the healthy class; and (iii) interpret the model output for understanding the decision-making mechanism. The effectiveness of the proposed ML approach was investigated in a comparative analysis with six well-known classifiers with respect to metrics that are related to both generalization capability and prediction accuracy. The best overall false-negative rate was achieved by the Multi-Layer Perceptron (MLP) classifier (18.60%). Shapley Additive Explanations (SHAP) were employed to investigate the impact of the risk factors on the prediction output. The proposed AI method could lead to the creation of advanced and effective risk stratification strategies for each stroke patient, which would allow for timely diagnosis and the right treatments.

1. Introduction

One of the most common causes of early death, stroke can be organized into two main categories: (i) ischemic stroke and (ii) hemorrhagic stroke [1]. In general, fatalities in stroke patients are observed in up to 23% of cases [2]. Despite the fact that stroke is highly correlated with age, stroke mortality rates for men and women are comparable below the age of 45 years, in contrast with the higher risk of stroke for men between 45 and 74 years [3]. In a recent study, Khan et al. found that COVID-19 infection in children is a new risk factor that could lead to the occurrence of an ischemic stroke [4]. Furthermore, stroke is the second largest cause of secondary disabilities, including impaired speech, cognitive problems, and loss of mobility [5]. These kinds of disabilities lead to reduced quality of life. In particular, the human functions that are most affected by stroke are those related to motor skills. The recovery phase lasts more than 6 months, and it should be stressed out that only a small percentage of survivors (up to 20%) will achieve full functionality of the affected upper limbs and 83% of them will be able to walk again [6]. From a different perspective, Strilciuc et al. also found that the economic burden of stroke is significant [7]. Specifically, in Europe, the cost of productivity loss following stroke amounted to EUR 12 billion and the cost of health care was estimated at EUR 27 billion for 2017.
Stroke affects both men and women, reducing their quality of life and burdening the public health system. Due to the high impact on society, the scientific community emphasizes the development of models for predicting strokes with the aim of preventing them. In this regard, AI plays a key role since its use is now widespread in the prevention of various diseases [8,9,10]. According to a recent literature review, several studies have been carried out to develop models for diagnosing stroke [11,12,13] or predicting treatment responses and patient outcomes, with the ultimate objective of forming personalized rehabilitation protocols [14,15,16]. Arslan et al. proposed a data mining approach for ischemic stroke prediction which is based on 80 subjects with ischemic stroke and 112 healthy subjects [17]. The best performance (97.89% accuracy and 97.83% AUC) was achieved by the Support Vector Machine (SVM) classifier, and an analysis of feature importance was also conducted to identify risk factors that are mainly associated with ischemic stroke.
In another study, Liu et al. worked on imbalanced data and proposed a hybrid ML approach for the prediction of cerebral stroke [18]. They used physiological data (783 stroke patients from a dataset of 43.400 subjects) to train a deep neural network (DNN) optimized via an automated hyperparameter tool (AutoHPO). They achieved an accuracy of 71.6% and a false-negative rate of 19.1%. Zhao et al. proposed a DNN approach to predict the risk of pre-operative acute ischemic stroke. Using a combination of clinical data, transthoracic echocardiography, and CTA imaging, they achieved a 96.4% AUC score [19]. Furthermore, Alanazi et al. worked on the task of predicting the risk of stroke on an imbalanced clinical dataset (biomarkers) from the National Health and Nutrition Examination Survey (NHANES). Four ML classifiers were tested, and the optimal accuracy (96%) was finally achieved by the Random Forest (RF) algorithm [20]. Moreover, Cui et al. proposed an ML-based model for predicting the incidence and severity of acute ischemic stroke in patients with anterior circulation large vessel occlusion [21]. They explored the effectiveness of four well-known classifiers on an imbalanced clinical dataset, achieving ROC-AUC scores of up to 67% on an external dataset.
Despite their widespread use, machine learning (ML) and deep learning (DL) models are characterized as black boxes, with only a few studies in medical applications focusing on the interpretation of the ML models’ output [22,23,24]. Specifically, Kim et al. proposed an interpretable ML model for predicting early neurological deterioration in atrial fibrillation (AF)-related strokes [25]. They used clinical data from 2363 patients with early neurological deterioration (END) and achieved a 77.2% score for the area under the receiver operating characteristic curve (AUROC). Applying SHAP, they demonstrated that the most influential factors were the National Institute of Health Stroke Scale score and the fasting glucose level. So far, a lack of transparency has been identified as a major implementation barrier, preventing clinicians from accepting AI-generated decisions or recommendations. In order to fill the research gap, we propose an explainable machine learning pipeline for stroke prediction based on an extremely imbalanced dataset with routine clinical measurements. The proposed methodology relies on SHAP, a popular explainable AI (XAI) framework offering model-agnostic explanations. It is based on Shapley values, a notion frequently used in cooperative game theory. Our XAI technique quantifies the importance of each feature as the average marginal contribution over all feasible coalitions. Overall, we propose an end-to-end XAI methodology that comprises of the following steps: (i) feature engineering to standardize data and remove noise, (ii) learning on a comparative analysis that involves several well-known ML models, and (ii) validation and explainability to evaluate the predictive performance of the trained ML models and quantify the contribution of each input feature to stroke prediction. Apart from the prediction task, secondary objectives of the current study are (i) to apply data resampling techniques to cope with an extremely imbalanced dataset and (ii) to reduce the false-negative rate in the prediction of stroke. The rest of the paper is organized as follows. Materials and methods are described in Section 2. Section 3 demonstrates the results of the proposed explainable ML pipeline. The results are presented in Section 4, and the conclusions are drawn in Section 5.

2. Materials and Methods

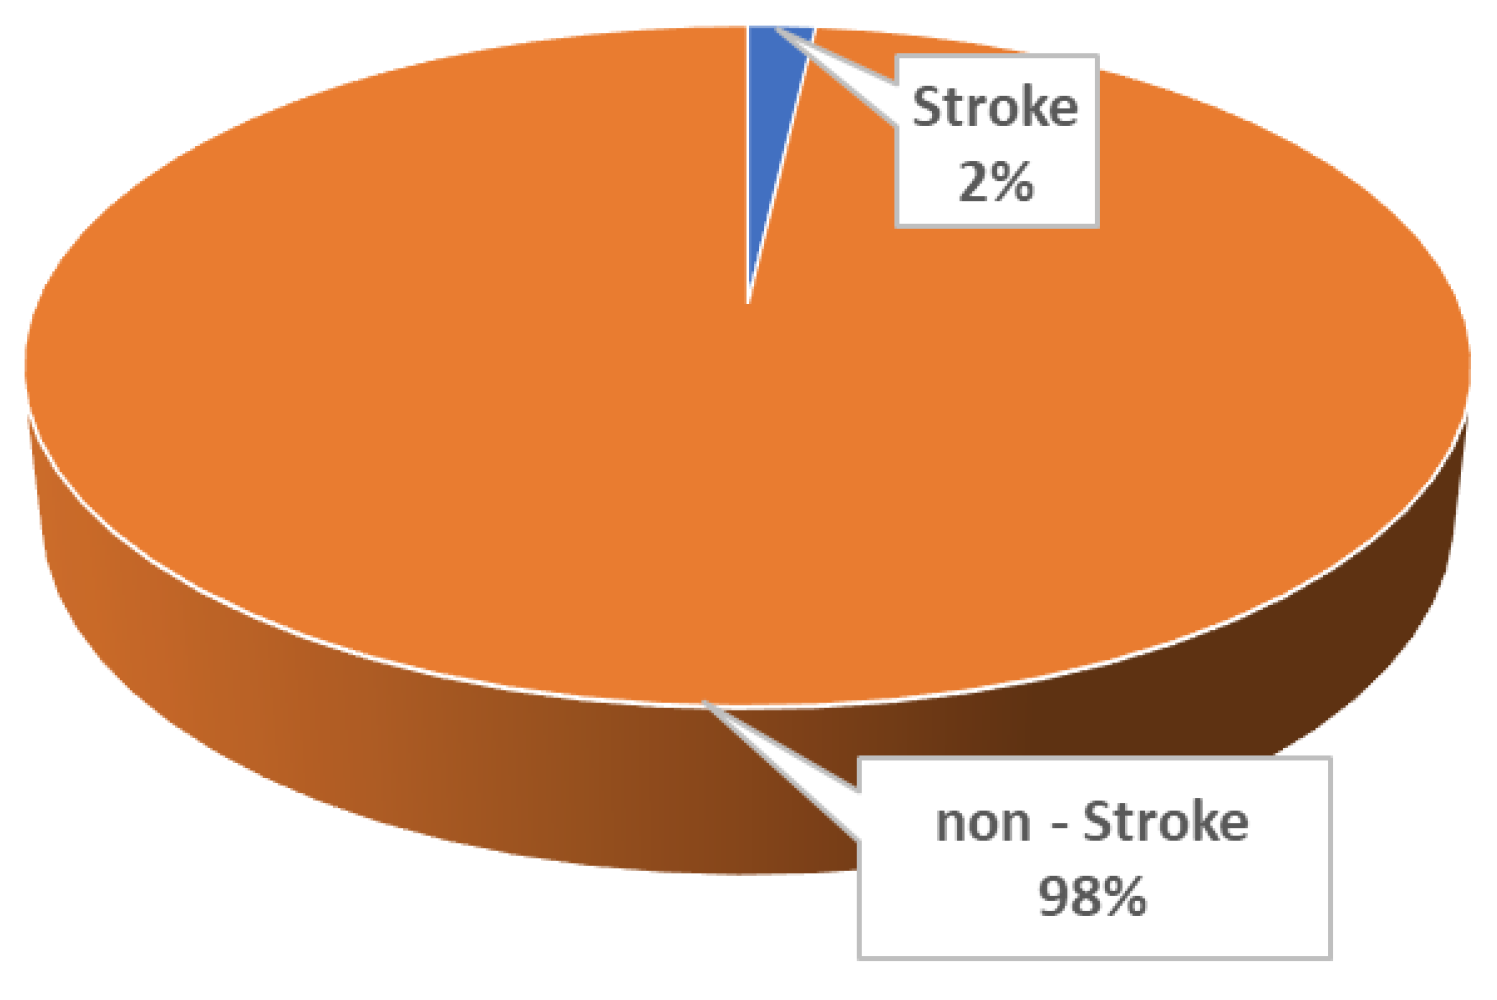
2.1. Data Description

Data were obtained from Kaggle’s public dataset “Cerebral Stroke Prediction-Imbalanced Dataset” (https://www.kaggle.com/shashwatwork/cerebral-stroke-prediction-imbalaced-dataset, accessed on 1 December 2021) [18]. The dataset contains a total of 43,400 subjects and 10 risk factors for stroke incidence, including the target variable “stroke”. The detailed dataset description is presented in Table 1.

2.2. Problem Definition

In this study, we focused on the development of an explainable machine learning pipeline that could identify important risk factors that contribute to the prediction of stroke and their impact on model output with a focus on post hoc explainability. For this aim, we consider the stroke prediction task as a two-class classification problem. Specifically, the subjects of this study were divided into two classes: (i) the stroke occurrence class, consisting of subjects with the occurrence of stroke, and (ii) the non-stroke class, which includes healthy subjects without confirmed stroke (Figure 1).

2.3. Proposed Methodology

The proposed AI methodology for the prediction and interpretation of stroke occurrence includes four processing steps: feature engineering of the collected clinical data (10 risk factors in total), learning process, evaluation of the classification results, and explainability/interpretation analysis. The workflow of the proposed methodology is presented in Figure 2. The codes for the preprocessing of the data, the implementation of the ML models, and the explainability analysis were implemented in Python 3.6 by using scikit-learn 0.24.2 (https://scikit-learn.org/0.24/, accessed on 15 December 2021).

2.4. Feature Engineering

To be consistent with the study of Liu et al. [18], we first removed outliers’ values from the risk factors “age” (10 years) and “BMI” (>60). Then, in order to cope with the missing values and given the massive availability of data in the current study (43,400 samples), we deleted all records that contained missing values [26]. Furthermore, as a standardization technique, we employed the StandardScaler function from scikit-learn 1.0.2 [27]. This technique standardizes the risk factors by removing the mean and scaling them to unit variance.

2.5. Learning

For the prediction task, six well-known ML classifiers which are widely used in medical applications were employed: Logistic Regression (LR) [28], Random Forest (RF) [29], XGBoost [30], K-Nearest Neighbors (KNN) [31], Support Vector Machine (SVM) [32], and Multi-Layer Perceptron (MLP) [33].

2.6. Validation and Evaluation Metrics

To evaluate the prediction performance of the proposed ML classifiers, a nested stratified 10-fold cross-validation process was adopted [34]. In order to form balanced binary datasets for training, random under-sampling was applied to the majority class in each of the ten training data folds. The one remaining testing fold remained intact. Model fitting and hyperparameter optimization were applied to the training data folds using the GridSearchCV function from scikit-learn 1.0.2. In Table 2, the employed hyperparameters for each ML model are presented. The proposed learning approach (under-sampling, hyperparameter optimization on training, and validation on the testing fold) was applied ten times (one per fold) and the validation results were combined over the rounds, providing a performance on the whole imbalanced dataset.
Prediction accuracy, sensitivity, specificity, G-Mean, and AUC were employed for objective evaluation of the competing classifiers [35]. The false-positive rate (FPrate) and the false-negative rate (FNrate) were also considered in our study given their important role in medical applications [36]. False-positive decisions may lead to expensive follow-up testing or even unnecessary medical treatment. On the other hand, false negatives put patients at risk of not receiving appropriate treatment on time since their disease remains undiagnosed. Given the extremely imbalanced dataset of our study, it is expected that some of the aforementioned metrics might reveal more about the class distribution than the actual performance of the trained models. In light of this, we considered a combination of metrics to select the optimal ML model, giving priority to (i) G-Mean, which balances the performances between the majority and minority classes, and (ii) FNrate, which classifies patients as healthy while they may be in danger, and they may not receive appropriate treatment on time since their disease remains undetected.

2.7. Explainability

As a final step of the proposed methodology, we employed the Shapley Additive Explanations (SHAP) model to perform post hoc explainability analysis on the best performing ML model. SHAP is an explanation tool based on game theory for the output of any ML model [37,38,39]. It provides a link between optimal credit distribution and local explanations by employing basic Shapley values from game theory. SHAP aims to explain the prediction of an instance by estimating the contribution of each input variable with Shapley values that are computed using coalitional game theory. Instead of building a model that predicts using many inputs, the problem should be seen as a game in which each feature (“player”) contributes to the prediction process (“score”). SHAP estimates the number of points we would earn or lose in the presence or absence of a feature to identify the contribution of each player (feature) in predicting the score. To determine the Shapley value of a particular feature, a weighted sum of the differences in scores between games (predictions) in which the player (feature) plays and games from which the player (feature) is removed is calculated.
In this study, we evaluated how risk factors affect the final stroke prediction. To this end, we employed SHAP to score features based on their influence on the optimum ML outputs and to build a small explanatory model, which adds to our understanding of the relative impact of features on stroke prediction.

3. Results

In this section, we summarize the prediction performance results of the proposed ML models. Furthermore, the impact of the risk factors on the classification result of the best performing model is discussed by employing the SHAP model.

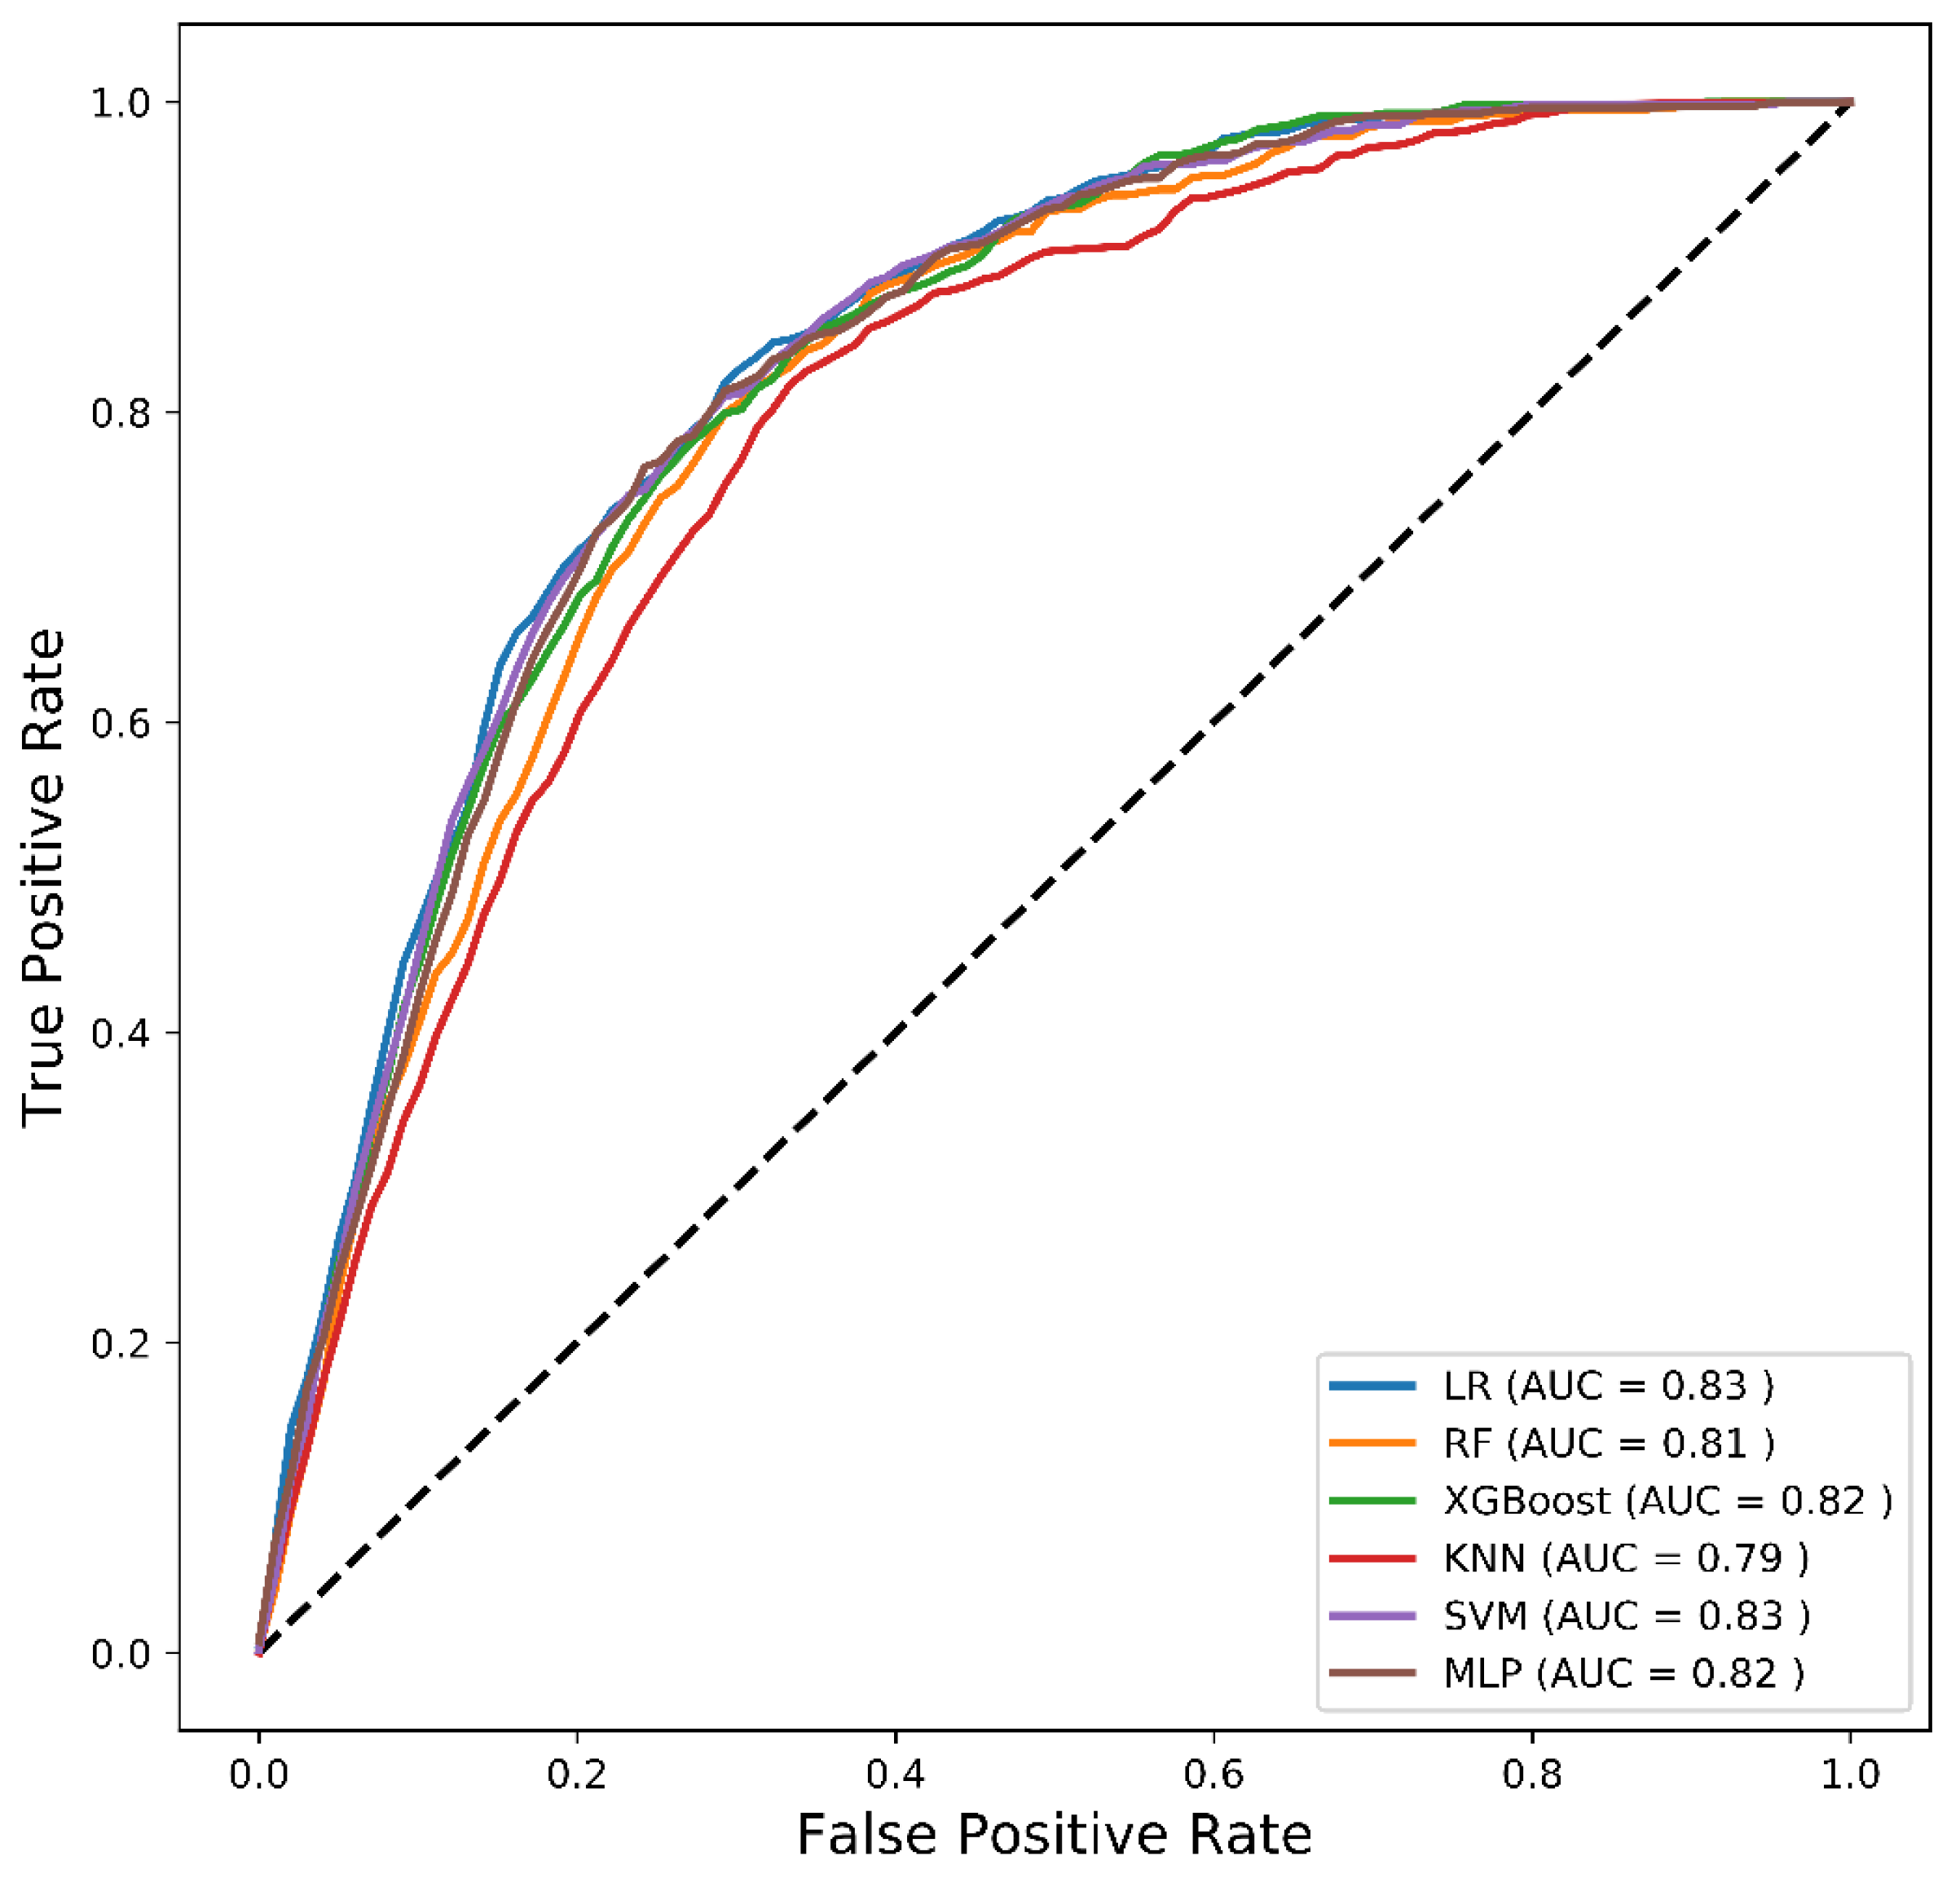
3.1. Comparative Analysis

Table 3 summarizes the prediction performance results of the comparative analysis of the six well-known classifiers. The LR classifier achieved the best scores in accuracy (73.52%), specificity (73.43%), AUC (83.30%), and FPrate (26.57%). The MLP classifier, on the other hand, had the highest sensitivity (81.40), G-Mean (75.83%), and FNrate (18.60%) scores. Moderate scores were obtained by the RF, XGBoost, and SVM classifiers. Finally, the KNN classifier recorded the lowest performance in the majority of metrics (accuracy of 69.16% and G-Mean of 73.70%).
Figure 3 depicts the mean ROC curves of the employed classifiers in this binary problem. We can observe that AUC scores ranging from 79% to 83% were achieved by the employed models. From a different perspective, Figure 4 demonstrates the relationship between FPrate and FNrate in (a) and between FNrate and G-Mean in (b). The following conclusions can be drawn from Figure 4. (i) We observe an almost inverse relationship between the FNrate and the FPrate. Specifically, as the FNrate decreases, the FPrate increases and vice versa, with the exception of KNN. (ii) MLP achieved the lowest FNrate and the second highest FPrate. (iii) LR was the best performer with respect to FP, but simultaneously the worst performer in FNrate. (iv) MLP had the highest G-Mean while also having the lowest FNrate. Thus, the MLP classifier was chosen as the best ML model for this binary problem because it found the best balance between the two most important metrics (G-Mean and FN).

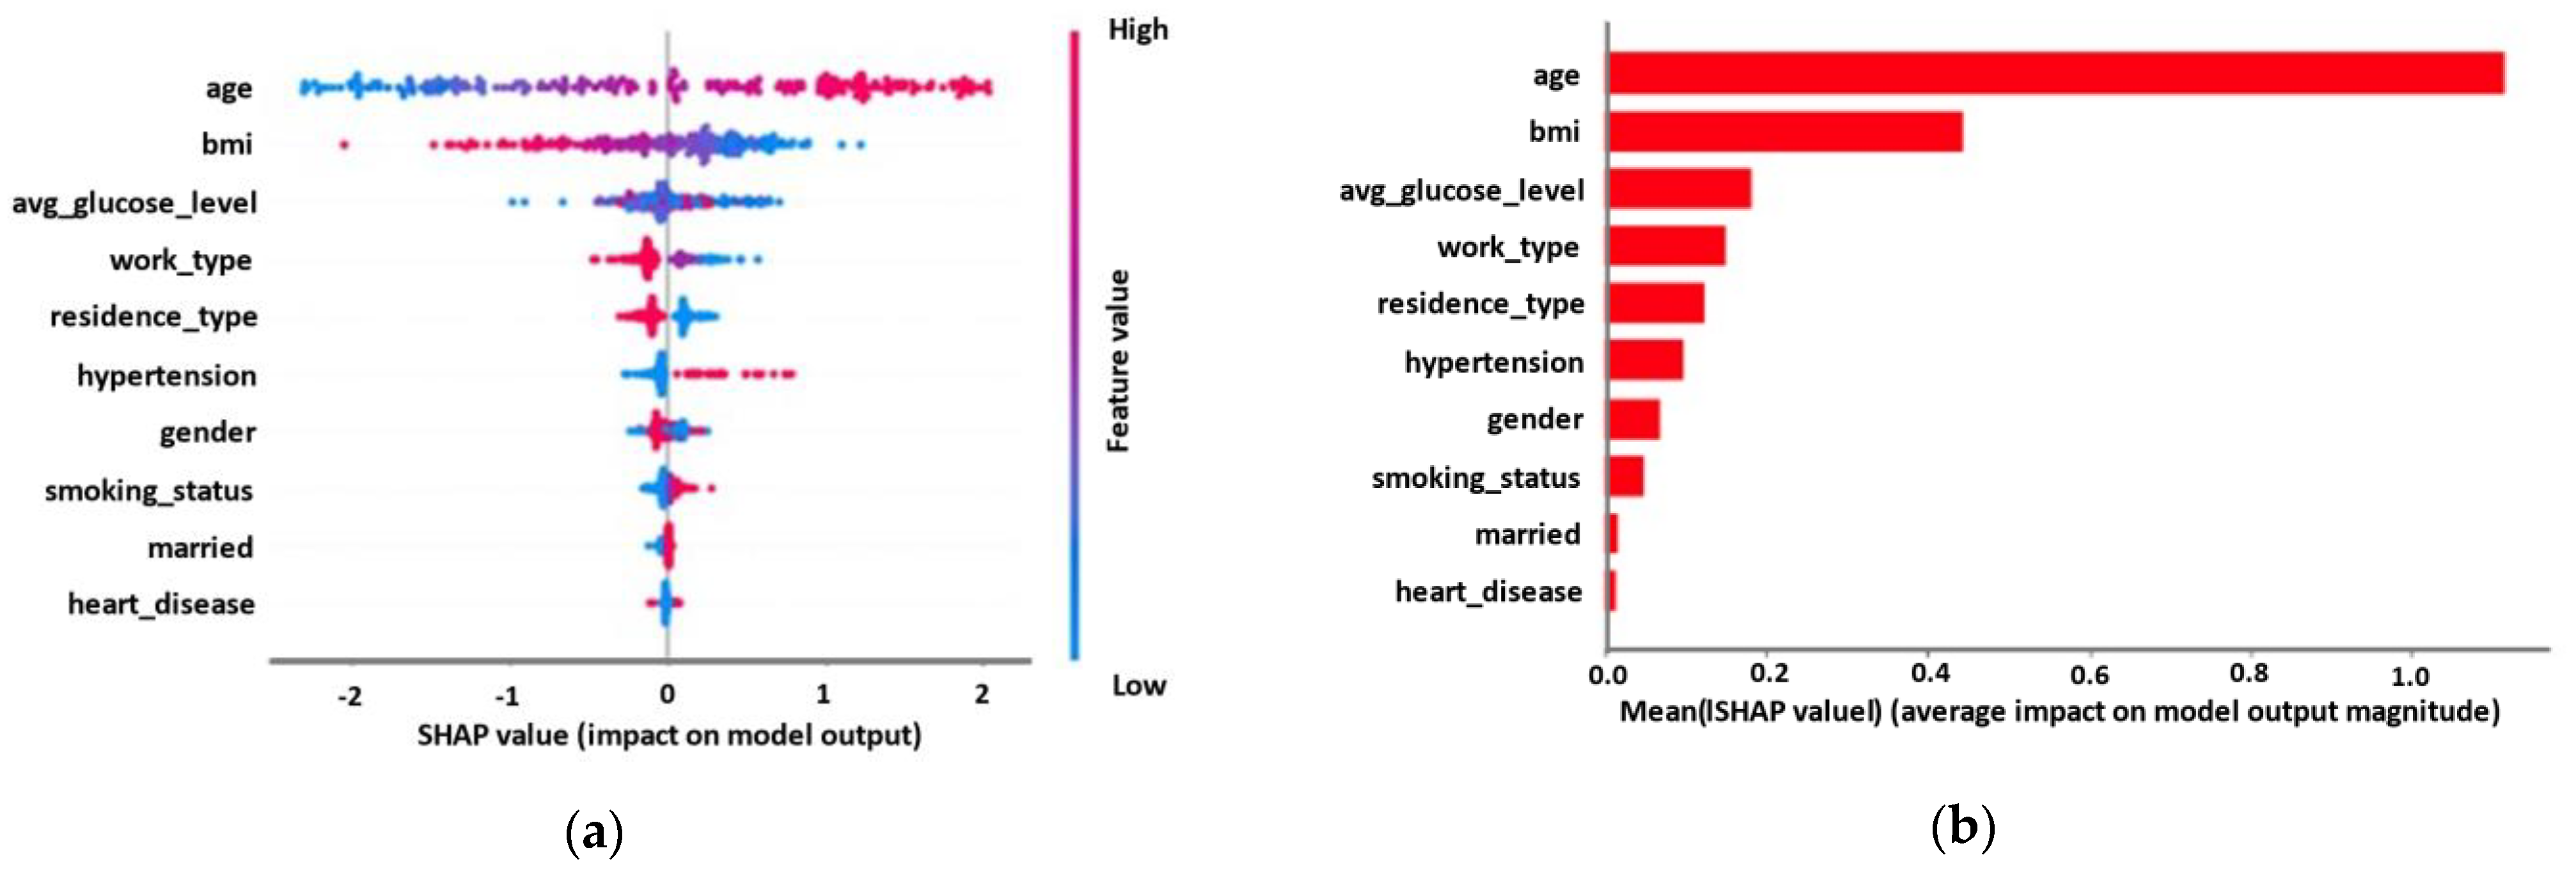
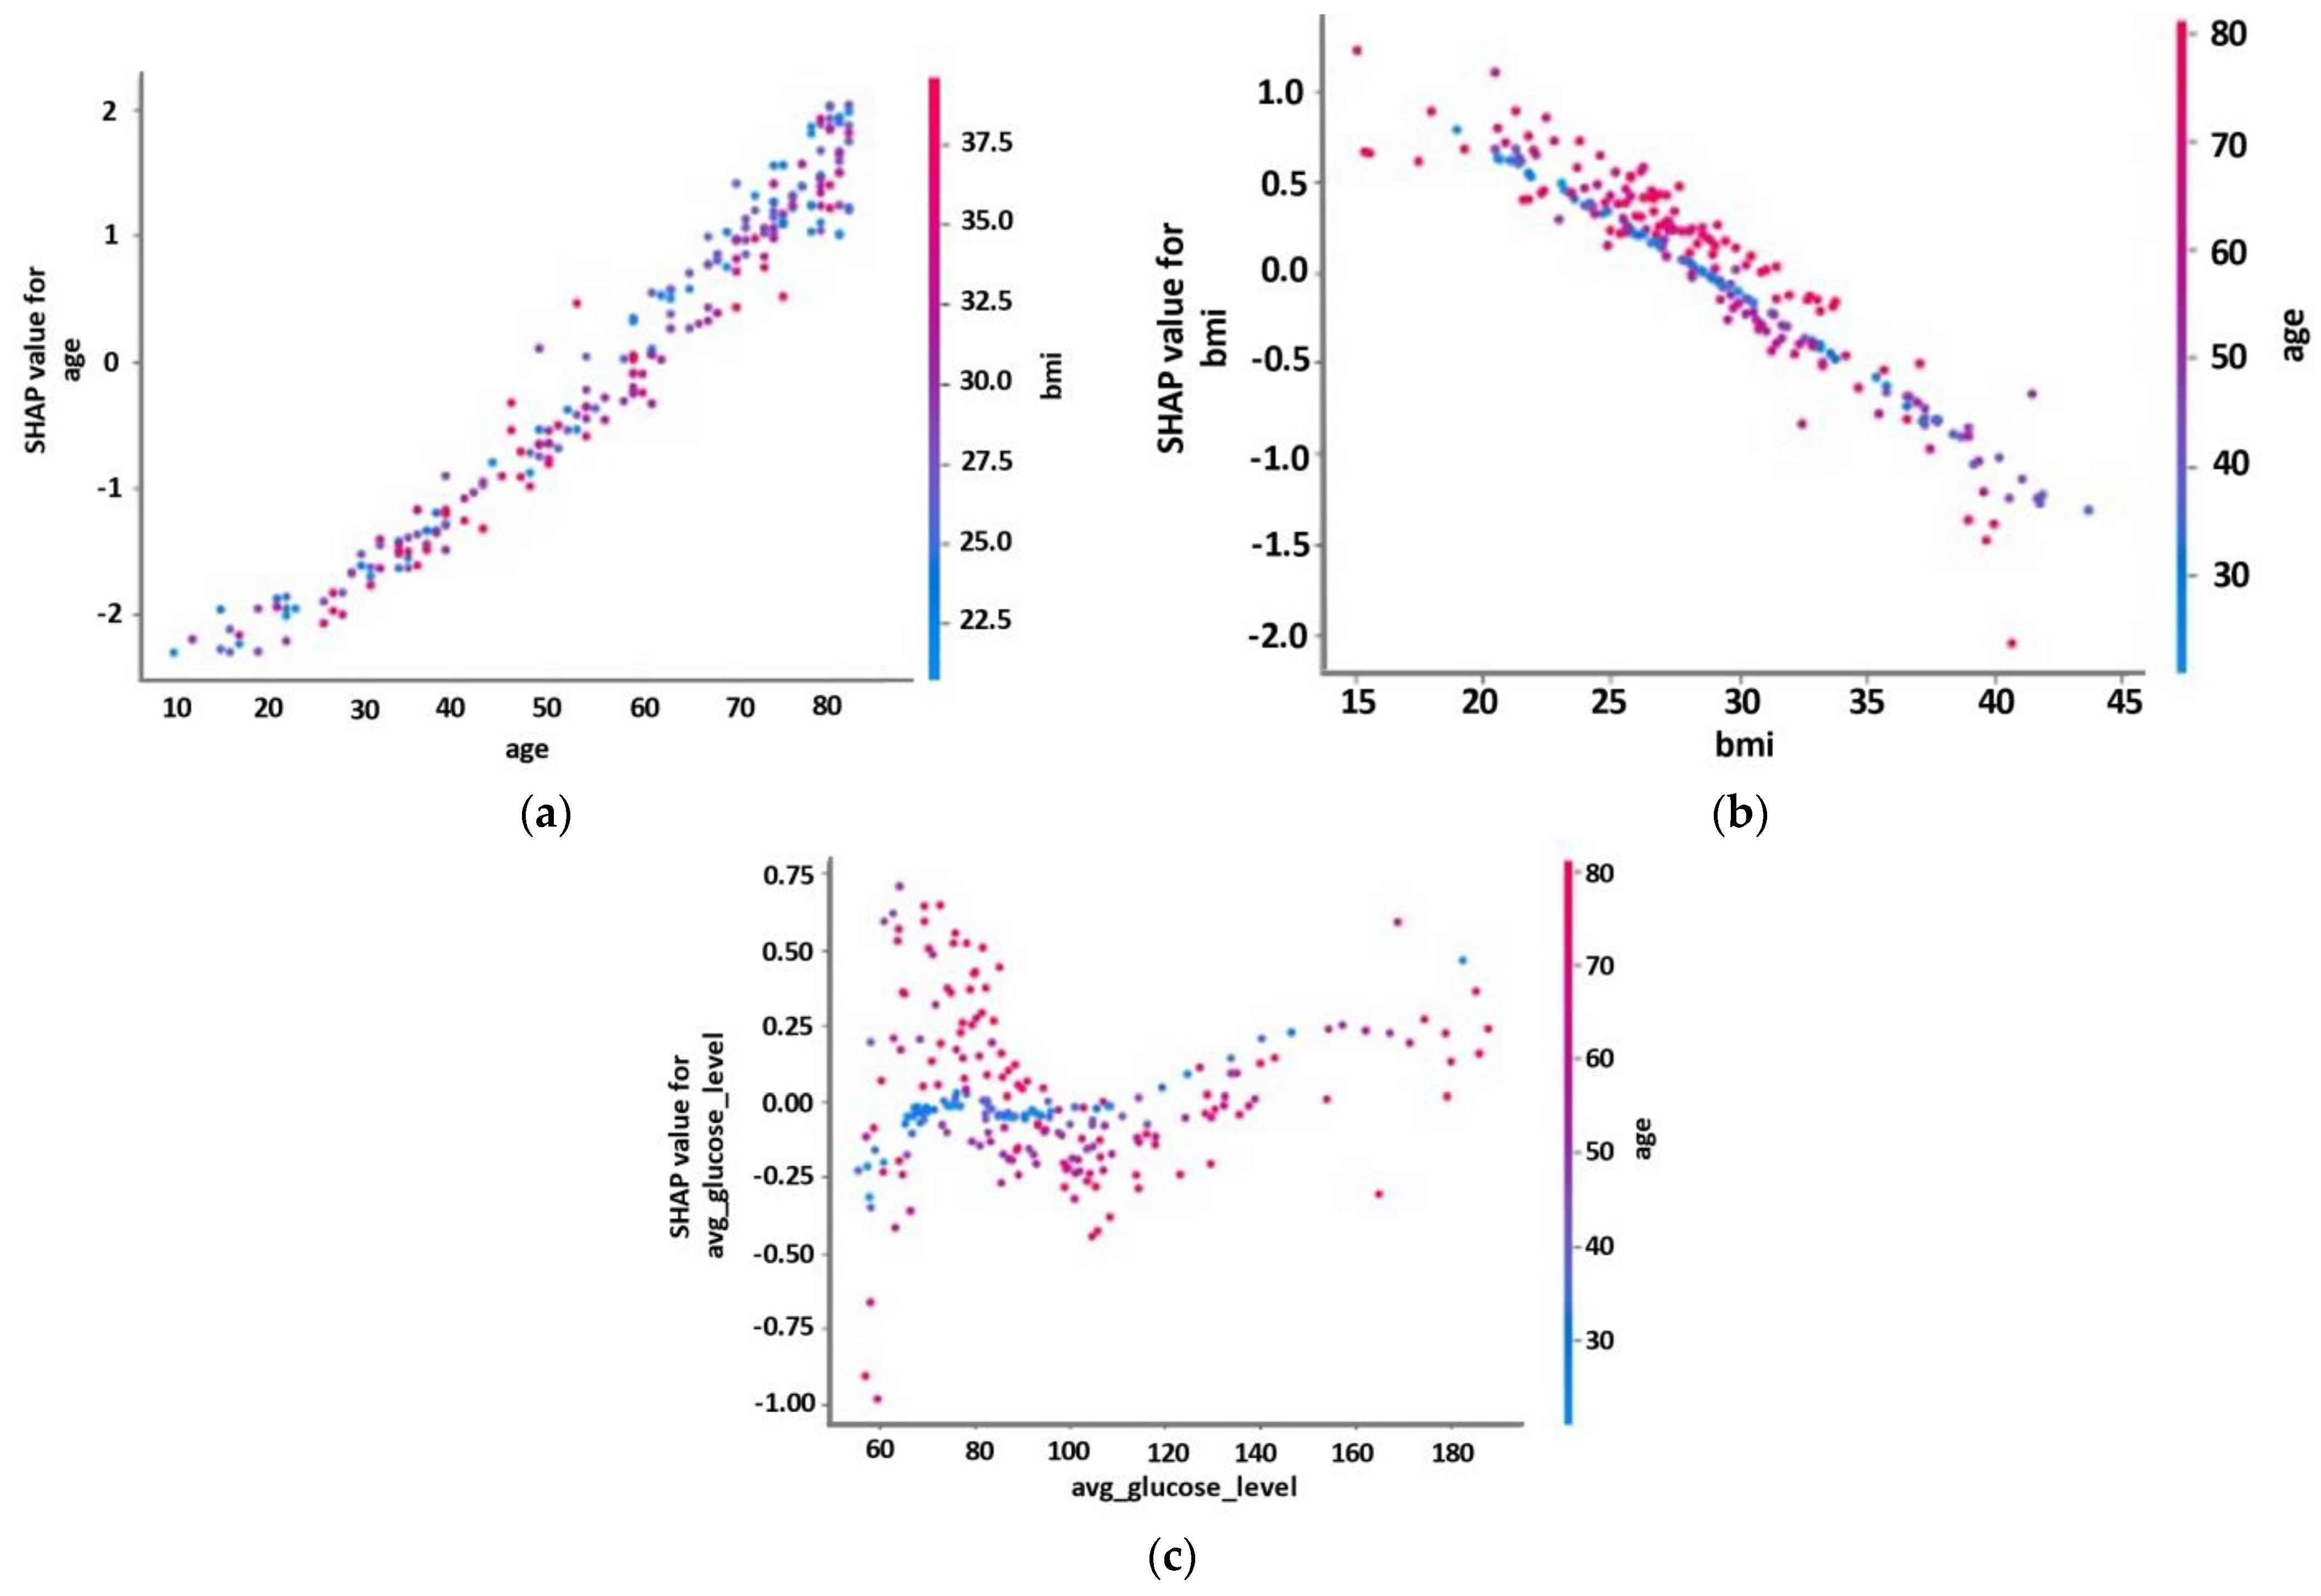
3.2. Explainability Results

Figure 5 depicts the risk factors’ impact on the best performing model’s (MLP) output. Figure 6 depicts the negative and positive relationships of the risk factors with the target (occurrence of stroke). A positive relationship is actually defined when the increase in a feature value is correlated with an increase in the model’s output and vice versa for negative relationships. Moreover, the SHAP summary values of the risk factors in Figure 5a are shown in descending order in a top–down view, with the most impactful risk factors at the top. The color represents whether the value of the risk factor is high (red) or low (blue) for each observation individually. The risk factor age shows that the patients’ age has a high and positive impact on the occurrence of stroke (e.g., as age increases, this pushes the model output to increase towards the class of patients with stroke), so an increase in age is associated with the occurrence of stroke. On the other hand, BMI is negatively correlated with the occurrence of stroke. Figure 5b depicts the average impact of each risk factor on the model’s output magnitude. As it is observed, age, BMI, and avg_glucose_level have major contributions to the model’s output, whereas factors such as work_type, residence_type, hypertension, and gender have moderate to low impact on the model’s output.
Partial dependence plots were also generated (Figure 6) to quantify the marginal effect of the three most important risk factors on the predicted output of the MLP model. These plots demonstrate the kind of relationship between the occurrence of a stroke and the risk factors (e.g., monotonic, linear, or more complex). Figure 6a depicts a linear and positive relationship between age and the occurrence of stroke. A linear but negative relationship was observed for BMI with the occurrence of stroke. The average glucose level had a minor effect, with the obtained SHAP values within the range of [−1, 0.75], whereas the association with the incidence of stroke revealed a more complicated non-linear relationship.

4. Discussion

This work focuses on the development of an explainable ML pipeline for the prediction of stroke occurrence. This prediction task was tackled as a binary classification problem where the subjects of the employed dataset were divided into two classes (stroke and non-stroke). In order to perform the binary classification task (stroke versus non-stroke), various ML models were employed, and we achieved a low false-negative rate of 18.6% and a satisfactory G-Mean score (75.83%). Another major objective of this study was to identify informative risk factors that significantly contribute to the classification output (stroke prediction).
To cope with the imbalanced dataset, we applied a well-established data resampling technique (e.g., random under-sampling in each individual run) in combination with a nested stratified 10-fold cross-validation process. To evaluate the predictive performance of the proposed approach, six ML models were employed. The best accuracy (73.52%), specificity (73.43), and AUC (83.30) scores were achieved by the LR model, whereas the MLP model recorded the best sensitivity and G-Mean scores, 81.4% and 75.83%, respectively (Table 3). Despite the fact that the LR model is a computationally efficient classifier, we selected the MLP classifier as the best ML model for this medical task because this model achieved the best trade-off between FNrate and G-Mean in the comparative analysis (Figure 4). Our approach achieved overall better scores in comparison to the study of Liu et al., where the main assessment scores were the FNrate and the FPrate. Specifically, on the same dataset, we achieved 18.6% instead of 19.1% and 31.02% instead of 33.1% for FNrate and FPrate, respectively [18].
During this study, the risk factors that mainly shaped the predictive ability of our best ML model were also identified. The SHAP model found that age, BMI, and the average glucose level were the three most important predictors of risk. The rest of the risk factors had low or minor contributions (Figure 5). The majority of the existing studies include age as one of the most important risk factors in the occurrence of stroke. Yousufuddin et al. stated that aging is the most robust non-modifiable risk factor for incident stroke [40]. BMI was also identified as the second most important risk factor. Despite the fact that obesity is highly associated with an increased risk of stroke incidents, recent findings in the literature show that leaner adults (lower BMI) have higher mortality rates than overweight or obese adults [41]. In another study, Park et al. also demonstrated that the risk of any type of stroke decreased in obese patients [42]. Furthermore, the average glucose level was selected as a high-impact risk factor. According to Zheng et al., the average glucose level is strongly associated with the occurrence of an ischemic stroke [43].
Work type, residence, hypertension, gender, and smoking status display lower impact than the aforementioned risk factors in our model. Hypertension or high blood pressure is highly correlated with the occurrence of stroke (e.g., ischemic stroke) [44]. The type of work can also be characterized as a risk factor. Huang et al. stated that high-strain jobs are correlated with an increased risk of stroke [45]. In addition, despite the fact that residence has a low impact as a risk factor in stroke in our study, Sealy-Jefferson et al. concluded that postmenopausal women who lived in rural areas had a higher stroke risk [46]. Gender presents differences in stroke rates among women and men [3]. According to Peters et al., men continue to have a higher stroke incidence rate than women [47]. In another study, Shah et al. demonstrated that smoking status increases the risk of stroke [48]. Overall, the low but not negligible contribution of risk factors resulting from the present study is also confirmed by the existing literature.
As a limitation, the implementation of a nested cross-validation strategy is costly in computational terms. However, this is an offline process that needs to be performed once, and the inference time of the trained model will be small, enabling the almost real-time application of the ML models. The whole feature set was utilized in the proposed analysis, and this could also be seen as a limitation. We did not employ any feature selection because we wanted to quantify the contribution (SHAP values) of each feature to the stroke prediction outcome. This information is valuable for the design of an optimized future experimental setup that would be based on the most relevant risk factors. Furthermore, the lack of an external validation dataset for evaluating the generalization of the best ML model could be characterized as a limitation. Our future work includes the development of a database with easy-to-read and low-cost measurements and potentially complementary data (such as genetic factors), which will be based on a stratified sampling of the general population in Greece. Utilizing the new database, we will identify subpopulations of participants who are at higher risk of having a stroke (either ischemic or hemorrhagic stroke). This dataset could also serve as a validation set to further evaluate the predictive accuracy of the proposed ML models on unseen (unknown) real-world data. In order to achieve these goals, it is necessary to employ more advanced AI tools (e.g., pre-trained CCN or Siamese neural networks), feature selection techniques, and interpretation approaches using graphical algorithms.

5. Conclusions

In this study, we proposed a reliable ML prediction model for stroke disease, and we coped with the challenge of following and tracing the logic of the ML algorithms. In a severely imbalanced dataset, we achieved a competitive FNrate score (18.6%) in comparison with the existing studies. The proposed explainable ML methodology was based on a well-established ML pipeline that combines data resampling techniques to cope with the observed class imbalance data problem with explainability analysis via SHAP. Understanding the mechanisms behind stroke occurrence via advanced ML techniques is a valuable tool for creating more reliable, non-invasive, and powerful prediction tools in the hands of clinicians.

Author Contributions

Data curation, C.K., G.G. and E.G.; Funding acquisition, K.V. and N.A.; Software, C.K.; Supervision, S.M. and N.A.; Writing—original draft, C.K.; Writing—review and editing, S.M., T.T., D.T. and N.A. All authors have read and agreed to the published version of the manuscript.

Funding

This research was funded by the grant MIS 5047286 from Greek and European funds (EYD-EPANEK).

Institutional Review Board Statement

Not applicable.

Informed Consent Statement

Not applicable.

Data Availability Statement

Publicity data from the Kaggle are available at https://www.kaggle.com/shashwatwork/cerebral-stroke-predictionimbalaced-dataset (accessed on 1 December 2021).

Acknowledgments

We acknowledge support of this work by the project “Study of the interrela-tionships between neuroimaging, neurophysiological and biomechanical biomarkers in stroke re-habilitation (NEURO-BIO-MECH in stroke rehab)” (MIS 5047286), which is implemented under the Action “Support for Regional Excellence”, funded by the Operational Program “Competitiveness, Entrepreneurship and Innovation” (NSRFm2014-2020) and co-financed by Greece and the European Union (European Regional Development Fund).

Conflicts of Interest

The authors declare no conflict of interest.

References

  1. Feigin, V.L.; Krishnamurthi, R.V.; Parmar, P.; Norrving, B.; Mensah, G.A.; Bennett, D.A.; Barker-Collo, S.; Moran, A.E.; Sacco, R.L.; Truelsen, T.; et al. Update on the global burden of ischemic and hemorrhagic stroke in 1990–2013: The GBD 2013 study. Neuroepidemiology 2015, 45, 161–176. [Google Scholar] [CrossRef] [PubMed] [Green Version]
  2. Feigin, V.L.; Lawes, C.M.; A Bennett, D.; Anderson, C.S. Stroke epidemiology: A review of population-based studies of incidence, prevalence, and case-fatality in the late 20th century. Lancet Neurol. 2003, 2, 43–53. [Google Scholar] [CrossRef]
  3. Reeves, M.J.; Bushnell, C.D.; Howard, G.; Gargano, J.W.; Duncan, P.W.; Lynch, G.; Khatiwoda, A.; Lisabeth, L. Sex differences in stroke: Epidemiology, clinical presentation, medical care, and outcomes. Lancet Neurol. 2008, 7, 915–926. [Google Scholar] [CrossRef] [Green Version]
  4. Khan, S.; Siddique, R.; Hao, X.; Lin, Y.; Liu, Y.; Wang, X.; Hua, L.; Nabi, G. The COVID-19 infection in children and its association with the immune system, prenatal stress, and neurological complications. Int. J. Biol. Sci. 2022, 18, 707–716. [Google Scholar] [CrossRef] [PubMed]
  5. Defebvre, L.; Krystkowiak, P. Movement disorders and stroke. Rev. Neurol. 2016, 172, 483–487. [Google Scholar] [CrossRef] [PubMed]
  6. Jaafar, N.; Daud, A.Z.C.; Roslan, N.F.A.; Mansor, W. Mirror Therapy Rehabilitation in Stroke: A Scoping Review of Upper Limb Recovery and Brain Activities. Rehabil. Res. Pract. 2021, 2021, 9487319. [Google Scholar] [CrossRef] [PubMed]
  7. Strilciuc, S.; Grad, D.A.; Radu, C.; Chira, D.; Stan, A.; Ungureanu, M.; Gheorghe, A.; Muresanu, F.-D. The economic burden of stroke: A systematic review of cost of illness studies. J. Med. Life 2021, 14, 606–619. [Google Scholar] [CrossRef]
  8. Kokkotis, C.; Moustakidis, S.; Papageorgiou, E.; Giakas, G.; Tsaopoulos, D. Machine learning in knee osteoarthritis: A review. Osteoarthr. Cartil. Open 2020, 2, 100069. [Google Scholar] [CrossRef]
  9. Rajpurkar, P.; Chen, E.; Banerjee, O.; Topol, E.J. AI in health and medicine. Nat. Med. 2022, 28, 31–38. [Google Scholar] [CrossRef]
  10. Hügle, M.; Omoumi, P.; Van Laar, J.M.; Boedecker, J.; Hügle, T. Applied machine learning and artificial intelligence in rheumatology. Rheumatol. Adv. Pract. 2020, 4, rkaa005. [Google Scholar] [CrossRef]
  11. Murray, N.M.; Unberath, M.; Hager, G.D.; Hui, F.K. Artificial intelligence to diagnose ischemic stroke and identify large vessel occlusions: A systematic review. J. NeuroInterv. Surg. 2020, 12, 156–164. [Google Scholar] [CrossRef] [PubMed]
  12. Zhao, Y.; Fu, S.; Bielinski, S.J.; A Decker, P.; Chamberlain, A.M.; Roger, V.L.; Liu, H.; Larson, N.B. Natural Language Processing and Machine Learning for Identifying Incident Stroke from Electronic Health Records: Algorithm Development and Validation. J. Med. Internet Res. 2021, 23, e22951. [Google Scholar] [CrossRef] [PubMed]
  13. McDermott, B.J.; Elahi, A.; Santorelli, A.; O’Halloran, M.; Avery, J.; Porter, E. Multi-frequency symmetry difference electrical impedance tomography with machine learning for human stroke diagnosis. Physiol. Meas. 2020, 41, 075010. [Google Scholar] [CrossRef]
  14. Bivard, A.; Churilov, L.; Parsons, M. Artificial intelligence for decision support in acute stroke—Current roles and potential. Nat. Rev. Neurol. 2020, 16, 575–585. [Google Scholar] [CrossRef] [PubMed]
  15. Wang, W.; Kiik, M.; Peek, N.; Curcin, V.; Marshall, I.J.; Rudd, A.G.; Wang, Y.; Douiri, A.; Wolfe, C.D.; Bray, B. A systematic review of machine learning models for predicting outcomes of stroke with structured data. PLoS ONE 2020, 15, e0234722. [Google Scholar]
  16. Sirsat, M.S.; Fermé, E.; Câmara, J. Machine learning for brain stroke: A review. J. Stroke Cerebrovasc. Dis. 2020, 29, 105162. [Google Scholar] [CrossRef] [PubMed]
  17. Arslan, A.K.; Colak, C.; Sarihan, M.E. Different medical data mining approaches based prediction of ischemic stroke. Comput. Methods Programs Biomed. 2016, 130, 87–92. [Google Scholar] [CrossRef] [PubMed]
  18. Liu, T.; Fan, W.; Wu, C. A hybrid machine learning approach to cerebral stroke prediction based on imbalanced medical dataset. Artif. Intell. Med. 2019, 101, 101723. [Google Scholar] [CrossRef]
  19. Zhao, H.; Xu, Z.; Zhu, Y.; Xue, R.; Wang, J.; Ren, J.; Wang, W.; Duan, W.; Zheng, M. The Construction of a Risk Prediction Model Based on Neural Network for Pre-operative Acute Ischemic Stroke in Acute Type a Aortic Dissection Patients. Front. Neurol. 2021, 12, 792678. [Google Scholar] [CrossRef]
  20. Alanazi, E.M.; Abdou, A.; Luo, J. Predicting Risk of Stroke from Lab Tests Using Machine Learning Algorithms: Development and Evaluation of Prediction Models. JMIR Form. Res. 2021, 5, e23440. [Google Scholar] [CrossRef]
  21. Cui, J.; Yang, J.; Zhang, K.; Xu, G.; Zhao, R.; Li, X.; Liu, L.; Zhu, Y.; Zhou, L.; Yu, P.; et al. Machine Learning-Based Model for Predicting Incidence and Severity of Acute Ischemic Stroke in Anterior Circulation Large Vessel Occlusion. Front. Neurol. 2021, 12, 749599. [Google Scholar] [CrossRef]
  22. Dickinson, Q.; Meyer, J.G. Positional SHAP (PoSHAP) for Interpretation of machine learning models trained from biological sequences. PLoS Comput. Biol. 2022, 18, e1009736. [Google Scholar] [CrossRef]
  23. Angelini, F.; Widera, P.; Mobasheri, A.; Blair, J.; Struglics, A.; Uebelhoer, M.; Henrotin, Y.; Marijnissen, A.C.; Kloppenburg, M.; Blanco, F.J.; et al. Osteoarthritis endotype discovery via clustering of biochemical marker data. Ann. Rheum. Dis. 2022, 81, 666–675. [Google Scholar] [CrossRef]
  24. Utkin, L.V.; Meldo, A.A.; Kovalev, M.S.; Kasimov, E.M. A Review of Methods for Explaining and Interpreting Decisions of Intelligent Cancer Diagnosis Systems. Sci. Tech. Inf. Process. 2021, 48, 398–405. [Google Scholar] [CrossRef]
  25. Kim, S.-H.; Jeon, E.-T.; Yu, S.; Oh, K.; Kim, C.K.; Song, T.-J.; Kim, Y.-J.; Heo, S.H.; Park, K.-Y.; Kim, J.-M.; et al. Interpretable machine learning for early neurological deterioration prediction in atrial fibrillation-related stroke. Sci. Rep. 2021, 11, 20610. [Google Scholar] [CrossRef]
  26. Kokkotis, C.; Moustakidis, S.; Giakas, G.; Tsaopoulos, D. Identification of Risk Factors and Machine Learning-Based Prediction Models for Knee Osteoarthritis Patients. Appl. Sci. 2020, 10, 6797. [Google Scholar] [CrossRef]
  27. Shanker, M.; Hu, M.; Hung, M. Effect of data standardization on neural network training. Omega 1996, 24, 385–397. [Google Scholar] [CrossRef]
  28. Ali, A.A. Stroke Prediction using Distributed Machine Learning Based on Apache Spark. Stroke 2019, 28, 89–97. [Google Scholar]
  29. Fernandez-Lozano, C.; Hervella, P.; Mato-Abad, V.; Rodríguez-Yáñez, M.; Suárez-Garaboa, S.; López-Dequidt, I.; Estany-Gestal, A.; Sobrino, T.; Campos, F.; Castillo, J.; et al. Random forest-based prediction of stroke outcome. Sci. Rep. 2021, 11, 10071. [Google Scholar] [CrossRef] [PubMed]
  30. Yu, D.; Liu, Z.; Su, C.; Han, Y.; Duan, X.; Zhang, R.; Liu, X.; Yang, Y.; Xu, S. Copy number variation in plasma as a tool for lung cancer prediction using Extreme Gradient Boosting (XGBoost) classifier. Thorac. Cancer 2020, 11, 95–102. [Google Scholar] [CrossRef] [PubMed]
  31. Okun, O.; Priisalu, H. Dataset complexity in gene expression based cancer classification using ensembles of k-nearest neighbors. Artif. Intell. Med. 2009, 45, 151–162. [Google Scholar] [CrossRef] [PubMed]
  32. Mohr, M.; von Tscharner, V.; Emery, C.A.; Nigg, B.M. Classification of gait muscle activation patterns according to knee injury history using a support vector machine ap-proach. Hum. Mov. Sci. 2019, 66, 335–346. [Google Scholar] [CrossRef] [PubMed]
  33. Chan, L.; Li, H.; Chan, P.; Wen, C. A machine learning-based approach to decipher multi-etiology of knee osteoarthritis onset and deterioration. Osteoarthr. Cartil. Open 2021, 3, 100135. [Google Scholar] [CrossRef]
  34. Park, D.; Jeong, E.; Kim, H.; Pyun, H.W.; Kim, H.; Choi, Y.-J.; Kim, Y.; Jin, S.; Hong, D.; Lee, D.W.; et al. Machine Learning-Based Three-Month Outcome Prediction in Acute Ischemic Stroke: A Single Cerebrovascular-Specialty Hospital Study in South Korea. Diagnostics 2021, 11, 1909. [Google Scholar] [CrossRef]
  35. Hicks, S.A.; Strümke, I.; Thambawita, V.; Hammou, M.; Riegler, M.A.; Halvorsen, P.; Parasa, S. On evaluation metrics for medical applications of artificial intelligence. Sci. Rep. 2022, 12, 5979. [Google Scholar] [CrossRef]
  36. Branco, P.; Torgo, L.; Ribeiro, R.P. A Survey of Predictive Modeling on Imbalanced Domains. ACM Comput. Surv. 2016, 49, 1–50. [Google Scholar] [CrossRef] [Green Version]
  37. Lundberg, S.M.; Lee, S.-I. A unified approach to interpreting model predictions. In Advances in Neural Information Processing Systems 30, Proceedings of the 31st Annual Conference on Neural Information Processing Systems (NIPS 2017), Long Beach, CA, USA, 4–9 December 2017; Curran Associates Inc.: Red Hook, NY, USA, 2017. [Google Scholar]
  38. Lundberg, S.M.; Erion, G.; Chen, H.; DeGrave, A.; Prutkin, J.M.; Nair, B.; Katz, R.; Himmelfarb, J.; Bansal, N.; Lee, S.-I. From local explanations to global understanding with explainable AI for trees. Nat. Mach. Intell. 2020, 2, 56–67. [Google Scholar] [CrossRef]
  39. Janzing, D.; Minorics, L.; Blöbaum, P. Feature relevance quantification in explainable AI: A causal problem. In Proceedings of the 23th International Conference on Artificial Intelligence and Statistics, PMLR means Proceedings of Machine Learning Research, Online, 26–28 August 2020. [Google Scholar]
  40. Yousufuddin, M.; Young, N. Aging and ischemic stroke. Aging 2019, 11, 2542–2544. [Google Scholar] [CrossRef]
  41. Elagizi, A.; Kachur, S.; Lavie, C.J.; Carbone, S.; Pandey, A.; Ortega, F.B.; Milani, R.V. An Overview and Update on Obesity and the Obesity Paradox in Cardiovascular Diseases. Prog. Cardiovasc. Dis. 2018, 61, 142–150. [Google Scholar] [CrossRef] [Green Version]
  42. Park, H.; Lee, H.W.; Yoo, J.; Lee, H.S.; Nam, H.S.; Kim, Y.D.; Heo, J.H. Body Mass Index and Prognosis in Ischemic Stroke Patients with Type 2 Diabetes Mellitus. Front. Neurol. 2019, 10, 563. [Google Scholar] [CrossRef]
  43. Zheng, L.; Wen, L.; Lei, W.; Ning, Z. Added value of systemic inflammation markers in predicting pulmonary infection in stroke patients: A retrospective study by machine learning analysis. Medicine 2021, 100, e28439. [Google Scholar] [CrossRef]
  44. Wajngarten, M.; Silva, G.S. Hypertension and Stroke: Update on Treatment. Eur. Cardiol. Rev. 2019, 14, 111–115. [Google Scholar] [CrossRef] [PubMed] [Green Version]
  45. Huang, Y.; Xu, S.; Hua, J.; Zhu, D.; Liu, C.; Hu, Y.; Liu, T.; Xu, D. Association between job strain and risk of incident stroke: A meta-analysis. Neurology 2015, 85, 1648–1654. [Google Scholar] [CrossRef] [PubMed]
  46. Sealy-Jefferson, S.; Roseland, M.; Cote, M.L.; Lehman, A.; Whitsel, E.A.; Booza, J.; Simon, M.S. Rural–Urban Residence and Stroke Risk and Severity in Postmenopausal Women: The Women’s Health Initiative. Womens Health Rep. 2020, 1, 326–333. [Google Scholar] [CrossRef] [PubMed]
  47. Peters, S.A.; Carcel, C.; Millett, E.R.; Woodward, M. Sex differences in the association between major risk factors and the risk of stroke in the UK Biobank cohort study. Neurology 2020, 95, e2715–e2726. [Google Scholar] [CrossRef] [PubMed]
  48. Shah, R.S.; Cole, J.W. Smoking and stroke: The more you smoke the more you stroke. Expert Rev. Cardiovasc. Ther. 2010, 8, 917–932. [Google Scholar] [CrossRef]
Figure 1. Rates of classes in the binary problem.
Diagnostics 12 02392 g001
Figure 2. Workflow of the proposed AI methodology.
Diagnostics 12 02392 g002
Figure 3. Mean ROC curves of the employed classifiers.
Diagnostics 12 02392 g003
Figure 4. (a) Scatter plot of FPrate and FNrate. (b) Scatter plot of FNrate and G-Mean.
Diagnostics 12 02392 g004
Figure 5. Risk factors’ impact on MLP model output for the cerebral stroke prediction dataset. (a) The distribution of the impact of a risk factor value on the model output across test instances. (b) The average impact magnitude for test instances.
Diagnostics 12 02392 g005
Figure 6. SHAP dependence plots of three representative risk factors: (a) age; (b) BMI; (c) avg_glucose_level.
Diagnostics 12 02392 g006
Table 1. Included risk factors.
Risk FactorsDescriptionType of Variable
AgeCurrent ageContinuous
BMIBody mass index (BMI) is a measure of body fatContinuous
GenderFemale/MaleCategorical
Average glucoseAverage glucose is an estimated average of blood sugarContinuous
Work typeNever worked/Children/Government job/Self-Employed/PrivateCategorical
Residence typeRural/UrbanCategorical
Smoking statusNever/Formerly/SmokerCategorical
Heart diseaseNo/YesCategorical
MarriedNo/YesCategorical
HypertensionNo/YesCategorical
Table 2. ML hyperparameters tested in our experimentation.
ML ModelDescription
LRC: [0.01, 0.1, 1, 10, 100], penalty: [‘l1’, ‘l2’]
RFcriterion: [‘gini’, ‘entropy’], min_samples_leaf: [1, 2, 3, 4, 5], min_samples_split: [2, 3, 4, 5, 6, 7], n_estimators: [10, 15, 20, 25, 27, 30]
XGBoostmax_depth: [1, 2, 3, 4, 5, 6, 7, 8, 9, 10], min_child_weight: [1, 2, 3, 4, 5, 6, 8, 10],
gamma: [0, 0.4, 0.5, 0.6,0.7,0.8,0.9,1]
KNNalgorithm: [‘auto’, ‘ball_tree’, ‘kd_tree’, ‘brute’], leaf_size: [1, 2, 3, 5], n_neighbors: [3, 4, 5, 7, 9, 12, 14, 15, 16, 17], weights: [‘uniform’, ‘distance’]
SVMkernel: [‘rbf’, ‘linear’, ‘sigmoid’], C: [0.001, 0.1, 0.1, 10, 25, 50, 100, 1000], gamma: [0.01, 0.001, 0.0001, 1 × 10⁻⁵]
MLPactivation: [‘tanh’, ‘relu’], alpha: [0.0001, 0.05],
hidden_layer_sizes: [(2, 5, 10), (5, 10, 20), (10, 20, 50)],
learning_rate: [‘constant’, ‘adaptive’], solver: [‘sgd’, ‘adam’]
Table 3. Mean results of prediction models (%).
ML ModelsAccuracySensitivitySpecificityG-MeanAUCFPrateFNrate
LR73.5278.1273.4375.7383.3026.5721.89
RF71.1979.2271.0475.0281.2428.9620.79
XGBoost72.5878.3072.4775.3382.5027.5321.70
KNN69.1678.8468.9873.7079.3531.0221.17
SVM71.2880.4871.1075.6582.8528.9019.52
MLP70.8581.4070.6575.8382.1429.3518.60
Publisher’s Note: MDPI stays neutral with regard to jurisdictional claims in published maps and institutional affiliations.

