
Brown Adipose Tissue Biodistribution and Correlations Particularities in Parathyroid Pathology Personalized Diagnosis
 , , ,
, , ,
Abstract
:1. Introduction
2. Materials and Methods
- Patients
- 99mTc-sestamibi Parathyroid Scanning Protocol
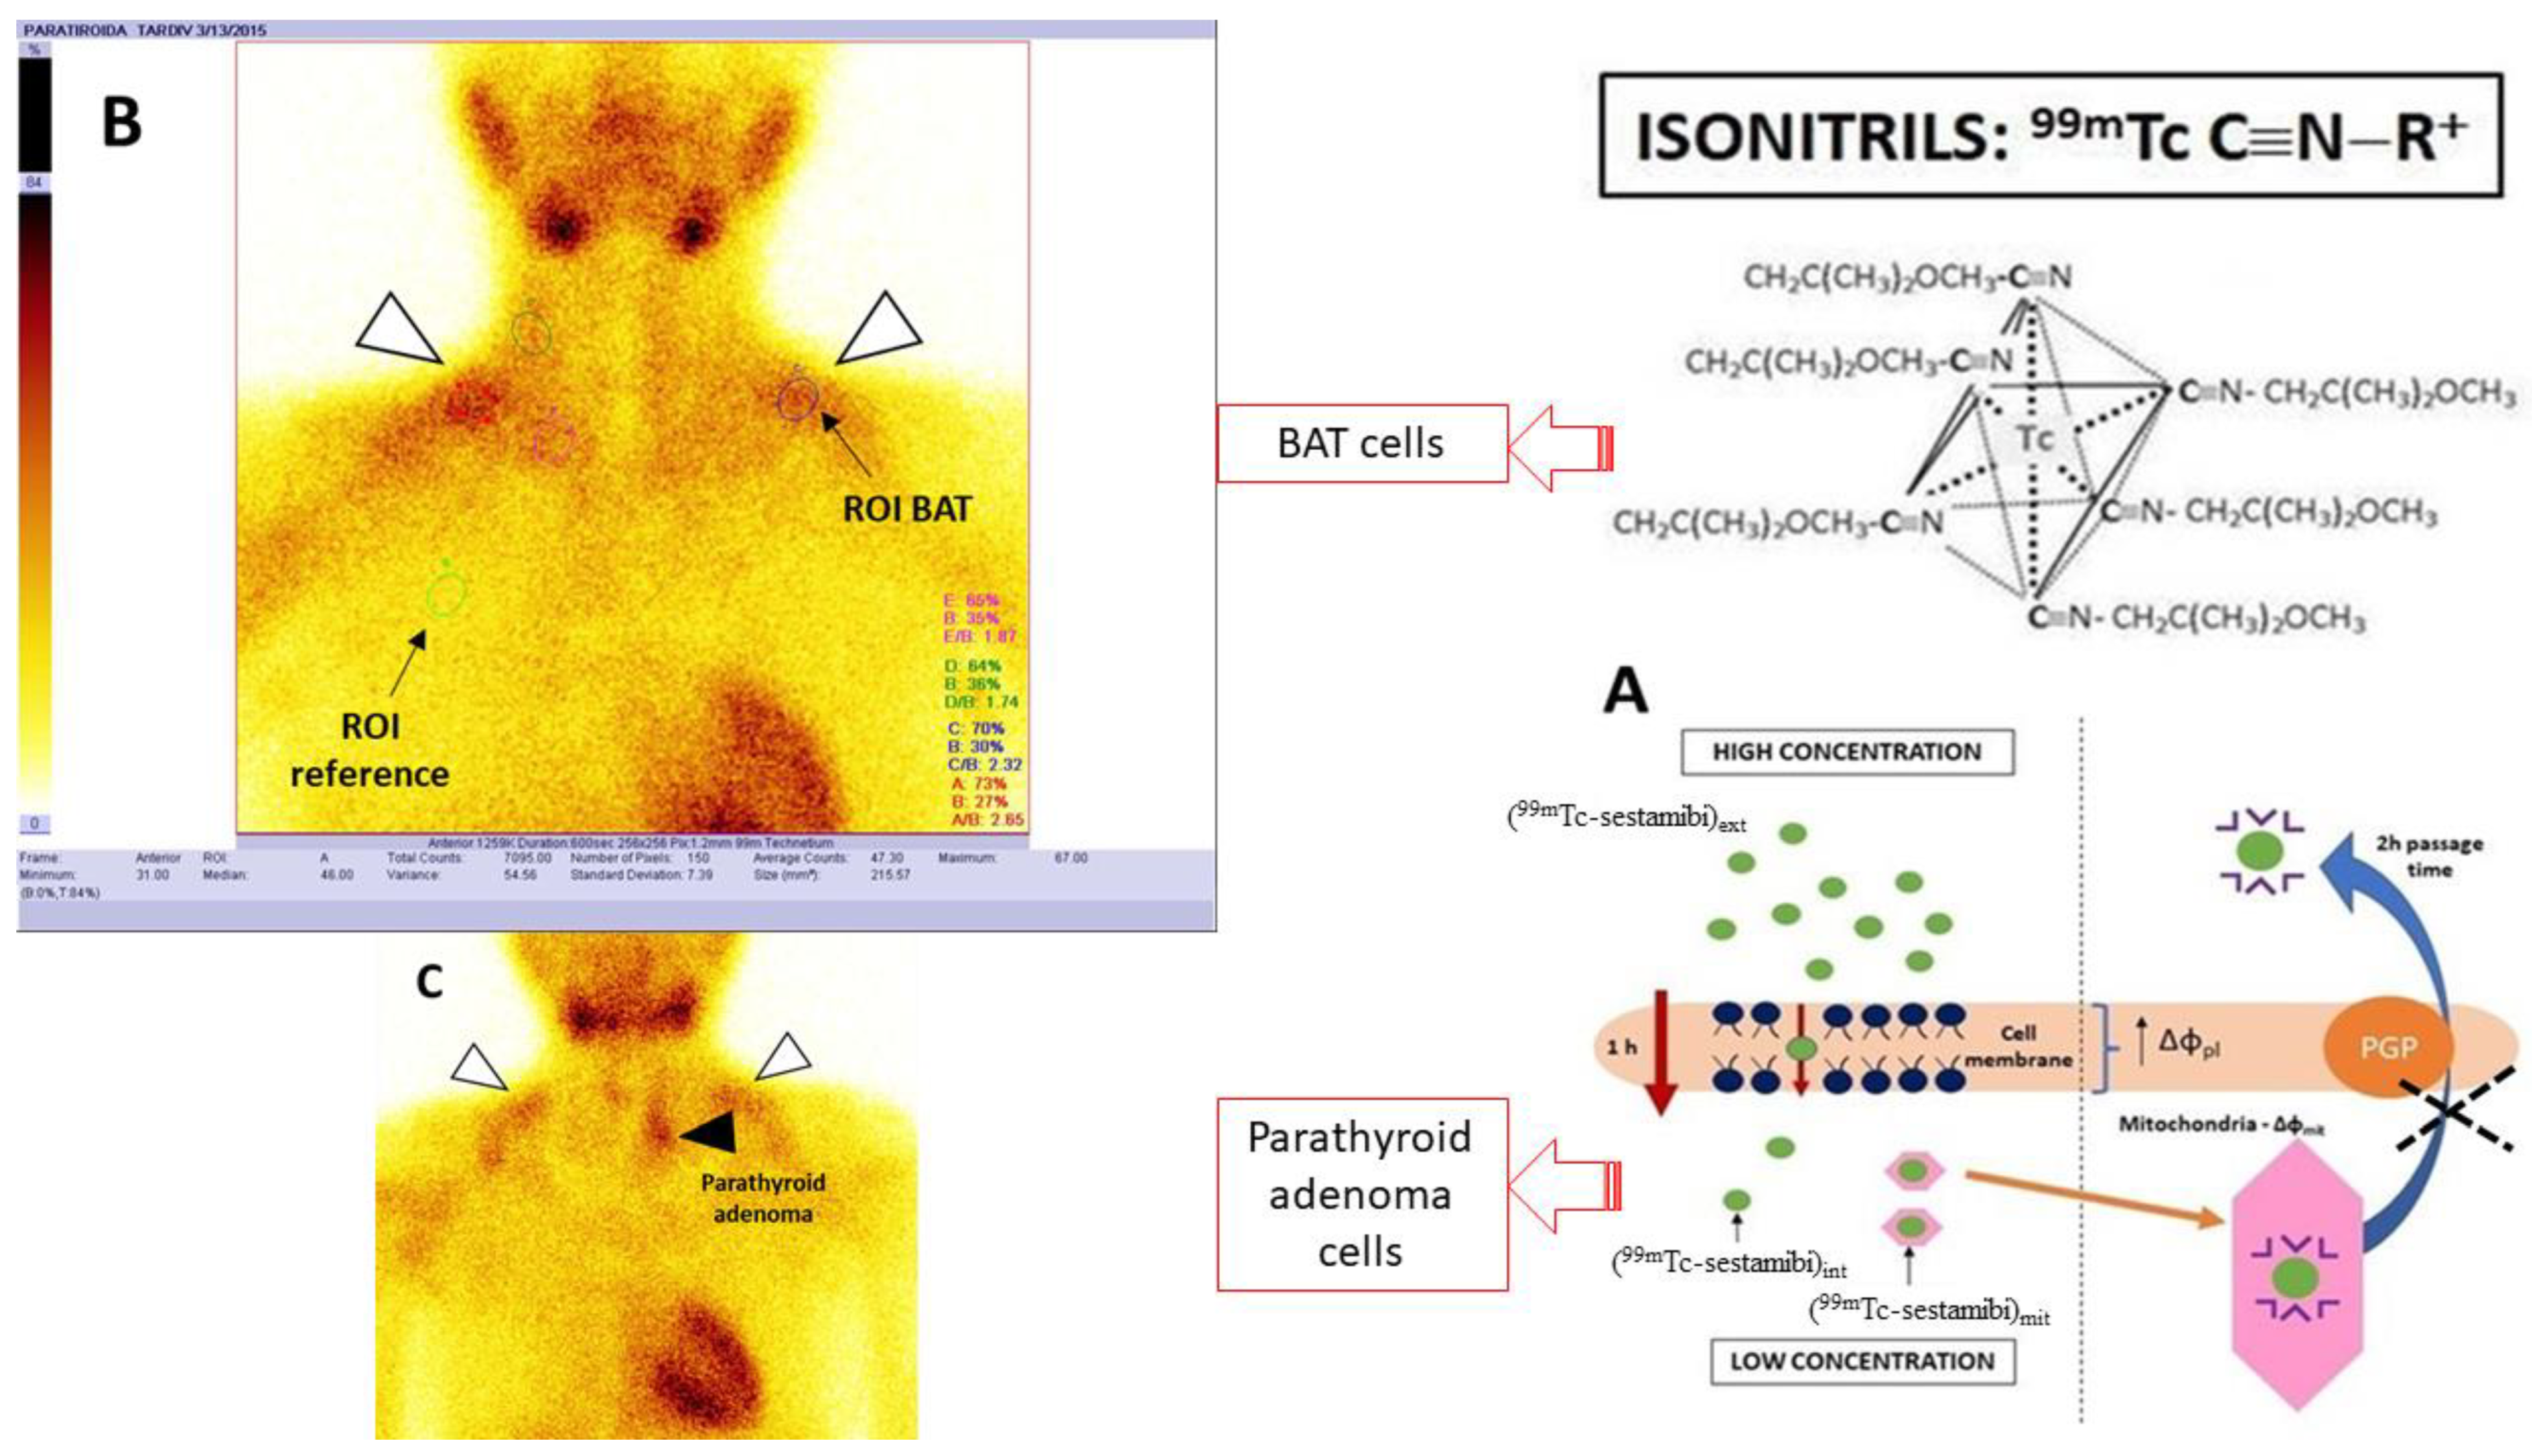
- Image processing and interpretation (Figure 1)
- Statistical Analysis
3. Results
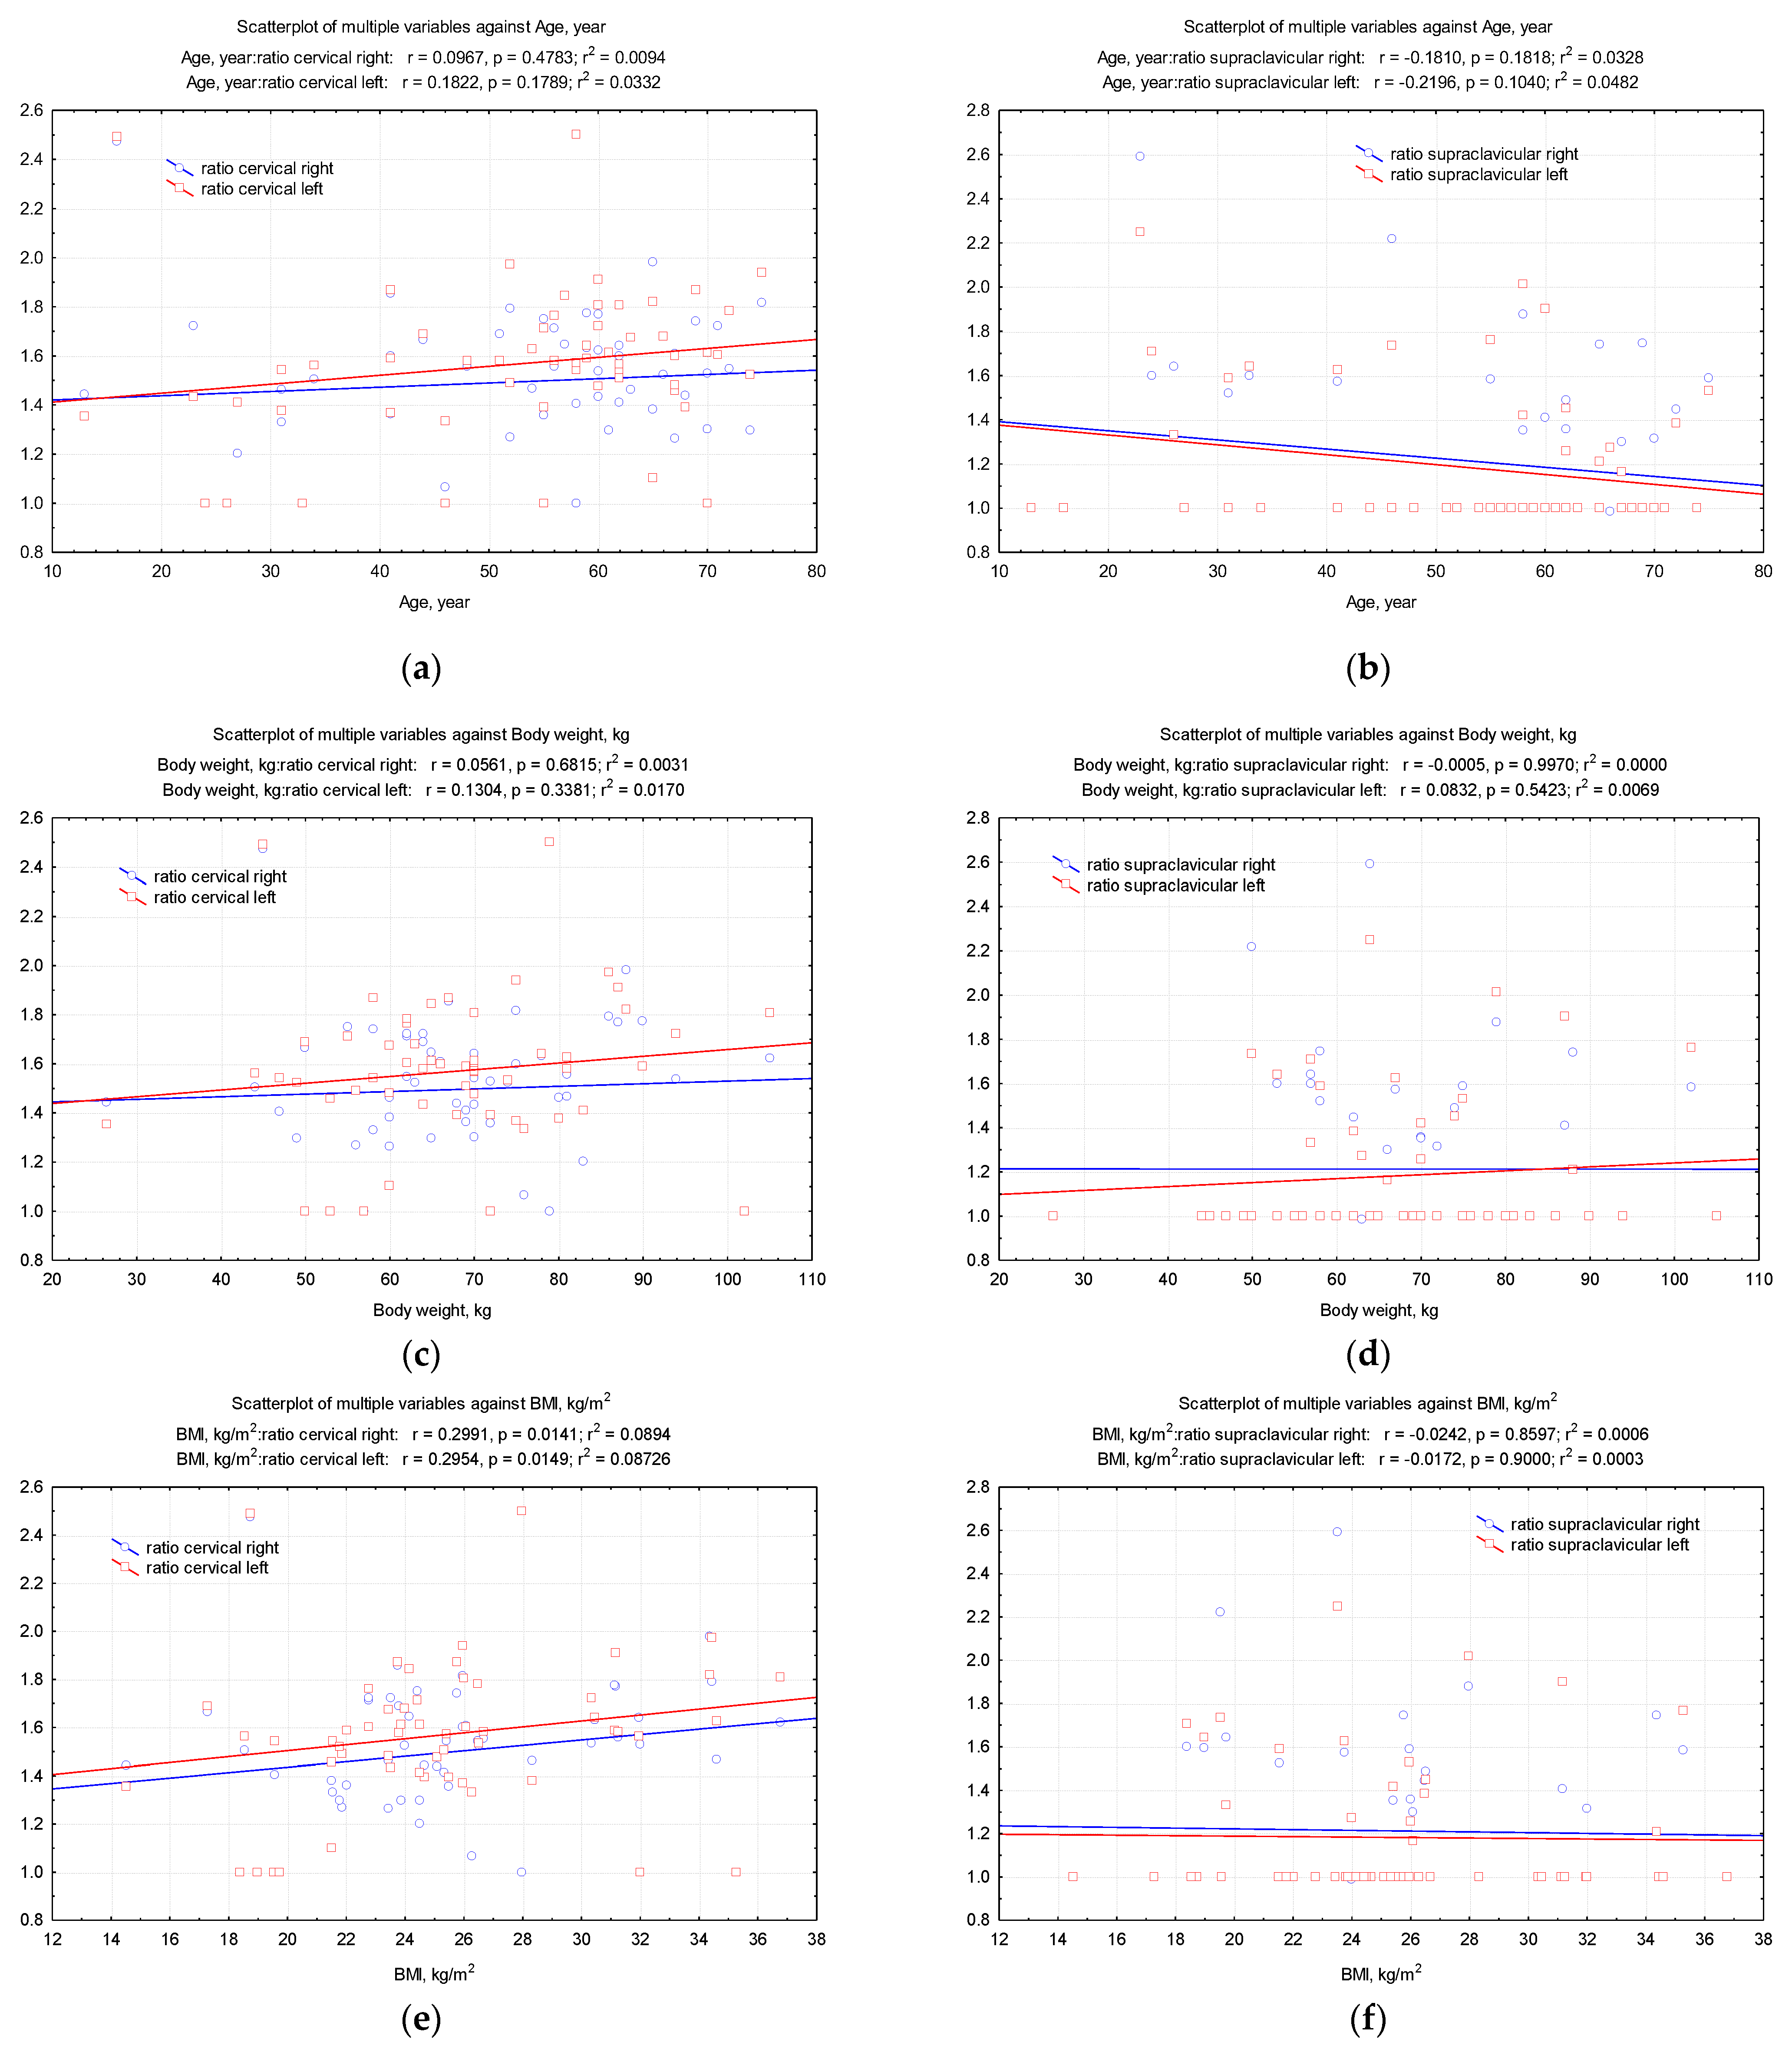
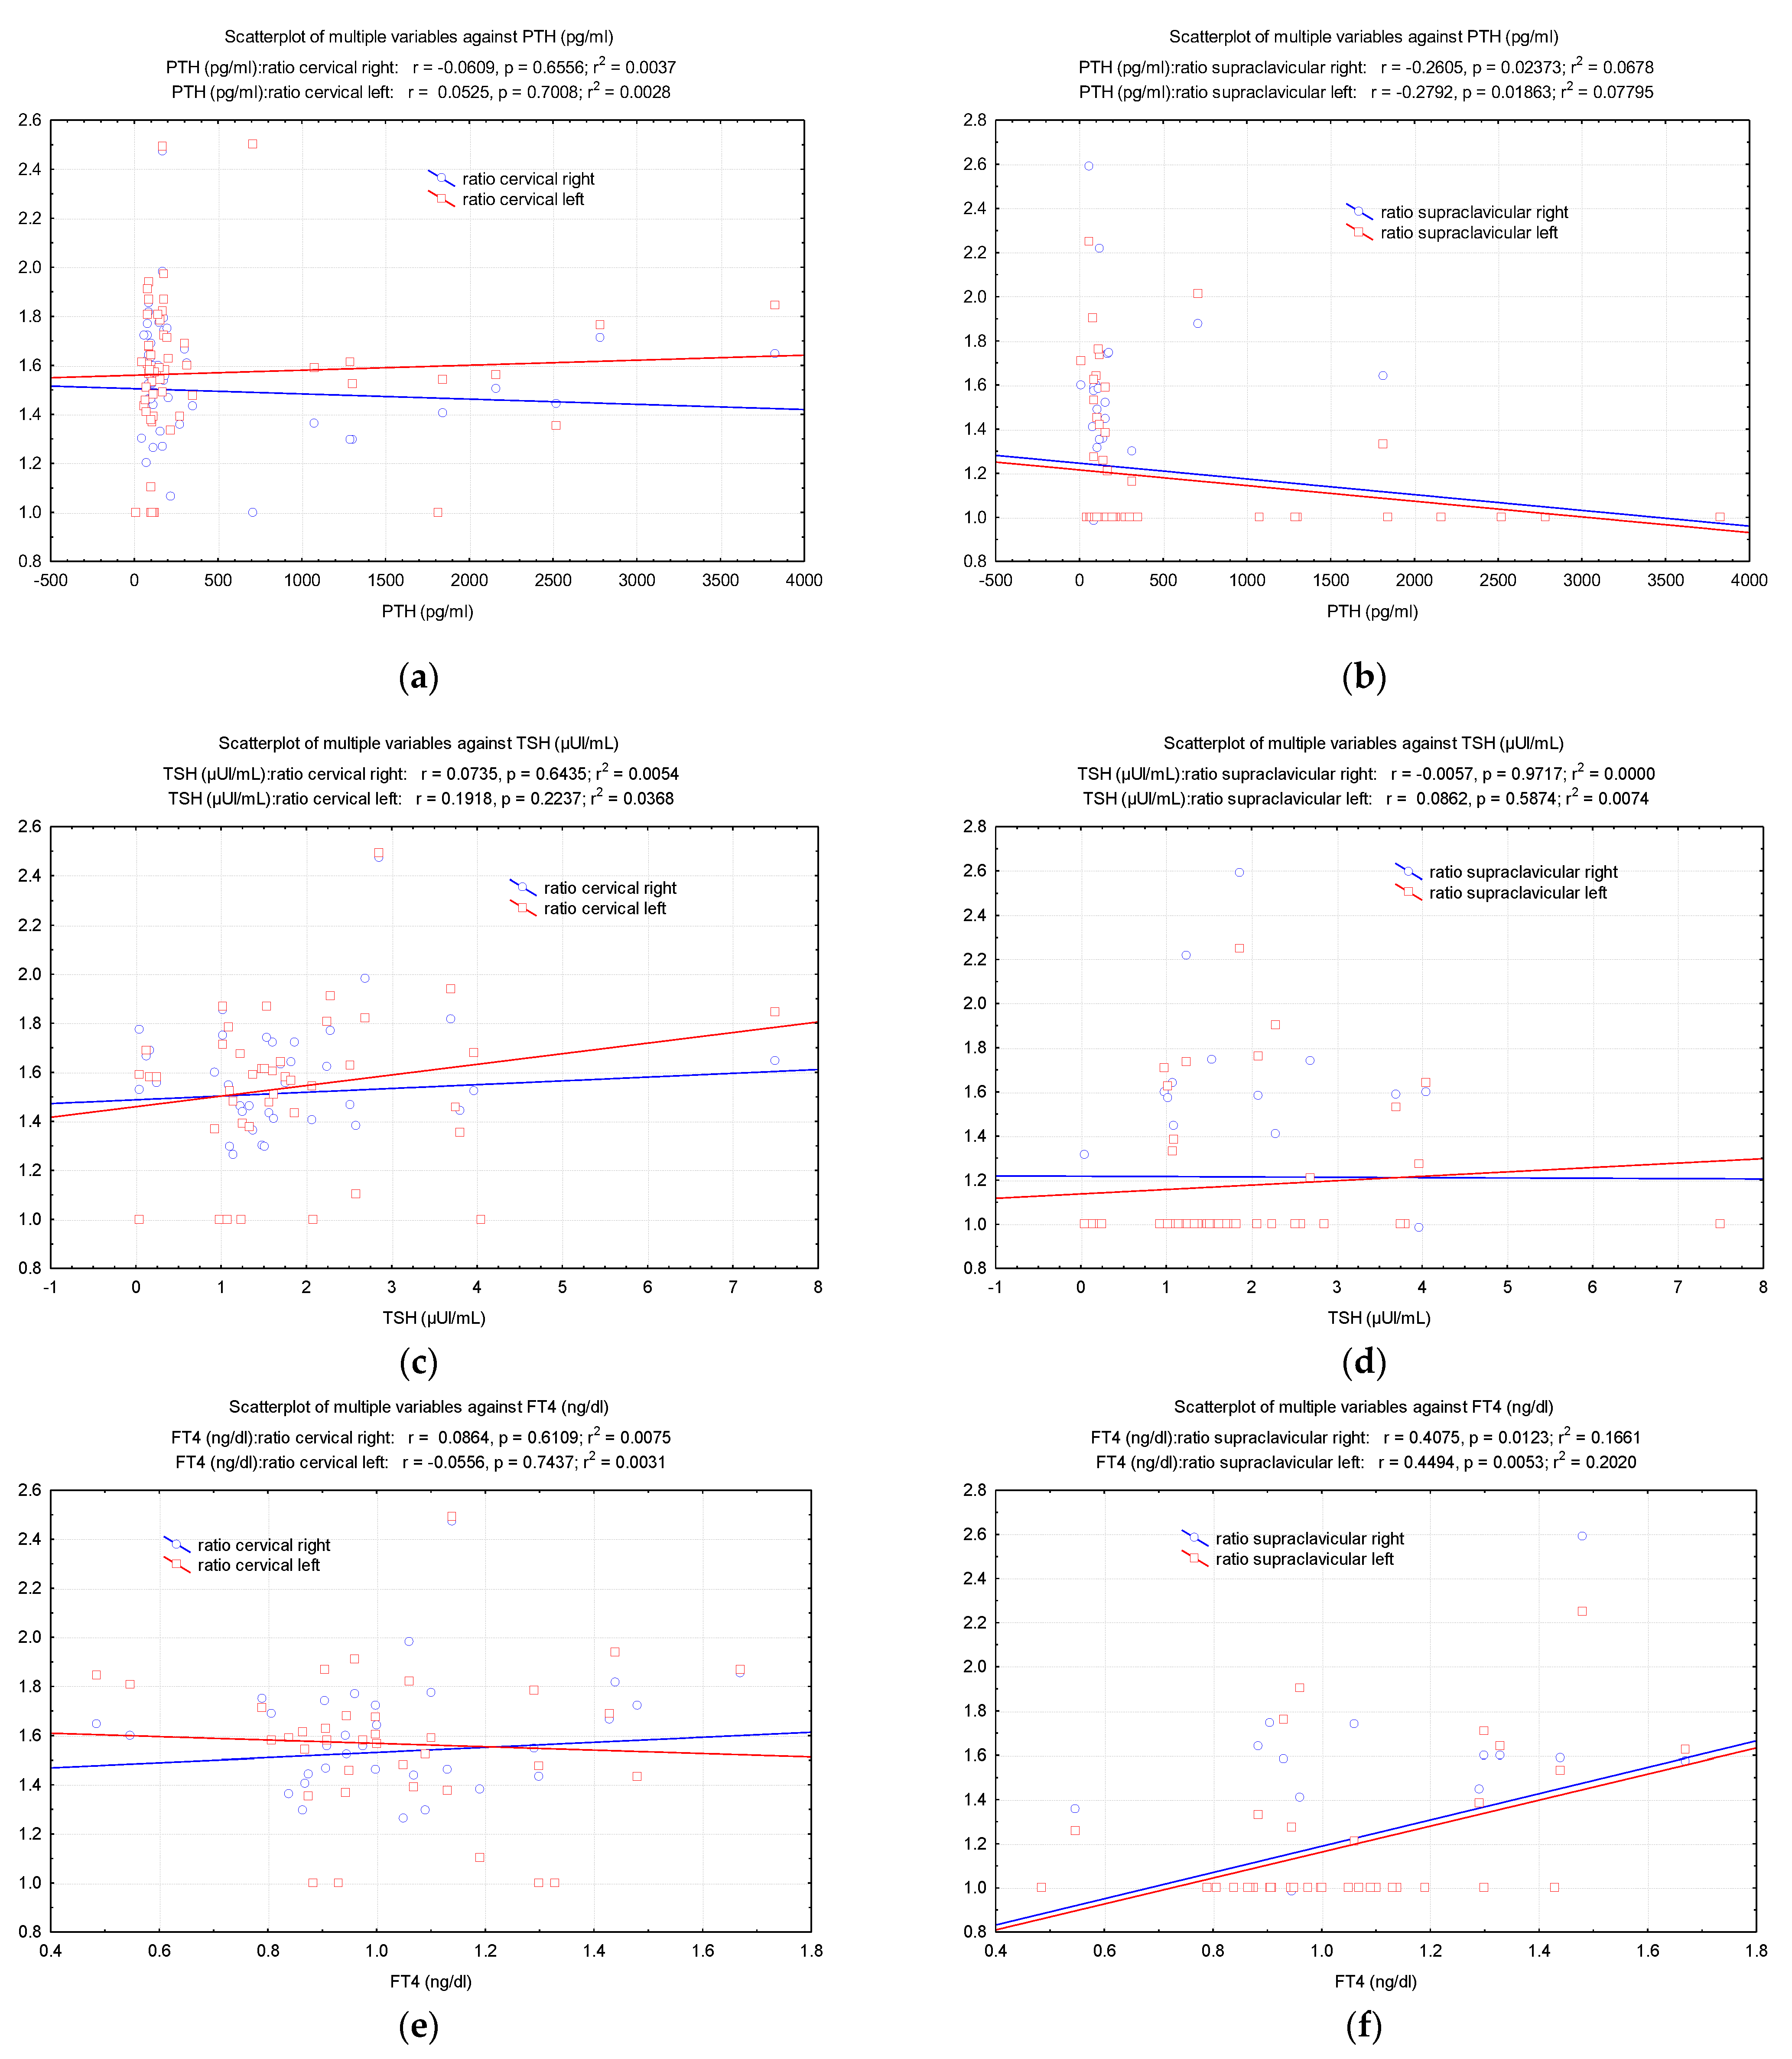
4. Discussion
5. Conclusions
Author Contributions
Funding
Institutional Review Board Statement
Informed Consent Statement
Data Availability Statement
Acknowledgments
Conflicts of Interest
References
- Messa, P.; Alfieri, C.M. Secondary and Tertiary Hyperparathyroidism. Front. Horm. Res. 2019, 51, 91–108. [Google Scholar] [PubMed]
- Bilezikian, J.P.; Bandeira, L.; Khan, A.; Cusano, N.E. Hyperparathyroidism. Lancet 2018, 391, 168–178. [Google Scholar] [CrossRef] [PubMed]
- Hill, N.R.; Fatoba, S.T.; Oke, J.L.; Hirst, J.A.; O’Callaghan, C.A.; Lasserson, D.S.; Hobbs, F.D. Global Prevalence of Chronic Kidney Disease—A Systematic Review and Meta-Analysis. PLoS ONE 2016, 11, e0158765. [Google Scholar] [CrossRef] [Green Version]
- van der Plas, W.Y.; Noltes, M.E.; van Ginhoven, T.M.; Kruijff, S. Secondary and Tertiary Hyperparathyroidism: A Narrative Review. Scand. J. Surg. 2020, 109, 271–278. [Google Scholar] [CrossRef] [Green Version]
- Levin, A.; Bakris, G.L.; Molitch, M.; Smulders, M.; Tian, J.; Williams, L.A.; Andress, D.L. Prevalence of abnormal serum vitamin D, PTH, calcium, and phosphorus in patients with chronic kidney disease: Results of the study to evaluate early kidney disease. Kidney Int. 2007, 71, 31–38. [Google Scholar] [CrossRef] [Green Version]
- Adam, M.A.; Untch, B.R.; Danko, M.E.; Stinnett, S.; Dixit, D.; Koh, J.; Marks, J.R.; Olson, J.A., Jr. Severe obesity is associated with symptomatic presentation, higher parathyroid hormone levels, and increased gland weight in primary hyperparathyroidism. J. Clin. Endocrinol. Metab. 2010, 95, 4917–4924. [Google Scholar] [CrossRef] [PubMed] [Green Version]
- Grey, A.B.; Evans, M.C.; Stapleton, J.P.; Reid, I.R. Body weight and bone mineral density in postmenopausal women with primary hyperparathyroidism. Ann. Intern. Med. 1994, 21, 745–749. [Google Scholar] [CrossRef] [PubMed]
- Vijgen, G.H.; Sparks, L.M.; Bouvy, N.D.; Schaart, G.; Hoeks, J.; van Marken Lichtenbelt, W.D.; Schrauwen, P. Increased oxygen consumption in human adipose tissue from the “brown adipose tissue” region. J. Clin. Endocrinol. Metab. 2013, 98, E1230–E1234. [Google Scholar] [CrossRef] [Green Version]
- Blondin, D.P.; Labbé, S.M.; Tingelstad, H.C.; Noll, C.; Kunach, M.; Phoenix, S.; Guérin, B.; Turcotte, E.E.; Carpentier, A.C.; Richard, D.; et al. Increased brown adipose tissue oxidative capacity in cold-acclimated humans. J. Clin. Endocrinol. Metab. 2014, 99, E438–E446. [Google Scholar] [CrossRef] [Green Version]
- Niemann, B.; Haufs-Brusberg, S.; Puetz, L.; Feickert, M.; Jaeckstein, M.Y.; Hoffmann, A.; Zurkovic, J.; Heine, M.; Trautmann, E.M.; Müller, C.E.; et al. Apoptotic brown adipocytes enhance energy expenditure via extracellular inosine. Nature 2022, 609, 361–368. [Google Scholar] [CrossRef]
- Kajimura, S.; Spiegelman, B.M.; Seale, P. Brown and Beige Fat: Physiological Roles beyond Heat Generation. Cell Metab. 2015, 22, 546–559. [Google Scholar] [CrossRef] [PubMed] [Green Version]
- Scheele, C.; Wolfrum, C. Brown Adipose Crosstalk in Tissue Plasticity and Human Metabolism. Endocr. Rev. 2019, 41, 53–65. [Google Scholar] [CrossRef] [PubMed] [Green Version]
- Becher, T.; Palanisamy, S.; Kramer, D.J.; Eljalby, M.; Marx, S.J.; Wibmer, A.G.; Butler, S.D.; Jiang, C.S.; Vaughan, R.; Schöder, H.; et al. Brown adipose tissue is associated with cardiometabolic health. Nat. Med. 2021, 27, 58–65. [Google Scholar] [CrossRef] [PubMed]
- Cannon, B.; Nedergaard, J. Brown adipose tissue: Function and physiological significance. Physiol. Rev. 2004, 84, 277–359. [Google Scholar] [CrossRef]
- Cypess, A.M.; Doyle, A.N.; Sass, C.A.; Huang, T.L.; Mowschenson, P.M.; Rosen, H.N.; Tseng, Y.H.; Palmer, E.L., 3rd; Kolodny, G.M. Quantification of human and rodent brown adipose tissue function using 99mTc-methoxyisobutylisonitrile SPECT/CT and 18F-FDG PET/CT. J. Nucl. Med. 2013, 54, 1896–1901. [Google Scholar] [CrossRef] [Green Version]
- Klaus, S.; Ely, M.; Encke, D.; Heldmaier, G. Functional assessment of white and brown adipocyte development and energy metabolism in cell culture. Dissociation of terminal differentiation and thermogenesis in brown adipocytes. J. Cell Sci. 1995, 108, 3171–3180. [Google Scholar] [CrossRef]
- Klaus, S. Functional differentiation of white and brown adipocytes. Bioessays 1997, 19, 215–223. [Google Scholar] [CrossRef]
- Madar, I.; Isoda, T.; Finley, P.; Angle, J.; Wahl, R. 18F-fluorobenzyl triphenyl phosphonium: A noninvasive sensor of brown adipose tissue thermogenesis. J. Nucl. Med. 2011, 52, 808–814. [Google Scholar] [CrossRef] [Green Version]
- Sampath, S.C.; Sampath, S.C.; Bredella, M.A.; Cypess, A.M.; Torriani, M. Imaging of Brown Adipose Tissue: State of the Art. Radiology 2016, 280, 4–19. [Google Scholar] [CrossRef] [Green Version]
- Gifford, A.; Towse, T.F.; Walker, R.C.; Avison, M.J.; Welch, E.B. Characterizing active and inactive brown adipose tissue in adult humans using PET-CT and MR imaging. Am. J. Physiol. Endocrinol. Metab. 2016, 311, 95–104. [Google Scholar] [CrossRef]
- Lee, M.W.; Lee, M.; Oh, K.J. Adipose Tissue-Derived Signatures for Obesity and Type 2 Diabetes: Adipokines, Batokines and MicroRNAs. J. Clin. Med. 2019, 8, 854. [Google Scholar] [CrossRef] [PubMed] [Green Version]
- Poekes, L.; Lanthier, N.; Leclercq, I.A. Brown adipose tissue: A potential target in the fight against obesity and the metabolic syndrome. Clin. Sci. 2015, 129, 933–949. [Google Scholar] [CrossRef] [PubMed]
- Zeng, M.; Liu, W.; Zha, X.; Tang, S.; Liu, J.; Yang, G.; Mao, H.; Yu, X.; Sun, B.; Zhang, B.; et al. 99mTc-MIBI SPECT/CT imaging had high sensitivity in accurate localization of parathyroids before parathyroidectomy for patients with secondary hyperparathyroidism. Ren. Fail. 2019, 41, 885–892. [Google Scholar] [CrossRef] [Green Version]
- Duvall, W.L.; Case, J.; Lundbye, J.; Cerqueira, M. Efficiency of tetrofosmin versus sestamibi achieved through shorter injection-to-imaging times: A systematic review of the literature. J. Nucl. Cardiol. 2021, 28, 1381–1394. [Google Scholar] [CrossRef] [PubMed] [Green Version]
- Ovčariček, P.P.; Giovanella, L.; Gasset, I.C.; Hindié, E.; Huellner, M.W.; Luster, M.; Piccardo, A.; Weber, T.; Talbot, J.N.; Verburg, F.A. The EANM practice guidelines for parathyroid imaging. Eur. J. Nucl. Med. Mol. Imaging 2021, 48, 2801–2822. [Google Scholar] [CrossRef]
- Maublant, J.C.; Moins, N.; Gachon, P.; Renoux, M.; Zhang, Z.; Veyre, A. Uptake of technetium-99m-teboroxime in cultured myocardial cells: Comparison with thallium-201 and technetium-99m-sestamibi. J. Nucl. Med. 1993, 34, 255–259. [Google Scholar]
- Arbab, A.S.; Koizumi, K.; Toyama, K.; Araki, T. Uptake of technetium-99m-tetrofosmin, technetium-99m-MIBI and thallium-201 in tumor cell lines. J. Nucl. Med. 1996, 37, 1551–1556. [Google Scholar]
- de Jong, M.; Bernard, B.F.; Breeman, W.A.; Ensing, G.; Benjamins, H.; Bakker, W.H.; Visser, T.J.; Krenning, E.P. Comparison of uptake of 99mTc-MIBI, 99mTc-tetrofosmin and 99mTc-Q12 into human breast cancer cell lines. Eur. J. Nucl. Med. 1996, 23, 1361–1366. [Google Scholar] [CrossRef] [Green Version]
- Wackers, F.J.; Berman, D.S.; Maddahi, J.; Watson, D.D.; Beller, G.A.; Strauss, H.W.; Boucher, C.A.; Picard, M.; Holman, B.L.; Fridrich, R. Technetium-99m hexakis 2-methoxyisobutyl isonitrile:human biodistribution, dosimetry, safety, and preliminary comparison to thallium-201 for myocardial perfusion imaging. J. Nucl. Med. 1989, 30, 301–311. [Google Scholar]
- Marshall, R.C.; Leidholdt, E.M., Jr.; Zhang, D.Y.; Barnett, C.A. Technetium-99m hexakis 2-methoxy-2isobutyl isonitrile and thallium-201 extraction, washout, and retention at varying coronary flow rates in rabbit heart. Circulation 1990, 82, 998–1007. [Google Scholar] [CrossRef] [Green Version]
- Belhocine, T.; Shastry, A.; Driedger, A.; Urbain, J.L. Detection of 99mTc-sestamibi uptake in brown adipose tissue with SPECT-CT. Eur. J. Nucl. Med. Mol. Imaging. 2007, 34, 149. [Google Scholar] [CrossRef] [PubMed]
- Moon, S.H.; Lee, Y.S.; Lee, D.S.; Chung, J.K.; Jeong, J.M. A study of 99mTc-sestamibi labeling condition using radio-chromatography. J. Radiopharm. Mol. Probes 2017, 3, 38–43. [Google Scholar]
- Rosen, E.D.; Spiegelman, B.M. What we talk about when we talk about fat. Cell 2014, 156, 20–44. [Google Scholar] [CrossRef] [Green Version]
- Ricquier, D. Uncoupling protein 1 of brown adipocytes, the only uncoupler: A historical perspective. Front. Endocrinol. 2011, 2, 85. [Google Scholar] [CrossRef] [PubMed]
- Cypess, A.M.; Kahn, C.R. Brown fat as a therapy for obesity and diabetes. Curr. Opin. Endocrinol. Diabetes. Ob. 2010, 17, 143–149. [Google Scholar] [CrossRef] [Green Version]
- Bolland, M.J.; Grey, A.B.; Gamble, G.D.; Reid, I.R. Association between primary hyperparathyroidism and increased body weight: A meta-analysis. J. Clin. Endocrinol. Metab. 2005, 90, 1525–1530. [Google Scholar] [CrossRef] [Green Version]
- Cypess, A.M.; Lehman, S.; Williams, G.; Tal, I.; Rodman, D.; Goldfine, A.B.; Kuo, F.C.; Palmer, E.L.; Tseng, Y.H.; Doria, A.; et al. Identification and importance of brown adipose tissue in adult humans. N. Engl. J. Med. 2009, 360, 1509–1517. [Google Scholar] [CrossRef] [Green Version]
- van Marken Lichtenbelt, W.D.; Vanhommerig, J.W.; Smulders, N.M.; Drossaerts, J.M.; Kemerink, G.J.; Bouvy, N.D.; Schrauwen, P.; Teule, G.J. Cold activated brown adipose tissue in healthy men. N. Engl. J. Med. 2009, 360, 1500–1508. [Google Scholar] [CrossRef] [Green Version]
- Saito, M.; Okamatsu-Ogura, Y.; Matsushita, M.; Watanabe, K.; Yoneshiro, T.; Nio-Kobayashi, J.; Iwanaga, T.; Miyagawa, M.; Kameya, T.; Nakada, K.; et al. High incidence of metabolically active brown adipose tissue in healthy adult humans: Effects of cold exposure and adiposity. Diabetes. 2009, 58, 1526–1531. [Google Scholar] [CrossRef] [Green Version]
- Admiraal, W.M.; Holleman, F.; Bahler, L.; Soeters, M.R.; Hoekstra, J.B.; Verberne, H.J. Combining 123I-metaiodobenzylguanidine SPECT/CT and 18F-FDG PET/CT for the assessment of brown adipose tissue activity in humans during cold exposure. J. Nucl. Med. 2013, 54, 208–212. [Google Scholar] [CrossRef] [Green Version]
- Ouellet, V.; Labbe, S.M.; Blondin, D.P.; Phoenix, S.; Guérin, B.; Haman, F.; Turcotte, E.E.; Richard, D.; Carpentier, A.C. Brown adipose tissue oxidative metabolism contributes to energy expenditure during acute cold exposure in humans. J. Clin. Investig. 2012, 122, 545–552. [Google Scholar] [CrossRef] [PubMed]
- Orava, J.; Nuutila, P.; Lidell, M.E.; Oikonen, V.; Noponen, T.; Viljanen, T.; Scheinin, M.; Taittonen, M.; Niemi, T.; Enerbäck, S.; et al. Different metabolic responses of human brown adipose tissue to activation by cold and insulin. Cell Metab. 2011, 14, 272–279. [Google Scholar] [CrossRef] [PubMed] [Green Version]
- Hadi, M.; Chen, C.C.; Whatley, M.; Pacak, K.; Carrasquillo, J.A. Brown fat imaging with (18)F-6-fluorodopamine PET/CT, (18)F-FDG PET/CT, and (123)I-MIBG SPECT: A study of patients being evaluated for pheochromocytoma. J. Nucl. Med. 2007, 48, 1077–1083. [Google Scholar] [CrossRef] [PubMed] [Green Version]
- Izzi-Engbeaya, C.; Salem, V.; Atkar, R.S.; Dhillo, W.S. Insights into Brown Adipose Tissue Physiology as Revealed by Imaging Studies. Adipocyte 2014, 4, 1–12. [Google Scholar] [CrossRef] [PubMed]
- Honek, J.; Lim, S.; Fischer, C.; Iwamoto, H.; Seki, T.; Cao, Y. Brown adipose tissue, thermogenesis, angiogenesis: Pathophysiological aspects. Horm. Mol. Biol. Clin. Investig. 2014, 19, 5–11. [Google Scholar] [CrossRef] [PubMed]
- Hanssen, M.J.; Wierts, R.; Hoeks, J.; Gemmink, A.; Brans, B.; Mottaghy, F.M.; Schrauwen, P.; Lichtenbelt, W.D.V.M. Glucose uptake in human brown adipose tissue is impaired upon fastinginduced insulin resistance. Diabetologia 2014, 58, 586–595. [Google Scholar] [CrossRef]
- Santhanam, P.; Solnes, L.; Hannukainen, J.C.; Taïeb, D. Adiposity-related cancer and functional imaging of brown adipose tissue. Endocr. Pract. 2015, 21, 1282–1290. [Google Scholar] [CrossRef]
- Cypess, A.M.; Weiner, L.S.; Roberts-Toler, C.; Franquet Elía, E.; Kessler, S.H.; Kahn, P.A.; English, J.; Chatman, K.; Trauger, S.A.; Doria, A.; et al. Activation of human brown adipose tissue by a b3-adrenergic receptor agonist. Cell Metab. 2015, 21, 33–38. [Google Scholar] [CrossRef] [Green Version]
- Gnad, T.; Scheibler, S.; von Kügelgen, I.; Scheele, C.; Kilić, A.; Glöde, A.; Hoffmann, L.S.; Reverte-Salisa, L.; Horn, P.; Mutlu, S.; et al. Adenosine activates brown adipose tissue and recruits beige adipocytes via A2A receptors. Nature 2014, 516, 395–399. [Google Scholar] [CrossRef]
- Jalloul, W.; Tibu, R.; Ionescu, T.M.; Stolniceanu, C.R.; Grierosu, I.; Tarca, A.; Ionescu, L.; Ungureanu, M.C.; Ciobanu, D.; Ghizdovat, V.; et al. Personalized nuclear imaging protocol in cases with nodular goiter and parathyroid adenoma. Acta. Endocrinol. 2021, 17, 393–398. [Google Scholar] [CrossRef]
- Eslamy, H.K.; Ziessman, H.A. Parathyroid scintigraphy in patients with primary hyperparathyroidism:99m Tc Sestamibi SPECT and SPECT/ CT 1. Radiographics 2008, 28, 1461–1476. [Google Scholar] [CrossRef] [PubMed] [Green Version]
- Petrovic, N.; Walden, T.B.; Shabalina, I.G.; Timmons, J.A.; Cannon, B.; Nedergaard, J. Chronic peroxisome proliferator-activated receptor gamma (PPARgamma) activation of epididymally derived white adipocyte cultures reveals a population of thermogenically competent, UCP1-containing adipocytes molecularly distinct from classic brown adipocytes. J. Biol. Chem. 2010, 285, 7153–7164. [Google Scholar] [PubMed] [Green Version]
- Vitali, A.; Murano, I.; Zingaretti, M.C.; Frontini, A.; Ricquier, D.; Cinti, S. The adipose organ of obesity-prone C57BL/6J mice is composed of mixed white and brown adipocytes. J. Lipid Res. 2012, 53, 619–629. [Google Scholar] [CrossRef] [PubMed] [Green Version]
- Seale, P.; Bjork, B.; Yang, W.; Kajimura, S.; Chin, S.; Kuang, S.; Scimè, A.; Devarakonda, S.; Conroe, H.M.; Erdjument-Bromage, H.; et al. PRDM16 controls a brown fat/skeletal muscle switch. Nature 2008, 454, 961–967. [Google Scholar] [CrossRef]
- Bilezikian, J.P.; Cusano, N.E.; Khan, A.A.; Liu, J.M.; Marcocci, C.; Bandeira, F. Primary hyperparathyroidism. Nat. Rev. Dis. Primers. 2016, 2, 16033. [Google Scholar] [CrossRef] [Green Version]
- He, Y.; Liu, R.X.; Zhu, M.T.; Shen, W.B.; Xie, J.; Zhang, Z.Y.; Chen, N.; Shan, C.; Guo, X.Z.; Lu, Y.D.; et al. The browning of white adipose tissue and body weight loss in primary hyperparathyroidism. EBioMedicine 2019, 40, 56–66. [Google Scholar] [CrossRef] [Green Version]
- Kamycheva, E.; Sundsfjord, J.; Jorde, R. Serum parathyroid hormone level is associated with body mass index. The 5th Tromsø study. Eur. J. Endocrinol. 2004, 151, 167–172. [Google Scholar] [CrossRef] [Green Version]
- Di Monaco, M.; Castiglioni, C.; Vallero, F.; Di Monaco, R.; Tappero, R. Parathyroid hormone is significantly associated with body fat compartment in men but not in women following a hip fracture. Aging Clin. Exp. Res. 2013, 25, 371–376. [Google Scholar] [CrossRef]
- Mendoza-Zubieta, V.; Gonzalez-Villaseñor, G.A.; Vargas-Ortega, G.; Gonzalez, B.; Ramirez-Renteria, C.; Mercado, M.; Molina-Ayala, M.A.; Ferreira-Hermosillo, A. High prevalence of metabolic syndrome in a mestizo group of adult patients with primary hyperparathyroidism (PHPT). BMC Endocr. Disord. 2015, 15, 16. [Google Scholar] [CrossRef] [Green Version]
- Procopio, M.; Barale, M.; Bertaina, S.; Sigrist, S.; Mazzetti, R.; Loiacono, M.; Mengozzi, G.; Ghigo, E.; Maccario, M. Cardiovascular risk and metabolic syndrome in primary hyperparathyroidism and their correlation to different clinical forms. Endocrine 2014, 47, 581–589. [Google Scholar] [CrossRef]
- Tassone, F.; Gianotti, L.; Baffoni, C.; Cesario, F.; Magro, G.; Pellegrino, M.; Emmolo, I.; Maccario, M.; Borretta, G. Prevalence and characteristics of metabolic syndrome in primary hyperparathyroidism. J. Endocrinol. Investig. 2012, 35, 841–846. [Google Scholar]


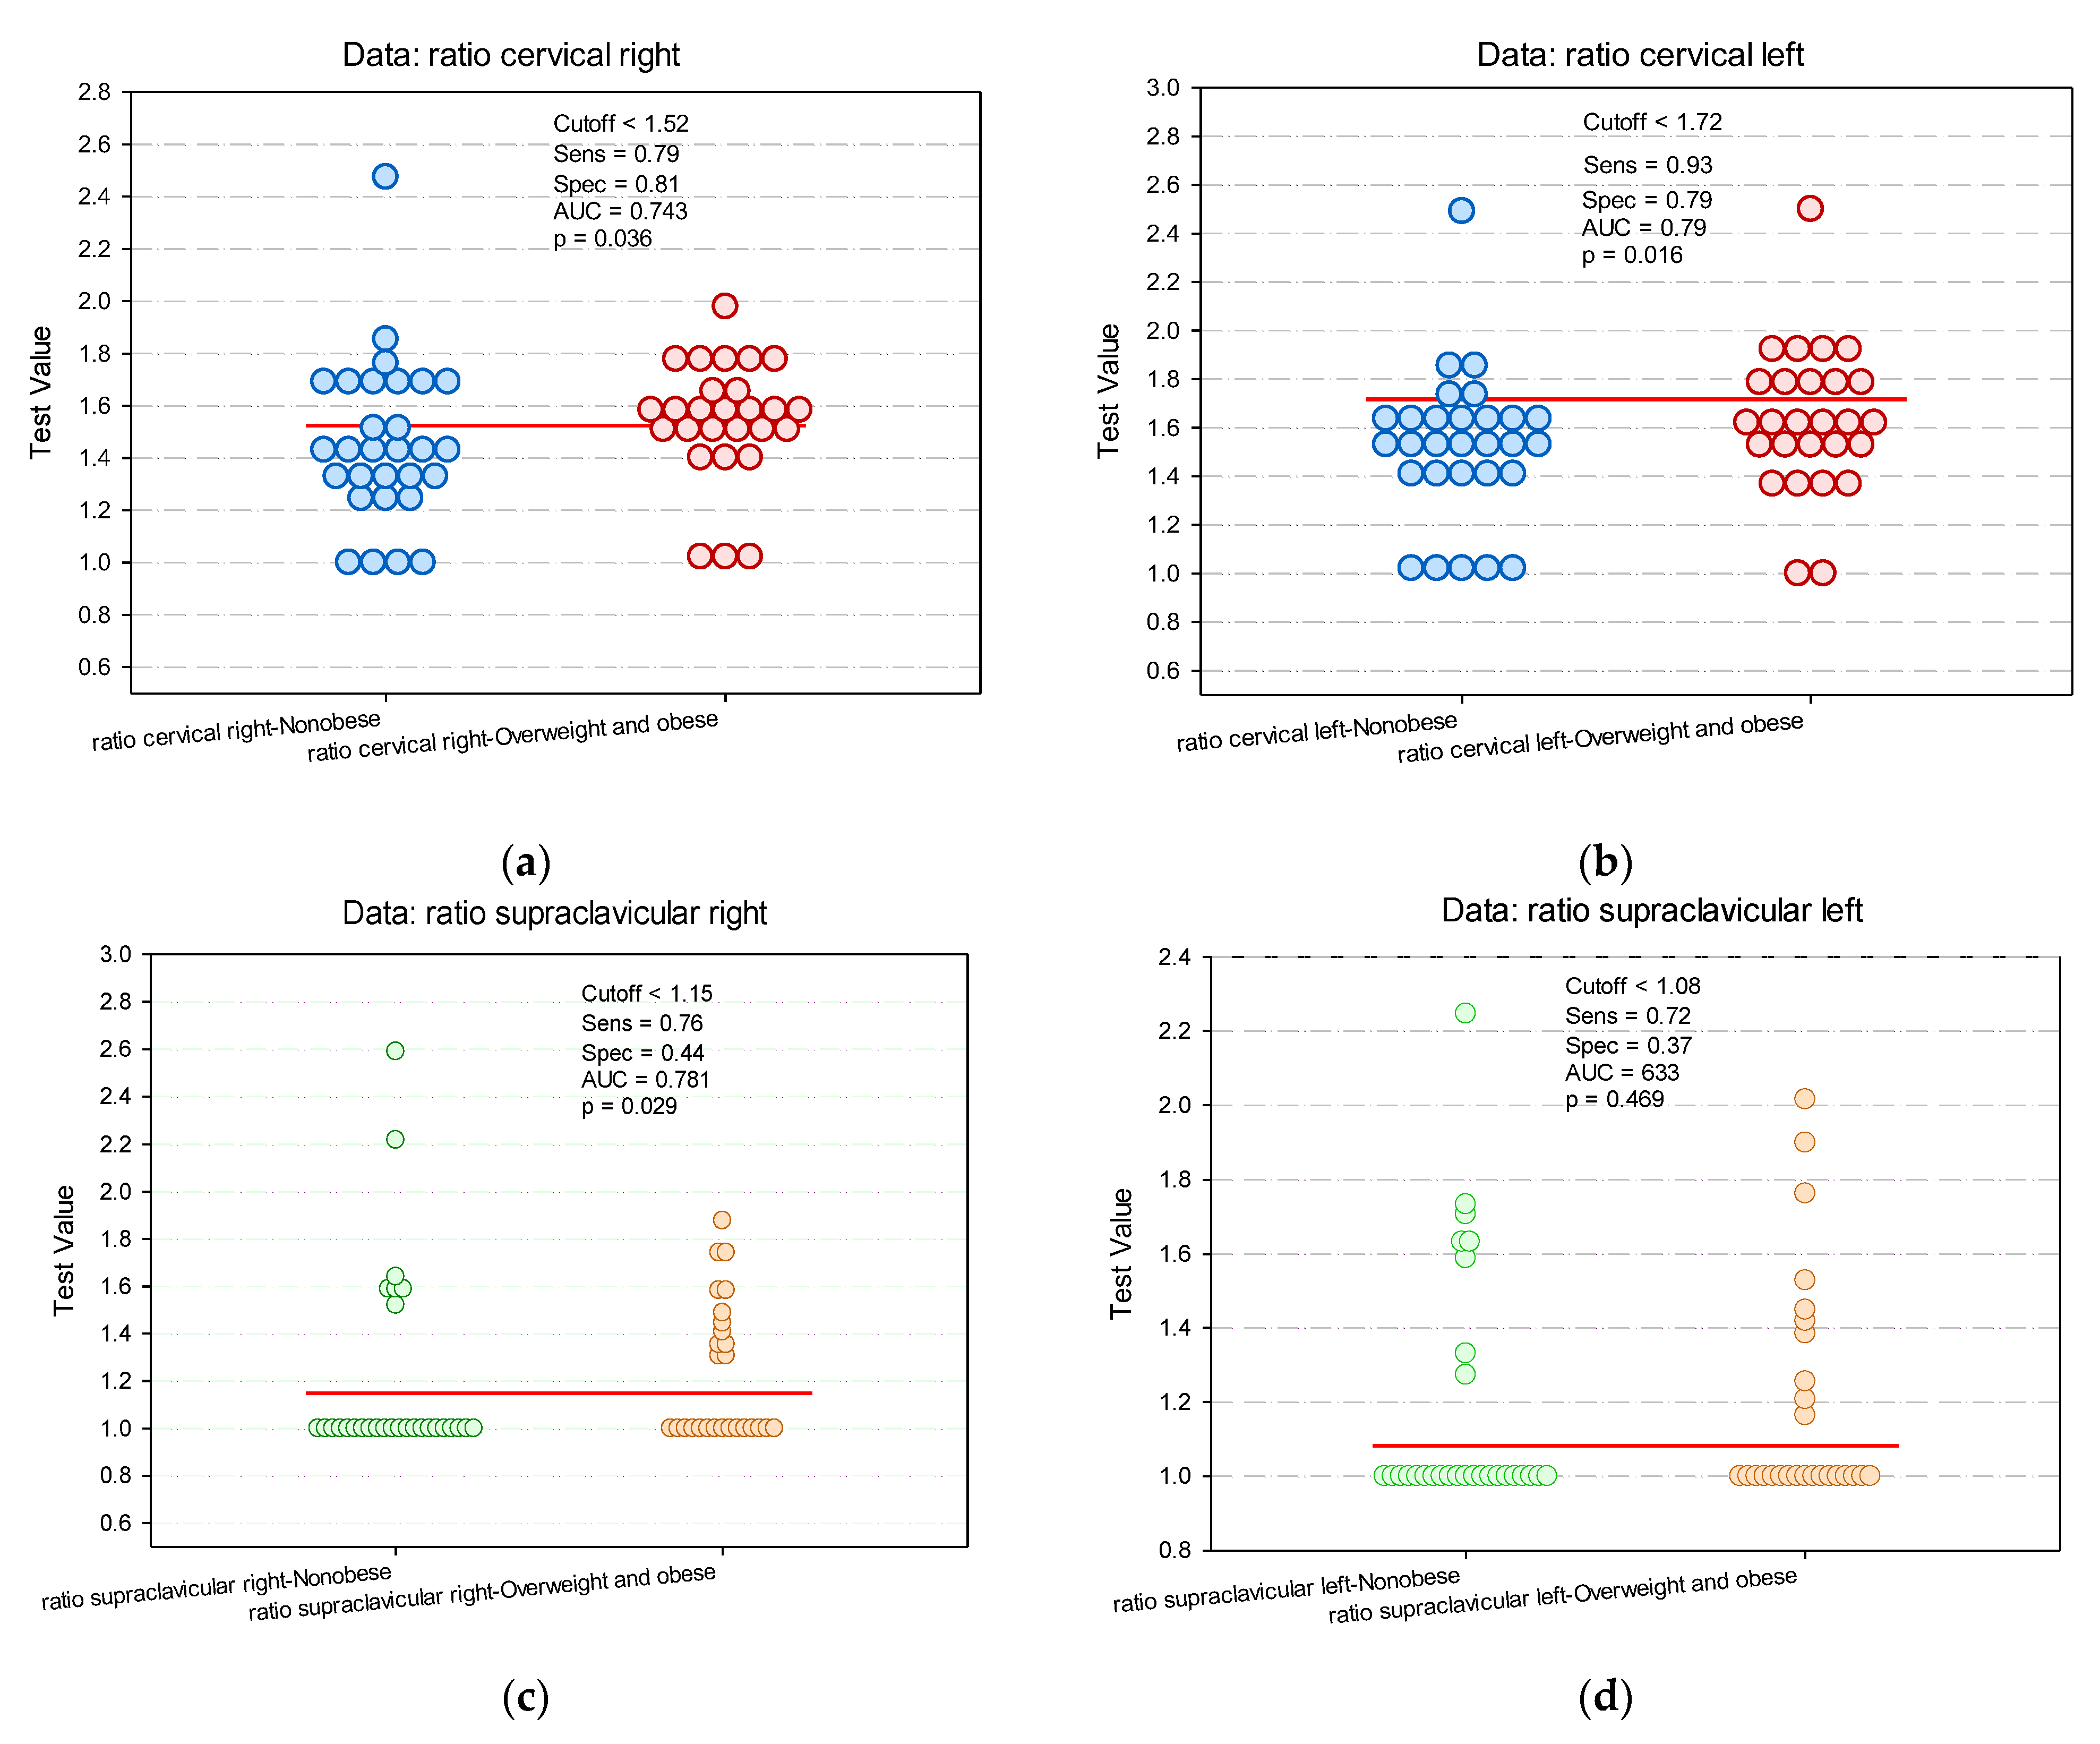
| Clinical Characteristics | Total Patients n = 56 | Nonobese Patients (BMI < 25 kg/m2) n = 29 | Overweight and Obese Patients (BMI > 25 kg/m2) n = 27 | p-Value |
|---|---|---|---|---|
| Age, median (IQR), year | 58 (45–64) | 52 (33–65) | 60 (55–62) | 0.062 * |
| Age, mean (SD), year | 58.4 (15.4) | 48.3 (18.3) | 58.4 (9.3) | |
| Gender, female/male, n (%) | 49/7 (87.5/12.5) | 23/6 (79.3/20.7) | 26/1 (96.3/3.7) | 0.043 ^ |
| Season, n (%) | ||||
| spring | 19 (33.9) | 15 (51.7) | 4 (14.8) | 0.014 ^ |
| summer | 14 (25) | 5 (17.2) | 9 (33.3) | |
| autumn | 12 (21.4) | 3 (10.4) | 9 (33.3) | |
| winter | 11 (19.6) | 6 (20.7) | 5 (18.6) | |
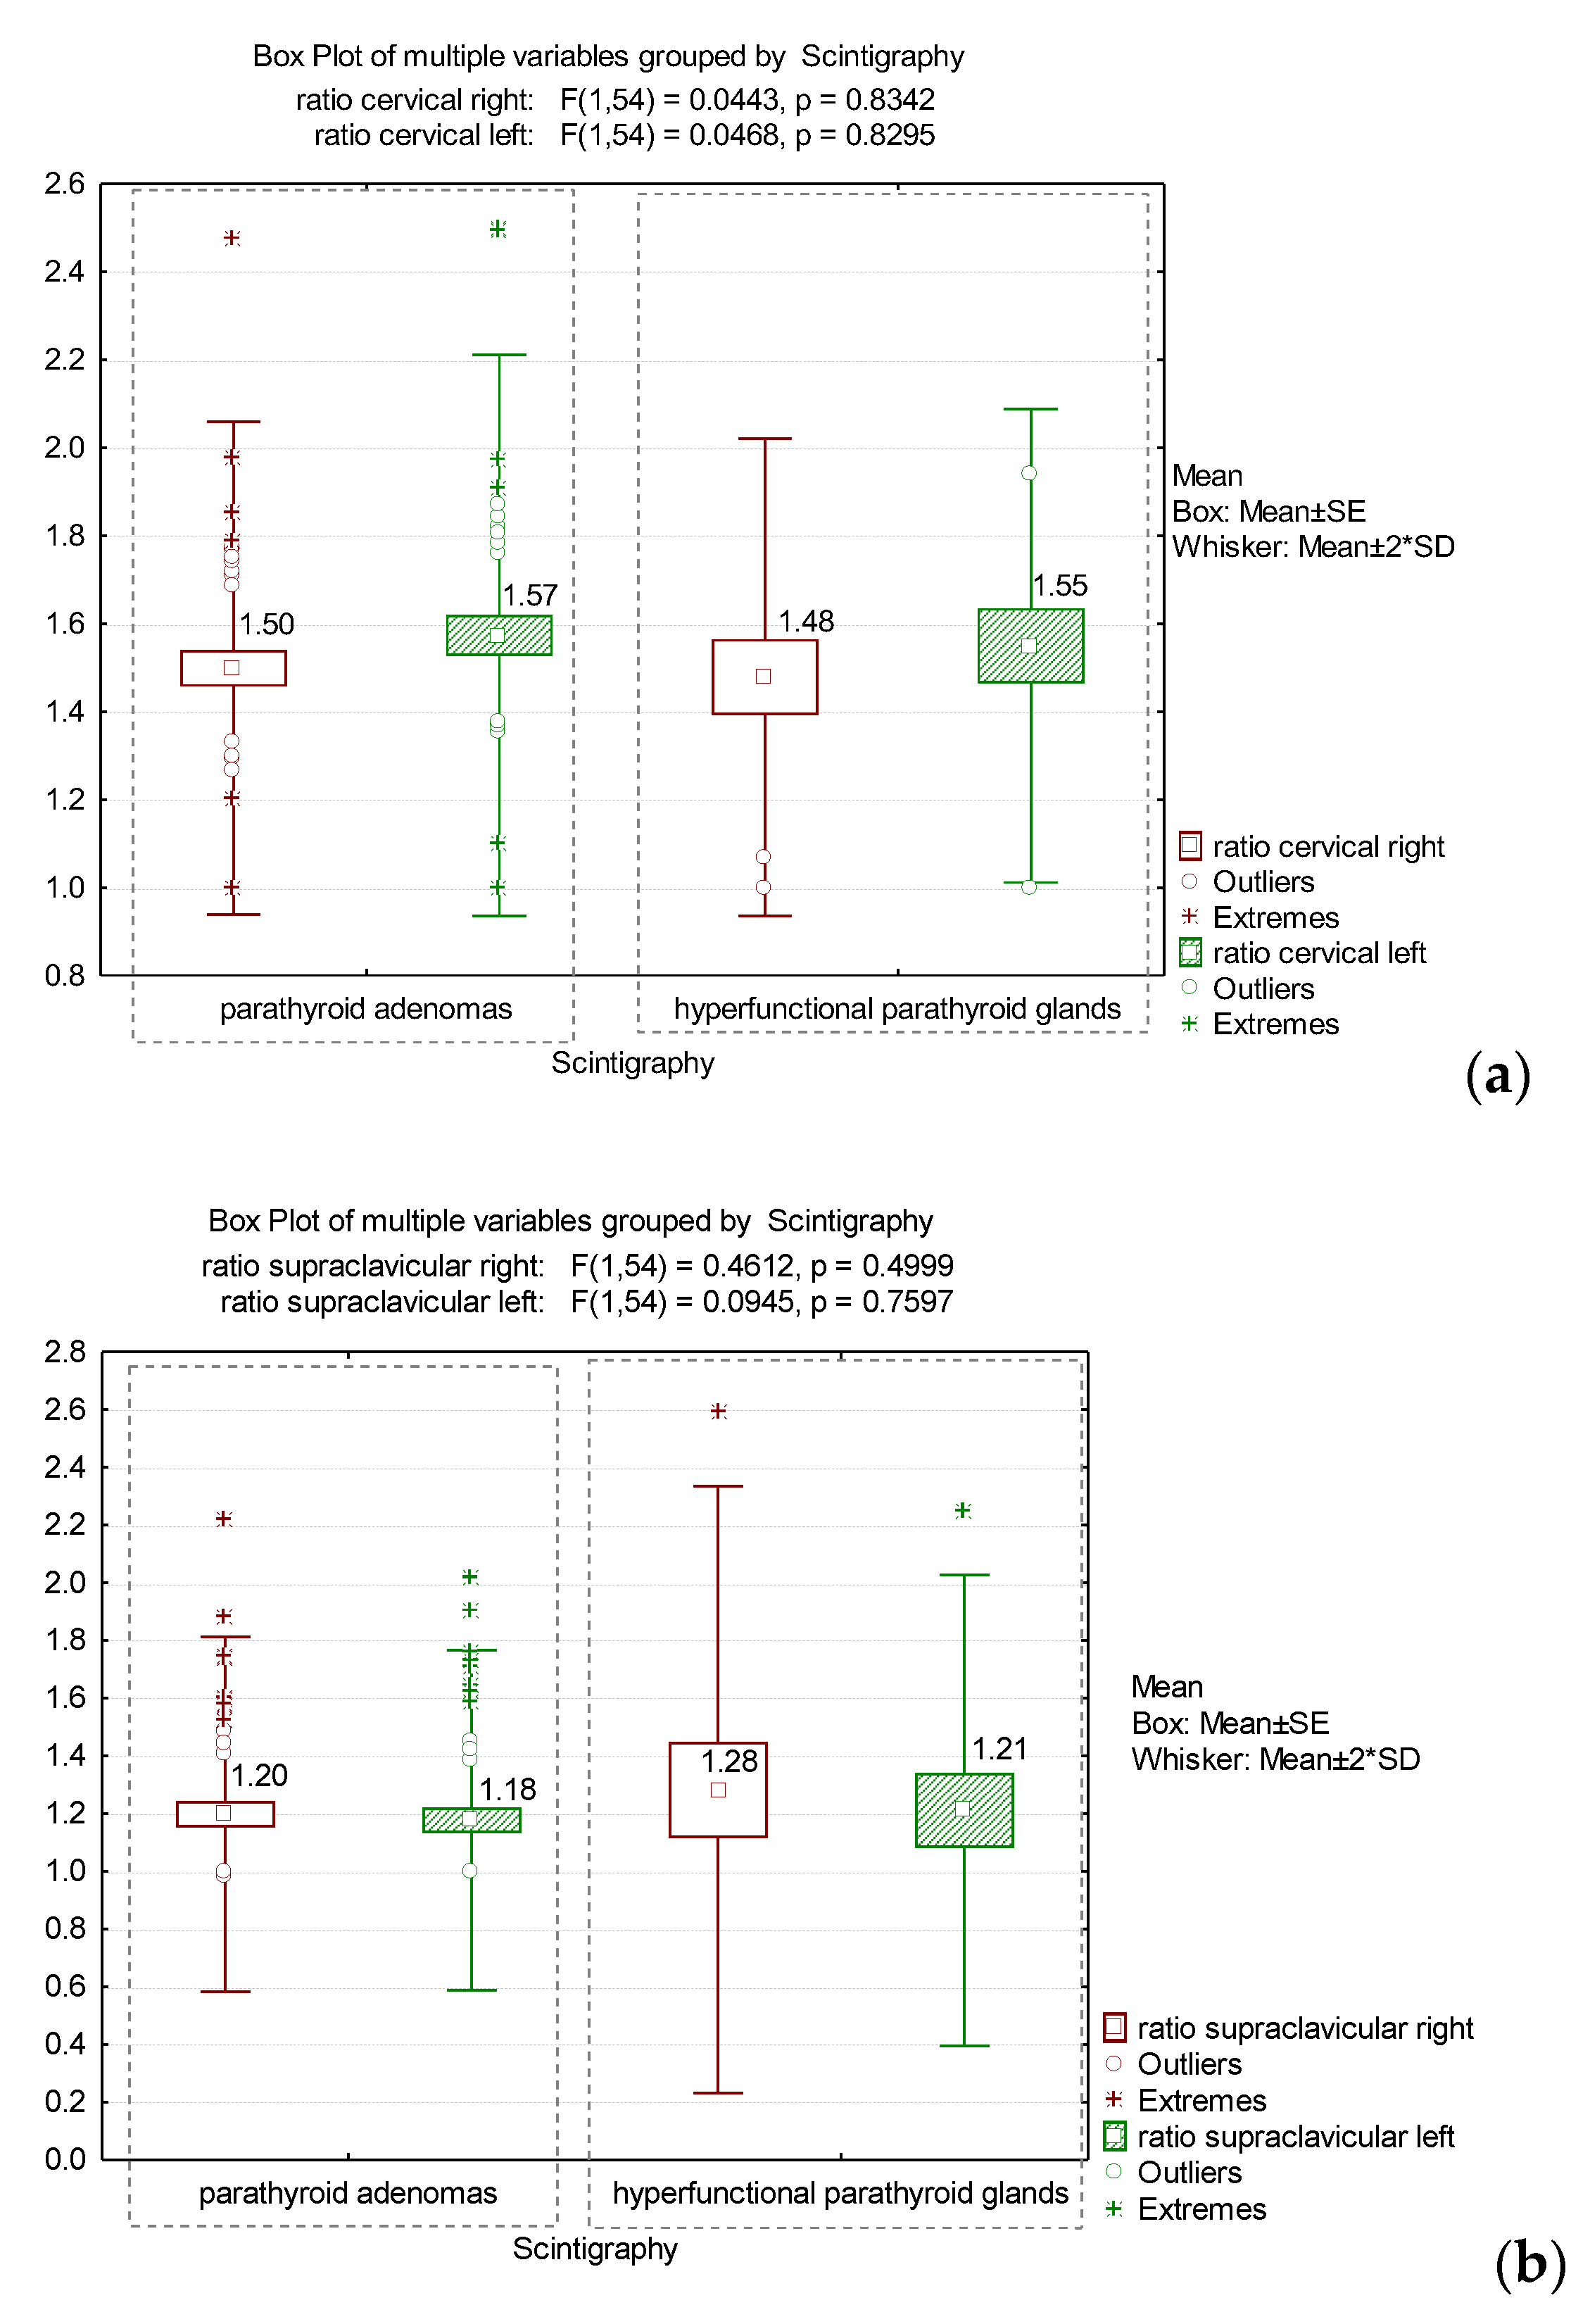
| Scintigraphy, n (%) | ||||
| parathyroid adenomas | 46 (82.1) | 23 (79.3) | 23 (85.2) | 0.564 ^ |
| hyperfunctional parathyroid glands | 10 (17.9) | 6 (20.7) | 4 (14.8) | |
| Body weight, median (IQR), kg | 67.5 (58–75.5) | 60 (53–64) | 75 (70–86) | <0.001 * |
| Body weight, mean (SD), kg | 67.5 (14.7) | 58.1 (10.5) | 77.8 (11.2) | |
| BMI, median (IQR), kg/m2 | 24.6 (21.9–27.3) | 22.1 (19.6–23.8) | 27.9 (25.9–31.9) | <0.001 * |
| BMI, mean (SD), kg/m2 | 25.3 (4.9) | 21.7 (2.6) | 29.1 (3.67) | |
| Comorbidities, n (%) | 55 (98.2) | 28 (96.5) | 27 (100) | 0.330 ^ |
| Diabetes | 6 (10.7) | 2 (6.9) | 4 (14.8) | 0.335 ^ |
| Renal pathologies | 17 (30.4) | 9 (31.1) | 8 (29.6) | 0.909 ^ |
| Hypertension | 19 (33.9) | 8 (27.6) | 11 (40.7) | 0.298 ^ |
| Osteoporosis | 28 (50) | 13 (44.8) | 15 (55.6) | 0.421 ^ |
| PTH, mean (SD), pg/mL | 456.7 (792.4) | 719.5 (1034.3) | 174.5 (128.9) | 0.031 * |
| TSH, mean (SD), µUI/mL | 1.86 (1.37) | 2.03 (1.62) | 1.62 (0.94) | 0.254 * |
| FT4, mean (SD), ng/dL | 1.04 (0.24) | 1.05 (0.27) | 1.03 (0.21) | 0.524 * |
| Ca, mean (SD), mg/dL | 10.21 (1.23) | 10.01 (1.05) | 10.42 (1.37) | 0.275 * |
| Vitamin D, mean (SD), ng/mL | 24.68 (12.84) | 28.79 (13.94) | 21.15 (11.12) | 0.975 * |
| Phosphorus, mean (SD), mg/dL | 3.35 (1.18) | 3.73 (1.25) | 2.87 (0.91) | 0.625 * |
| Magnesium, mean (SD), mg/dL | 2.13 (0.33) | 2.19 (0.39) | 2.04 (0.18) | 0.360 * |
| Urea, mean (SD), mg/dL | 46.65 (35.54) | 54.62 (43.71) | 36.57 (17.71) | 0.098 * |
| Creatinine, mean (SD), mg/dL | 1.70 (2.39) | 2.34 (3.06) | 0.89 (0.31) | 0.035 * |
| Thyroid pathology, n (%) | ||||
| Hashimoto’s autoimmune thyroiditis | 6 (10.7) | 3 (10.3) | 3 (11.1) | 0.926 ^ |
| Basedow’s disease | 2 (3.6) | 1 (3.5) | 1 (3.7) | 0.958 ^ |
| Nodular goiter | 22 (39.3) | 10 (34.5) | 12 (44.4) | 0.445 ^ |
| Total Patients | Nonobese Patients (BMI < 25 kg/m2) n = 29 | Overweight and Obese Patients (BMI > 25 kg/m2) n = 27 | p-Value | |
|---|---|---|---|---|
| BAT localisation, n (%) | ||||
| Unique location | 41 (73.2) | 25 (86.2) | 16 (59.3) | 0.021 ^ |
| Multiple locations | 15 (26.8) | 4 (13.8) | 11 (40.7) | |
| BAT, | ||||
| homogeneous | 24 (42.9) | 10 (34.5) | 14 (51.9) | 0.189 ^ |
| non-homogeneous | 32 (57.1) | 19 (65.5) | 13 (48.1) | |
| BAT | ||||
| symmetric | 52 (92.9) | 28 (96.6) | 24 (88.9) | 0.265 ^ |
| asymmetric | 4 (7.1) | 1 (3.4) | 3 (11.1) | |
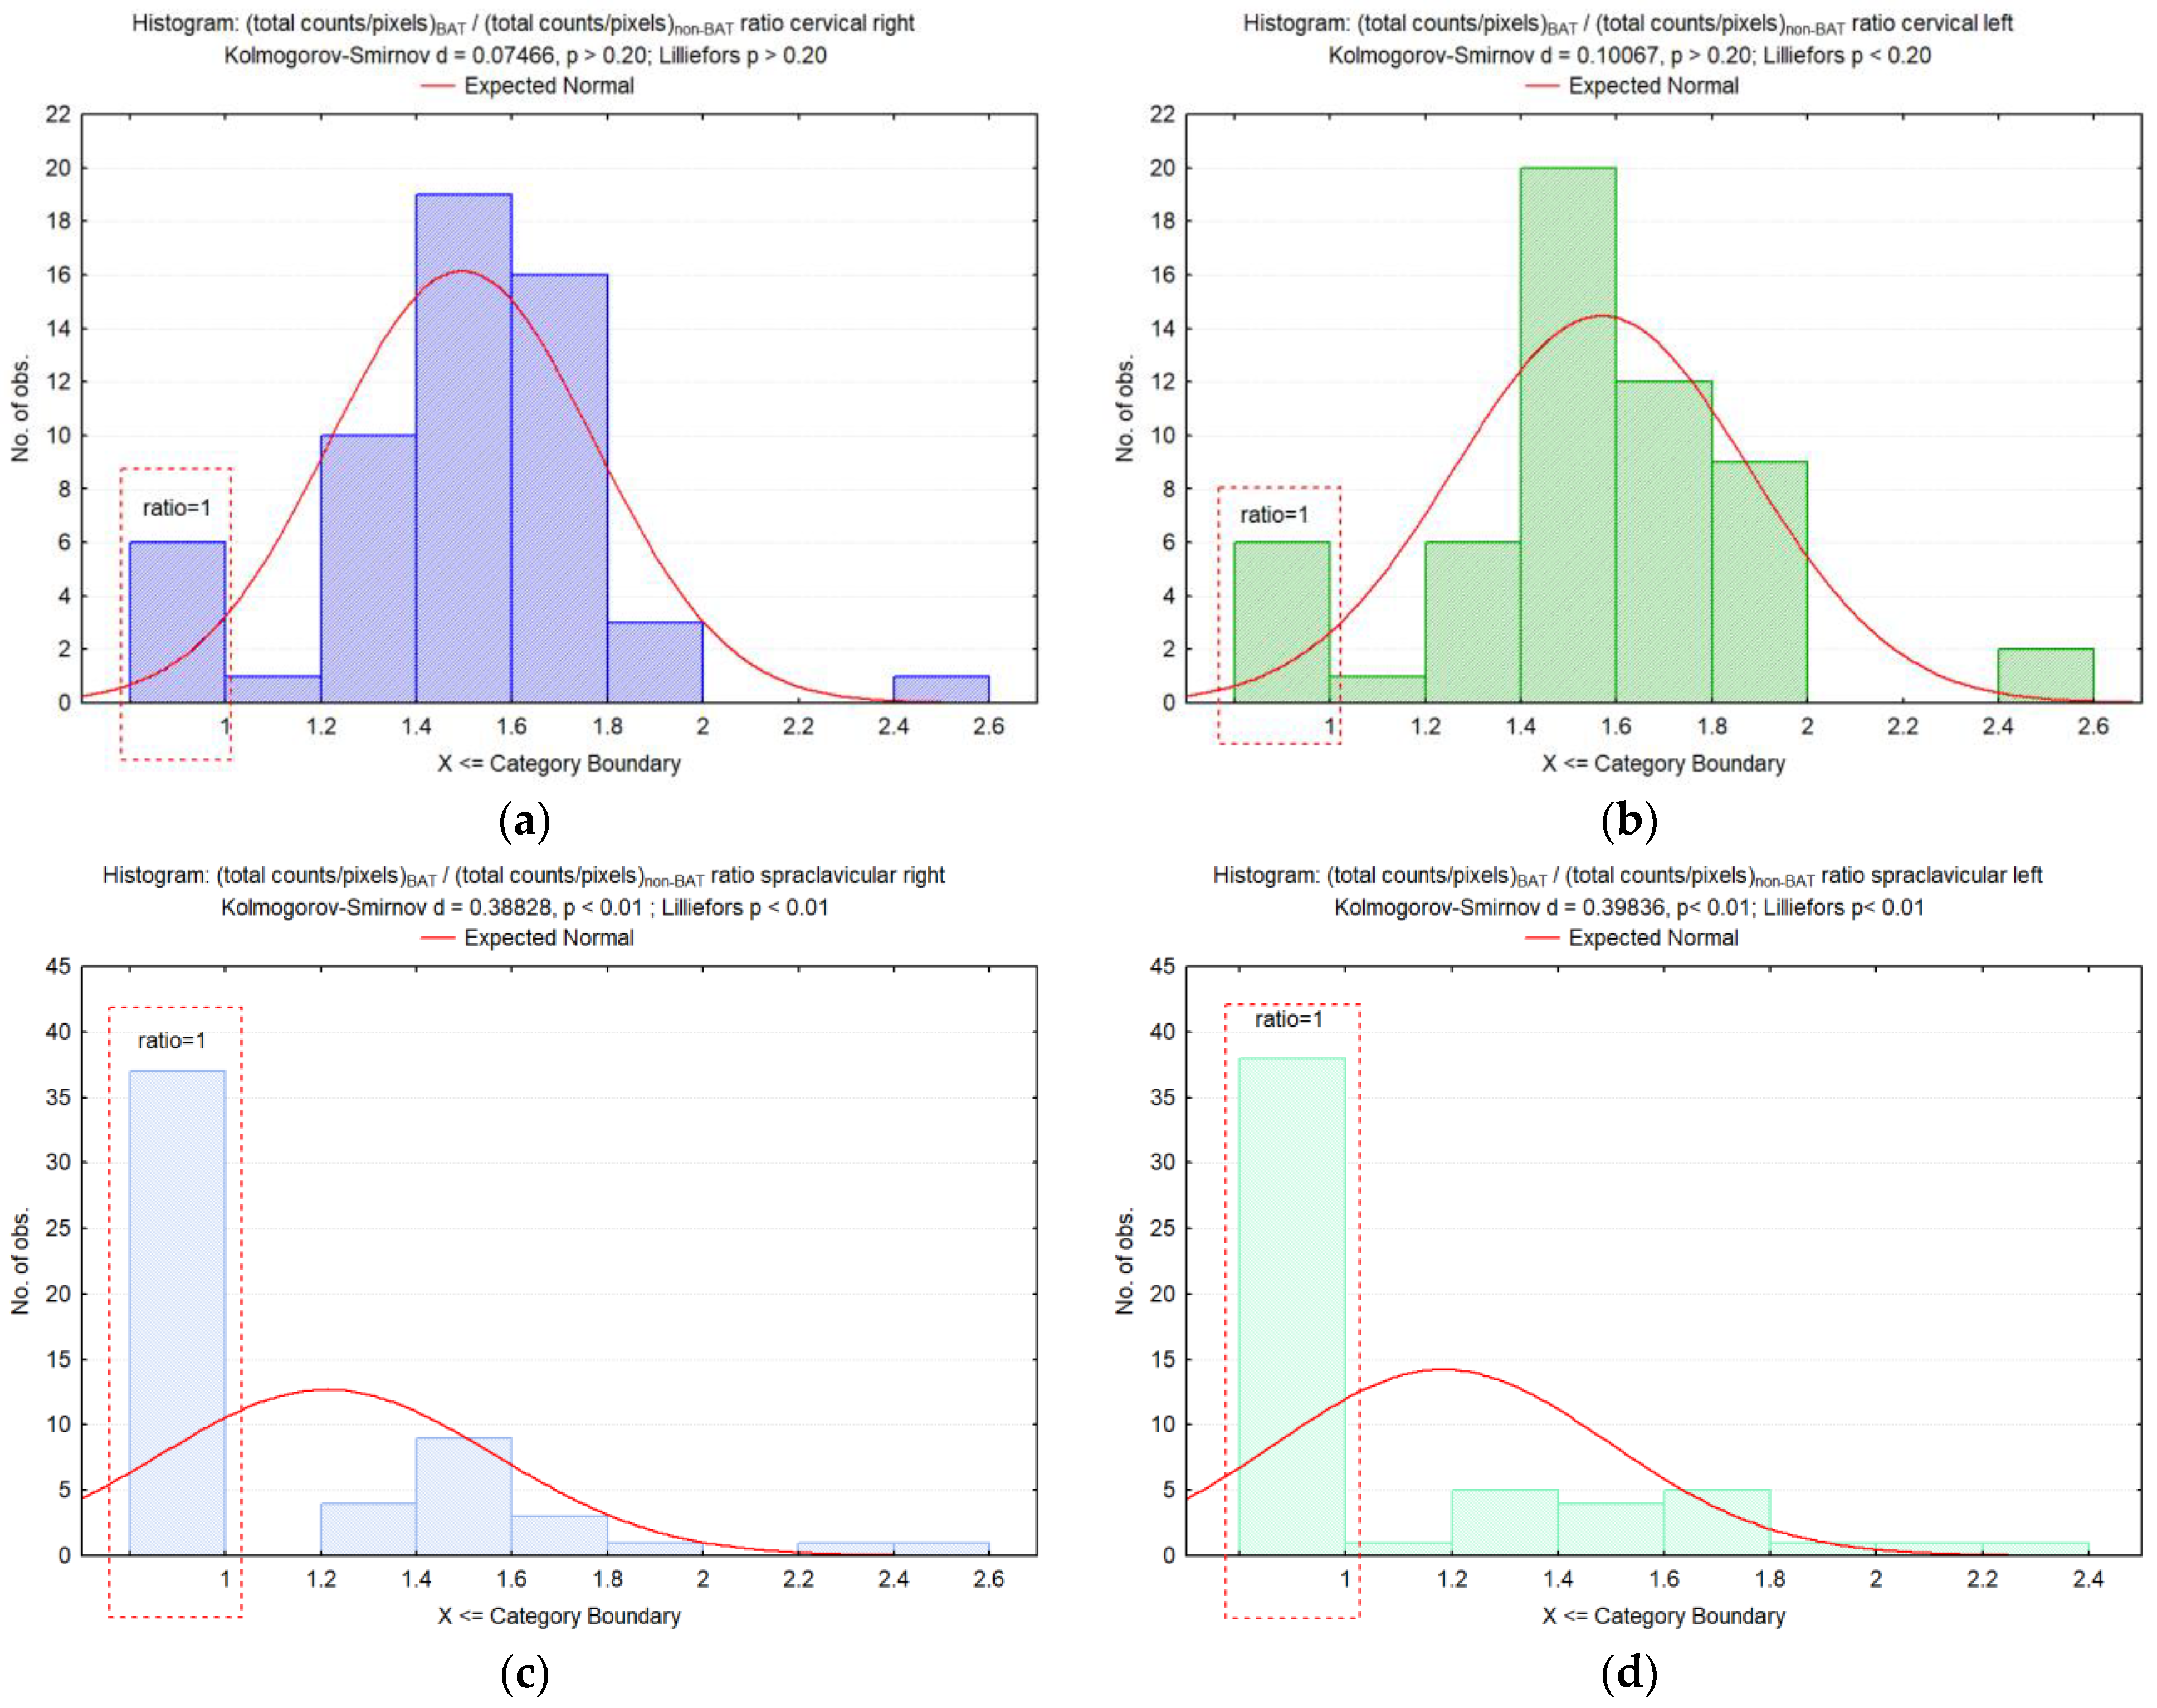
| (total counts/pixels)BAT/ | ||||
| (total counts/pixels)non-BAT | ||||
| ratio cervical right | ||||
| median (IQR) | 1.52 (1.34–1.65) | 1.44 (1.29–1.66) | 1.55 (1.46–1.63) | 0.031 * |
| mean (SD) | 1.49 (0.27) | 1.45 (0.31) | 1.53 (0.23) | |
| (total counts/pixels)BAT/ | ||||
| (total counts/pixels)non-BAT | ||||
| ratio cervical left | ||||
| median (IQR) | 1.58 (1.42–1.71) | 1.54 (1.41–1.68) | 1.59 (1.47–1.81) | 0.412 * |
| mean (SD) | 1.57 (0.31) | 1.51 (0.31) | 1.62 (0.30) | |
| (total counts/pixels)BAT/ | ||||
| (total counts/pixels)non-BAT | ||||
| ratio supraclavicular right | ||||
| median (IQR) | 1 (1–1.42) | 1 (1–1.12) | 1 (1–1.45) | 0.284 * |
| mean (SD) | 1.21 (0.35) | 1.9 (0.41) | 1.23 (0.29) | |
| (total counts/pixels)BAT/ | ||||
| (total counts/pixels)non-BAT | ||||
| ratio supraclavicular left | ||||
| median (IQR) | 1 (1–1.30) | 1 (1–1.27) | 1 (1–1.38) | 0.992 * |
| mean (SD) | 1.18 (0.31) | 1.18 (0.38) | 1.19 (0.31) |
Publisher’s Note: MDPI stays neutral with regard to jurisdictional claims in published maps and institutional affiliations. |
© 2022 by the authors. Licensee MDPI, Basel, Switzerland. This article is an open access article distributed under the terms and conditions of the Creative Commons Attribution (CC BY) license (https://creativecommons.org/licenses/by/4.0/).
Share and Cite
Jalloul, W.; Moscalu, M.; Grierosu, I.; Ionescu, T.; Stolniceanu, C.R.; Gutu, M.; Ghizdovat, V.; Mocanu, V.; Azoicai, D.; Iliescu, R.; et al. Brown Adipose Tissue Biodistribution and Correlations Particularities in Parathyroid Pathology Personalized Diagnosis. Diagnostics 2022, 12, 3182. https://doi.org/10.3390/diagnostics12123182
Jalloul W, Moscalu M, Grierosu I, Ionescu T, Stolniceanu CR, Gutu M, Ghizdovat V, Mocanu V, Azoicai D, Iliescu R, et al. Brown Adipose Tissue Biodistribution and Correlations Particularities in Parathyroid Pathology Personalized Diagnosis. Diagnostics. 2022; 12(12):3182. https://doi.org/10.3390/diagnostics12123182
Chicago/Turabian StyleJalloul, Wael, Mihaela Moscalu, Irena Grierosu, Teodor Ionescu, Cati Raluca Stolniceanu, Mihai Gutu, Vlad Ghizdovat, Veronica Mocanu, Doina Azoicai, Radu Iliescu, and et al. 2022. "Brown Adipose Tissue Biodistribution and Correlations Particularities in Parathyroid Pathology Personalized Diagnosis" Diagnostics 12, no. 12: 3182. https://doi.org/10.3390/diagnostics12123182