
TMP19: A Novel Ternary Motif Pattern-Based ADHD Detection Model Using EEG Signals

 , , , ,
Abstract
:1. Introduction
- Presenting a new motif pattern to generate textural features;
- Proposing a hand-modeled one-dimensional signal classification architecture;
- Attaining robust and high classification performance with low time complexity.
- A new ternary motif pattern has been proposed in this research. The main objective of the proposed TMP is to extract hidden and informative features from EEG signals.
- A new generation multilevel feature engineering model has been proposed in this research to attain high classification accuracy on the EEG dataset. The presented feature engineering model uses 19 levels and TMP to extract features. Thus, this model is named TMP19.
- In the feature selection phase, the main feature extraction function is NCA. At the same time, we employed threshold-based elimination to obtain more distinctive features. Thus, the model is named threshold–based NCA.
- We integrated a noisy EEG dataset containing 4173 EEG signals, each of four seconds in length. We believe this is the first proposal of a classification model for this dataset in the literature.
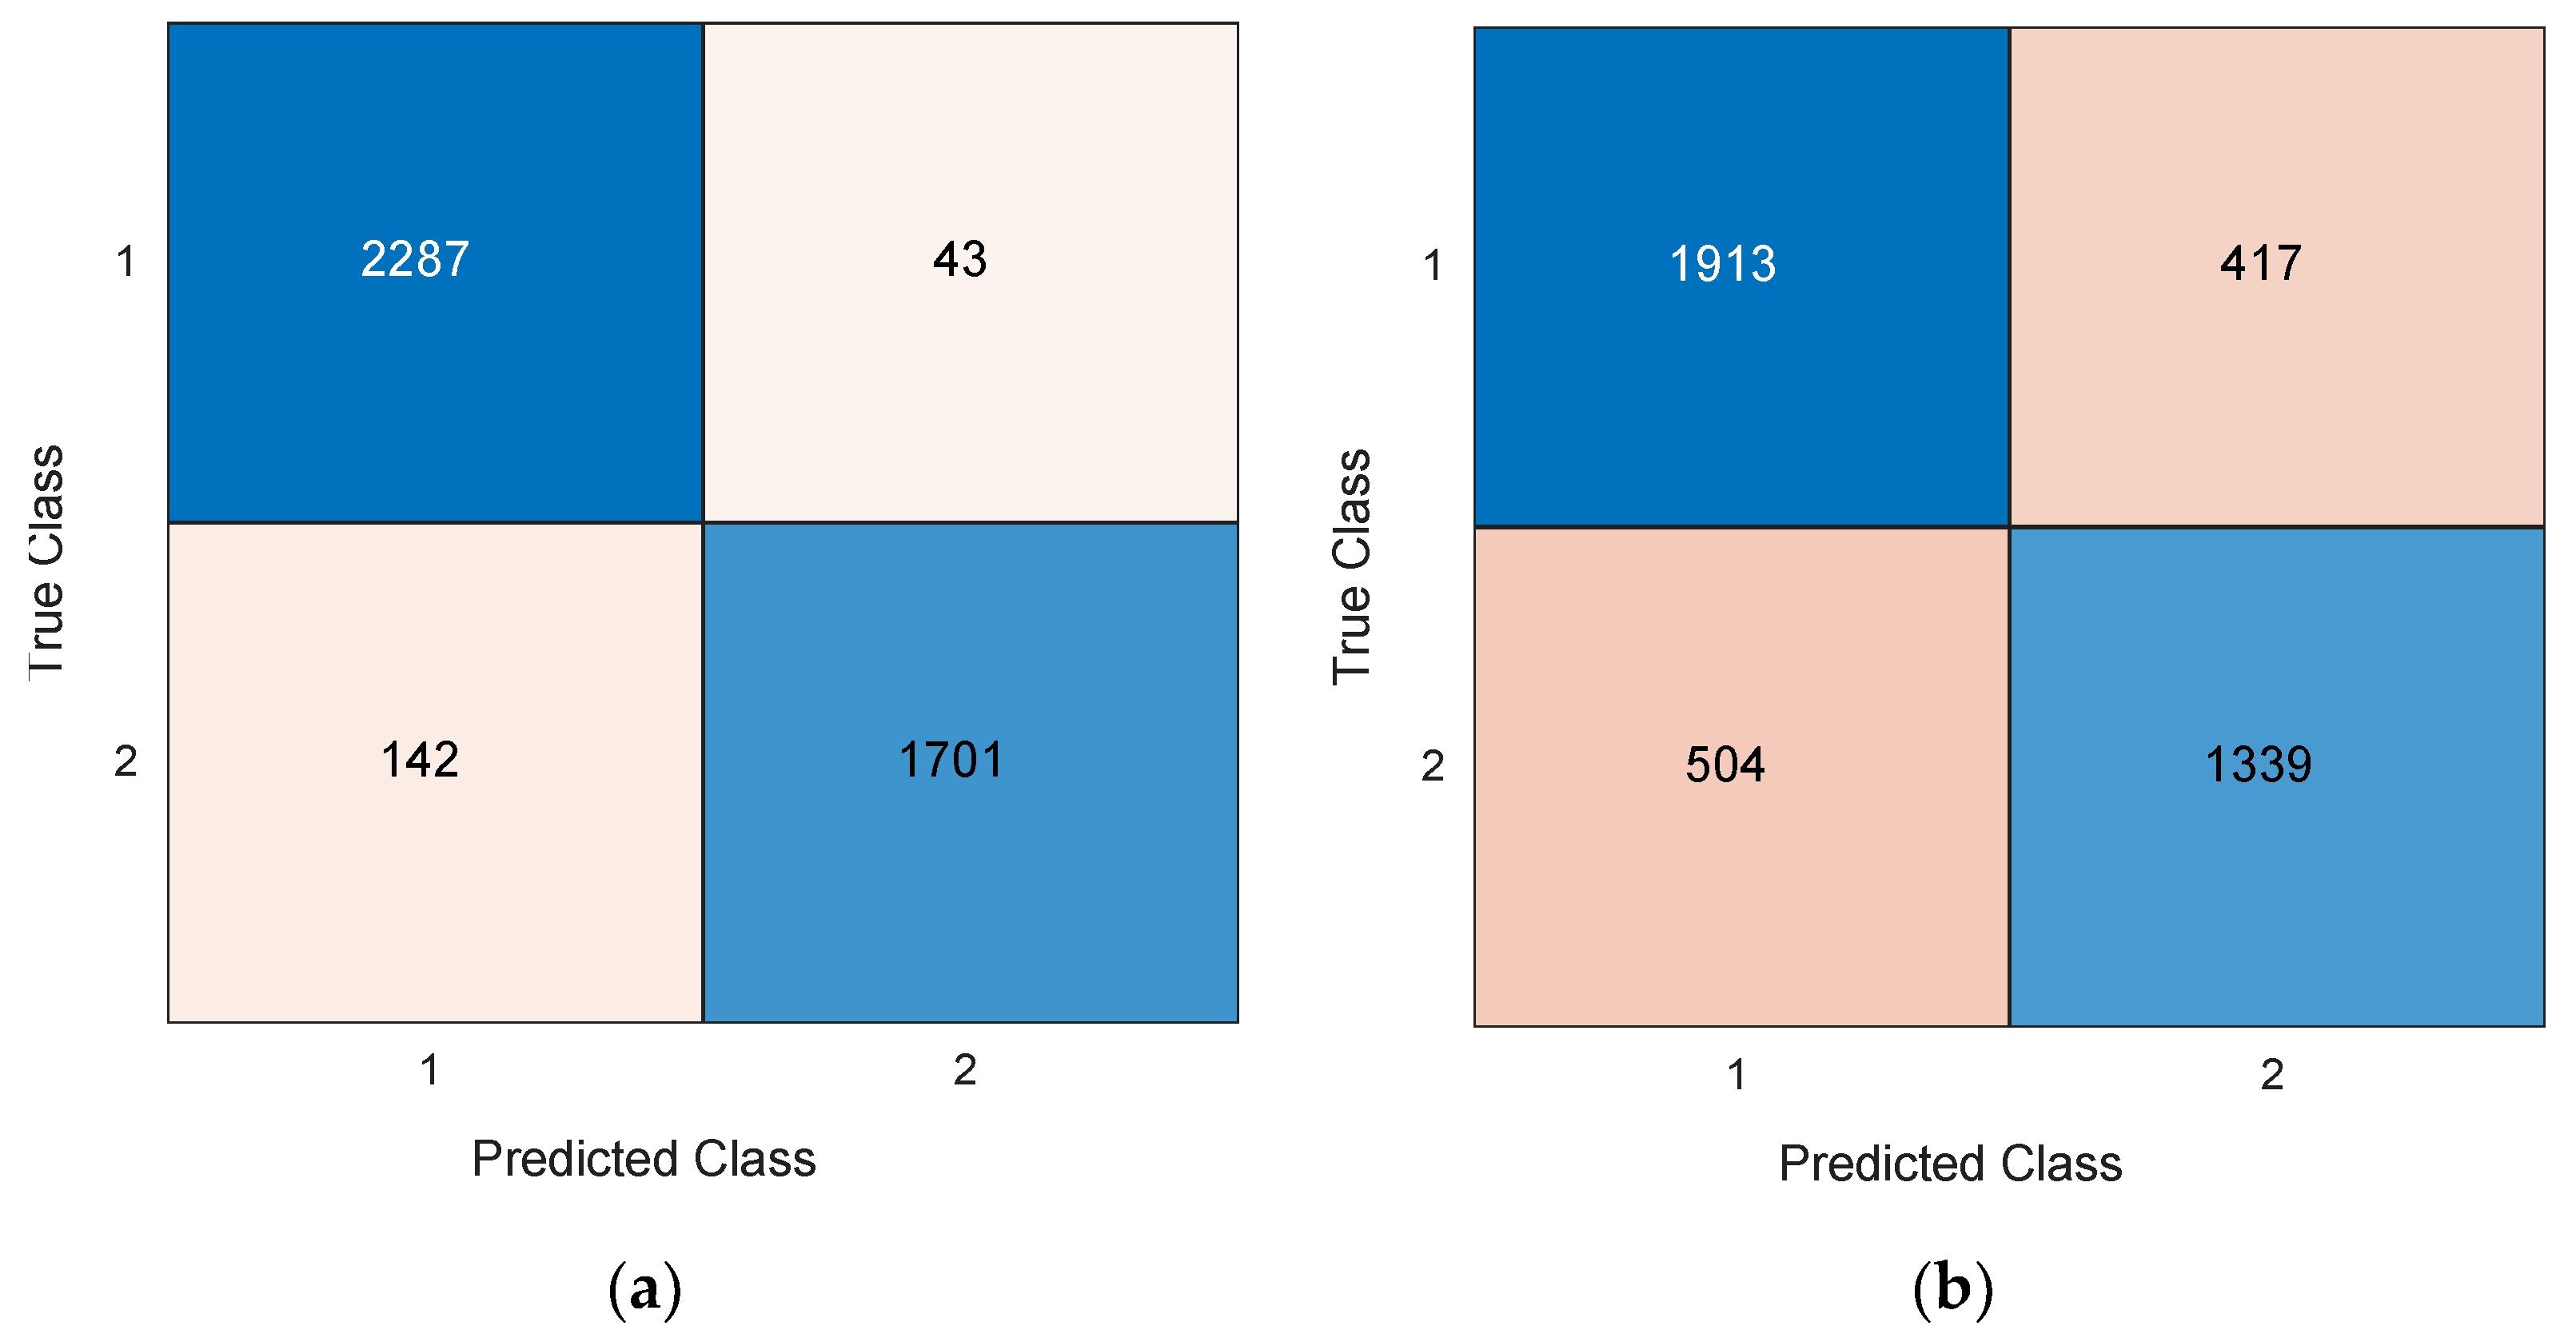
- Our proposal—TMP19—was tested using two validation techniques and showed robust results. The TMP19 attained 95.57% and 77.93% classification accuracies by deploying 10-fold CV and LOSO CV, respectively.
2. Material and Method
2.1. Material
2.2. Method
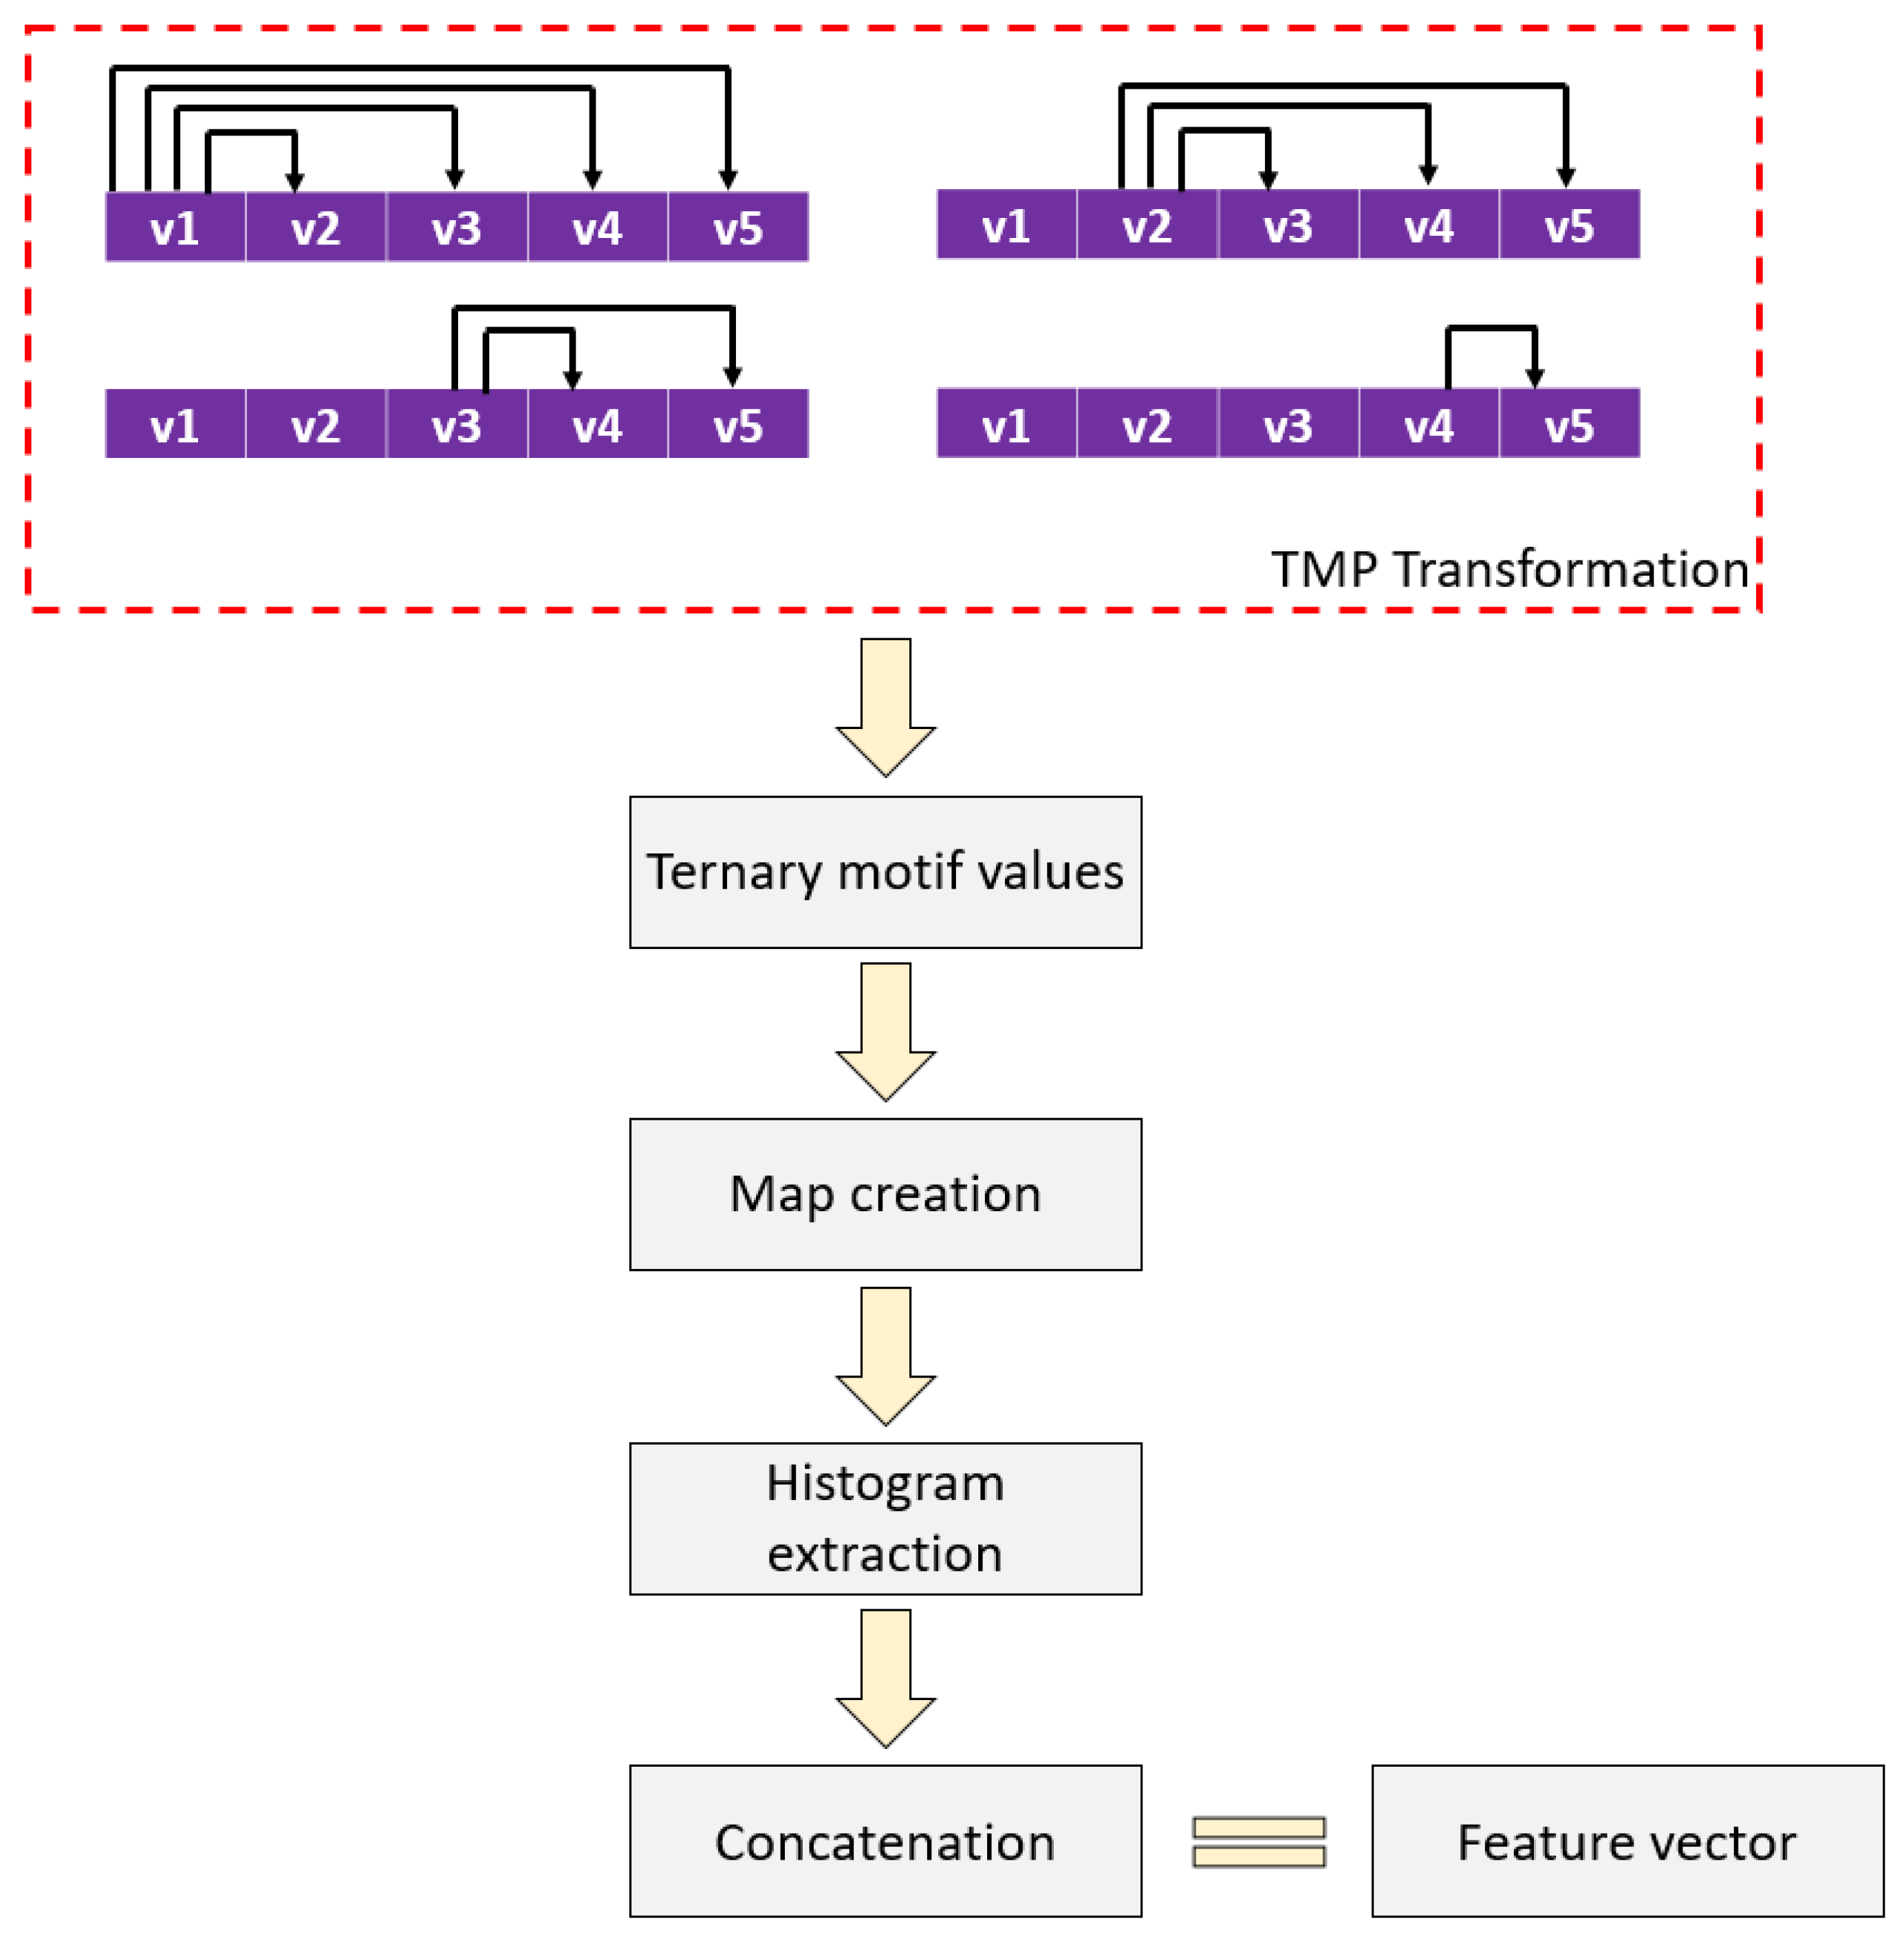
- Step 1:
- Create overlapping blocks with a length of five.
- Step 2:
- Generate ternary motifs.
- Step 3:
- Calculate map values using ternary motif values.
- Step 4:
- Extract histograms of map signals.
- Step 5:
- Merge the generated histograms and obtain a feature vector.
- Feature extraction;
- Feature selection;
- Classification;
- Majority voting.
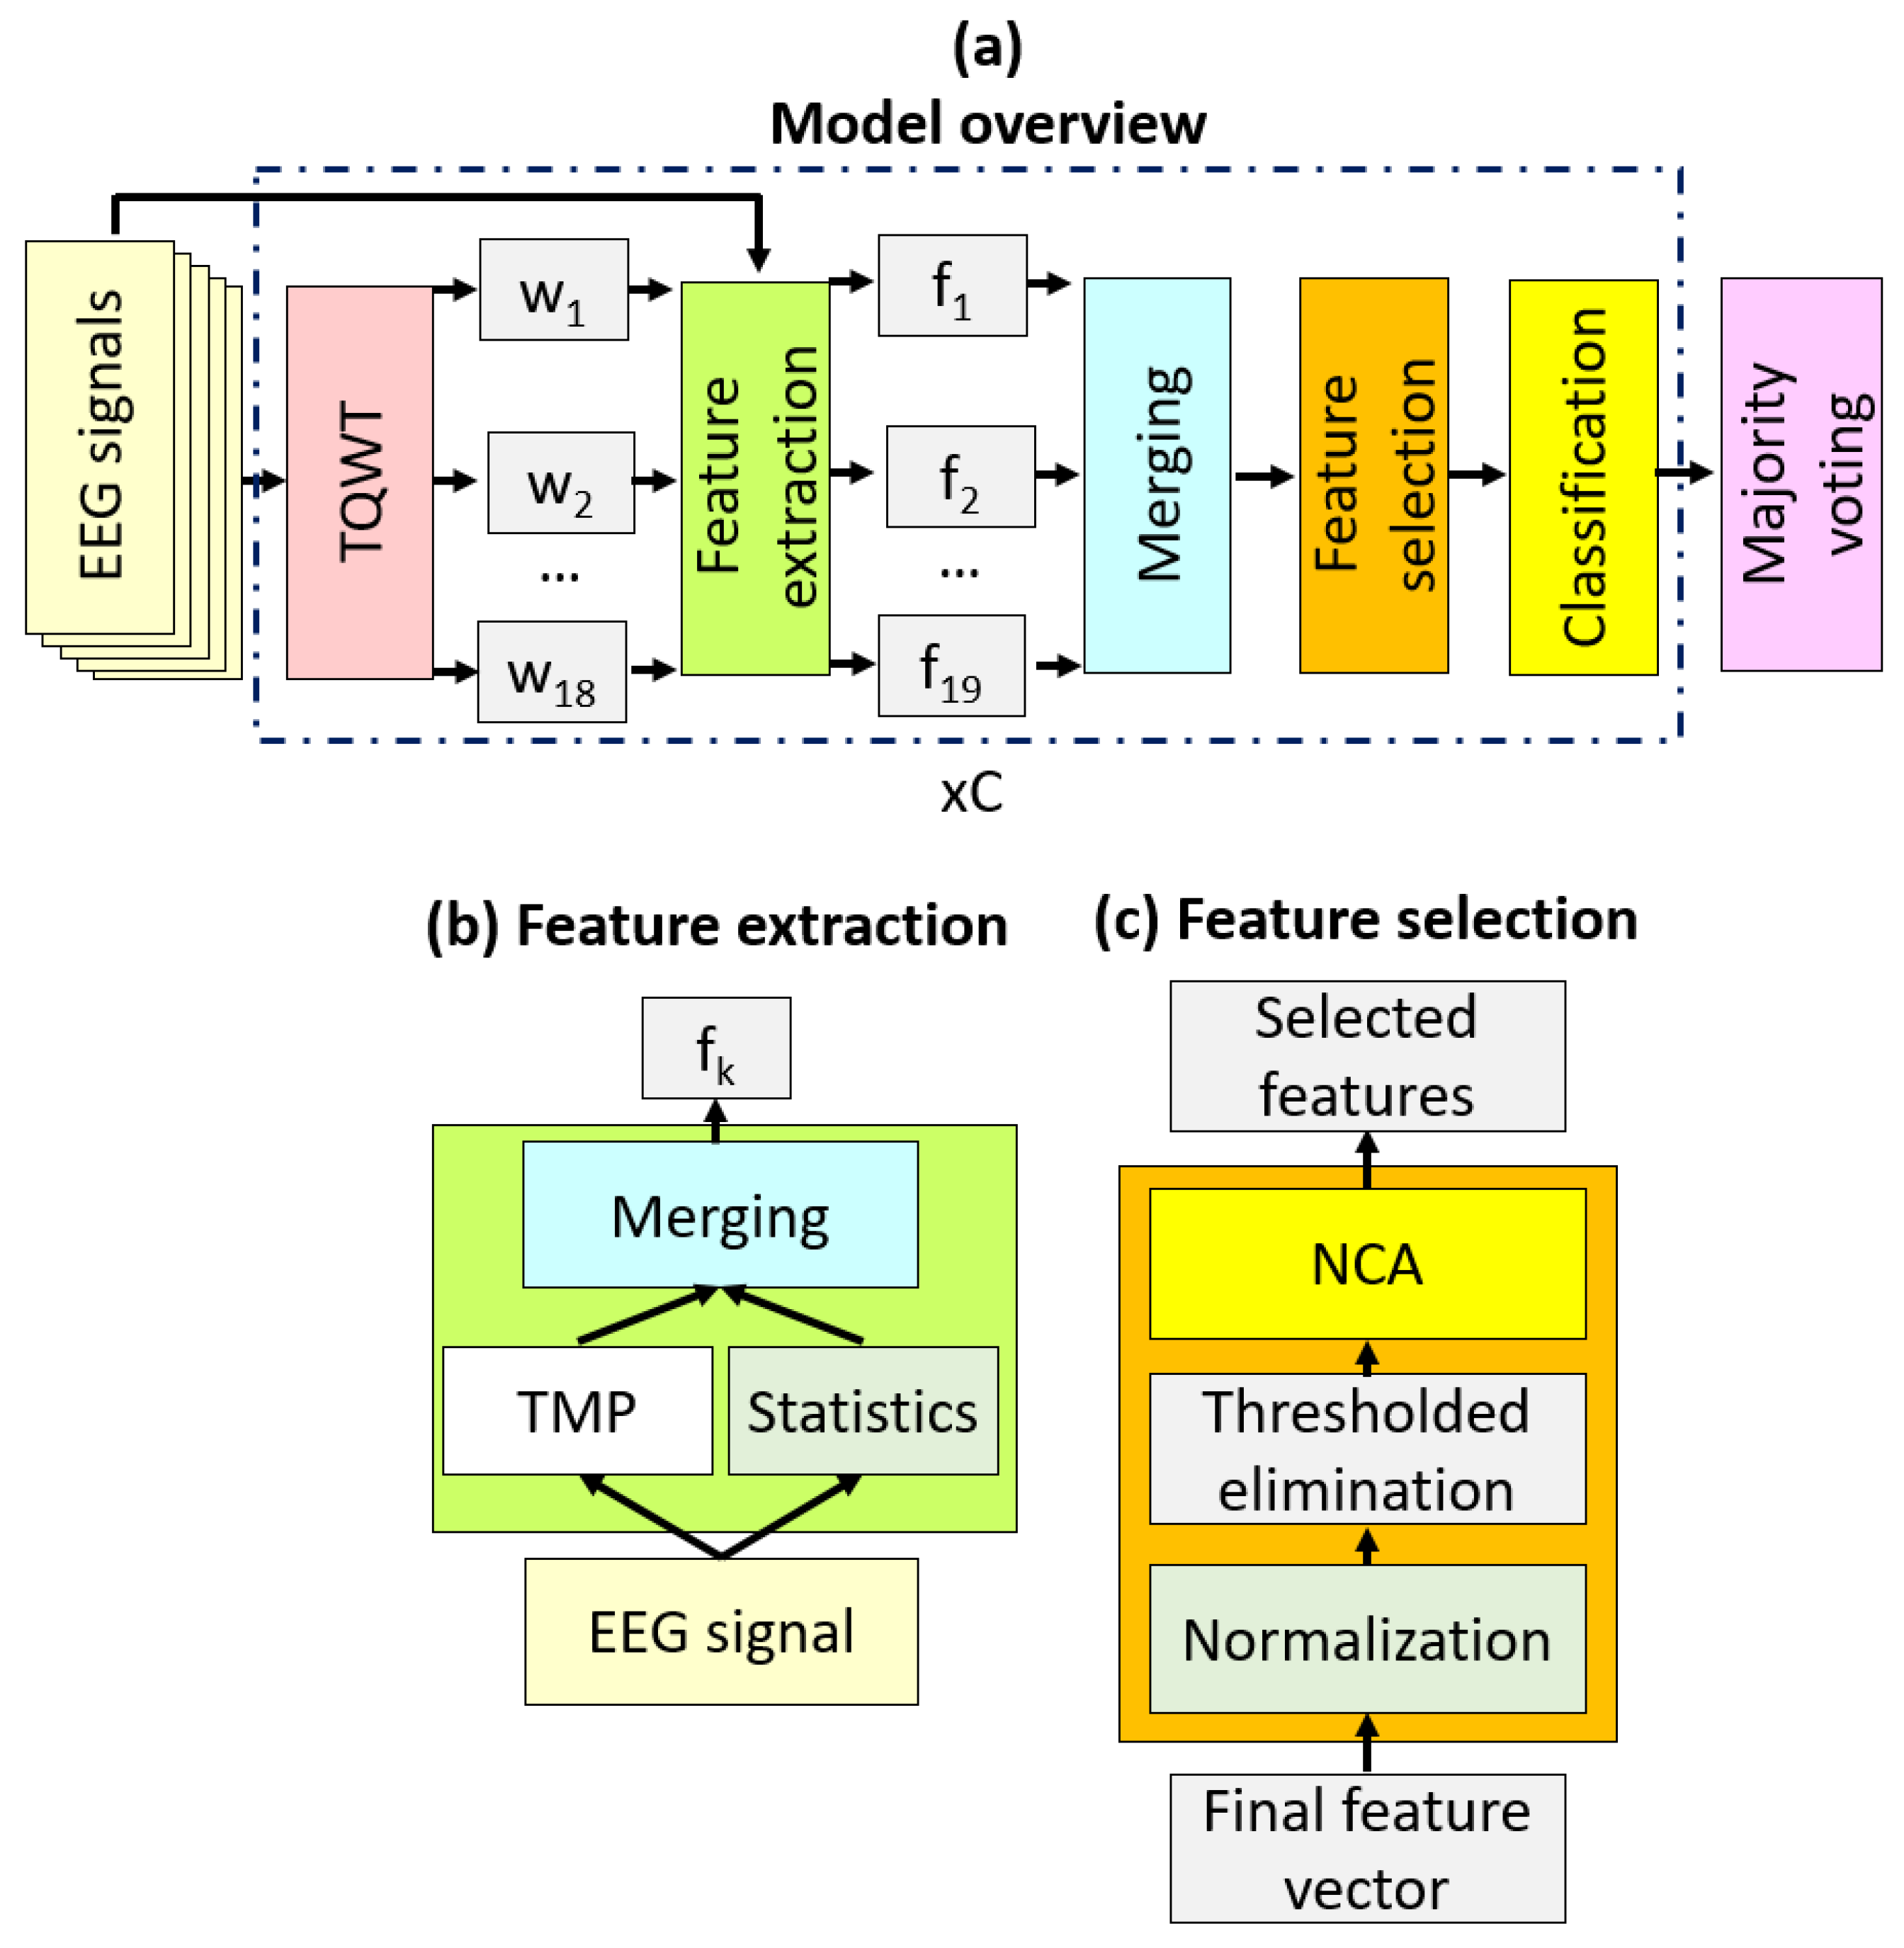
2.2.1. Feature Extraction
- Step 1:
- Apply TQWT to the EEG signal for generating wavelet bands.
- Step 2:
- Generate features using TMP and statistical feature generation function.
- Step 3:
- Concatenate the 19 generated feature vectors to create the final feature vectors.
2.2.2. Feature Selection
- Step 4:
- Normalize the final feature vector by deploying a min-max normalization.
- Step 5:
- Eliminate the redundant features using a threshold value.
- Step 6:
- Calculate qualified/sorted indexes by deploying the NCA feature selection function.
- Step 7:
- Select the most meaningful 250 features from the .
2.2.3. Classification
- Step 8:
- Calculate the predicted vector of each channel by applying the kNN classifier.
- Step 9:
- Repeat Steps 1–8 by the number of channels. We used an ADHD dataset containing 14 channels. Thus, we repeated these steps 14 times.
2.2.4. Majority Voting
- Step 10:
- Calculate the classification accuracy of each channel.
- Step 11:
- Qualify/sort the predicted vectors using the predicted vectors and obtain qualified/sorted indexes.
- Step 12:
- Calculate voted predicted vectors by deploying the mode function.
- Step 13:
- Calculate classification accuracies of the voted vectors.
- Step 14:
- Choose the most accurate voted vector as the final predicted vector.
3. Results
3.1. Performance Metrics
3.2. Channel-Wise Results
3.3. Voted Results
3.4. Final Results
4. Discussion
- A novel feature generation function was introduced. This function generates motifs. Thus, this feature generator is named TMP.
- An accurate one-dimensional signal classification architecture has been proposed by using TMP. This model contains 19 levels. Thus, it is named TMP19.
- Simple methods have been used to create the TMP19 model. Thus, the implementation of this model is straightforward and of low complexity.
- TMP19 is a parametric model. Therefore, next-generation TMP-based classification models can be proposed by using different classification methods.
- TMP19 is a highly accurate model.
- The robustness of the presented TMP19 is demonstrated by deploying a 10-fold CV and LOSO CV.
- Parameters should be optimized to gain higher classification performances.
- Recently, authors in [37] have developed an automated system to detect ADHD and conduct disorder in children using empirical wavelet transform and entropy features extracted from electrocardiogram (ECG) signals. They obtained an accuracy of 88% in classifying ADHD, ADHD + CD, and CD patients for appropriate intervention using accessible ECG signals. In the future, ECG and heart rate variability (HRV) signals can be used for automated ADHD detection as they can be easily acquired using wearable devices.
- More disorders can be used to evaluate the performance of the TMP19 model.
5. Conclusions
Author Contributions
Funding
Institutional Review Board Statement
Informed Consent Statement
Data Availability Statement
Conflicts of Interest
References
- Leijten, P.; Scott, S.; Landau, S.; Harris, V.; Mann, J.; Hutchings, J.; Beecham, J.; Gardner, F. Individual participant data meta-analysis: Impact of conduct problem severity, comorbid attention-deficit/hyperactivity disorder and emotional problems, and maternal depression on parenting program effects. J. Am. Acad. Child Adolesc. Psychiatry 2020, 59, 933–943. [Google Scholar] [CrossRef] [PubMed]
- Yadav, S.K.; Bhat, A.A.; Hashem, S.; Nisar, S.; Kamal, M.; Syed, N.; Temanni, M.-R.; Gupta, R.K.; Kamran, S.; Azeem, M.W. Genetic variations influence brain changes in patients with attention-deficit hyperactivity disorder. Transl. Psychiatry 2021, 11, 349. [Google Scholar] [CrossRef] [PubMed]
- Faraone, S.; Asherson, P.; Banaschewski, T.; Biederman, J.; Buitelaar, J.; Ramos-Quiroga, J.; Rohde, L.; Sonuga-Barke, E.; Tannock, R.; Franke, B. Attention-deficit/hyperactivity disorder. Nature reviews. Dis. Prim. 2015, 1, 15020. [Google Scholar]
- Tzang, R.-F.; Chang, Y.-C.; Kao, K.-L.; Huang, Y.-H.; Huang, H.-C.; Wang, Y.-C.; Muo, C.-H.; Wu, S.-I.; Sung, F.-C.; Stewart, R. Increased risk of developing psychiatric disorders in children with attention deficit and hyperactivity disorder (ADHD) receiving sensory integration therapy: A population-based cohort study. Eur. Child Adolesc. Psychiatry 2019, 28, 247–255. [Google Scholar] [CrossRef]
- Bonati, M.; Cartabia, M.; Zanetti, M.; Reale, L.; Didoni, A.; Costantino, M.A. Age level vs. grade level for the diagnosis of ADHD and neurodevelopmental disorders. Eur. Child Adolesc. Psychiatry 2018, 27, 1171–1180. [Google Scholar] [CrossRef]
- Pawaskar, M.; Fridman, M.; Grebla, R.; Madhoo, M. Comparison of quality of life, productivity, functioning and self-esteem in adults diagnosed with ADHD and with symptomatic ADHD. J. Atten. Disord. 2020, 24, 136–144. [Google Scholar] [CrossRef] [Green Version]
- Sörös, P.; Hoxhaj, E.; Borel, P.; Sadohara, C.; Feige, B.; Matthies, S.; Müller, H.H.O.; Bachmann, K.; Schulze, M.; Philipsen, A. Hyperactivity/restlessness is associated with increased functional connectivity in adults with ADHD: A dimensional analysis of resting state fMRI. BMC Psychiatry 2019, 19, 43. [Google Scholar] [CrossRef] [Green Version]
- Serrano-Barroso, A.; Siugzdaite, R.; Guerrero-Cubero, J.; Molina-Cantero, A.J.; Gomez-Gonzalez, I.M.; Lopez, J.C.; Vargas, J.P. Detecting attention levels in ADHD children with a video game and the measurement of brain activity with a single-channel BCI headset. Sensors 2021, 21, 3221. [Google Scholar] [CrossRef]
- Biederman, J.; Spencer, T.; Lomedico, A.; Day, H.; Petty, C.; Faraone, S.V. Deficient emotional self-regulation and pediatric attention deficit hyperactivity disorder: A family risk analysis. Psychol. Med. 2012, 42, 639–646. [Google Scholar] [CrossRef]
- Willcutt, E.G.; Doyle, A.E.; Nigg, J.T.; Faraone, S.V.; Pennington, B.F. Validity of the executive function theory of attention-deficit/hyperactivity disorder: A meta-analytic review. Biol. Psychiatry 2005, 57, 1336–1346. [Google Scholar] [CrossRef]
- Simon, V.; Czobor, P.; Bálint, S.; Mészáros, A.; Bitter, I. Prevalence and correlates of adult attention-deficit hyperactivity disorder: Meta-analysis. Br. J. Psychiatry 2009, 194, 204–211. [Google Scholar] [CrossRef] [PubMed] [Green Version]
- Quinn, P.; Wigal, S. Perceptions of girls and ADHD: Results from a national survey. Medscape Gen. Med. 2004, 6, 2. [Google Scholar]
- Bauermeister, J.J.; Shrout, P.E.; Chávez, L.; Rubio-Stipec, M.; Ramírez, R.; Padilla, L.; Anderson, A.; García, P.; Canino, G. ADHD and gender: Are risks and sequela of ADHD the same for boys and girls? J. Child Psychol. Psychiatry 2007, 48, 831–839. [Google Scholar] [CrossRef] [PubMed]
- Zahmacioglu, O.; Kilic, E.Z. Early diagnosis and treatment of ADHD are important for a secure transition to adolescence. Anatol. J. Psychiatry/Anadolu Psikiyatr. Derg. 2017, 18, 79–84. [Google Scholar] [CrossRef]
- Safren, S.A.; Sprich, S.; Mimiaga, M.J.; Surman, C.; Knouse, L.; Groves, M.; Otto, M.W. Cognitive behavioral therapy vs. relaxation with educational support for medication-treated adults with ADHD and persistent symptoms: A randomized controlled trial. Jama 2010, 304, 875–880. [Google Scholar] [CrossRef] [PubMed] [Green Version]
- Bell, A.S. A critical review of ADHD diagnostic criteria: What to address in the DSM-V. J. Atten. Disord. 2011, 15, 3–10. [Google Scholar] [CrossRef]
- Loh, H.W.; Ooi, C.P.; Seoni, S.; Barua, P.D.; Molinari, F.; Acharya, U.R. Application of Explainable Artificial Intelligence for Healthcare: A Systematic Review of the Last Decade (2011–2022). Comput. Methods Programs Biomed. 2022, 226, 107161. [Google Scholar] [CrossRef]
- Lenartowicz, A.; Loo, S.K. Use of EEG to diagnose ADHD. Curr. Psychiatry Rep. 2014, 16, 498. [Google Scholar] [CrossRef] [Green Version]
- Stein, M.A.; Snyder, S.M.; Rugino, T.A.; Hornig, M. Commentary: Objective aids for the assessment of ADHD–further clarification of what FDA approval for marketing means and why NEBA might help clinicians. A response to Arns et al. (2016). J. Child Psychol. Psychiatry 2016, 57, 770–771. [Google Scholar] [CrossRef]
- Moghaddari, M.; Lighvan, M.Z.; Danishvar, S. Diagnose ADHD disorder in children using convolutional neural network based on continuous mental task EEG. Comput. Methods Programs Biomed. 2020, 197, 105738. [Google Scholar] [CrossRef]
- Tosun, M. Effects of spectral features of EEG signals recorded with different channels and recording statuses on ADHD classification with deep learning. Phys. Eng. Sci. Med. 2021, 44, 693–702. [Google Scholar] [CrossRef] [PubMed]
- Khoshnoud, S.; Shamsi, M.; Nazari, M.A. Non-linear EEG analysis in children with attention-deficit/hyperactivity disorder during the rest condition. In Proceedings of the 2015 22nd Iranian Conference on Biomedical Engineering (ICBME), Tehran, Iran, 25–27 November 2015; pp. 87–92. [Google Scholar]
- Chen, H.; Song, Y.; Li, X. A deep learning framework for identifying children with ADHD using an EEG-based brain network. Neurocomputing 2019, 356, 83–96. [Google Scholar] [CrossRef]
- Tenev, A.; Markovska-Simoska, S.; Kocarev, L.; Pop-Jordanov, J.; Müller, A.; Candrian, G. Machine learning approach for classification of ADHD adults. Int. J. Psychophysiol. 2014, 93, 162–166. [Google Scholar] [CrossRef] [PubMed]
- Saini, S.; Rani, R.; Kalra, N. Prediction of Attention Deficit Hyperactivity Disorder (ADHD) using machine learning Techniques based on classification of EEG signal. In Proceedings of the 2022 8th International Conference on Advanced Computing and Communication Systems (ICACCS), Coimbatore, India, 25–26 March 2022; pp. 782–786. [Google Scholar]
- Dubreuil-Vall, L.; Ruffini, G.; Camprodon, J.A. Deep learning convolutional neural networks discriminate adult ADHD from healthy individuals on the basis of event-related spectral EEG. Front. Neurosci. 2020, 14, 251. [Google Scholar] [CrossRef]
- Tor, H.T.; Ooi, C.P.; Lim-Ashworth, N.S.; Wei, J.K.E.; Jahmunah, V.; Oh, S.L.; Acharya, U.R.; Fung, D.S.S. Automated detection of conduct disorder and attention deficit hyperactivity disorder using decomposition and nonlinear techniques with EEG signals. Comput. Methods Programs Biomed. 2021, 200, 105941. [Google Scholar] [CrossRef]
- Loh, H.W.; Ooi, C.P.; Barua, P.D.; Palmer, E.E.; Molinari, F.; Acharya, U. Automated detection of ADHD: Current trends and future perspective. Comput. Biol. Med. 2022, 146, 105525. [Google Scholar] [CrossRef]
- Samavati, M.; Nasrabadi, A.M.; Mohammadi, M.R. EEG data for ADHD/Control children. IEEE DataPort 2020. [Google Scholar] [CrossRef]
- Samavati, M.; Nasrabadi, A.M.; Mohammadi, M.R. Automatic minimization of eye blink artifacts using fractal dimension of independent components of multichannel EEG. In Proceedings of the 20th Iranian Conference on Electrical Engineering (ICEE2012), Tehran, Iran, 15–17 May 2012; pp. 1576–1578. [Google Scholar]
- Selesnick, I.W. Wavelet transform with tunable Q-factor. IEEE Trans. Signal Process. 2011, 59, 3560–3575. [Google Scholar] [CrossRef]
- Akbal, E.; Tuncer, T. FusedTSNet: An automated nocturnal sleep sound classification method based on a fused textural and statistical feature generation network. Appl. Acoust. 2021, 171, 107559. [Google Scholar] [CrossRef]
- Goldberger, J.; Hinton, G.E.; Roweis, S.; Salakhutdinov, R.R. Neighbourhood components analysis. Adv. Neural Inf. Process. Syst. 2004, 17, 513–520. [Google Scholar]
- Peterson, L.E. K-nearest neighbor. Scholarpedia 2009, 4, 1883. [Google Scholar] [CrossRef]
- Dogan, A.; Akay, M.; Barua, P.D.; Baygin, M.; Dogan, S.; Tuncer, T.; Dogru, A.H.; Acharya, U.R. PrimePatNet87: Prime pattern and tunable q-factor wavelet transform techniques for automated accurate EEG emotion recognition. Comput. Biol. Med. 2021, 138, 104867. [Google Scholar] [CrossRef] [PubMed]
- Mohammadi, M.R.; Khaleghi, A.; Nasrabadi, A.M.; Rafieivand, S.; Begol, M.; Zarafshan, H. EEG classification of ADHD and normal children using non-linear features and neural network. Biomed. Eng. Lett. 2016, 6, 66–73. [Google Scholar] [CrossRef]
- Koh, J.E.; Ooi, C.P.; Lim-Ashworth, N.S.; Vicnesh, J.; Tor, H.T.; Lih, O.S.; Tan, R.-S.; Acharya, U.R.; Fung, D.S.S. Automated classification of attention deficit hyperactivity disorder and conduct disorder using entropy features with ECG signals. Comput. Biol. Med. 2022, 140, 105120. [Google Scholar] [CrossRef]


| Channel | 10-fold CV | LOSO CV | ||
|---|---|---|---|---|
| Accuracy | Geometric Mean | Accuracy | Geometric Mean | |
| 1 | 87.75 | 87.21 | 72.25 | 71.16 |
| 2 | 86.65 | 85.69 | 71.41 | 70.19 |
| 3 | 89.70 | 89.17 | 68.56 | 67.88 |
| 4 | 87.08 | 86.38 | 67.77 | 67.29 |
| 5 | 91.47 | 91.13 | 74.31 | 73.73 |
| 6 | 88.43 | 87.74 | 65.49 | 64.83 |
| 7 | 88.35 | 87.22 | 74.84 | 73.55 |
| 8 | 86.17 | 85.29 | 61.80 | 59.37 |
| 9 | 87.90 | 87.52 | 66.59 | 66.12 |
| 10 | 86.10 | 85.65 | 58.59 | 58.10 |
| 11 | 86.56 | 85.78 | 71 | 70.09 |
| 12 | 84.14 | 83.27 | 72.68 | 71.79 |
| 13 | 92.16 | 91.91 | 74.57 | 74.35 |
| 14 | 83.30 | 81.85 | 66.81 | 65.10 |
| General (mean ± SD) | 87.55 ± 2.45 | 86.36 ± 2.70 | 69.05 ± 4.89 | 68.11 ± 5.05 |
| Voted Vector | 10-fold CV | LOSO CV | ||
|---|---|---|---|---|
| Accuracy | Geometric Mean | Accuracy | Geometric Mean | |
| 1 | 94.49 | 94.25 | 77.93 | 77.23 |
| 2 | 93.24 | 92.45 | 75.39 | 73.46 |
| 3 | 94.49 | 94.11 | 77.45 | 76.89 |
| 4 | 93.96 | 93.30 | 75.17 | 73.28 |
| 5 | 95.21 | 94.89 | 77.38 | 76.74 |
| 6 | 94.20 | 93.57 | 75.41 | 73.81 |
| 7 | 95.16 | 94.77 | 76.95 | 76.35 |
| 8 | 94.49 | 93.88 | 75.58 | 74.13 |
| 9 | 95.40 | 95.03 | 76.56 | 75.86 |
| 10 | 94.94 | 94.40 | 74.89 | 73.62 |
| 11 | 95.57 | 95.18 | 75.99 | 75.23 |
| 12 | 94.90 | 94.32 | 74.84 | 73.41 |
| General (mean ± SD) | 94.67 ± 0.66 | 94.17 ± 0.79 | 76.12 ± 1.08 | 75 ± 1.54 |
| Author | Year | Method | Key Point(s) | Result(s) (%) |
|---|---|---|---|---|
| Mohammadi et al. [36] | 2016 | Preprocessing, nonlinear feature extraction (fractal dimension, LLE, ApEn), mRMR, and neural networks | - 60 subjects (30 ADHD, 30 control) - 70:10:20 hold-out validation | Acc. = 93.65 |
| Tenev et al. [24] | 2014 | SVM and voting | -117 subjects (67 ADHD, 50 control) -10-fold CV | Acc. = 82.3 |
| Tosun [21] | 2021 | Data augmentation, PSD, SE, and LSTM | - 16 subject - 80:20 hold-out validation | Acc. = 92.15 |
| Khoshnoud et al. [22] | 2015 | Preprocessing, LLE, ApEn, PNN | - 22 subject (12 ADHD, 10 control) - 75:25 hold-out validation | Acc. = 87.5 |
| Chen et al. [23] | 2019 | EEG signal to image conversion, CNN | - 101 subject (50 ADHD, 51 control) - 10-fold CV | Acc. = 94.67 |
| Saini et al. [25] | 2022 | PCA and kNN | - 157 subject (77 ADHD, 80 control) | Acc. = 86.0 |
| Tor et al. [27] | 2021 | Empirical mode decomposition, Discrete wavelet transform, kNN | - 123 subjects (45 ADHD, 62 conduct disorder + ADHD, 16 conduct disorder) - 10-fold CV | Acc.= 97.88 |
| Dubreuil-Vall et al. [26] | 2020 | Preprocessing, spectrogram conversion and CNN | - 40 subject (20 ADHD, 20 control) - Leave pair out CV | Acc. = 88.0 |
| Our method | TQWT, TMP19, NCA, kNN, and majority voting | - 121 subjects (61 ADHD, 60 control) - 10-fold CV and LOSO CV | 10-fold CV | |
| Acc. = 95.57 Gm. = 95.18 | ||||
| LOSO CV | ||||
| Acc. = 77.93 Gm. = 77.23 | ||||
Publisher’s Note: MDPI stays neutral with regard to jurisdictional claims in published maps and institutional affiliations. |
© 2022 by the authors. Licensee MDPI, Basel, Switzerland. This article is an open access article distributed under the terms and conditions of the Creative Commons Attribution (CC BY) license (https://creativecommons.org/licenses/by/4.0/).
Share and Cite
Barua, P.D.; Dogan, S.; Baygin, M.; Tuncer, T.; Palmer, E.E.; Ciaccio, E.J.; Acharya, U.R. TMP19: A Novel Ternary Motif Pattern-Based ADHD Detection Model Using EEG Signals. Diagnostics 2022, 12, 2544. https://doi.org/10.3390/diagnostics12102544
Barua PD, Dogan S, Baygin M, Tuncer T, Palmer EE, Ciaccio EJ, Acharya UR. TMP19: A Novel Ternary Motif Pattern-Based ADHD Detection Model Using EEG Signals. Diagnostics. 2022; 12(10):2544. https://doi.org/10.3390/diagnostics12102544
Chicago/Turabian StyleBarua, Prabal Datta, Sengul Dogan, Mehmet Baygin, Turker Tuncer, Elizabeth Emma Palmer, Edward J. Ciaccio, and U. Rajendra Acharya. 2022. "TMP19: A Novel Ternary Motif Pattern-Based ADHD Detection Model Using EEG Signals" Diagnostics 12, no. 10: 2544. https://doi.org/10.3390/diagnostics12102544