Design of Liver Functional Reserve Estimation Technique Based on Optical Densitometry

 ,
,  , and
, and 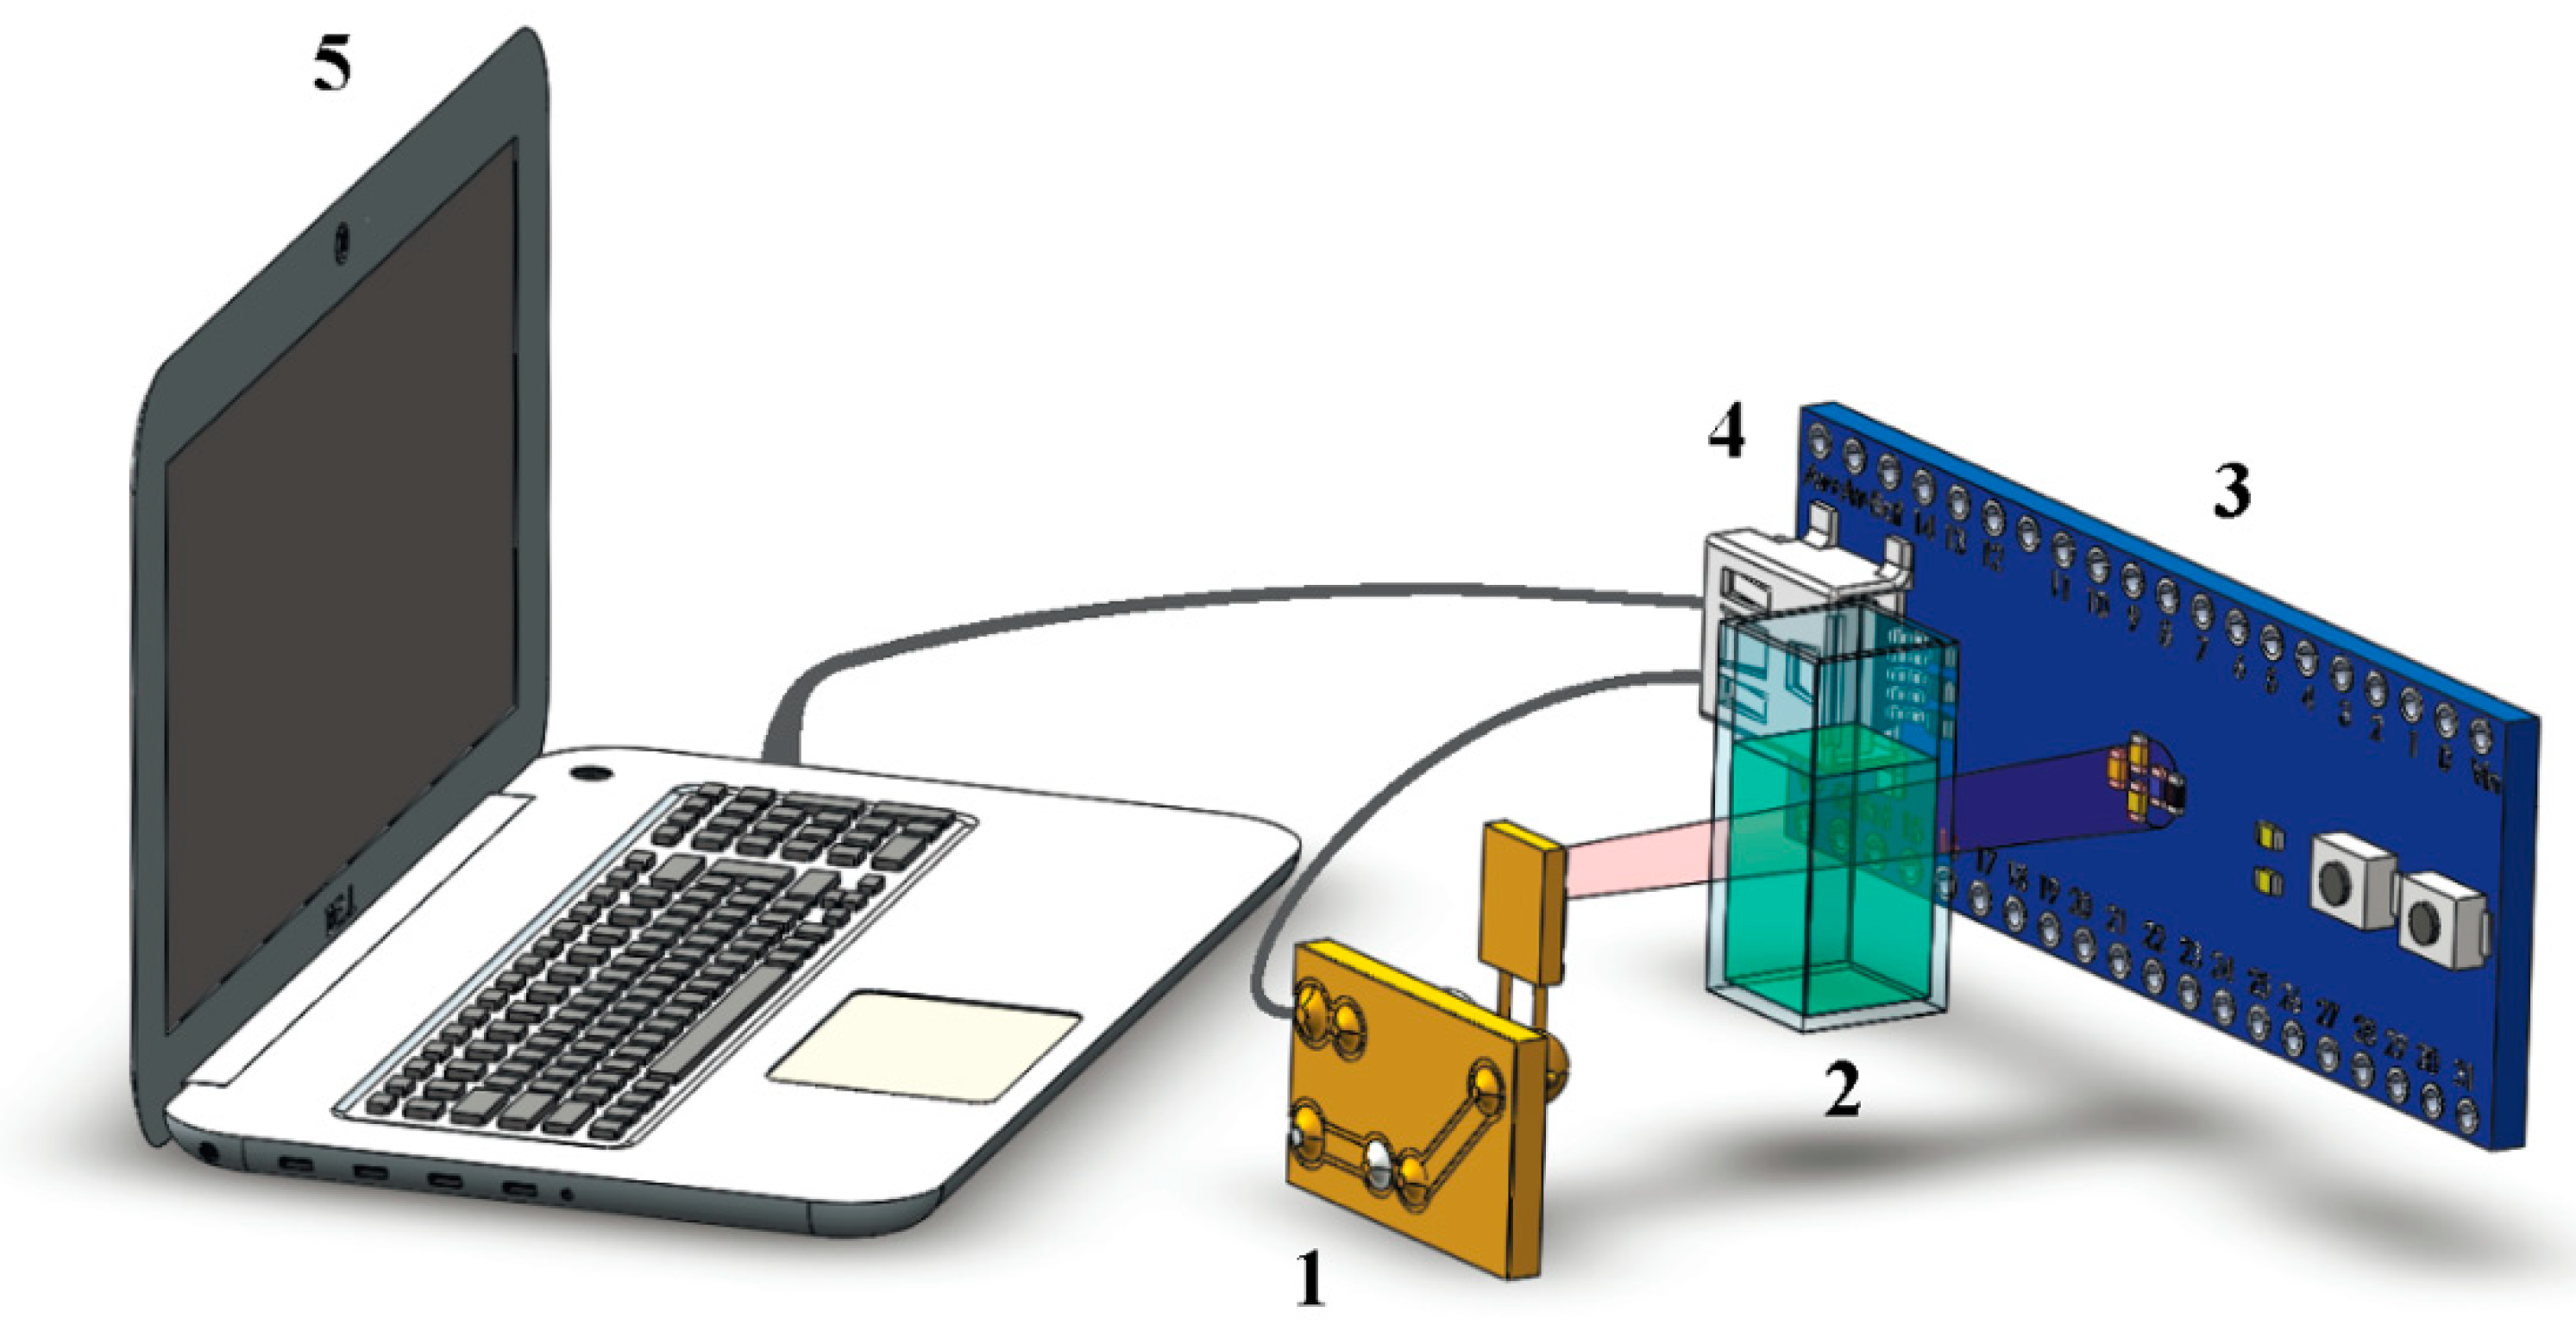
Abstract
:1. Introduction
2. Experimental Setup of Optical Densitometry
- Small dimension:The size of the experimental setup is 15 × 7 × 5 cm. The number of elements in this installation is minimized.
- Noise immunity:To improve the noise immunity, the Butterworth low pass filter and median filter were used.
- Cost-effectiveness:Optimized device design allows using cheaper optical elements. Emitting diode with 810 nm was used as a light source. (Which is cheaper than deuterium and tungsten sources)
- Simplicity of use:This experimental setup does not require additional training of users for carrying out experimental studies.
- Quick real-time presentation of the results:Processing of experimental studies takes up to several minutes.
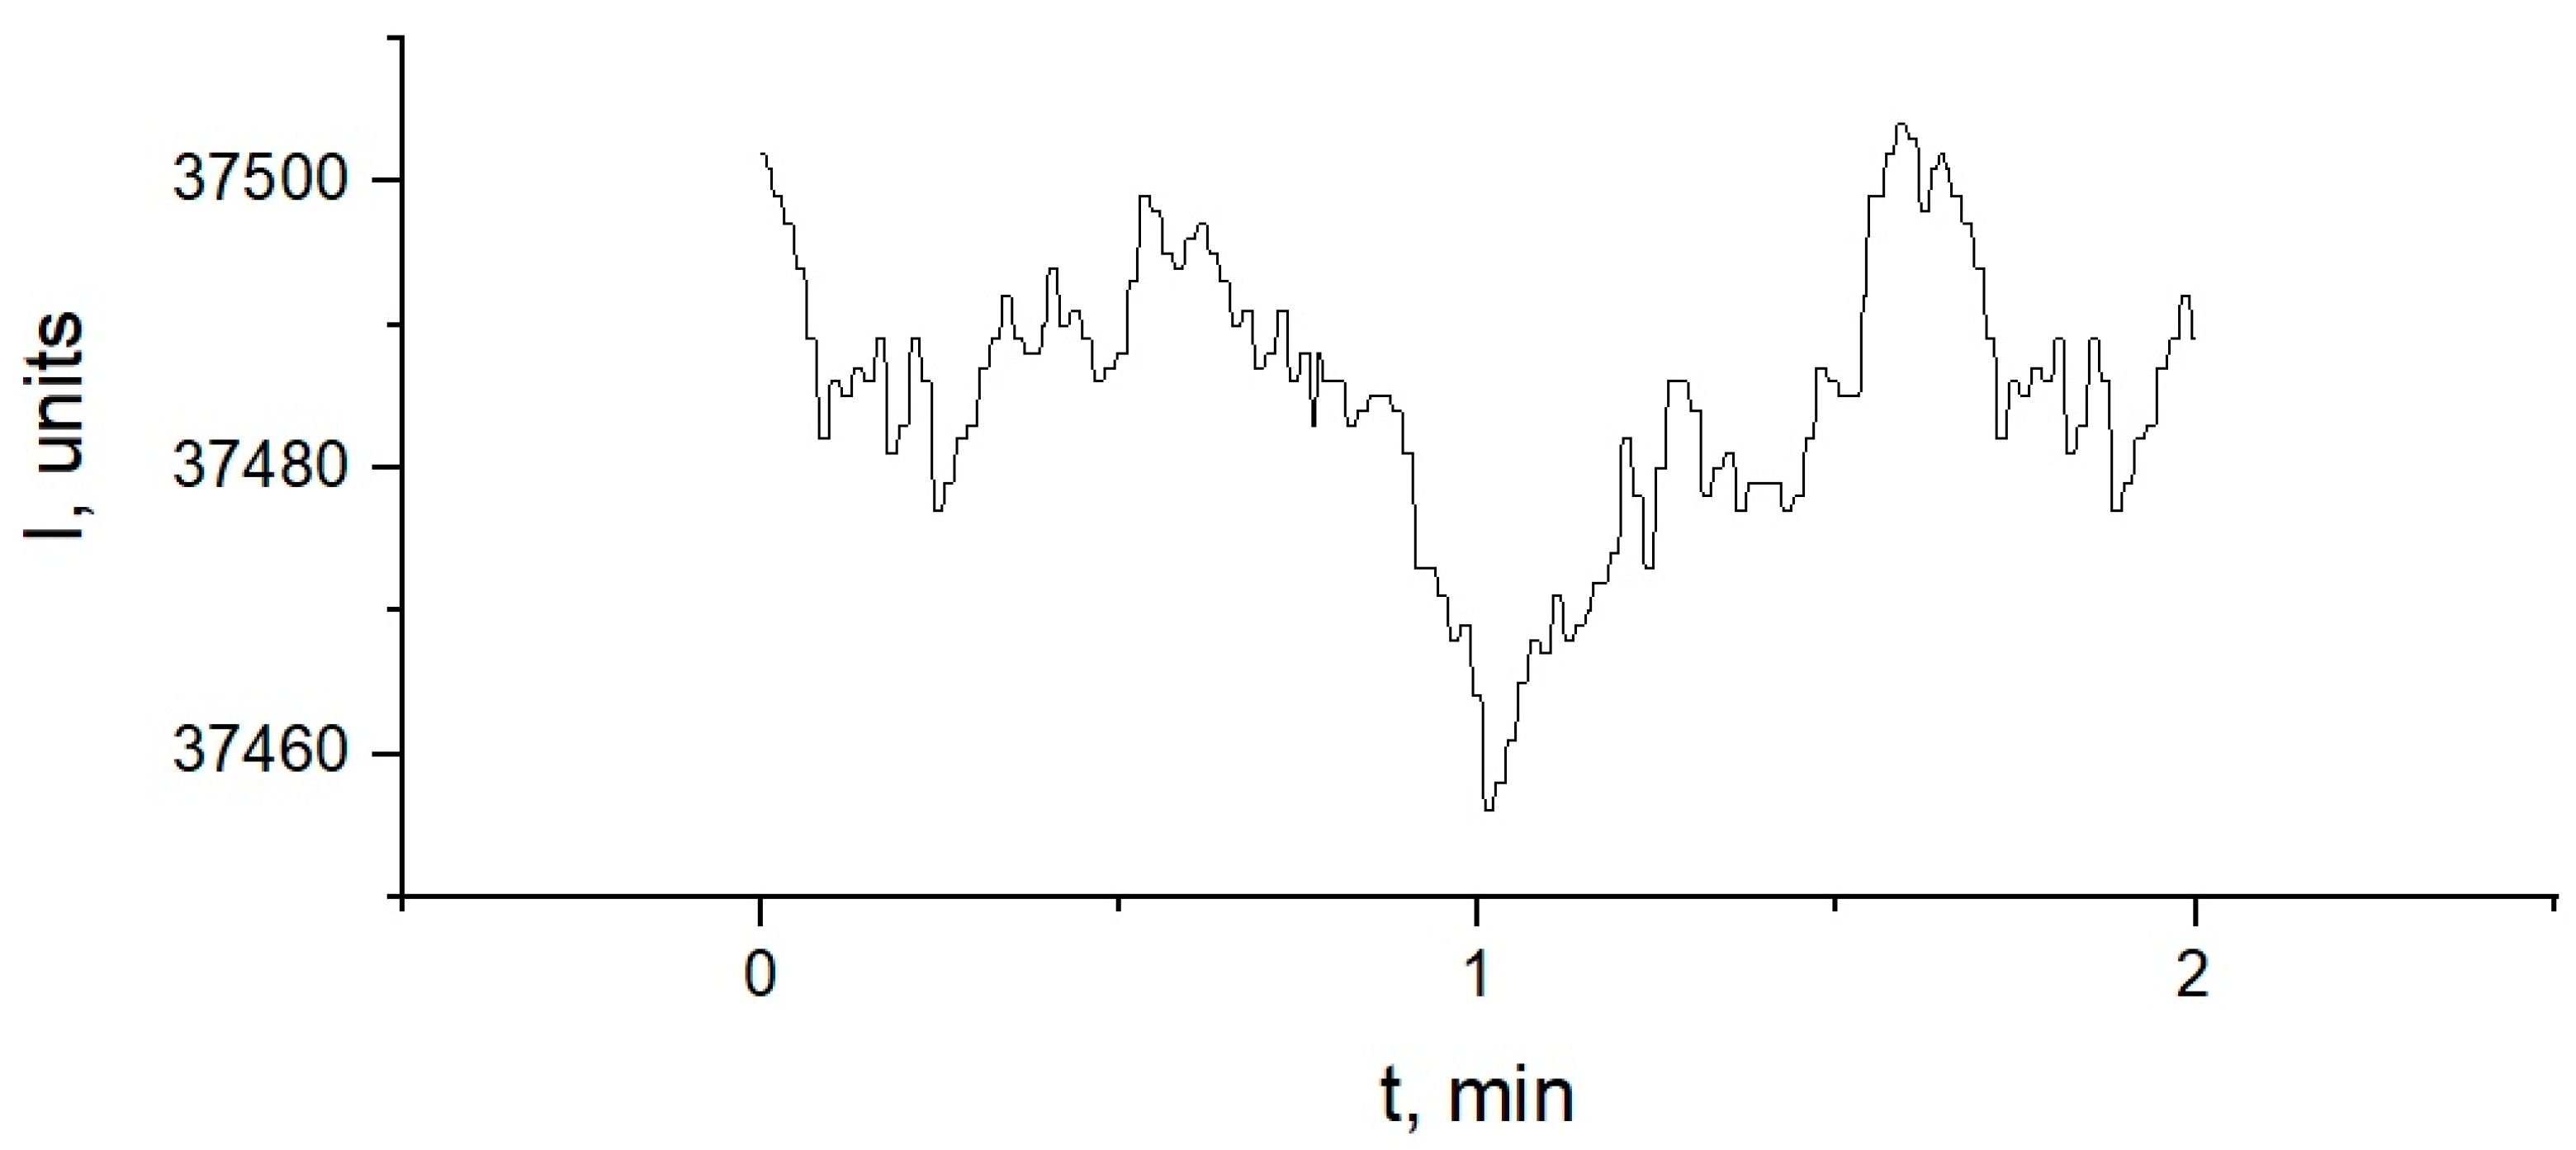
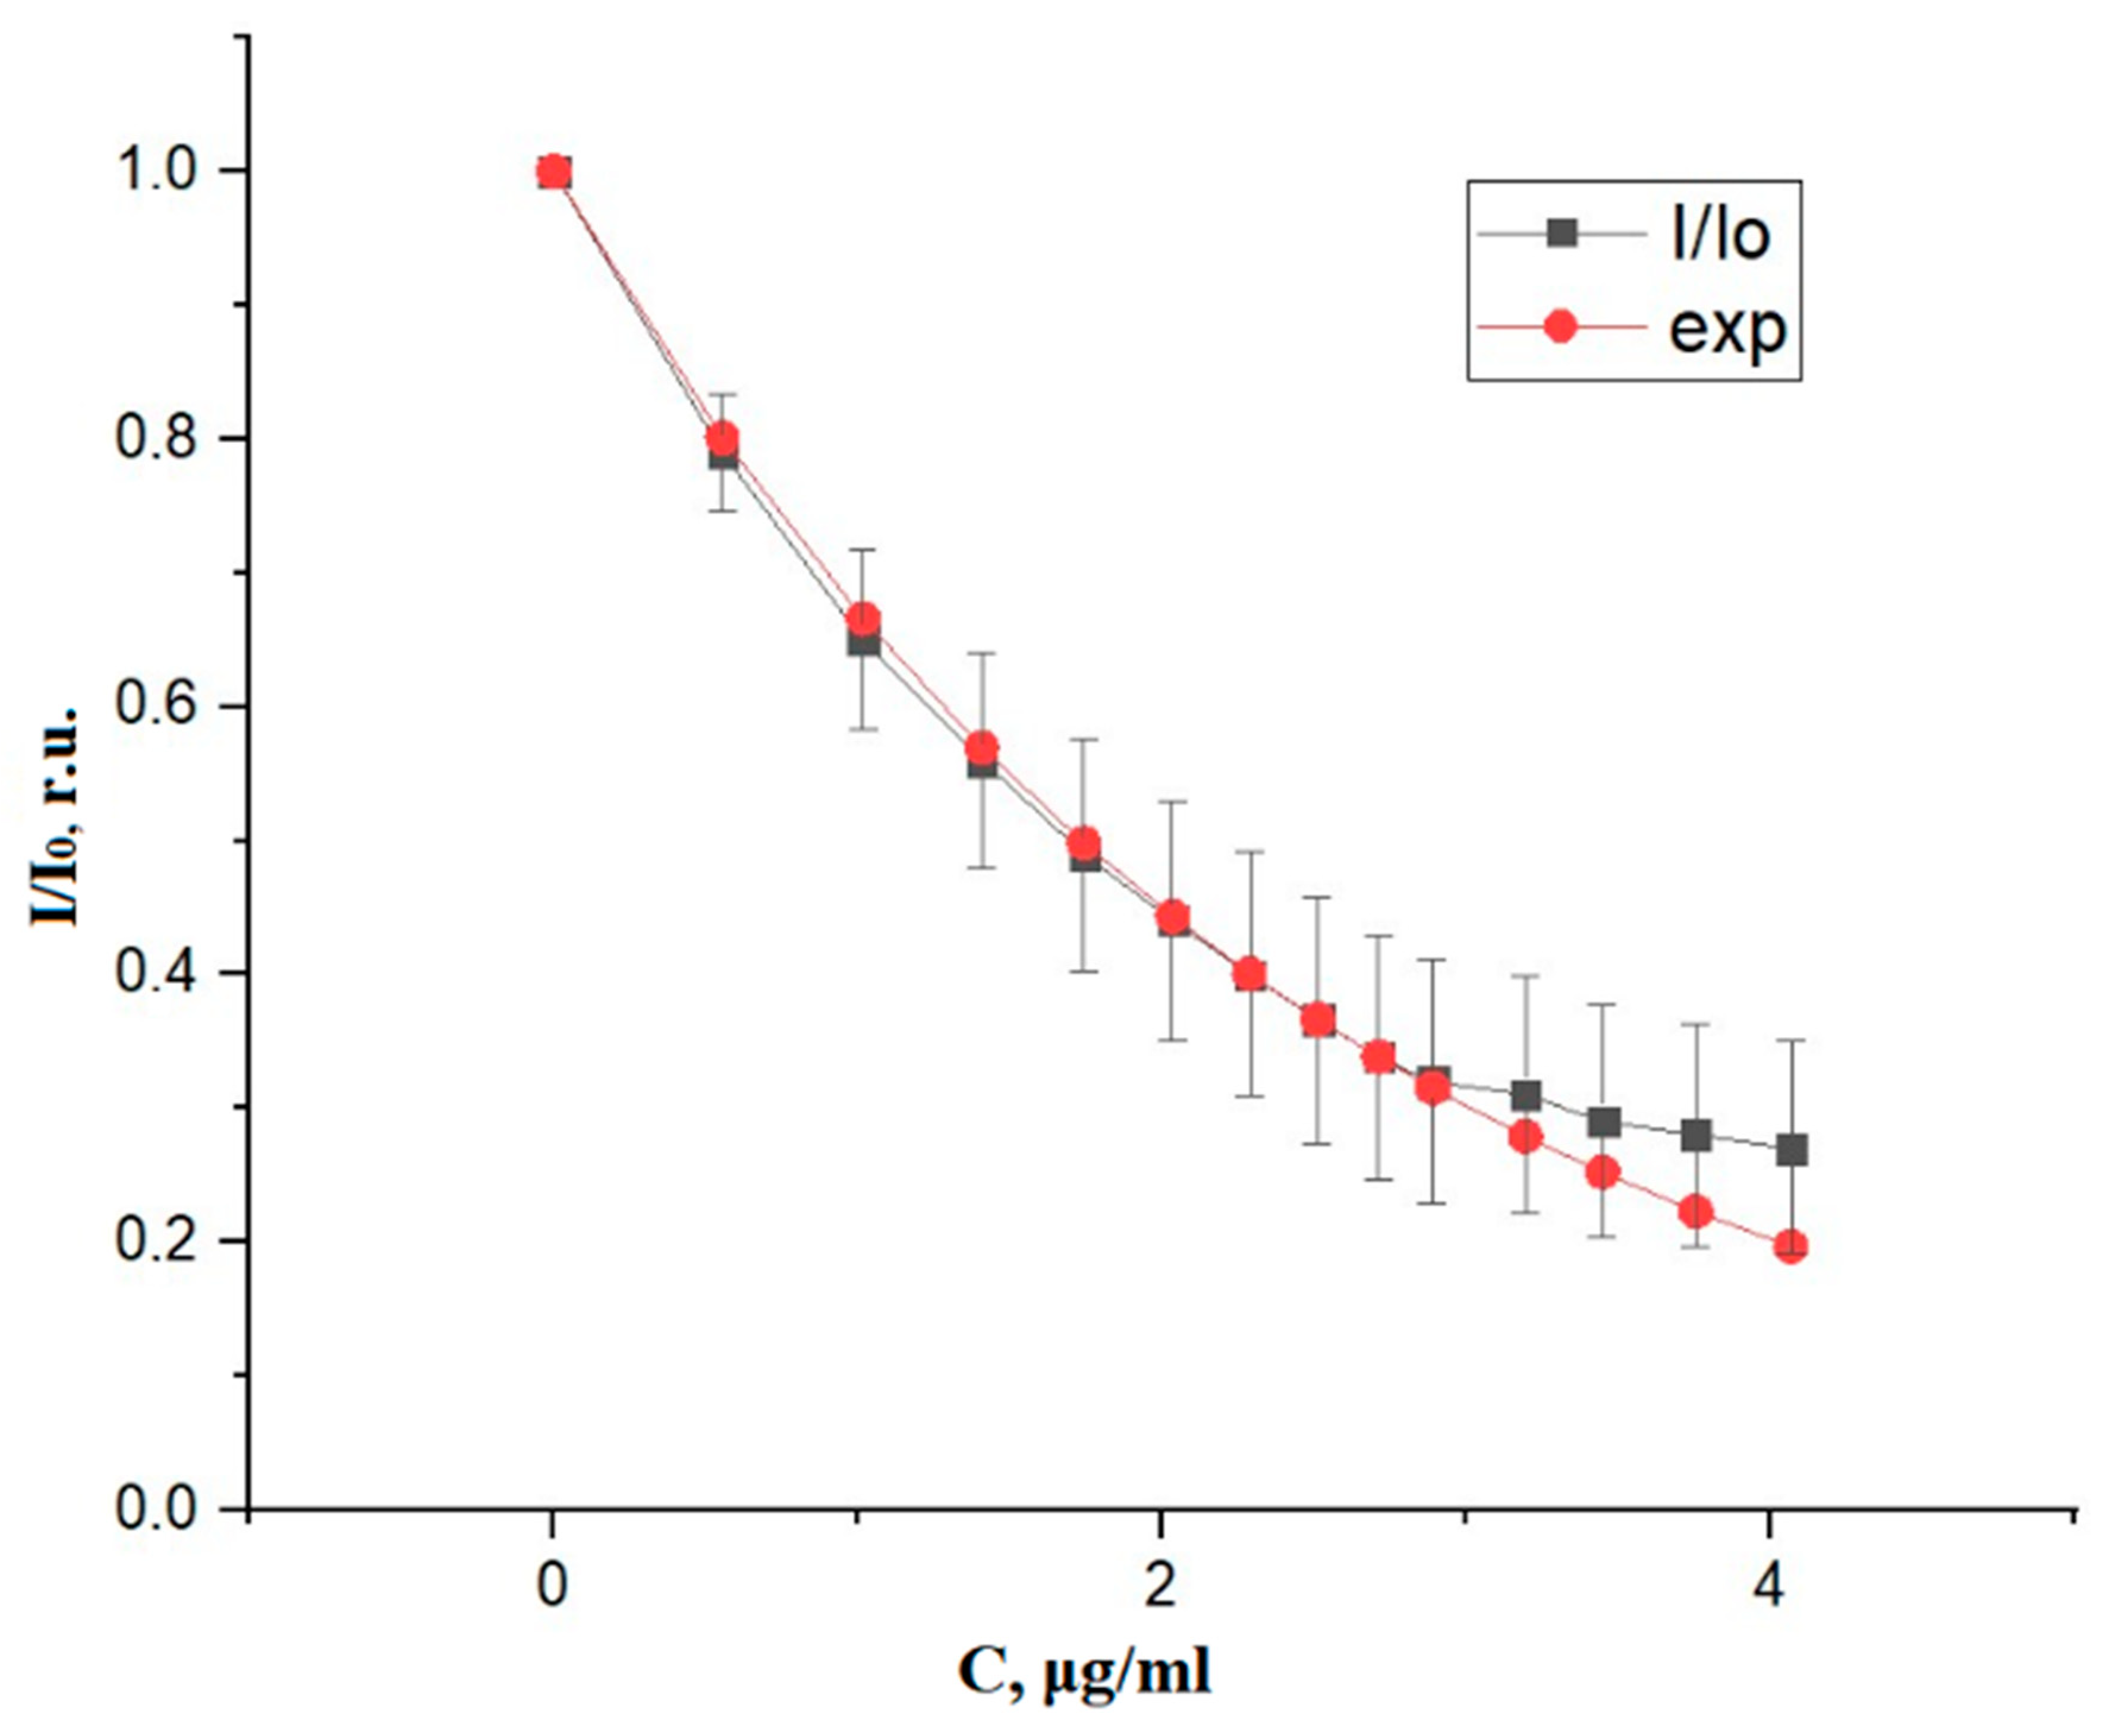
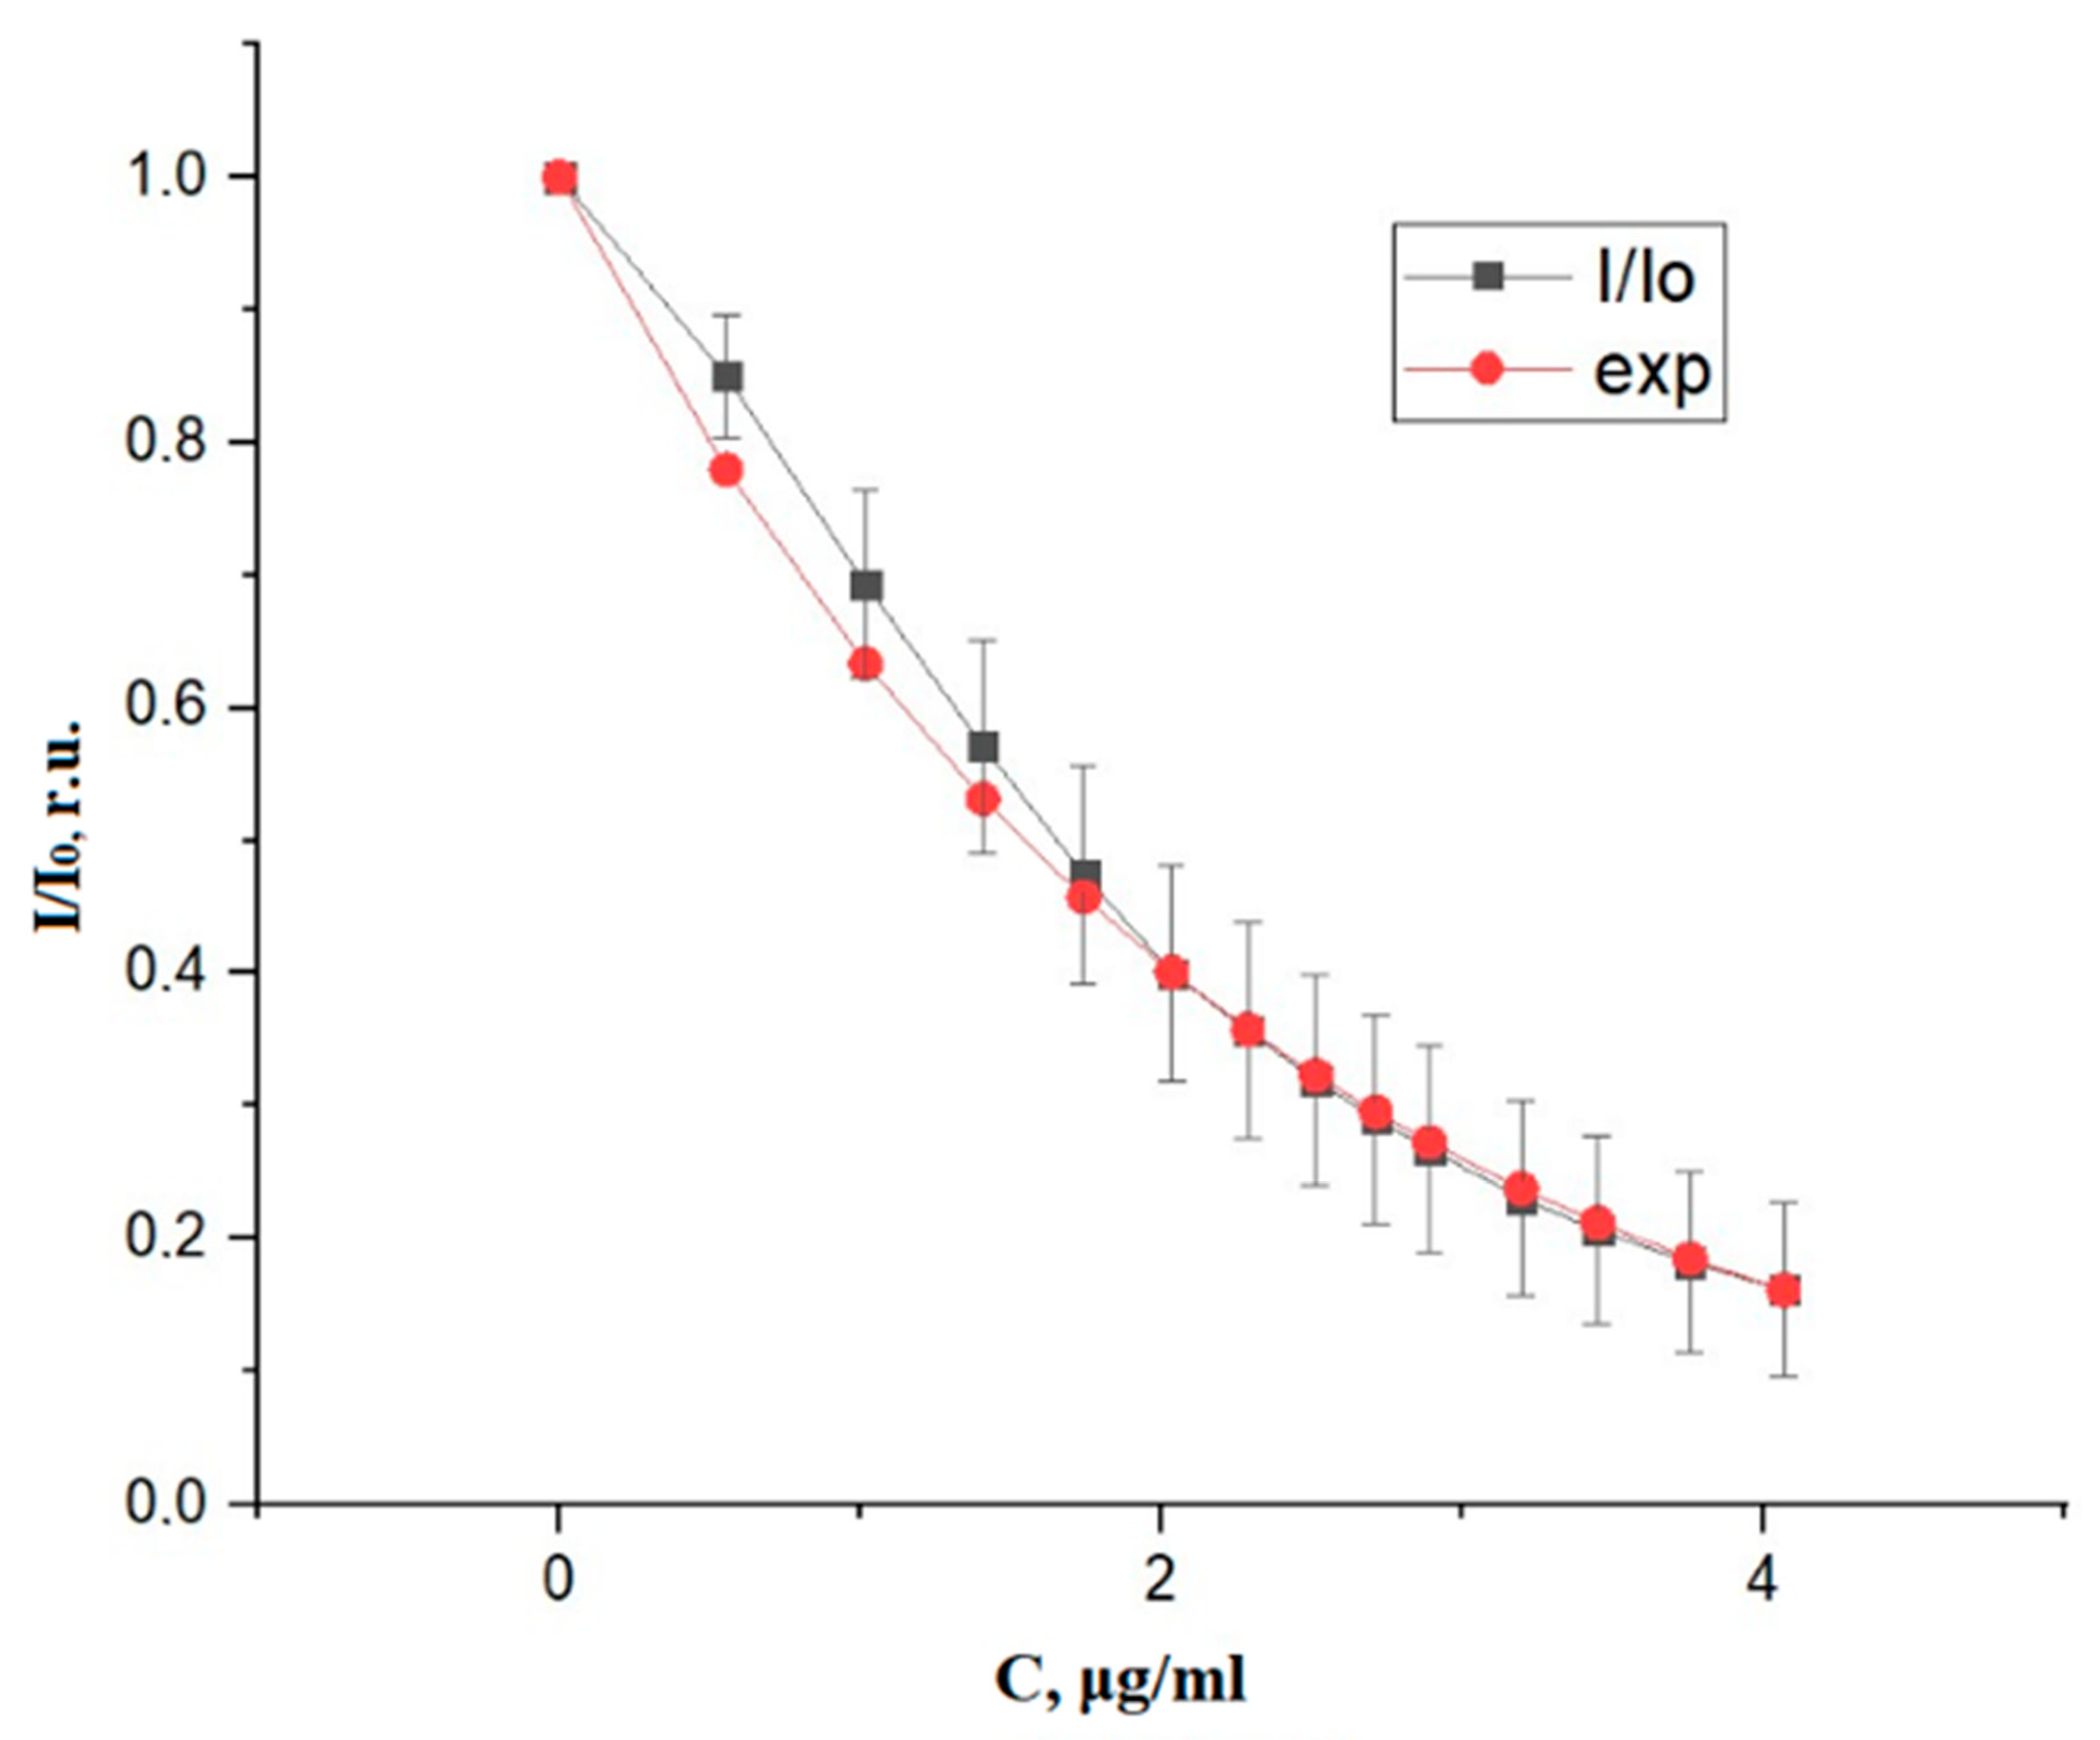
3. Results and Discussion
4. Conclusions
Author Contributions
Funding
Acknowledgments
Conflicts of Interest
References
- Rosen, H.R. Chronic hepatitis C infection. N. Engl. J. Med. 2011, 364, 2429–2438. [Google Scholar] [CrossRef] [PubMed] [Green Version]
- World Health Organization. Available online: https://www.who.int/campaigns/world-hepatitis-day/2019 (accessed on 3 July 2020).
- Williamson, R.M.; Price, J.F.; Glancy, S.; Perry, E.; Nee, L.D.; Hayes, P.C. Prevalence of and risk factors for hepatic steatosis and nonalcoholic fatty liver disease in people with type 2 diabetes: The Edinburgh Type 2 Diabetes Study. Diabetes Care 2011, 34, 1139–1144. [Google Scholar] [CrossRef] [PubMed] [Green Version]
- Aijaz, A.; Perumpail, R.B.; Harrison, S.A. High prevalence of hepatic fibrosis in the setting of coexisting diabetes and hepatic steatosis: A case for selective screening in the general population? Hepatology 2016, 63, 20–22. [Google Scholar]
- Mueller, A.R.; Platz, K.P.; Kremer, B. Early postoperative complications following liver transplantation. Best Pract. Res. Clin. Gastroenterol. 2004, 18, 881–900. [Google Scholar] [CrossRef]
- Bonfrate, L.; Grattagliano, I.; Palasciano, G.; Portincasa, P. Dynamic carbon 13 breath tests for the study of liver function and gastric emptying. Gastroenterol. Rep. 2014, 3, 12–21. [Google Scholar] [CrossRef] [PubMed]
- Sakka, S.G. Assessing liver function. Curr. Opin. Crit. Care 2007, 13, 207–214. [Google Scholar] [CrossRef] [PubMed]
- Kunikowska, A.J.; Wildgruber, M.; Schulte-Frohlinde, E.; Lahmer, T.; Schmid, R.M.; Huber, W. Liver function assessment using indocyanine green plasma disappearance rate in a young male with icteric leptospirosis: A case report. BMC Infect. Dis. 2019, 19, 473. [Google Scholar] [CrossRef] [PubMed] [Green Version]
- Slakter, J.S.; Yannuzzi, L.A.; Guyer, D.R.; Sorenson, J.A.; Orlock, D.A. Indocyanine-green angiography. Curr. Opin. Ophthalmol. 1995, 6, 25–32. [Google Scholar] [CrossRef] [PubMed]
- Haruna, M.; Kumon, K.; Yahagi, N.; Watanabe, Y.; Ishida, Y.; Kobayashi, T.; Aoyagi, T. Blood Volume Measurement at the Bedside Using ICG Pulse Spectrophometry. Anesthesiology 1998, 89, 1322–1328. [Google Scholar] [CrossRef] [PubMed]
- Osamu, O.; Tetsuya, K.; Hiroyuki, S.; Soichiro, I.; Shin, T.; Akimasa, N. ICG Pulse Spectrophotometry for Perioperative Liver Function in Hepatectomy. J. Surg. Res. 2002, 103, 109–113. [Google Scholar]
- Kovac, N.; Peric, M. Liver function assessment by indocyanine green plasma disappearance rate in patients with intra-abdominal hypertension after “non-hepatic” abdominal surgery. Curr. Med. Res. Opin. 2018, 34, 1741–1746. [Google Scholar] [CrossRef] [PubMed]
- Mayr, U.; Fahrenkrog-Petersen, L.; Batres-Baires, G.; Herner, A.; Rasch, S.; Schmid, R.M.; Lahmer, T. Largevolume paracentesis effects plasma disappearance rate of indocyanine green in critically ill patients with decompensated liver cirrhosis and intraabdominal hypertension. Ann. Intensive Care 2018, 8, 1–10. [Google Scholar]
- Pantanali, C.A.; Gonzalez, D.E.; D’Albuquerque, L.A.; Andraus, W.; Barzallo, P.; Asperti, A.M. Lessons Learned with the LiMON Method of Indocyanine Green Elimination. EC Gastroenterol. Dig. Syst. 2018, 5, 297–304. [Google Scholar]
- Li, H.-m. Microcirculation of liver cancer, microenvironment of liver regeneration, and the strategy of Chinese medicine. Chin. J. Integr. Med. 2016, 22, 163–167. [Google Scholar] [CrossRef] [PubMed]
- Tian, H.; Qi, W. Quantitative analysis of microcirculation blood perfusion in patients with hepatocellular carcinoma before and after transcatheter arterial chemoembolisation using contrast-enhanced ultrasound. Eur. J. Cancer 2016, 68, 82–89. [Google Scholar] [CrossRef] [PubMed]
- Davydov, R.V.; Antonov, V.I.; Yushkova, V.V.; Grebenikova, N.M.; Dudkin, V.I. A new algorithm for processing the absorption and scattering signals of laser radiation on a blood vessel and human tissues. J. Phys. Conf. Ser. 2019, 1236, 012079. [Google Scholar] [CrossRef]
- Bisyarin, M.A.; Kotov, O.I.; Hartog, A.H.; Liokumovich, L.B.; Ushakov, N.A. Influence of a variable Rayleigh scattering-loss coefficient on the light backscattering in multimode optical fibers. Appl. Opt. 2017, 56, 4629. [Google Scholar] [CrossRef] [PubMed]
- Kotov, O.; Chapalo, I. Signal-to-noise ratio for mode-mode fiber interferometer. In Optical Measurement Systems for Industrial Inspection X; SPIE Optical Metrology: Munich, Germany, 2017. [Google Scholar]
- Liokumovich, L.B.; Kostromitin, A.O.; Ushakov, N.A.; Kudryashov, A.V. Method for Measuring Laser Frequency Noise. J. Appl. Spectrosc. 2020, 86, 1106–1112. [Google Scholar] [CrossRef]
- Privalov, V.E.; Rybalko, A.V.; Charty, P.V.; Shemanin, V.G. Effect of noise and vibration on the performance of a particle concentration laser meter and optimization of its parameters. Tech. Phys. 2007, 52, 352–355. [Google Scholar] [CrossRef]
- Velichko, E.; Nepomnyashchaya, E.; Baranov, M.; Galeeva, M.A.; Pavlov, V.A.; Zavjalov, S.V.; Savchenko, E.; Pervunina, T.M.; Govorov, I.; Komlichenko, E. A Concept of Smart Medical Autonomous Distributed System for Diagnostics Based on Machine Learning Technology. In Internet of Things, Smart Spaces, and Next Generation Networks and Systems; Springer: Cham, Switzerland, 2019; pp. 515–524. [Google Scholar]


© 2020 by the authors. Licensee MDPI, Basel, Switzerland. This article is an open access article distributed under the terms and conditions of the Creative Commons Attribution (CC BY) license (http://creativecommons.org/licenses/by/4.0/).
Share and Cite
Savchenko, E.; Kolokolnikov, I.; Velichko, E.; Osovskikh, V.; Kiseleva, L.; Musakulova, Z. Design of Liver Functional Reserve Estimation Technique Based on Optical Densitometry. Diagnostics 2020, 10, 599. https://doi.org/10.3390/diagnostics10080599
Savchenko E, Kolokolnikov I, Velichko E, Osovskikh V, Kiseleva L, Musakulova Z. Design of Liver Functional Reserve Estimation Technique Based on Optical Densitometry. Diagnostics. 2020; 10(8):599. https://doi.org/10.3390/diagnostics10080599
Chicago/Turabian StyleSavchenko, Ekaterina, Ilya Kolokolnikov, Elena Velichko, Victor Osovskikh, Lyubov Kiseleva, and Zhyldyz Musakulova. 2020. "Design of Liver Functional Reserve Estimation Technique Based on Optical Densitometry" Diagnostics 10, no. 8: 599. https://doi.org/10.3390/diagnostics10080599