A Mineralogical Context for the Organic Matter in the Paris Meteorite Determined by A Multi-Technique Analysis

 , , , ,
Abstract
:1. Introduction
2. Materials and Methods
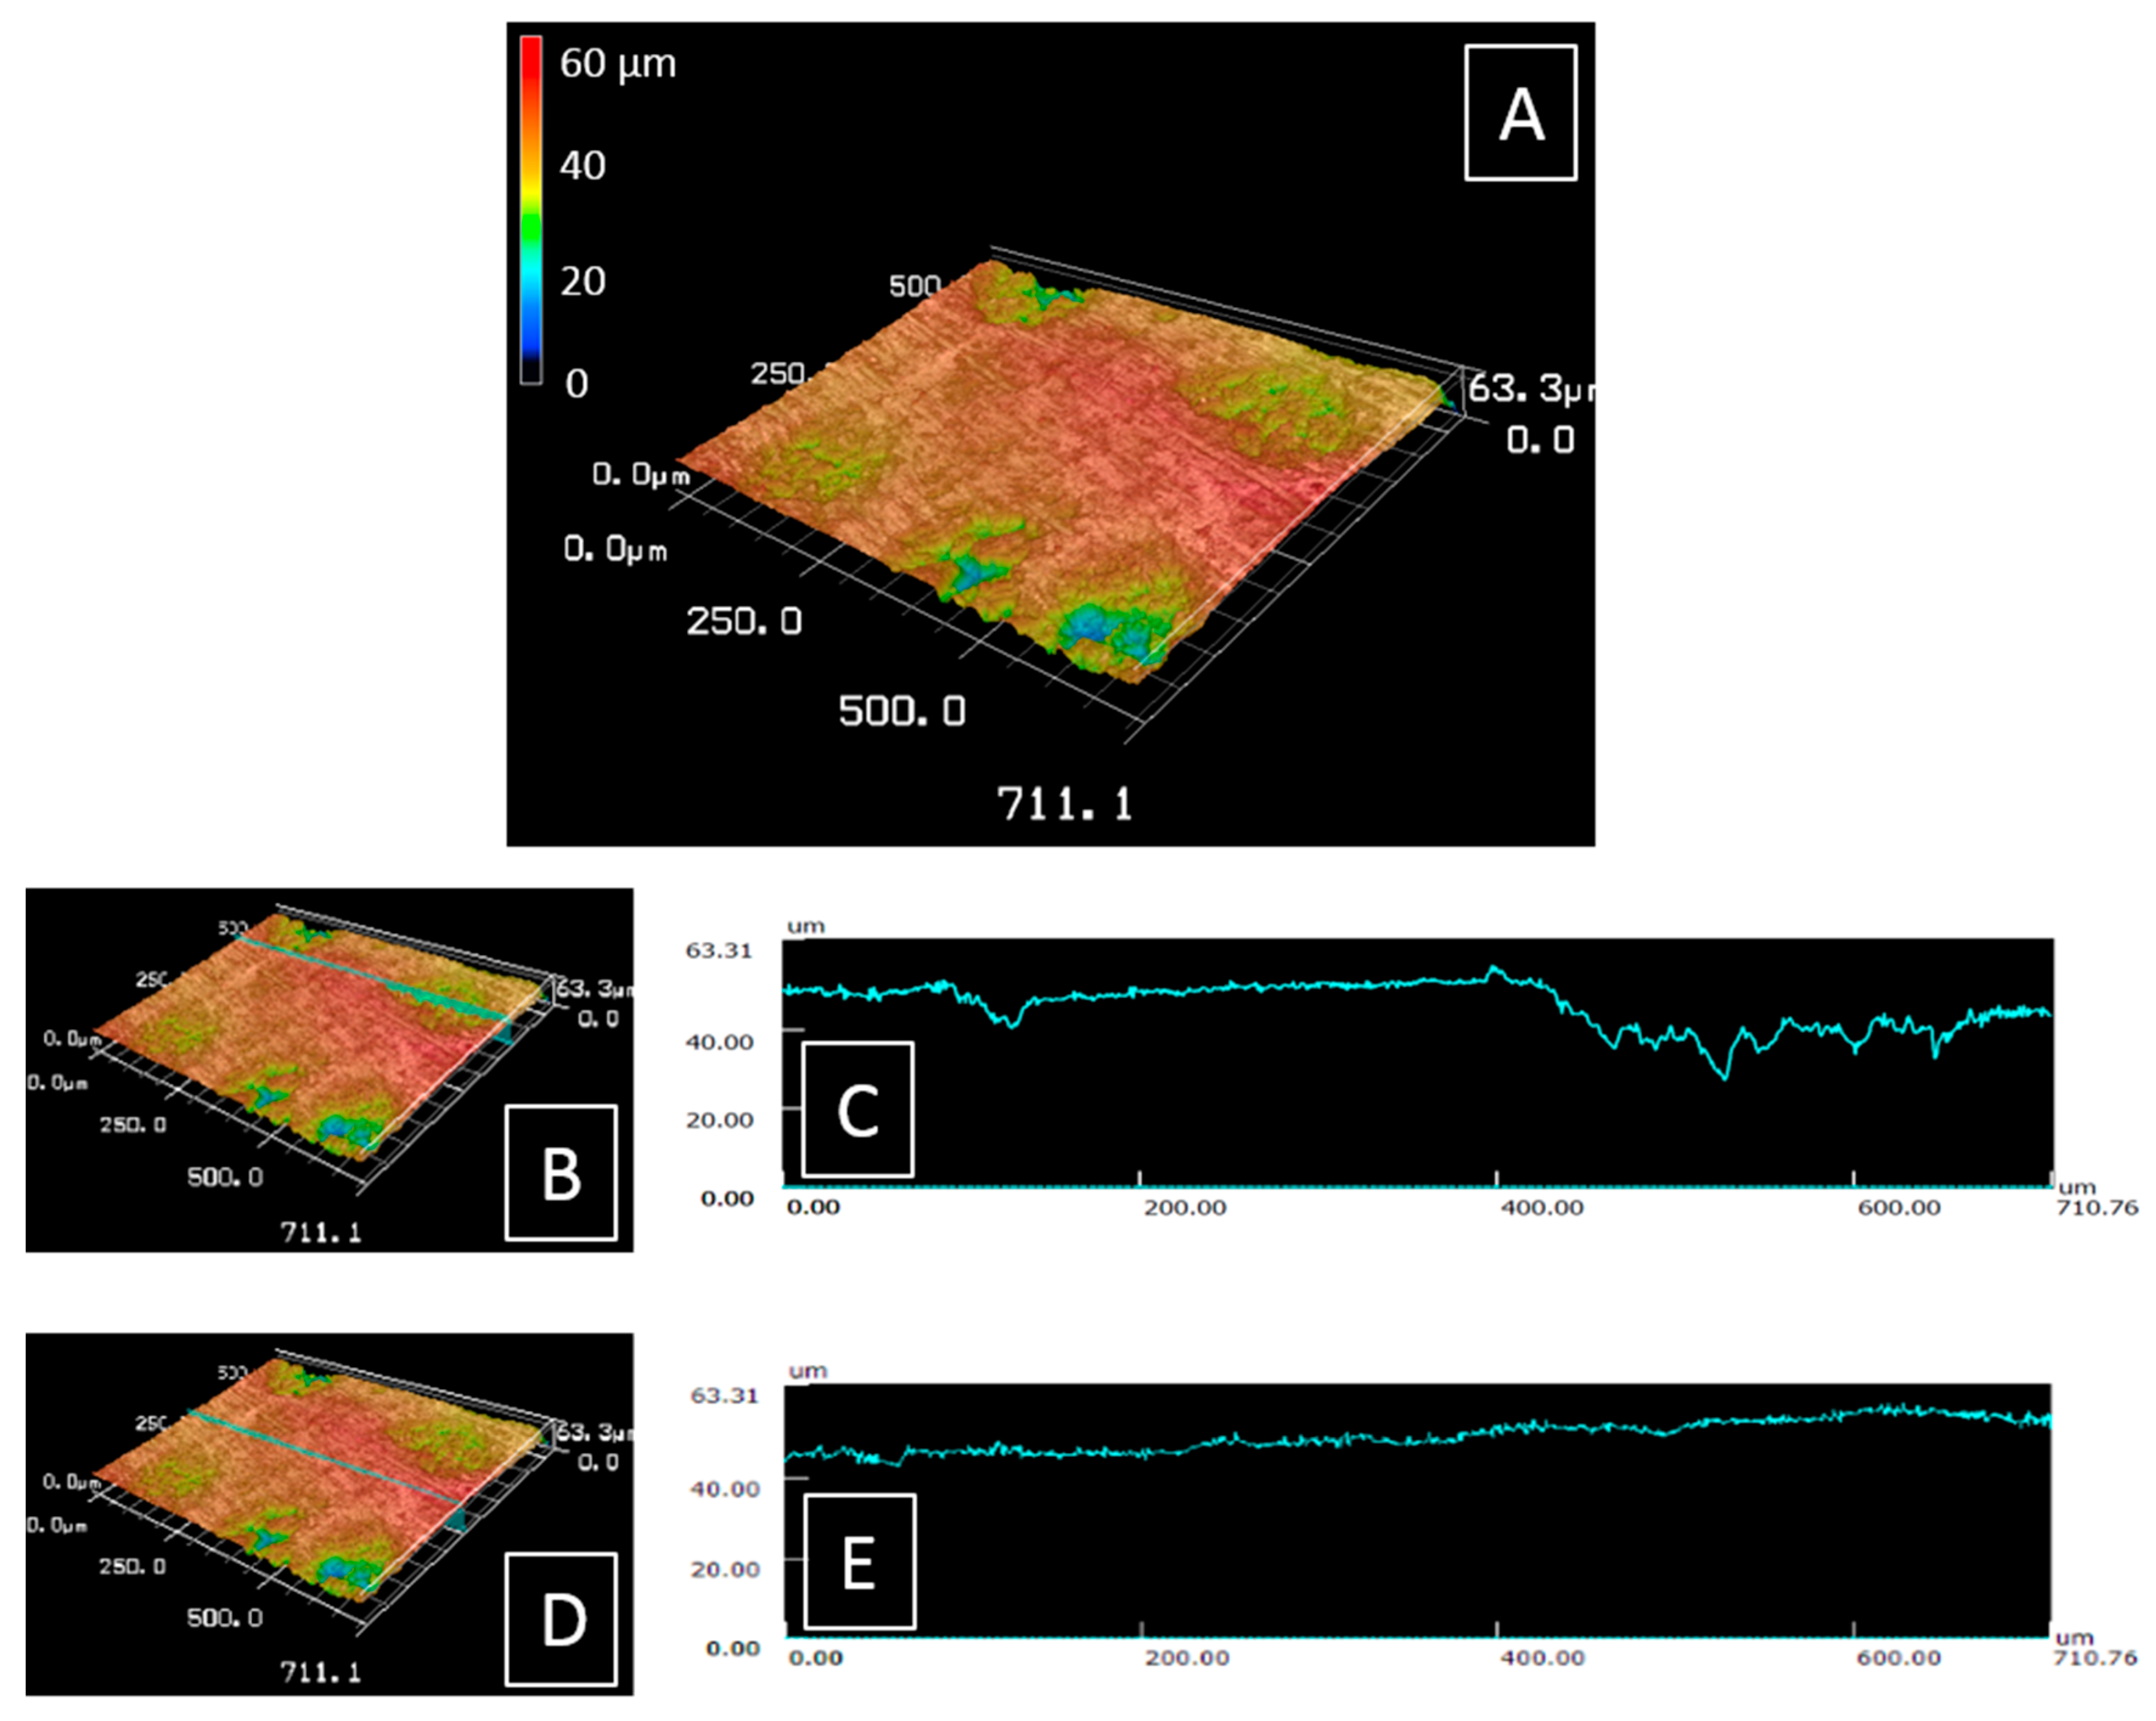
2.1. Surface Roughness Measurements
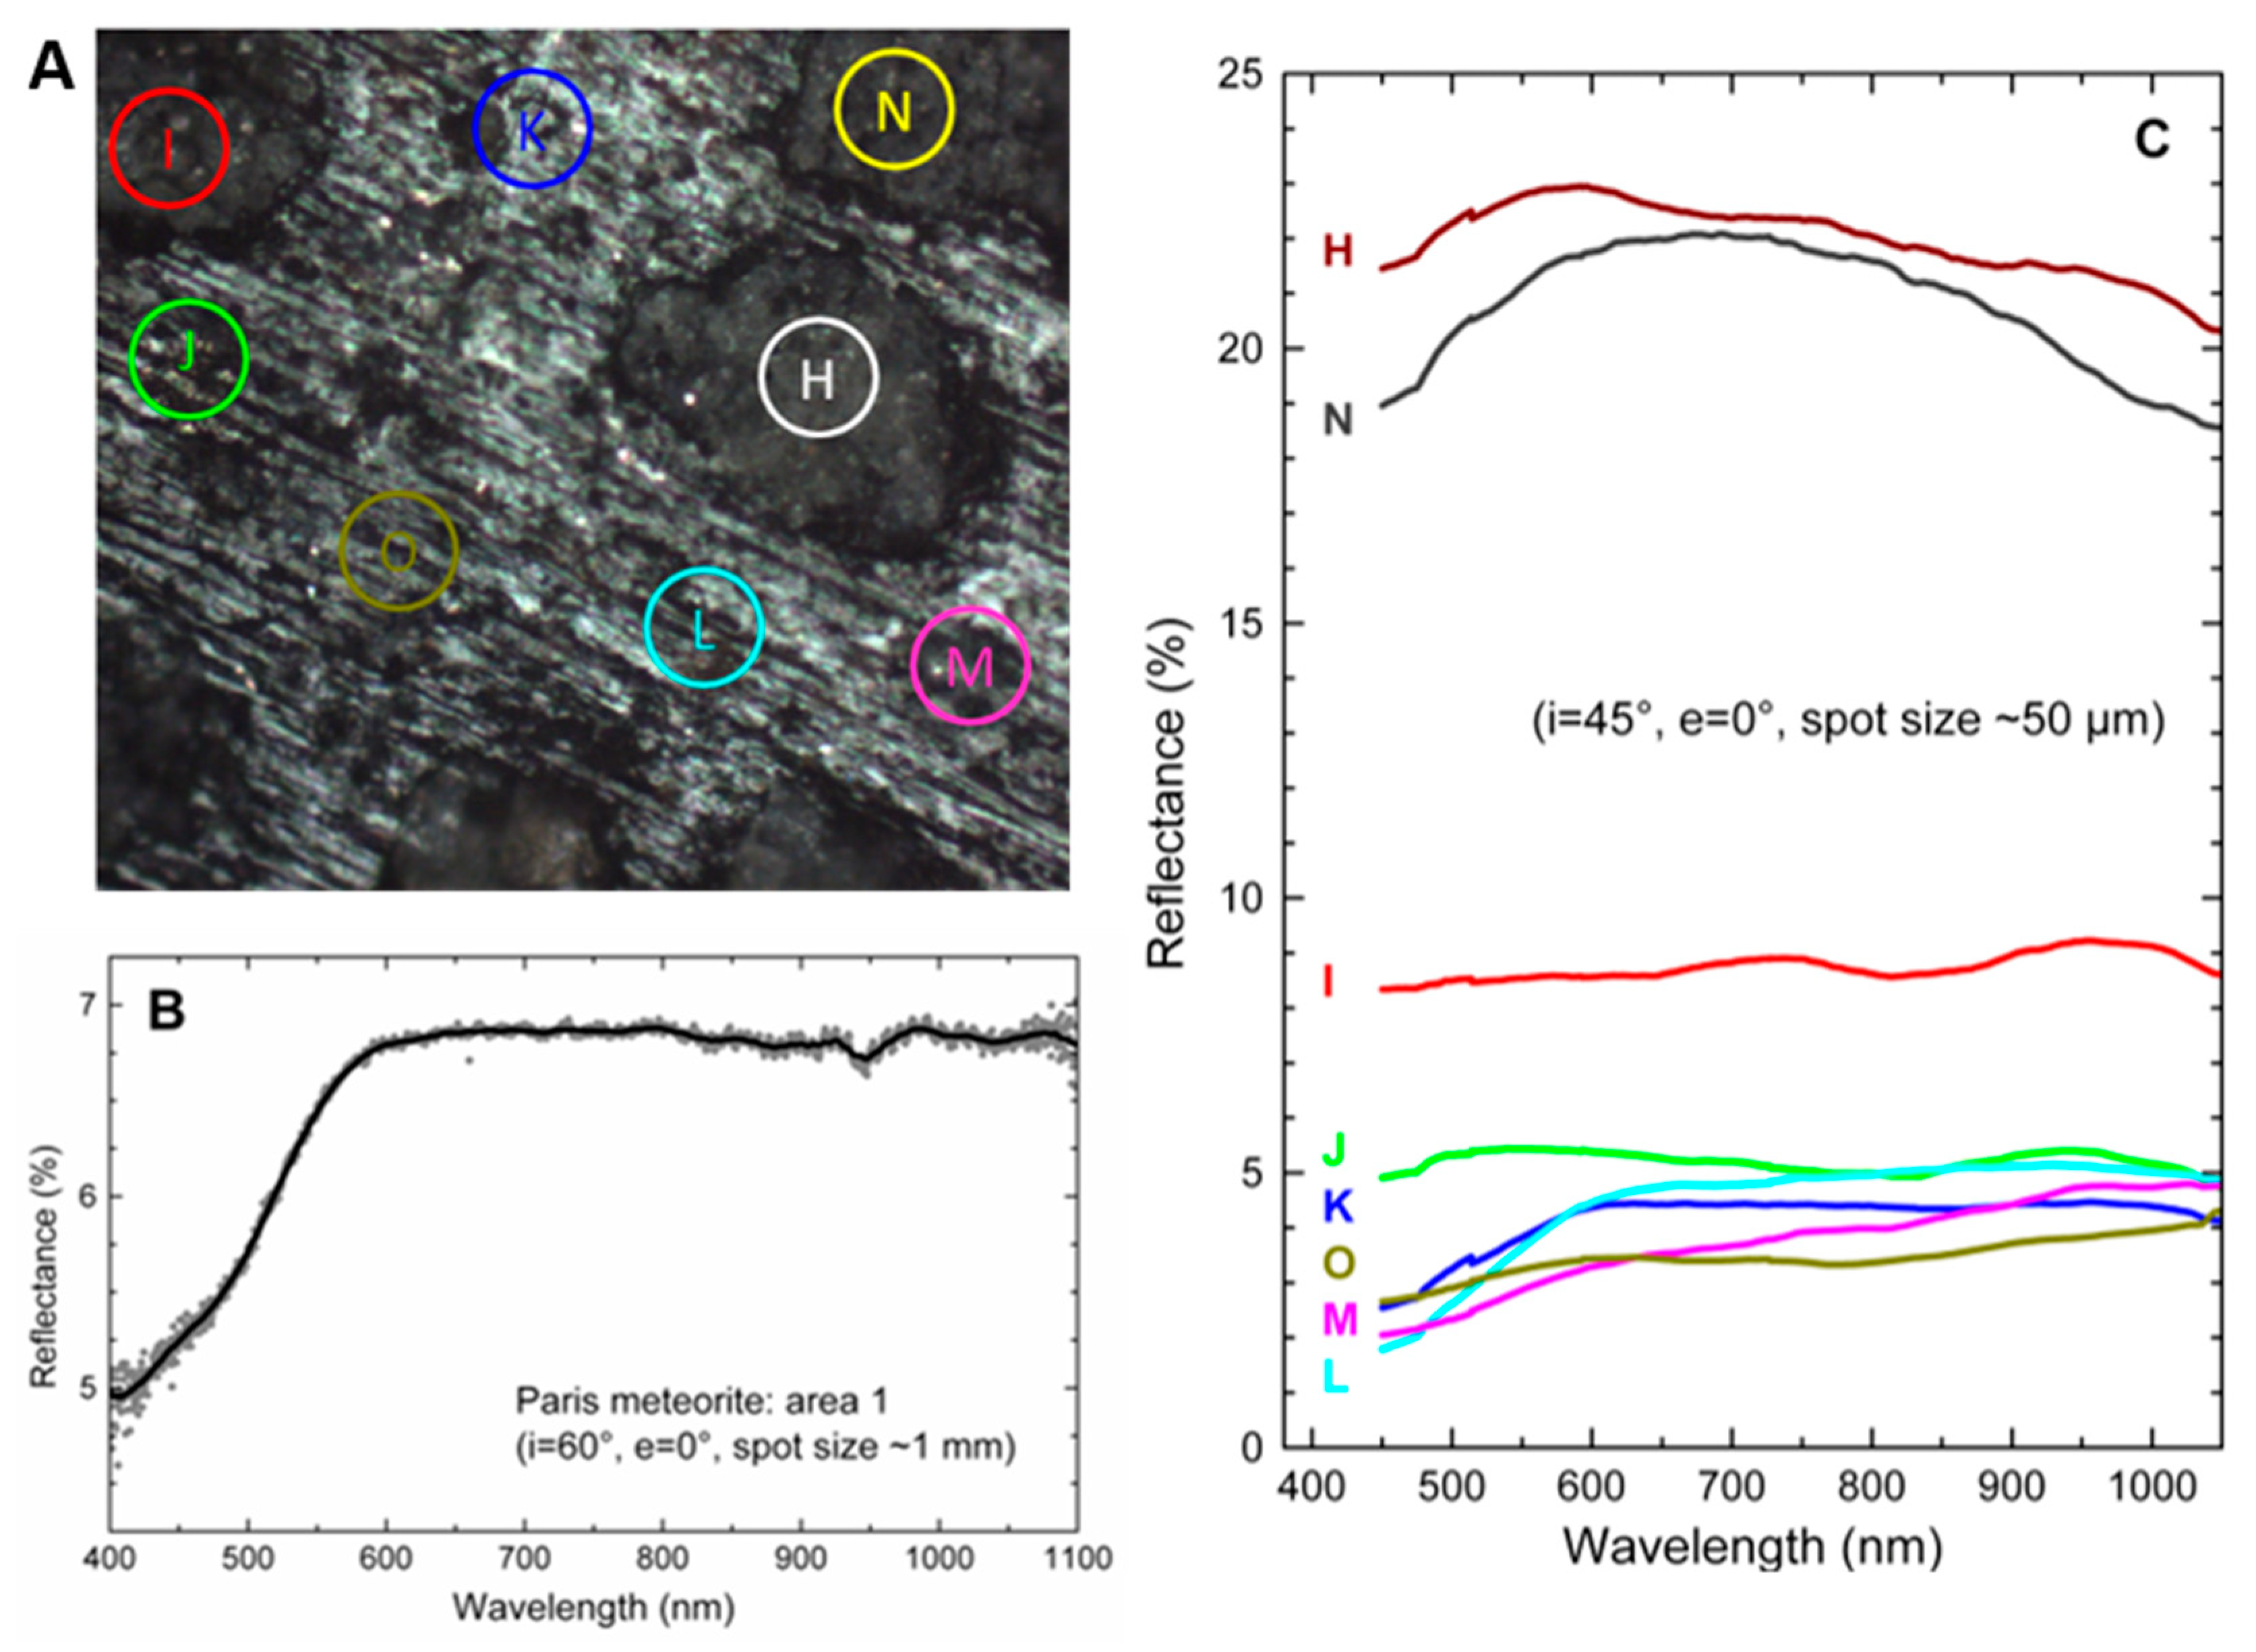
2.2. Visible and Near-IR (0.3–1.1 μm) Diffuse Reflectance Spectroscopy
2.3. Mid-IR Reflectance Analysis
2.4. Raman Micro-Spectroscopy
2.5. Micro-PIXE
2.6. TOF-SIMS (Time-of-FlightSecondary Ions Mass Spectrometry)
- to clean the sample’s selected areas, I and II, before starting the analysis. As the first molecular layers are often due to common organic contaminations, removing these layers prior to mass spectrometry analysis was critical for this study. One objective of the argon cluster gun was to get rid of surface contamination without destroying the endogenous organic material. Measurements on the chondrules were used to monitor and optimize the sputtering time necessary to eliminate the organic surface contaminants. When the superficial deposition of organic contaminants was eliminated by the cleaning process, we observed simultaneously an increase then a plateau in ion emission rates of elemental ions such as Mg+, Si+, and Fe+ in positive mode, and O−, S− and lowly complex compounds such as SiO2− and PO2− in negative mode. Typically, the ions related to the contamination disappeared after a few 10 s of irradiation. As for the endogenous organic material, the evolution of some ions such as CHO+, C2H5 +, C3H5+, C5H10+, C3H7NO2+, C4H11NO2+, C9H12O2+, and C10H14O2+ was followed as a function of Ar cluster bombardment dose. These ions underwent a high emission decrease (~10 times) during the first seconds of irradiation to later stabilize into a steady state for the following analysis which lasted 900 s of sputtering. This confirms that the organic matter identified and discussed in this paper is endogenous to the meteorite. For more details, the effect of the surface cleaning by bombarding with argon clusters prior to TOF-SIMS analysis has been discussed in [64].
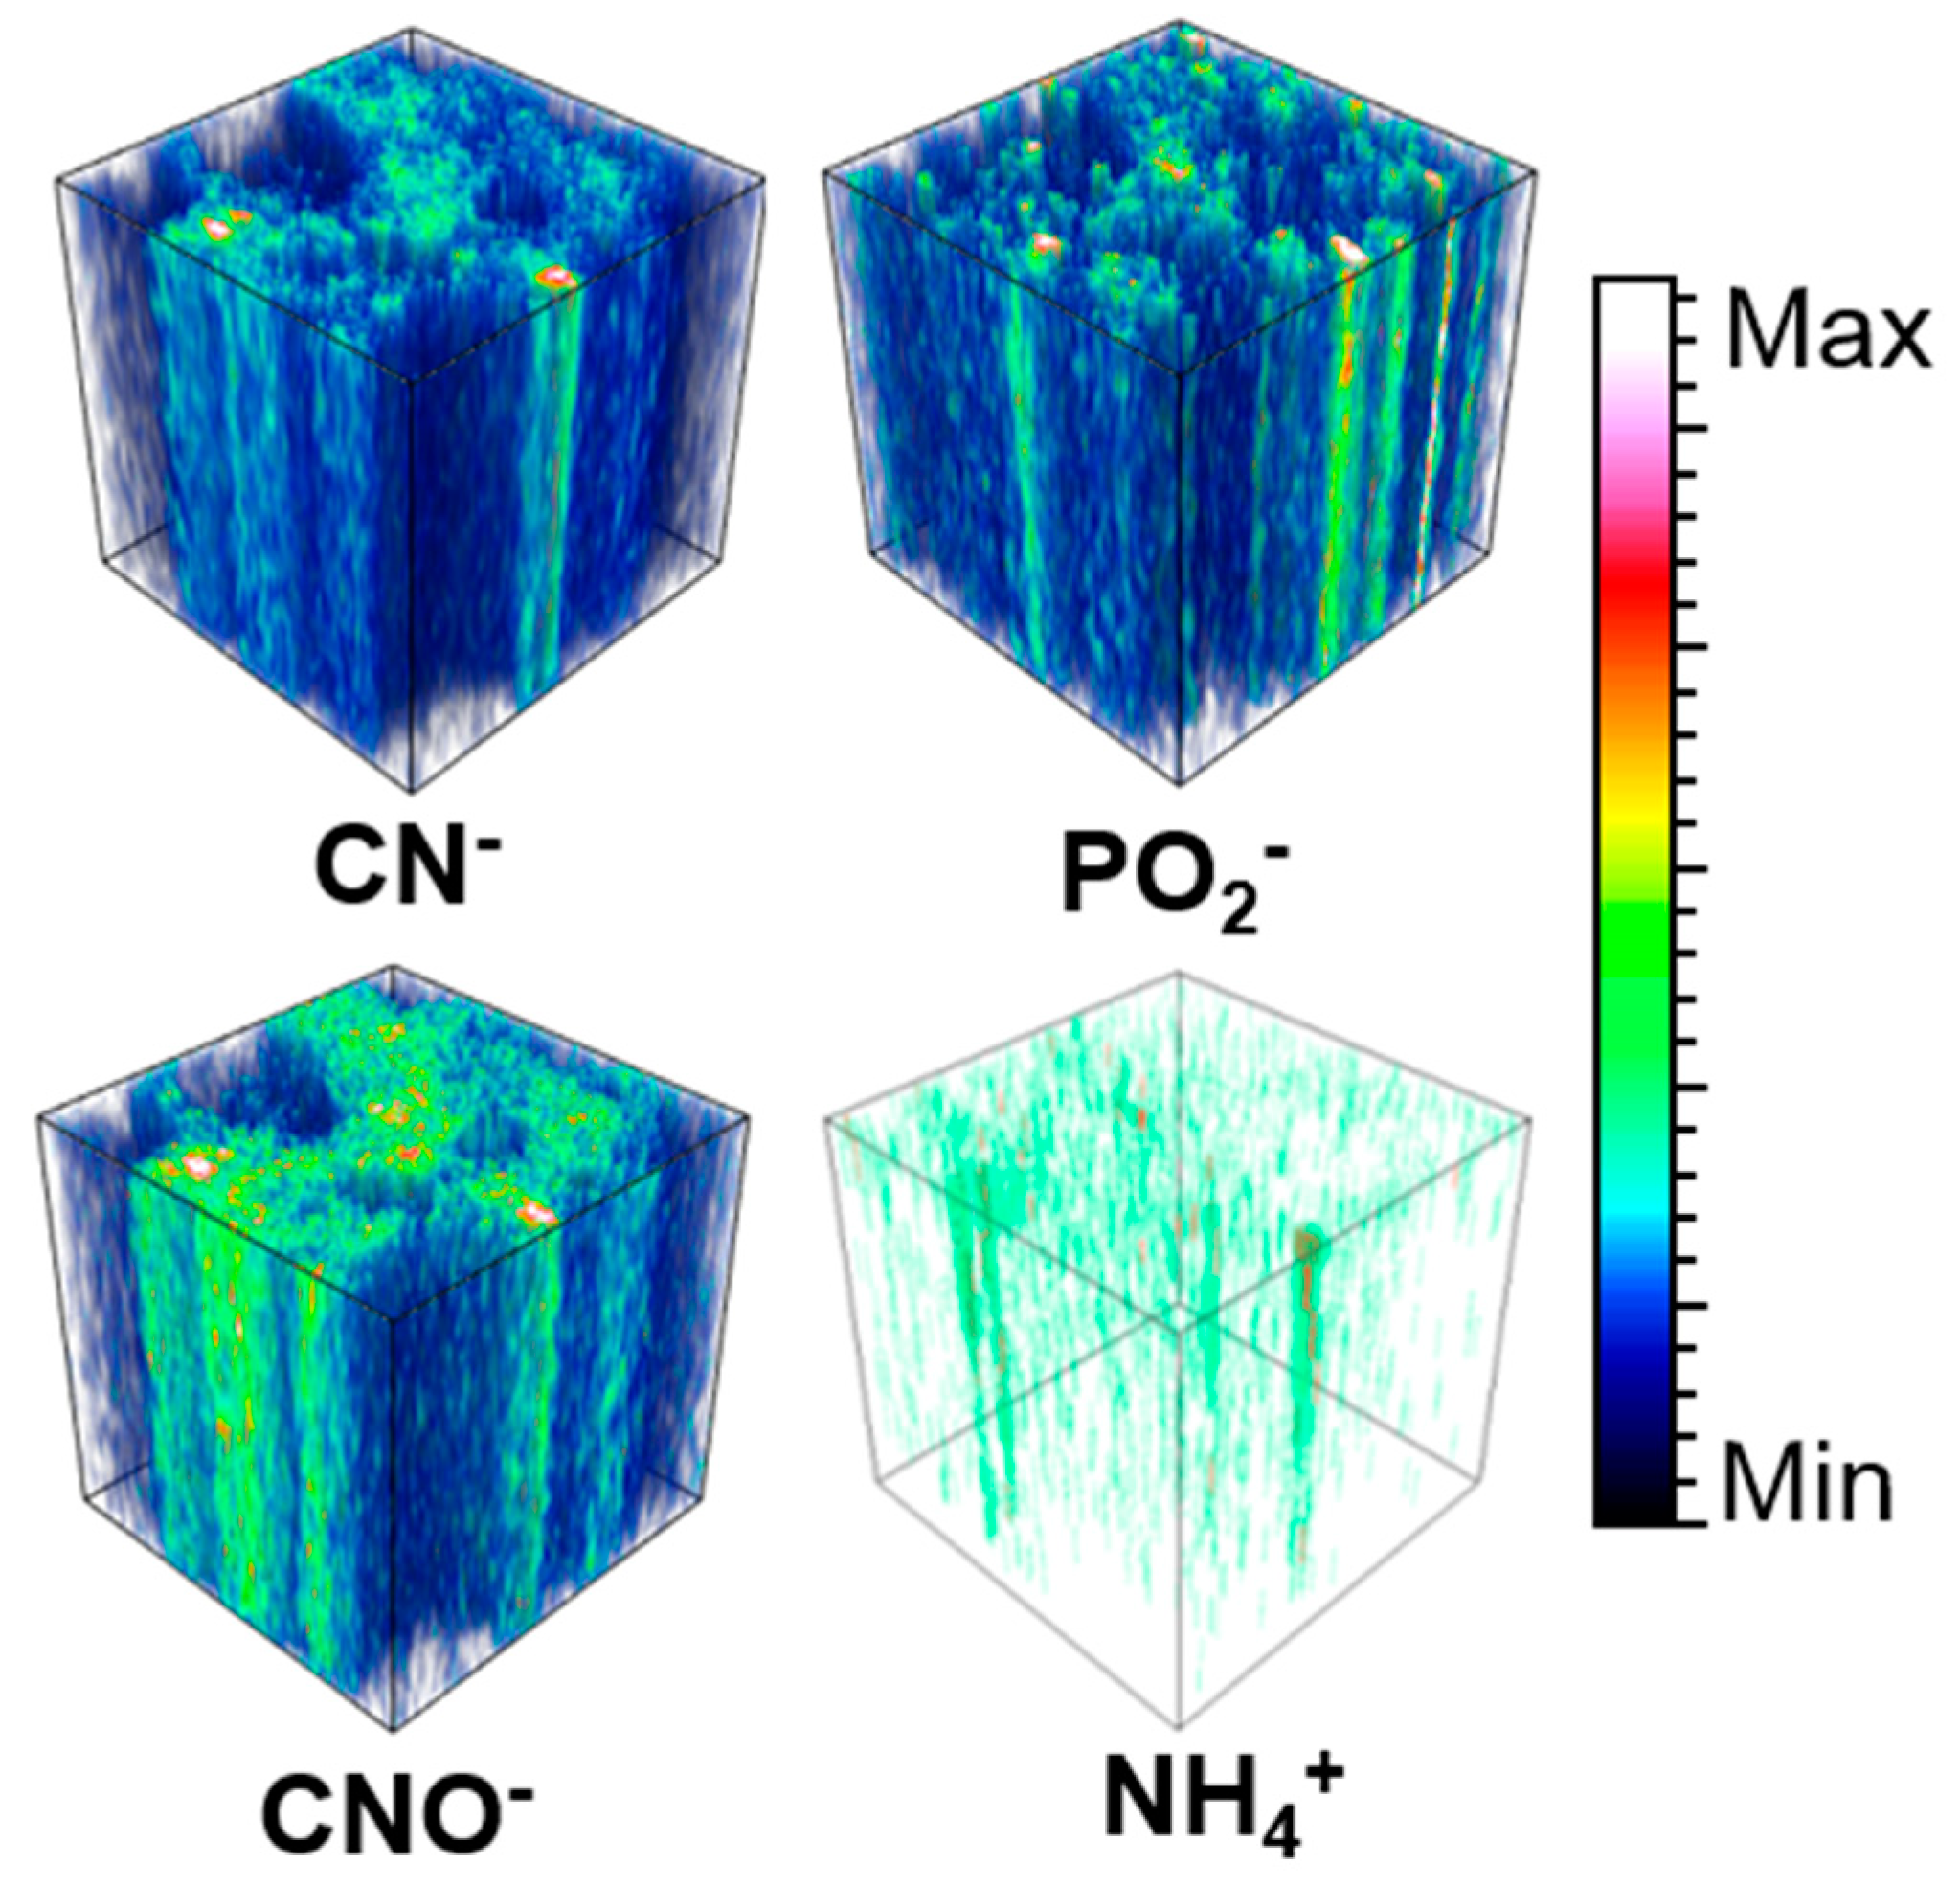
- to perform depth profiling measurements by sputtering analyzed sections. To study molecules below the first few layers (dynamic SIMS), the dual beam technique was used. The beams of argon and bismuth were alternated, and the result was a three-dimensional image composed of successive 2D slices.
3. Results
3.1. Surface Roughness
3.2. Visible-NIR Reflectance Spectra
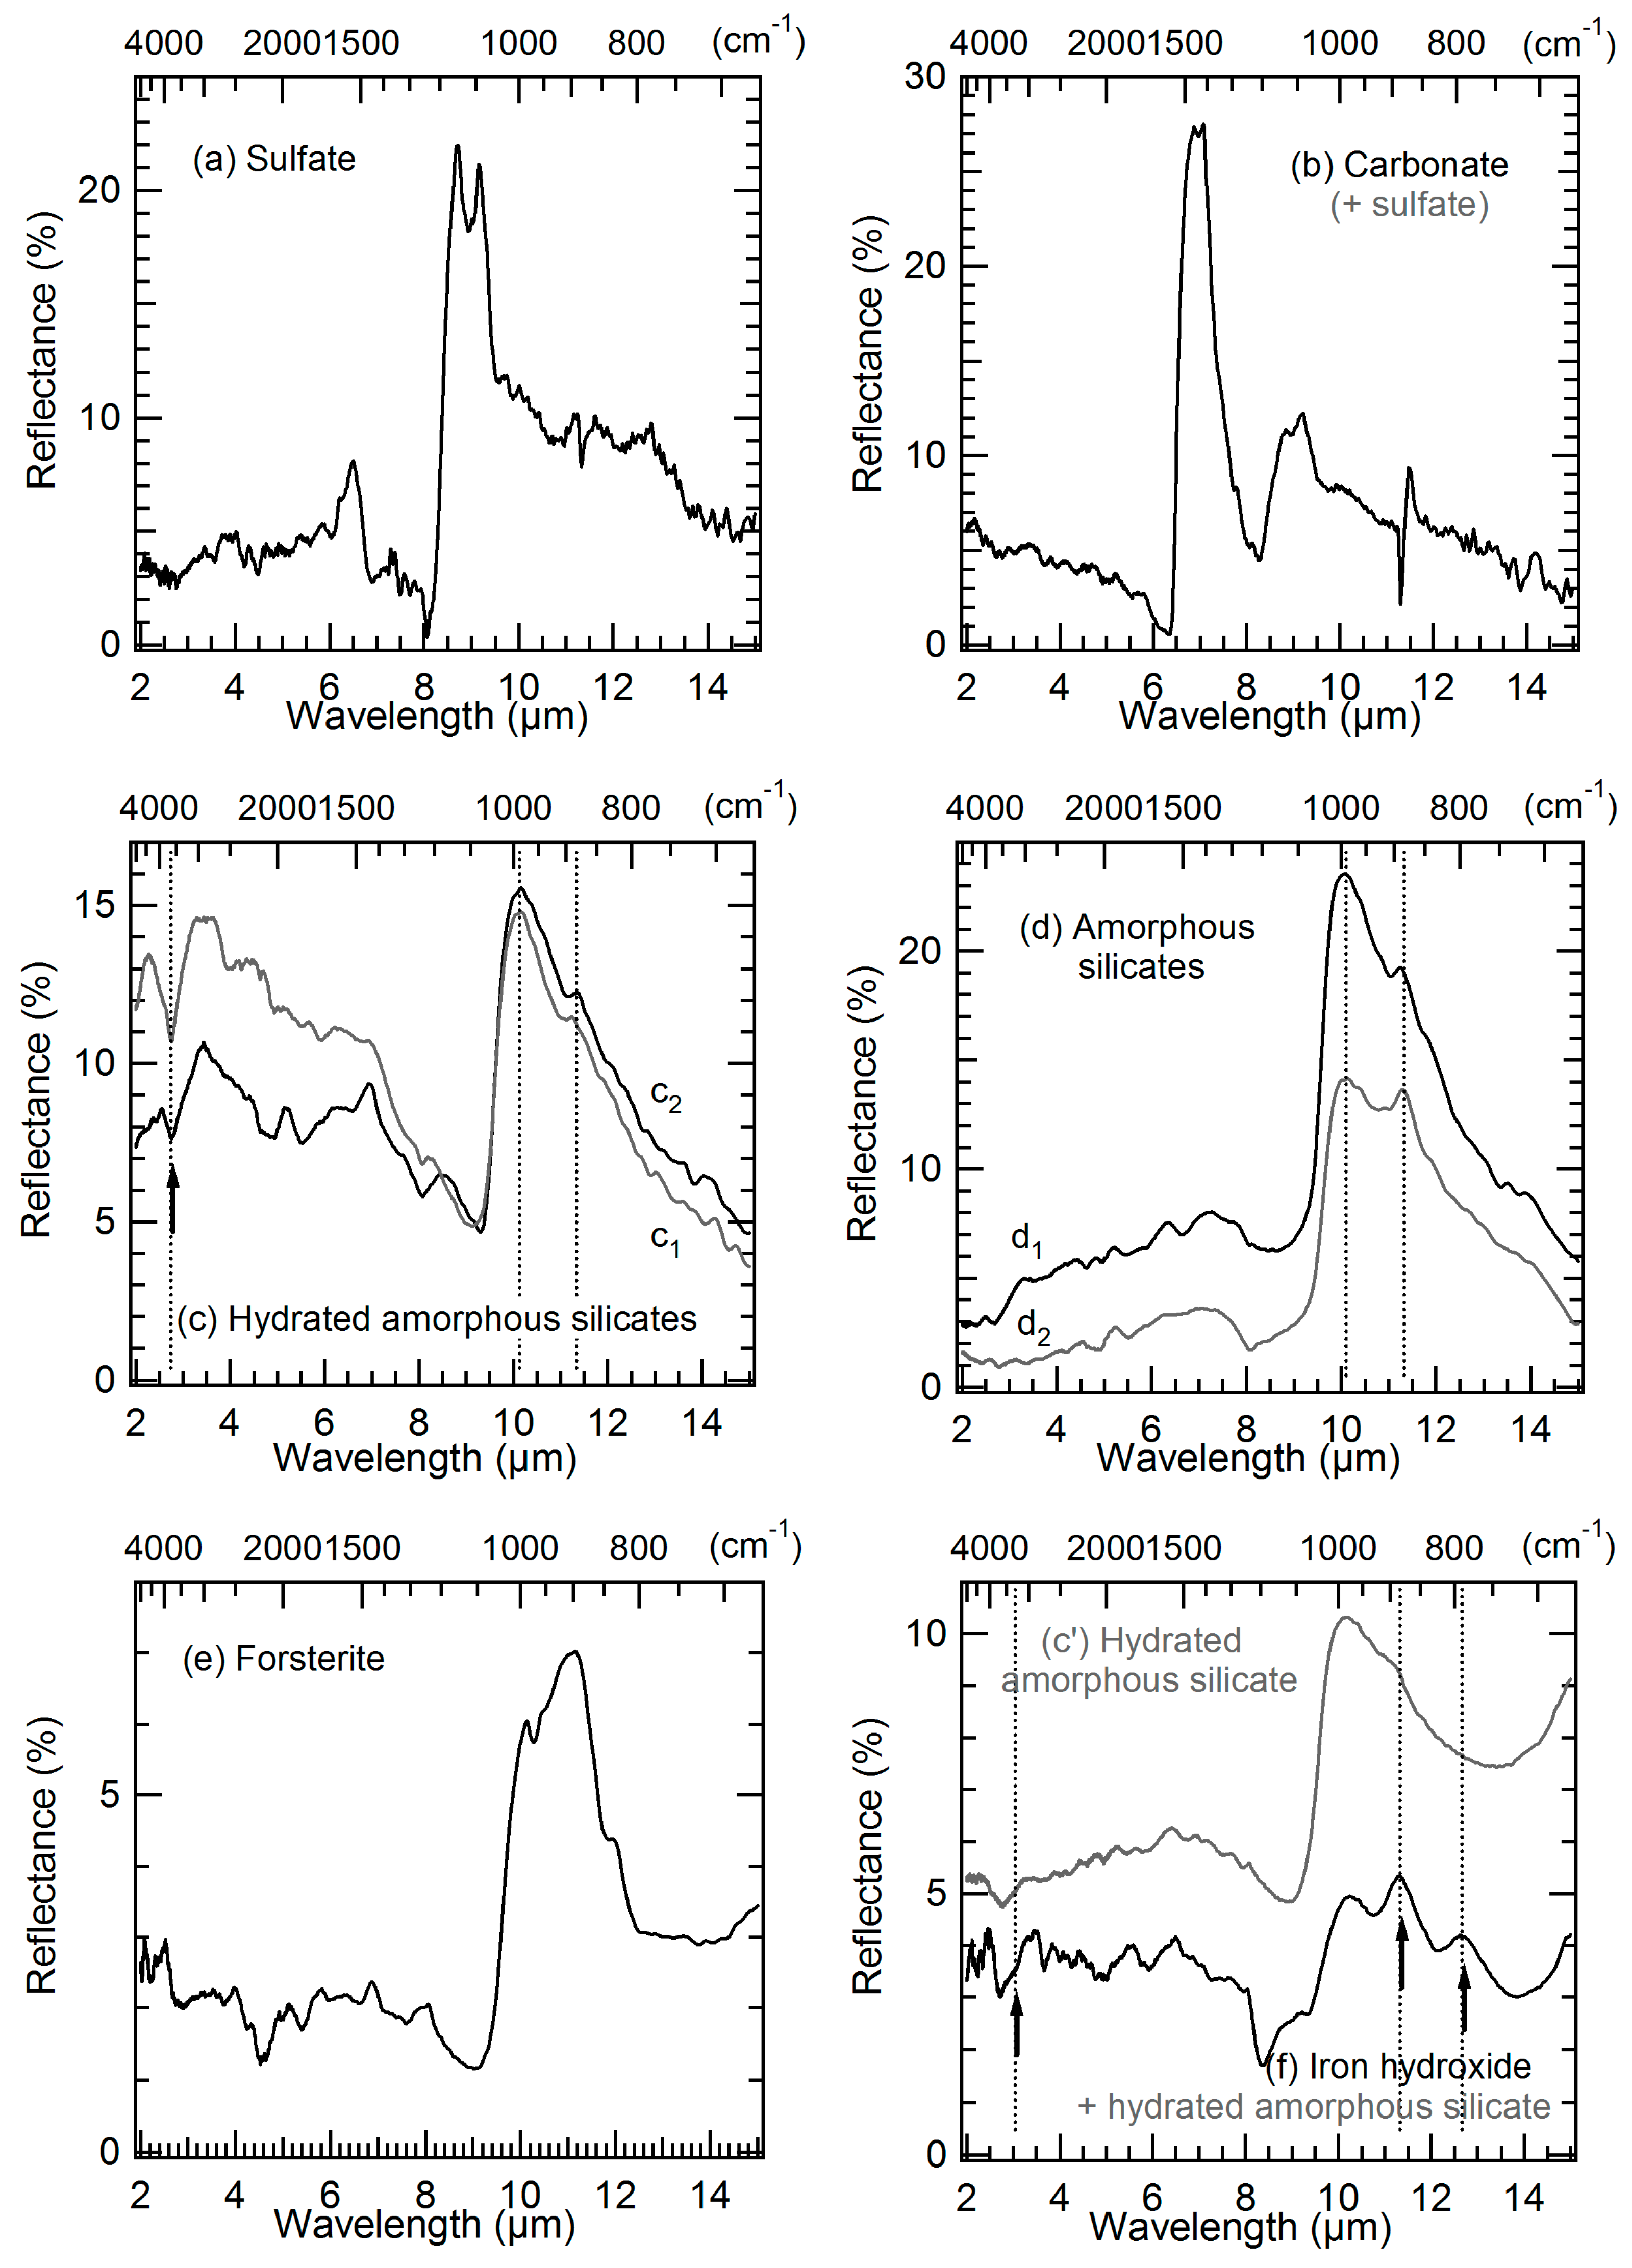
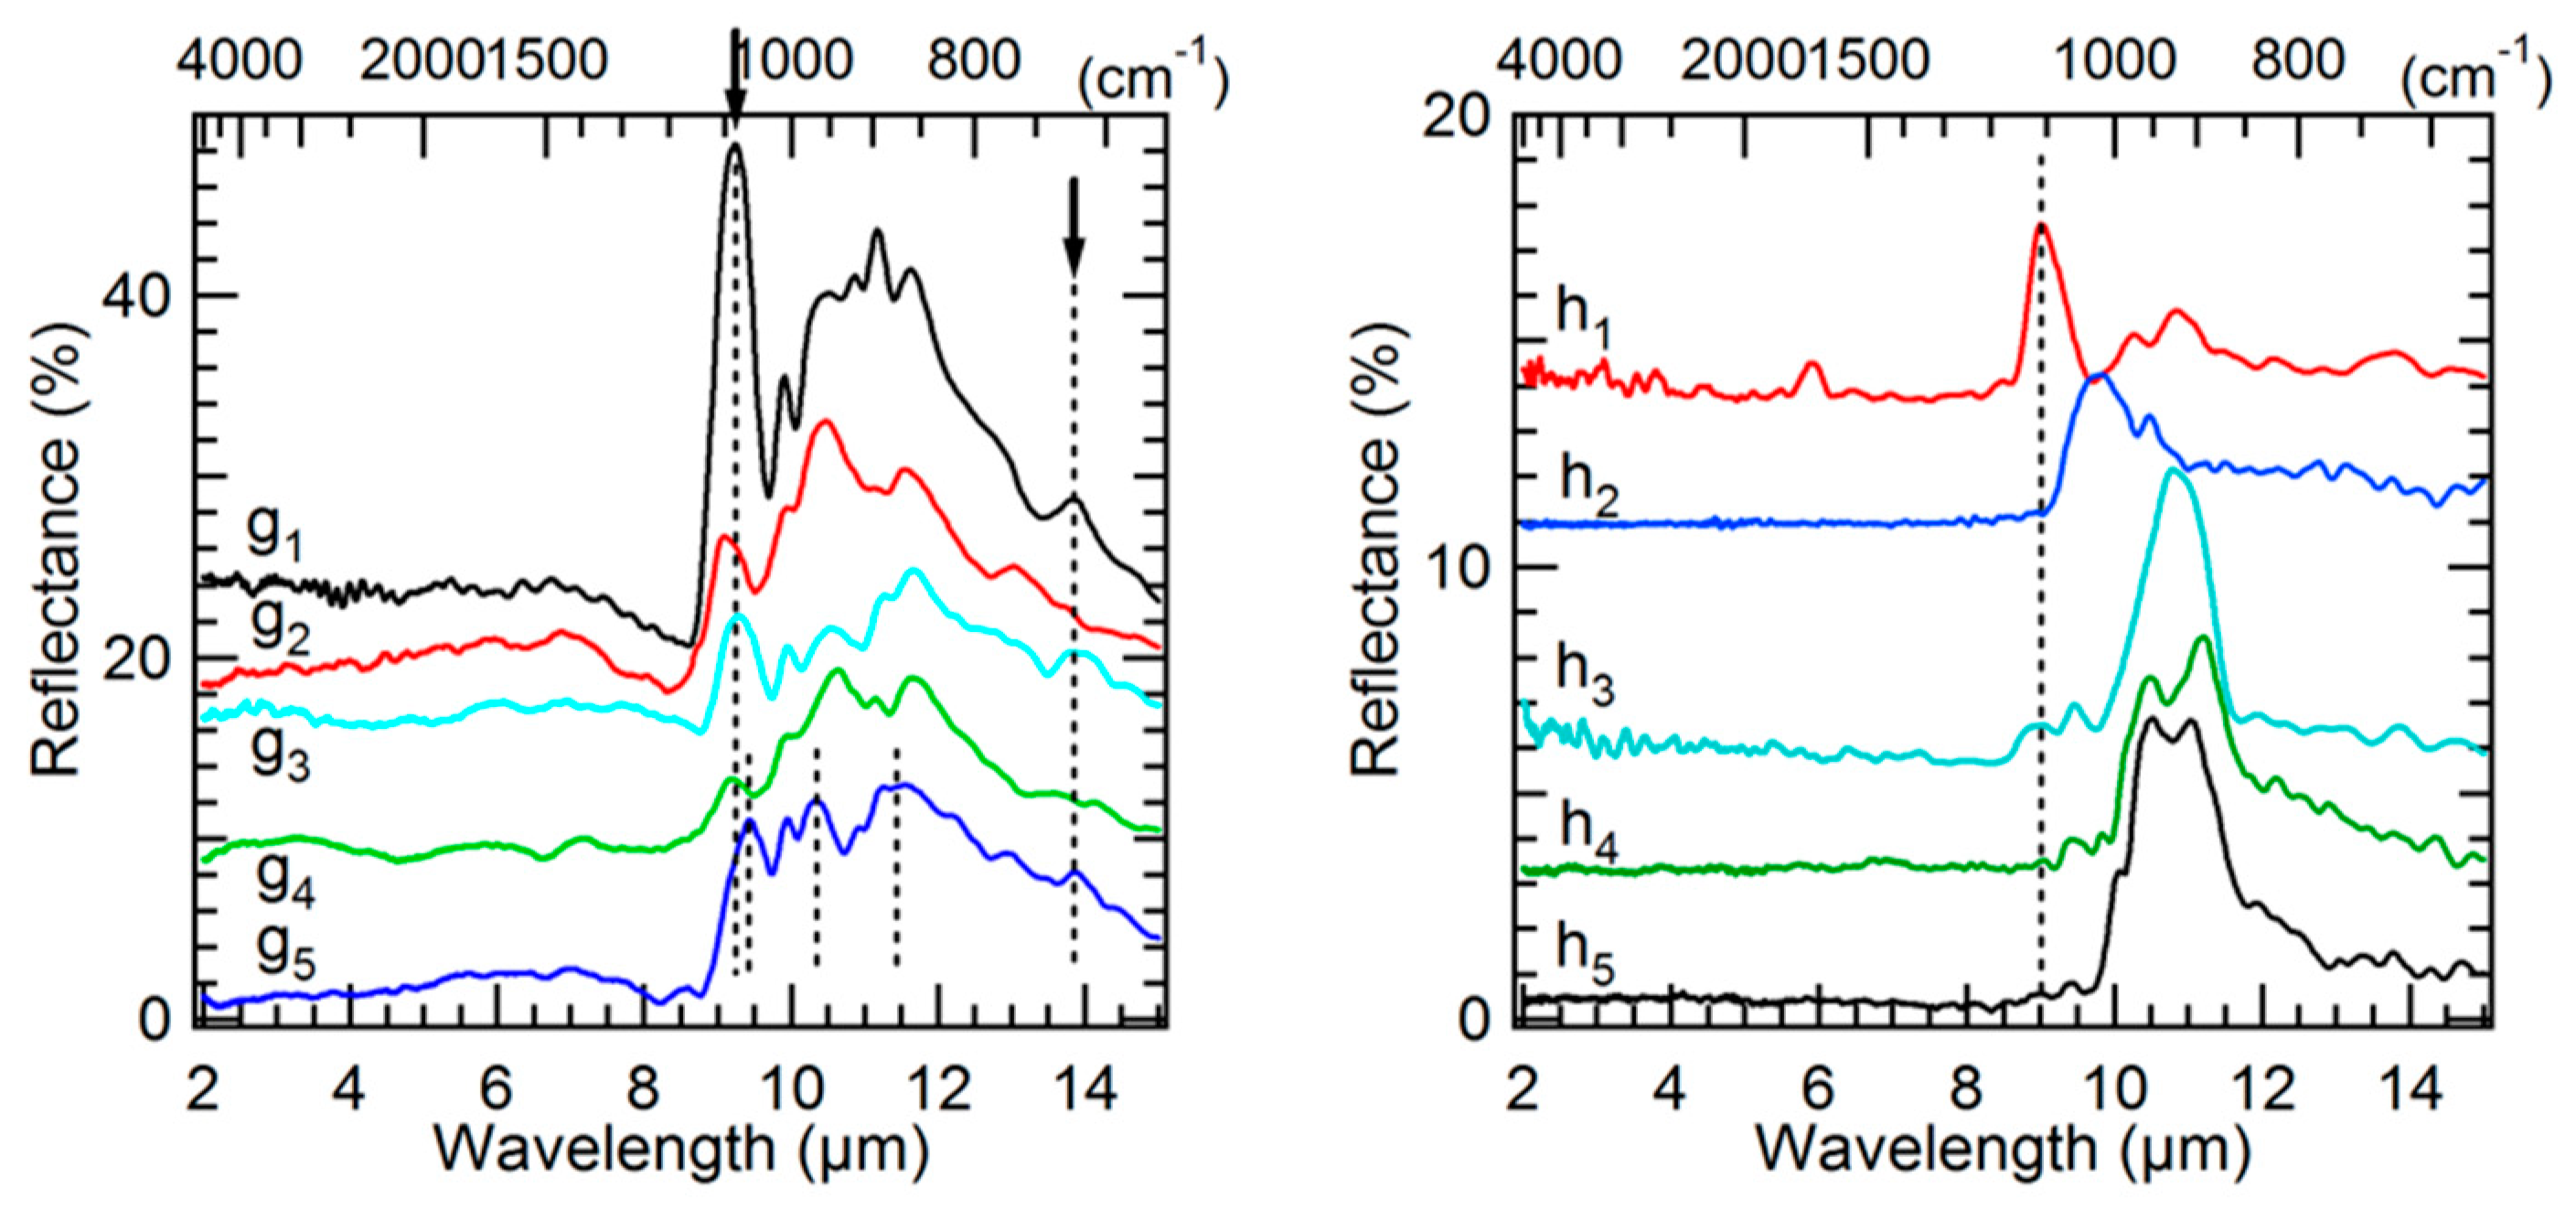
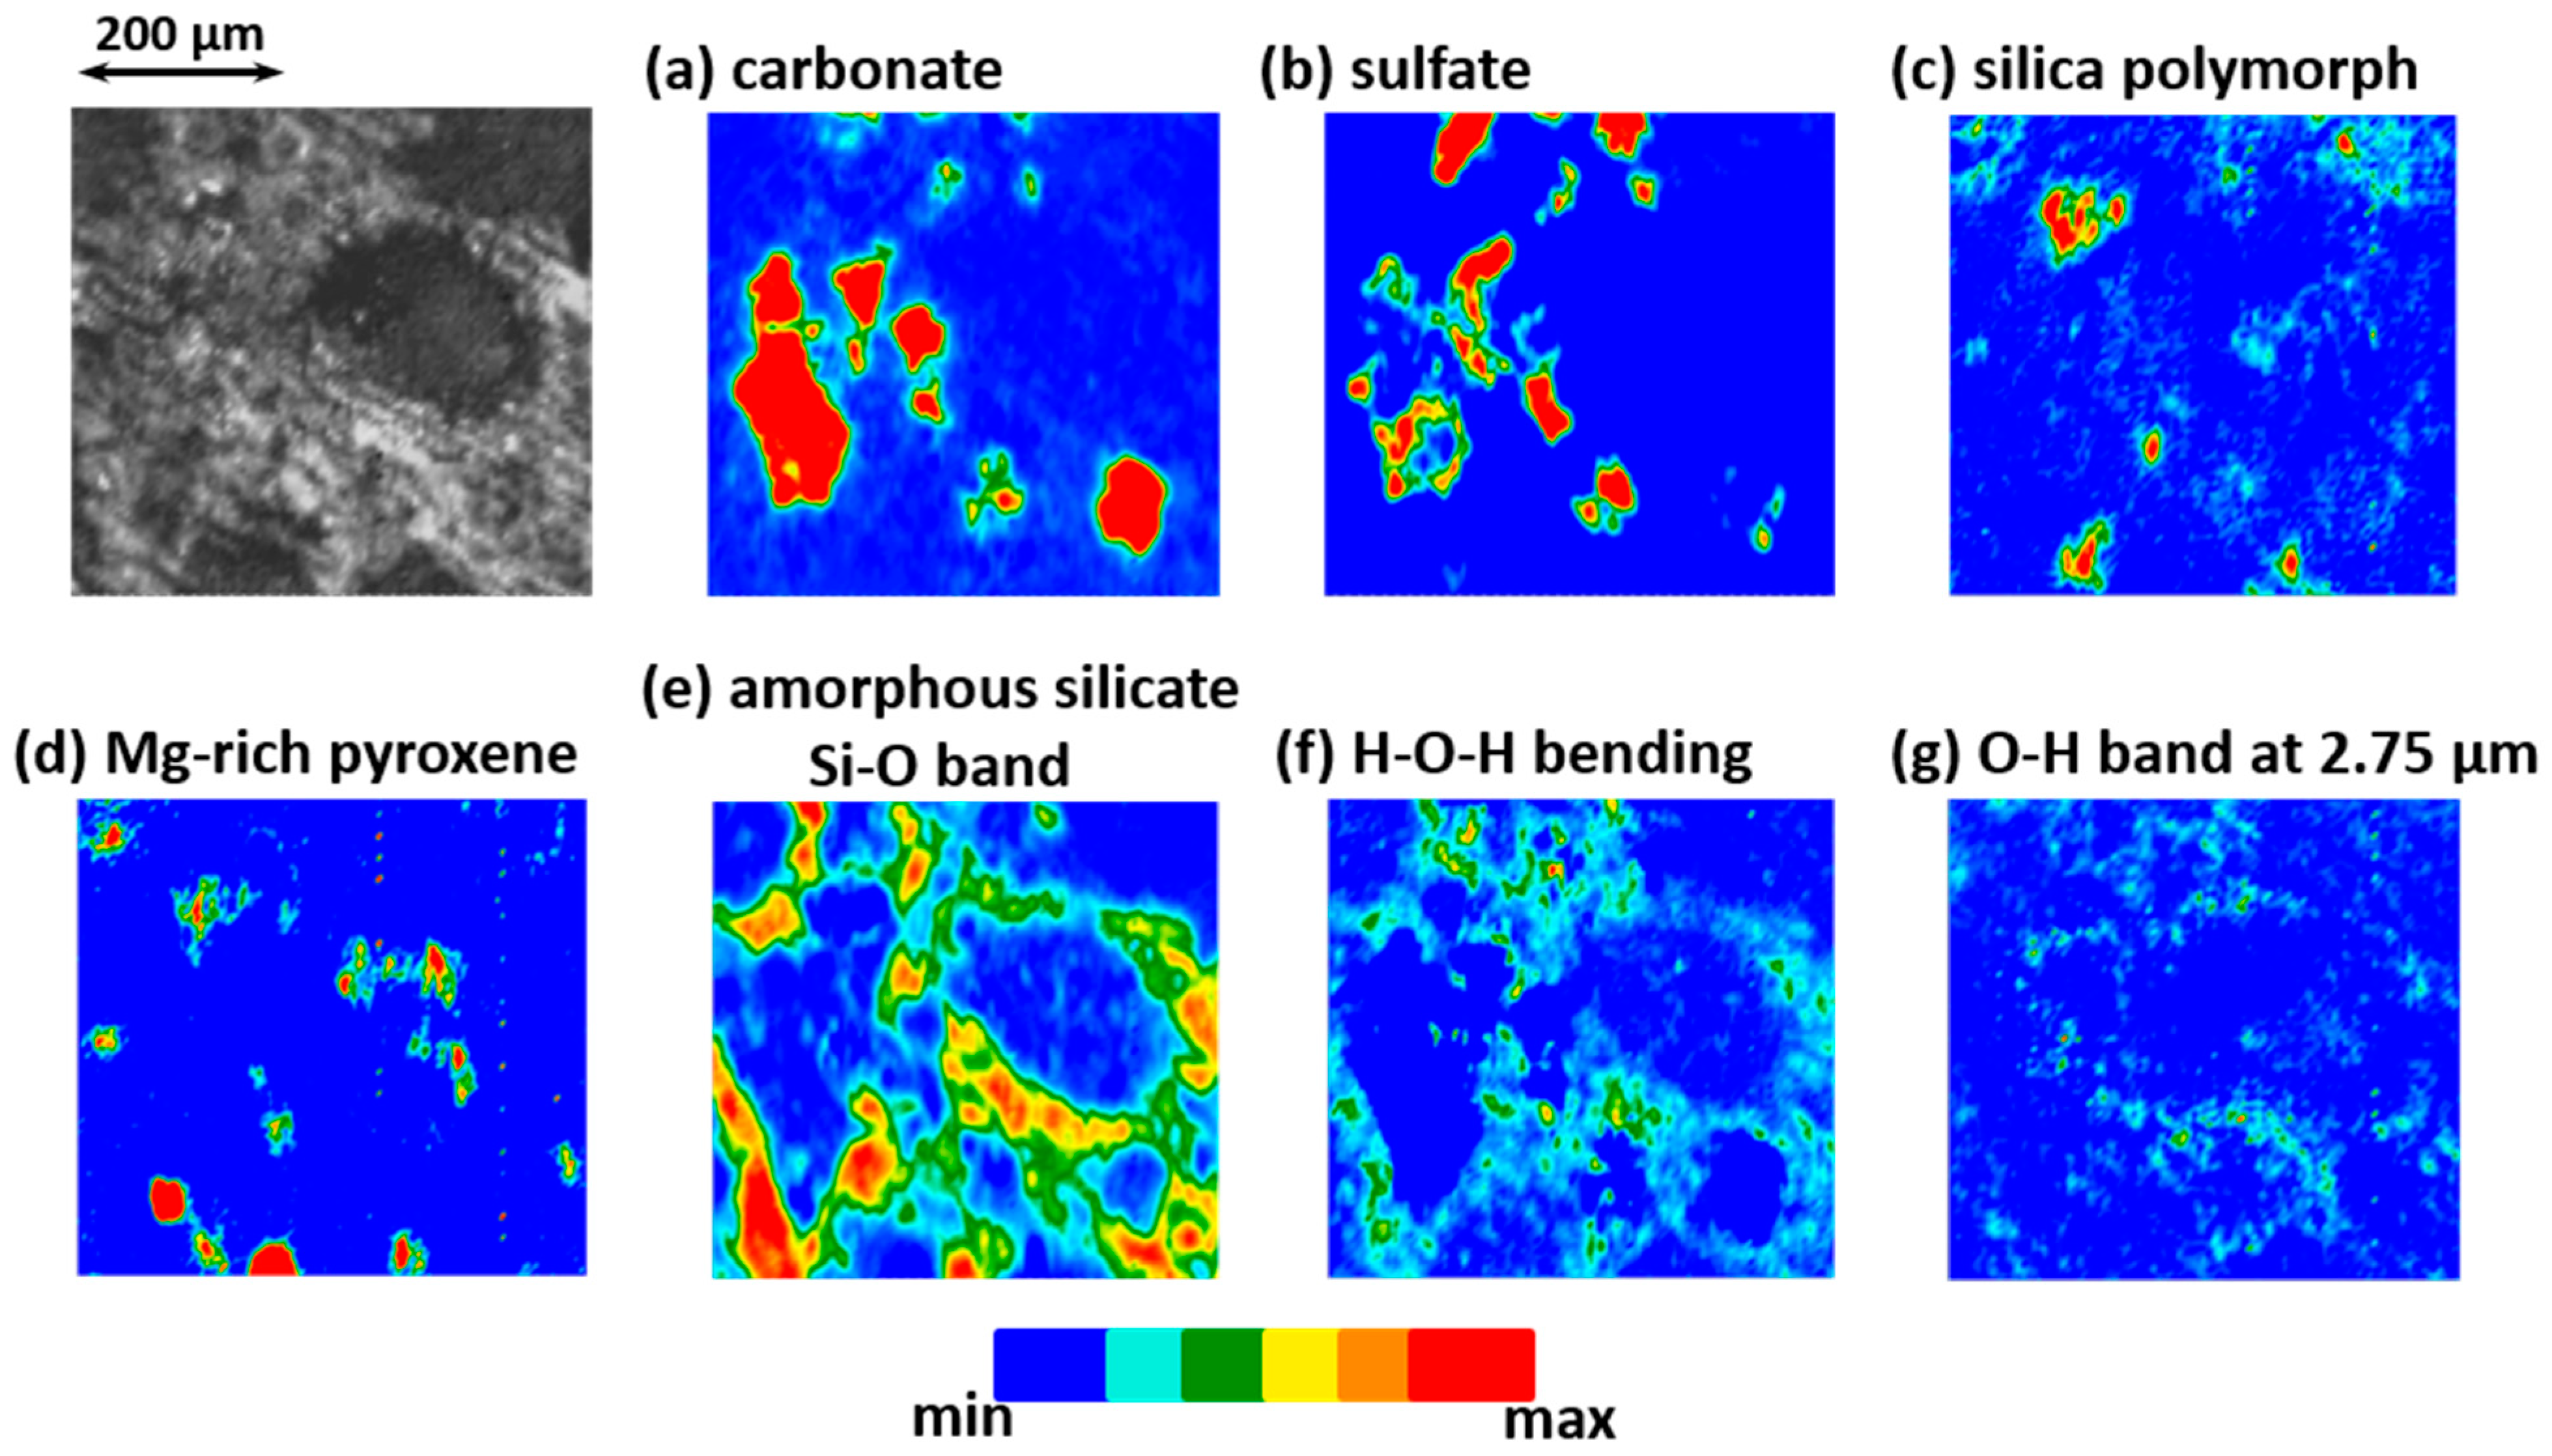
3.3. Mid-IR Reflectance Spectra
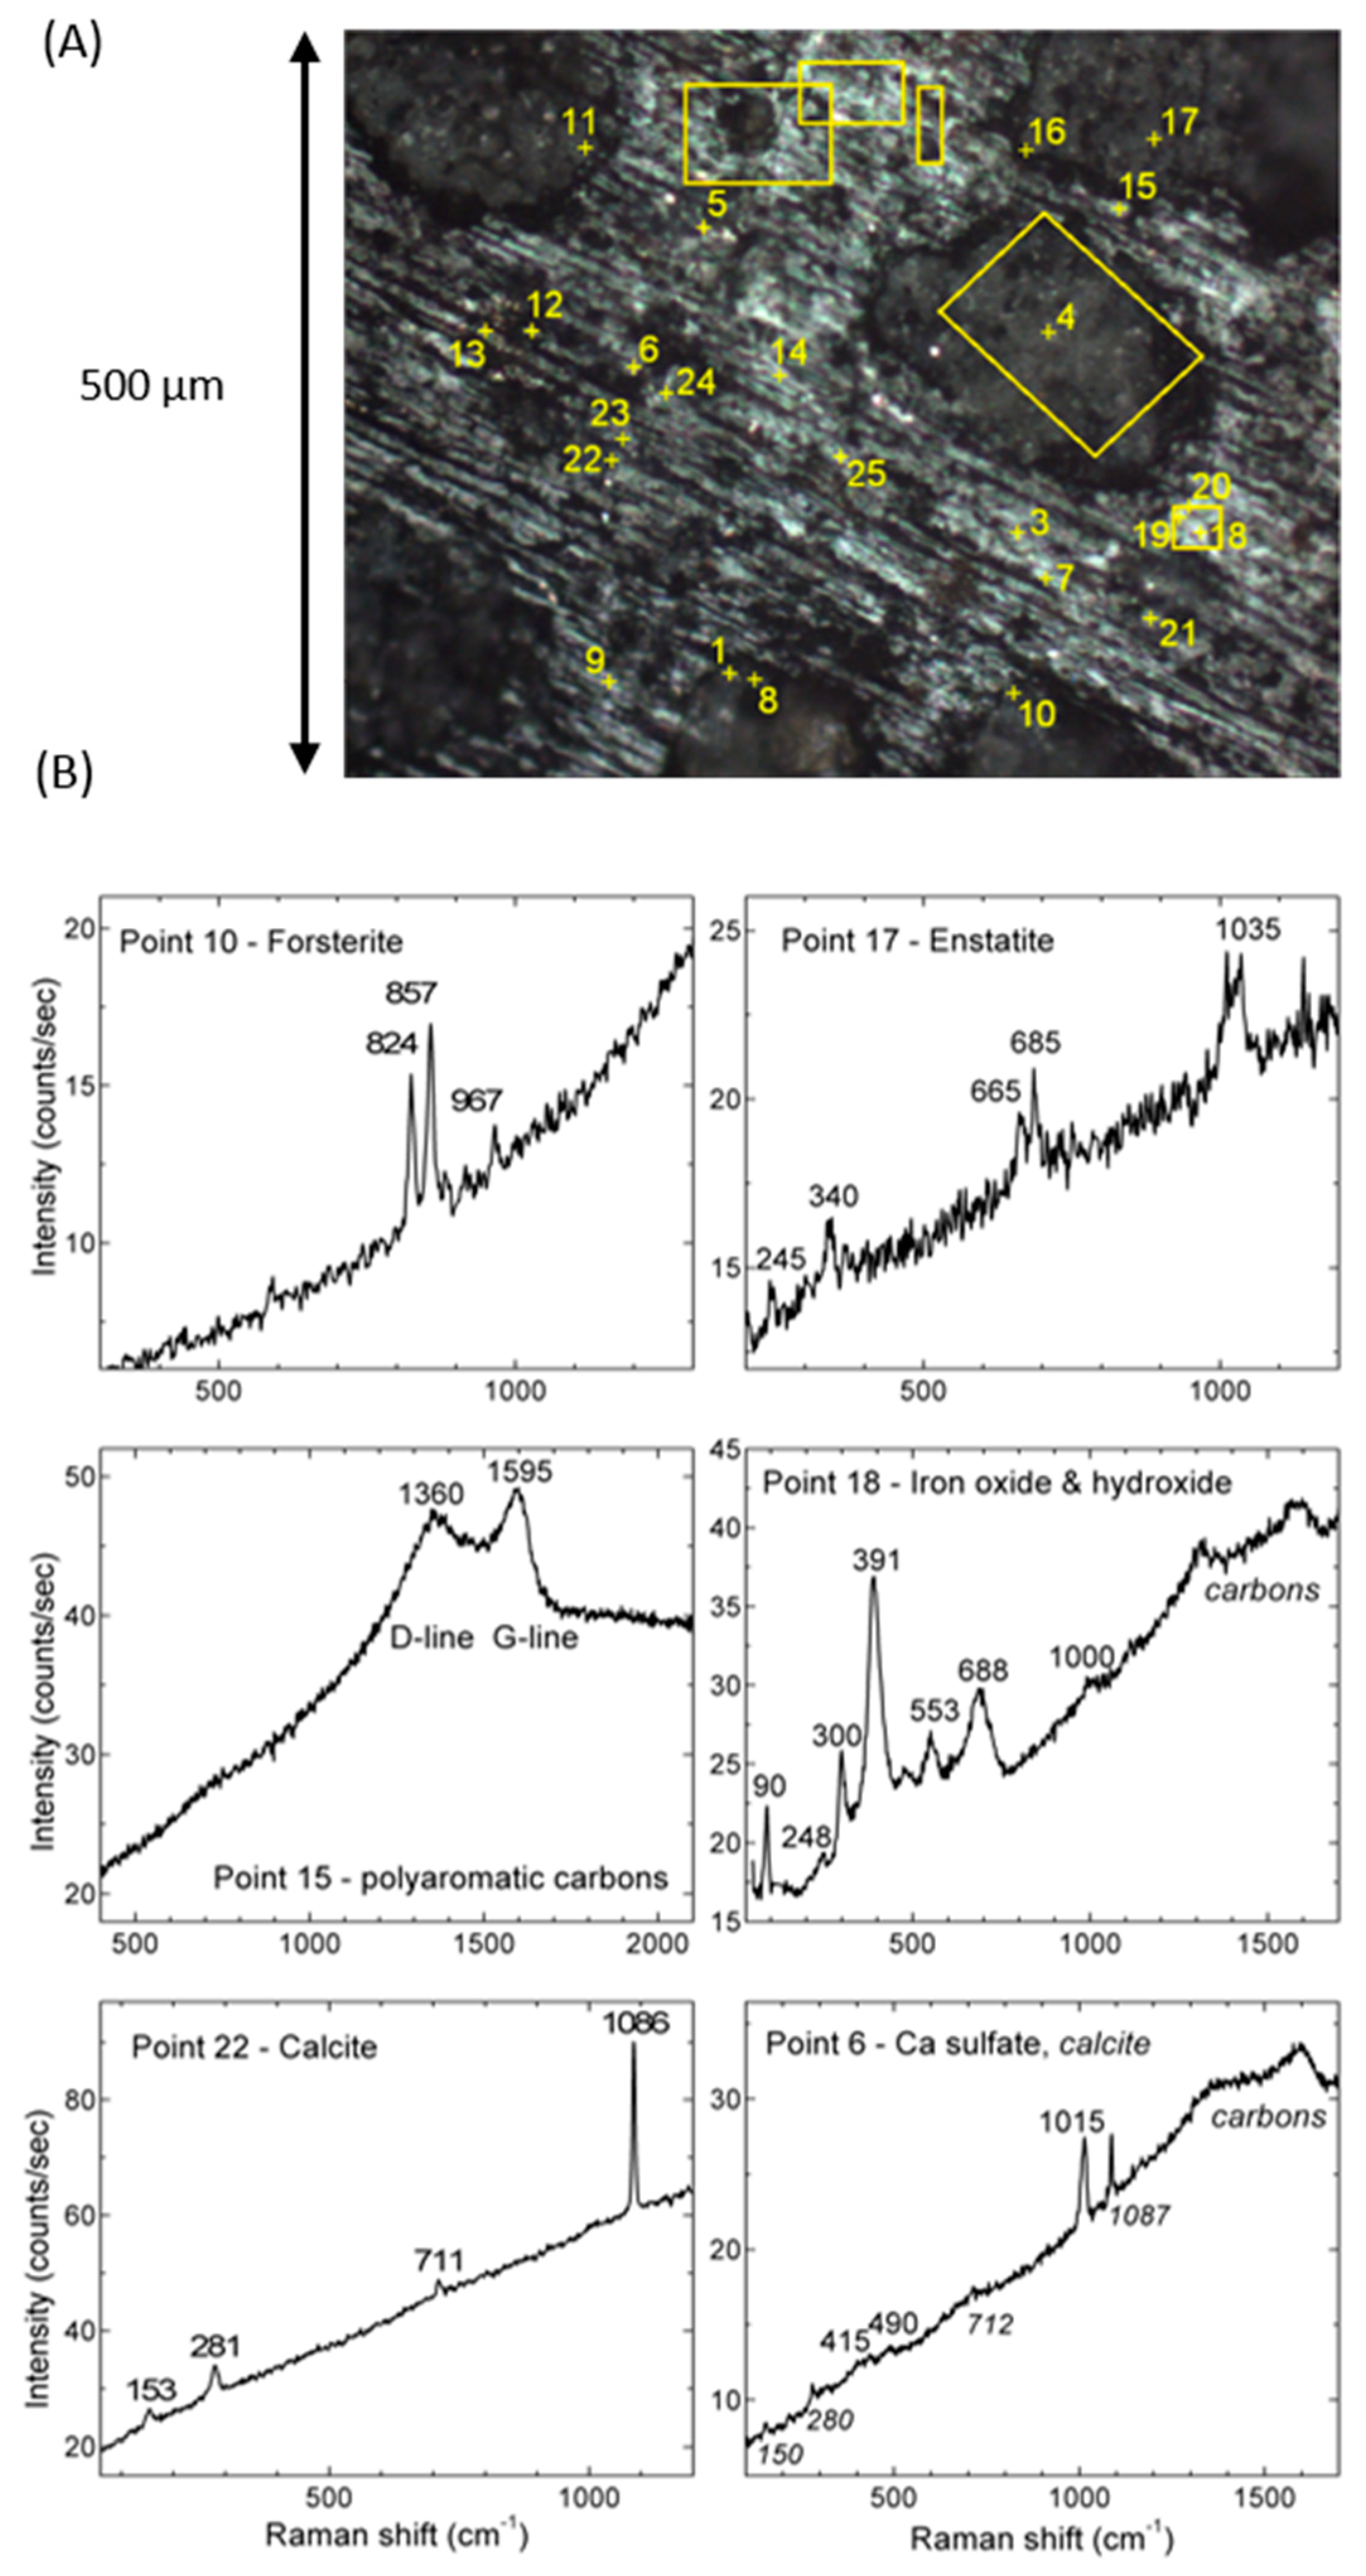
3.4. Micro-Raman Spectra
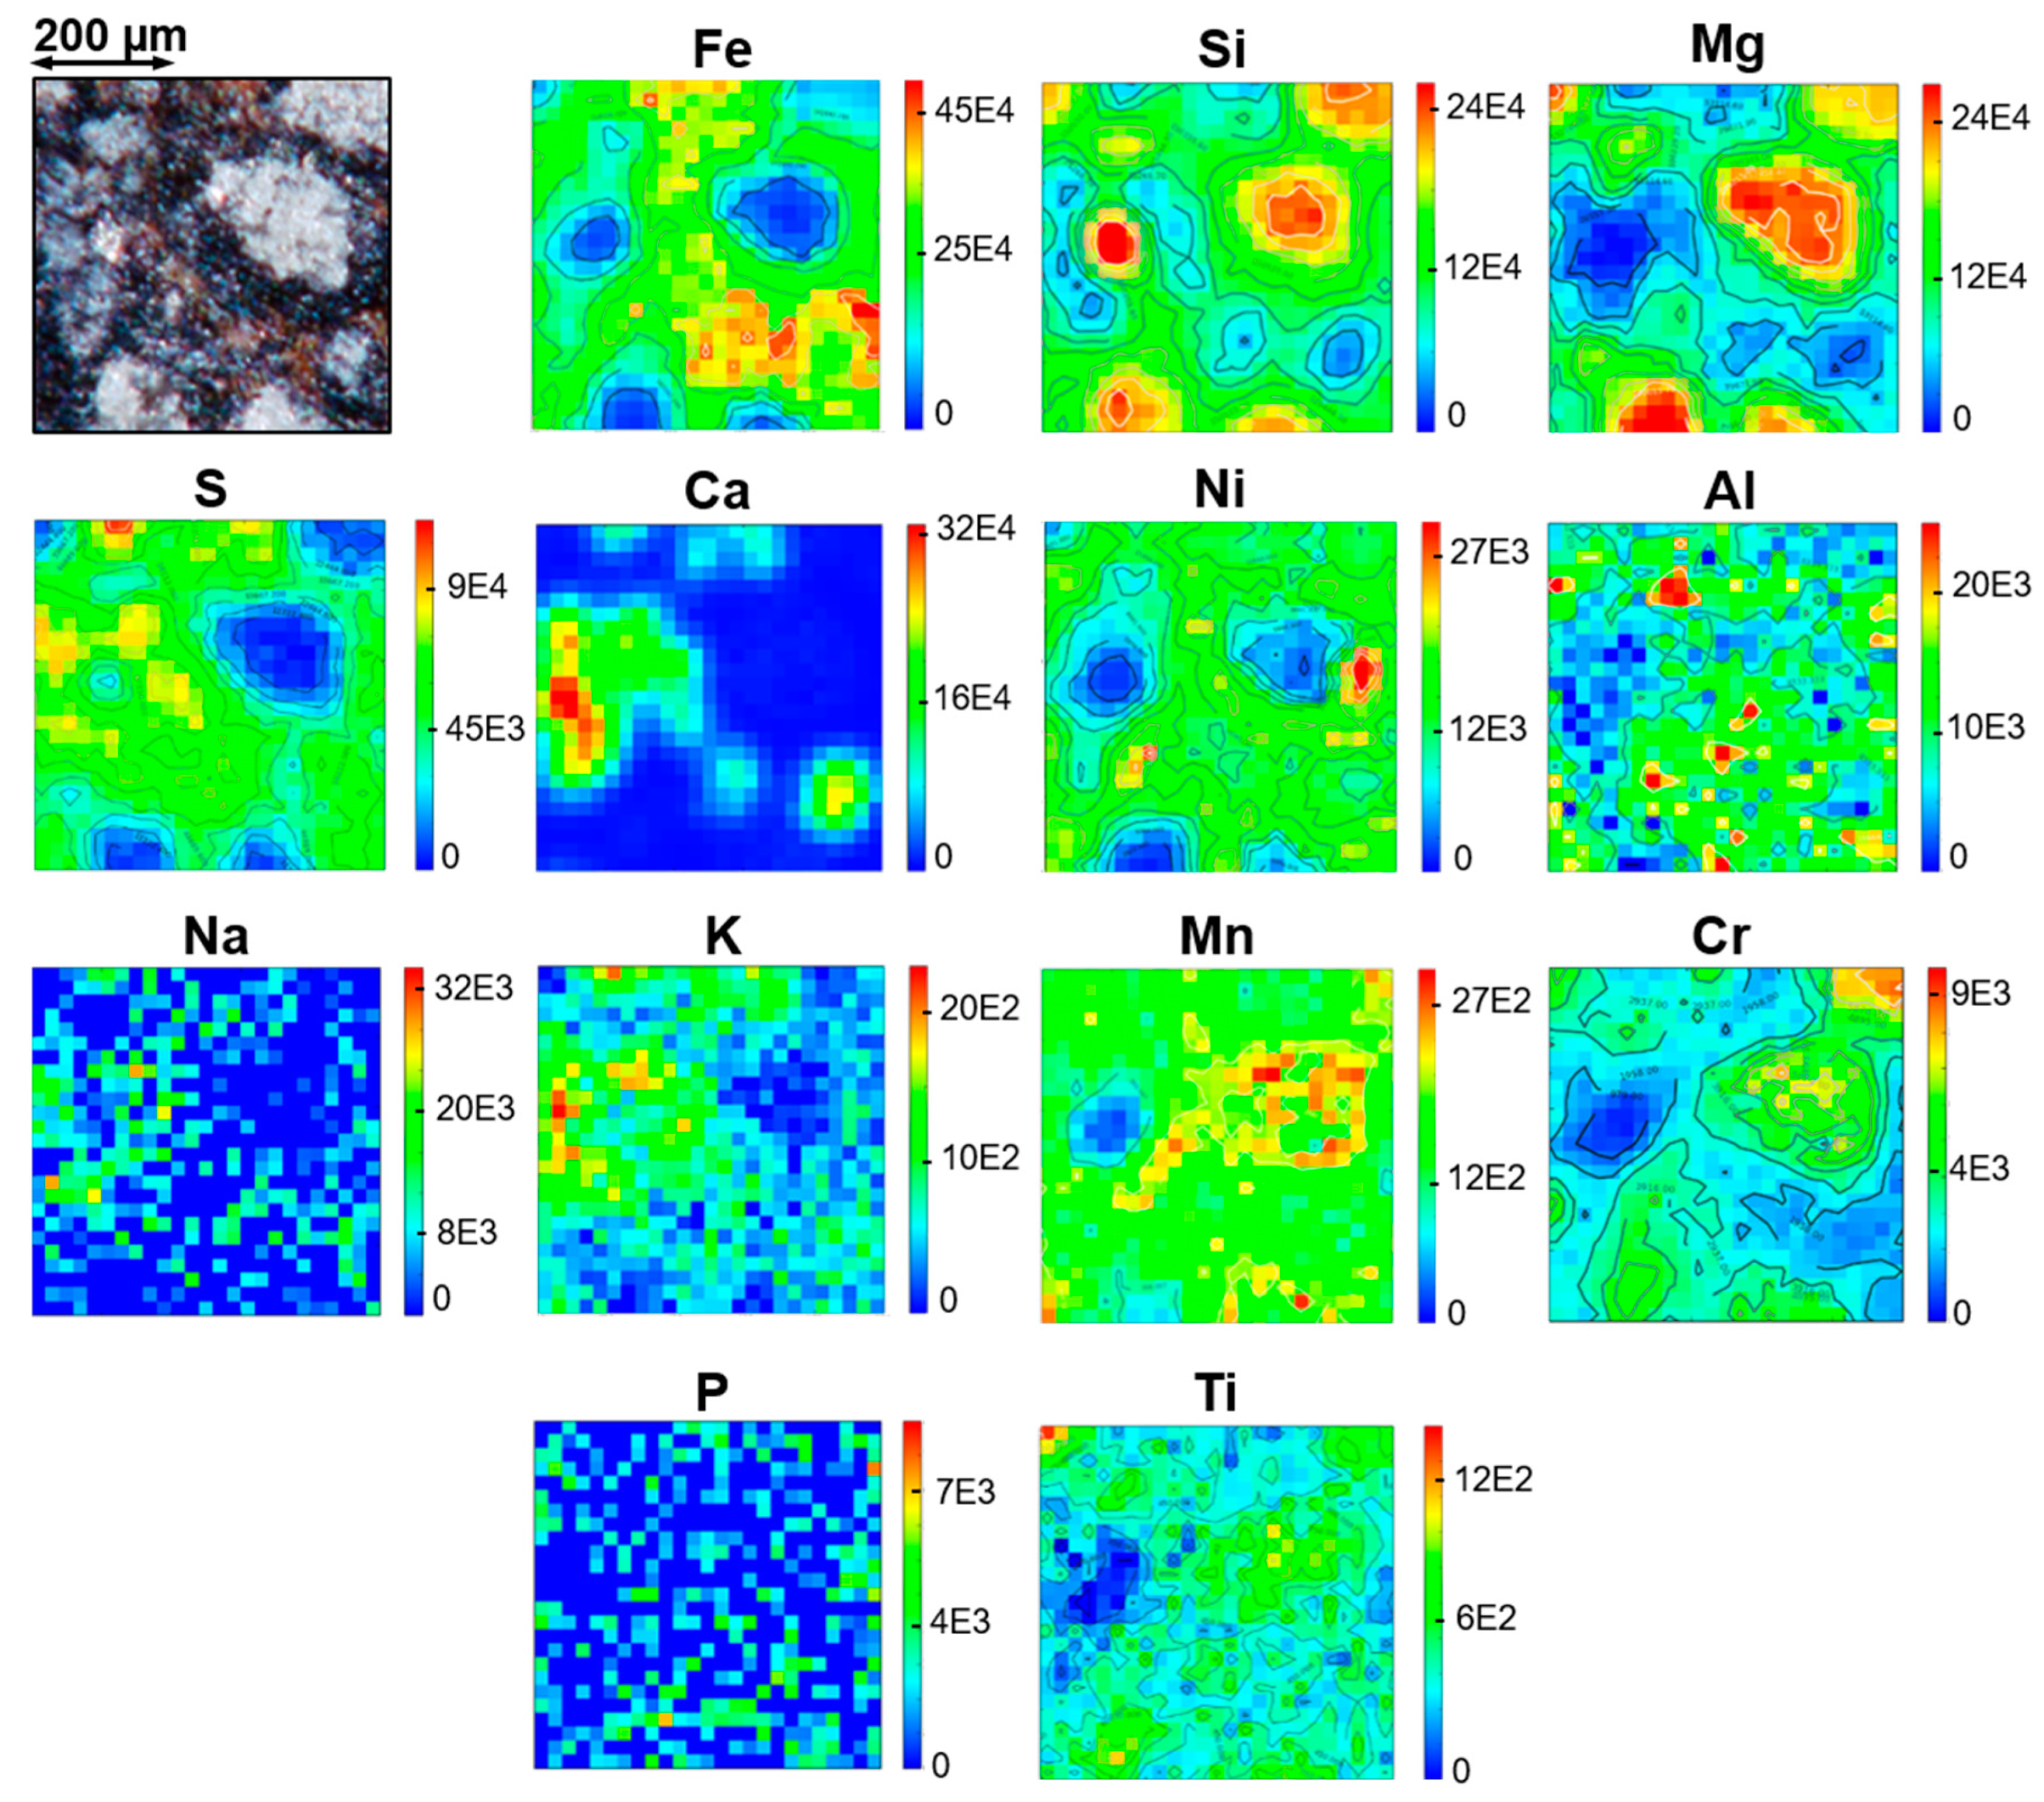
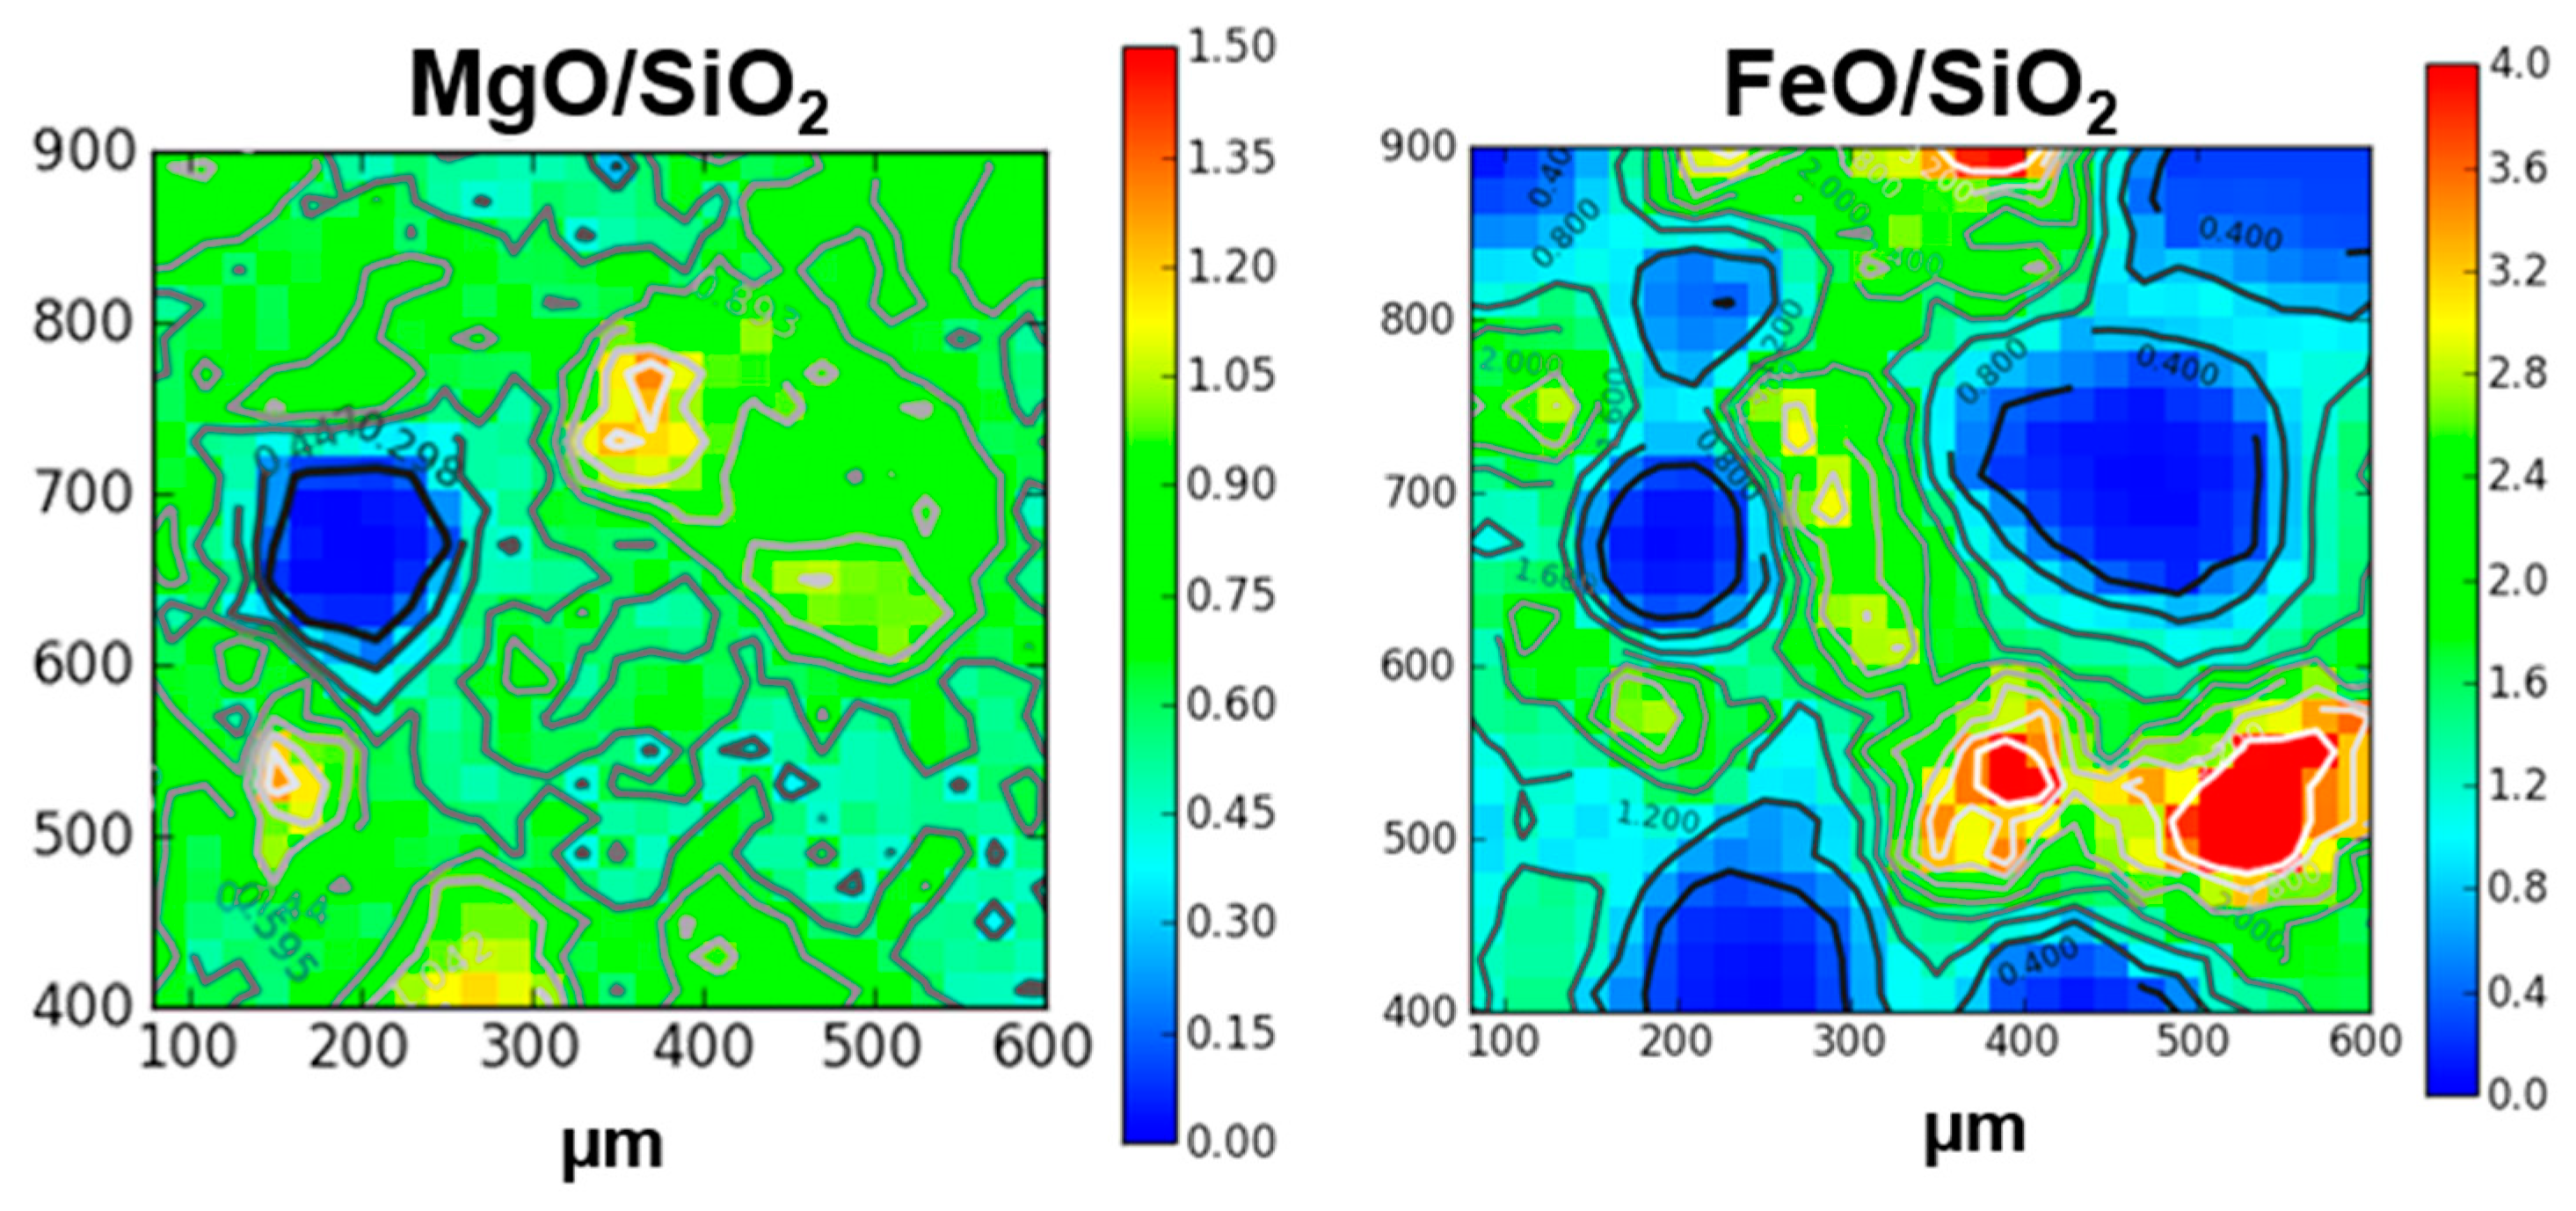
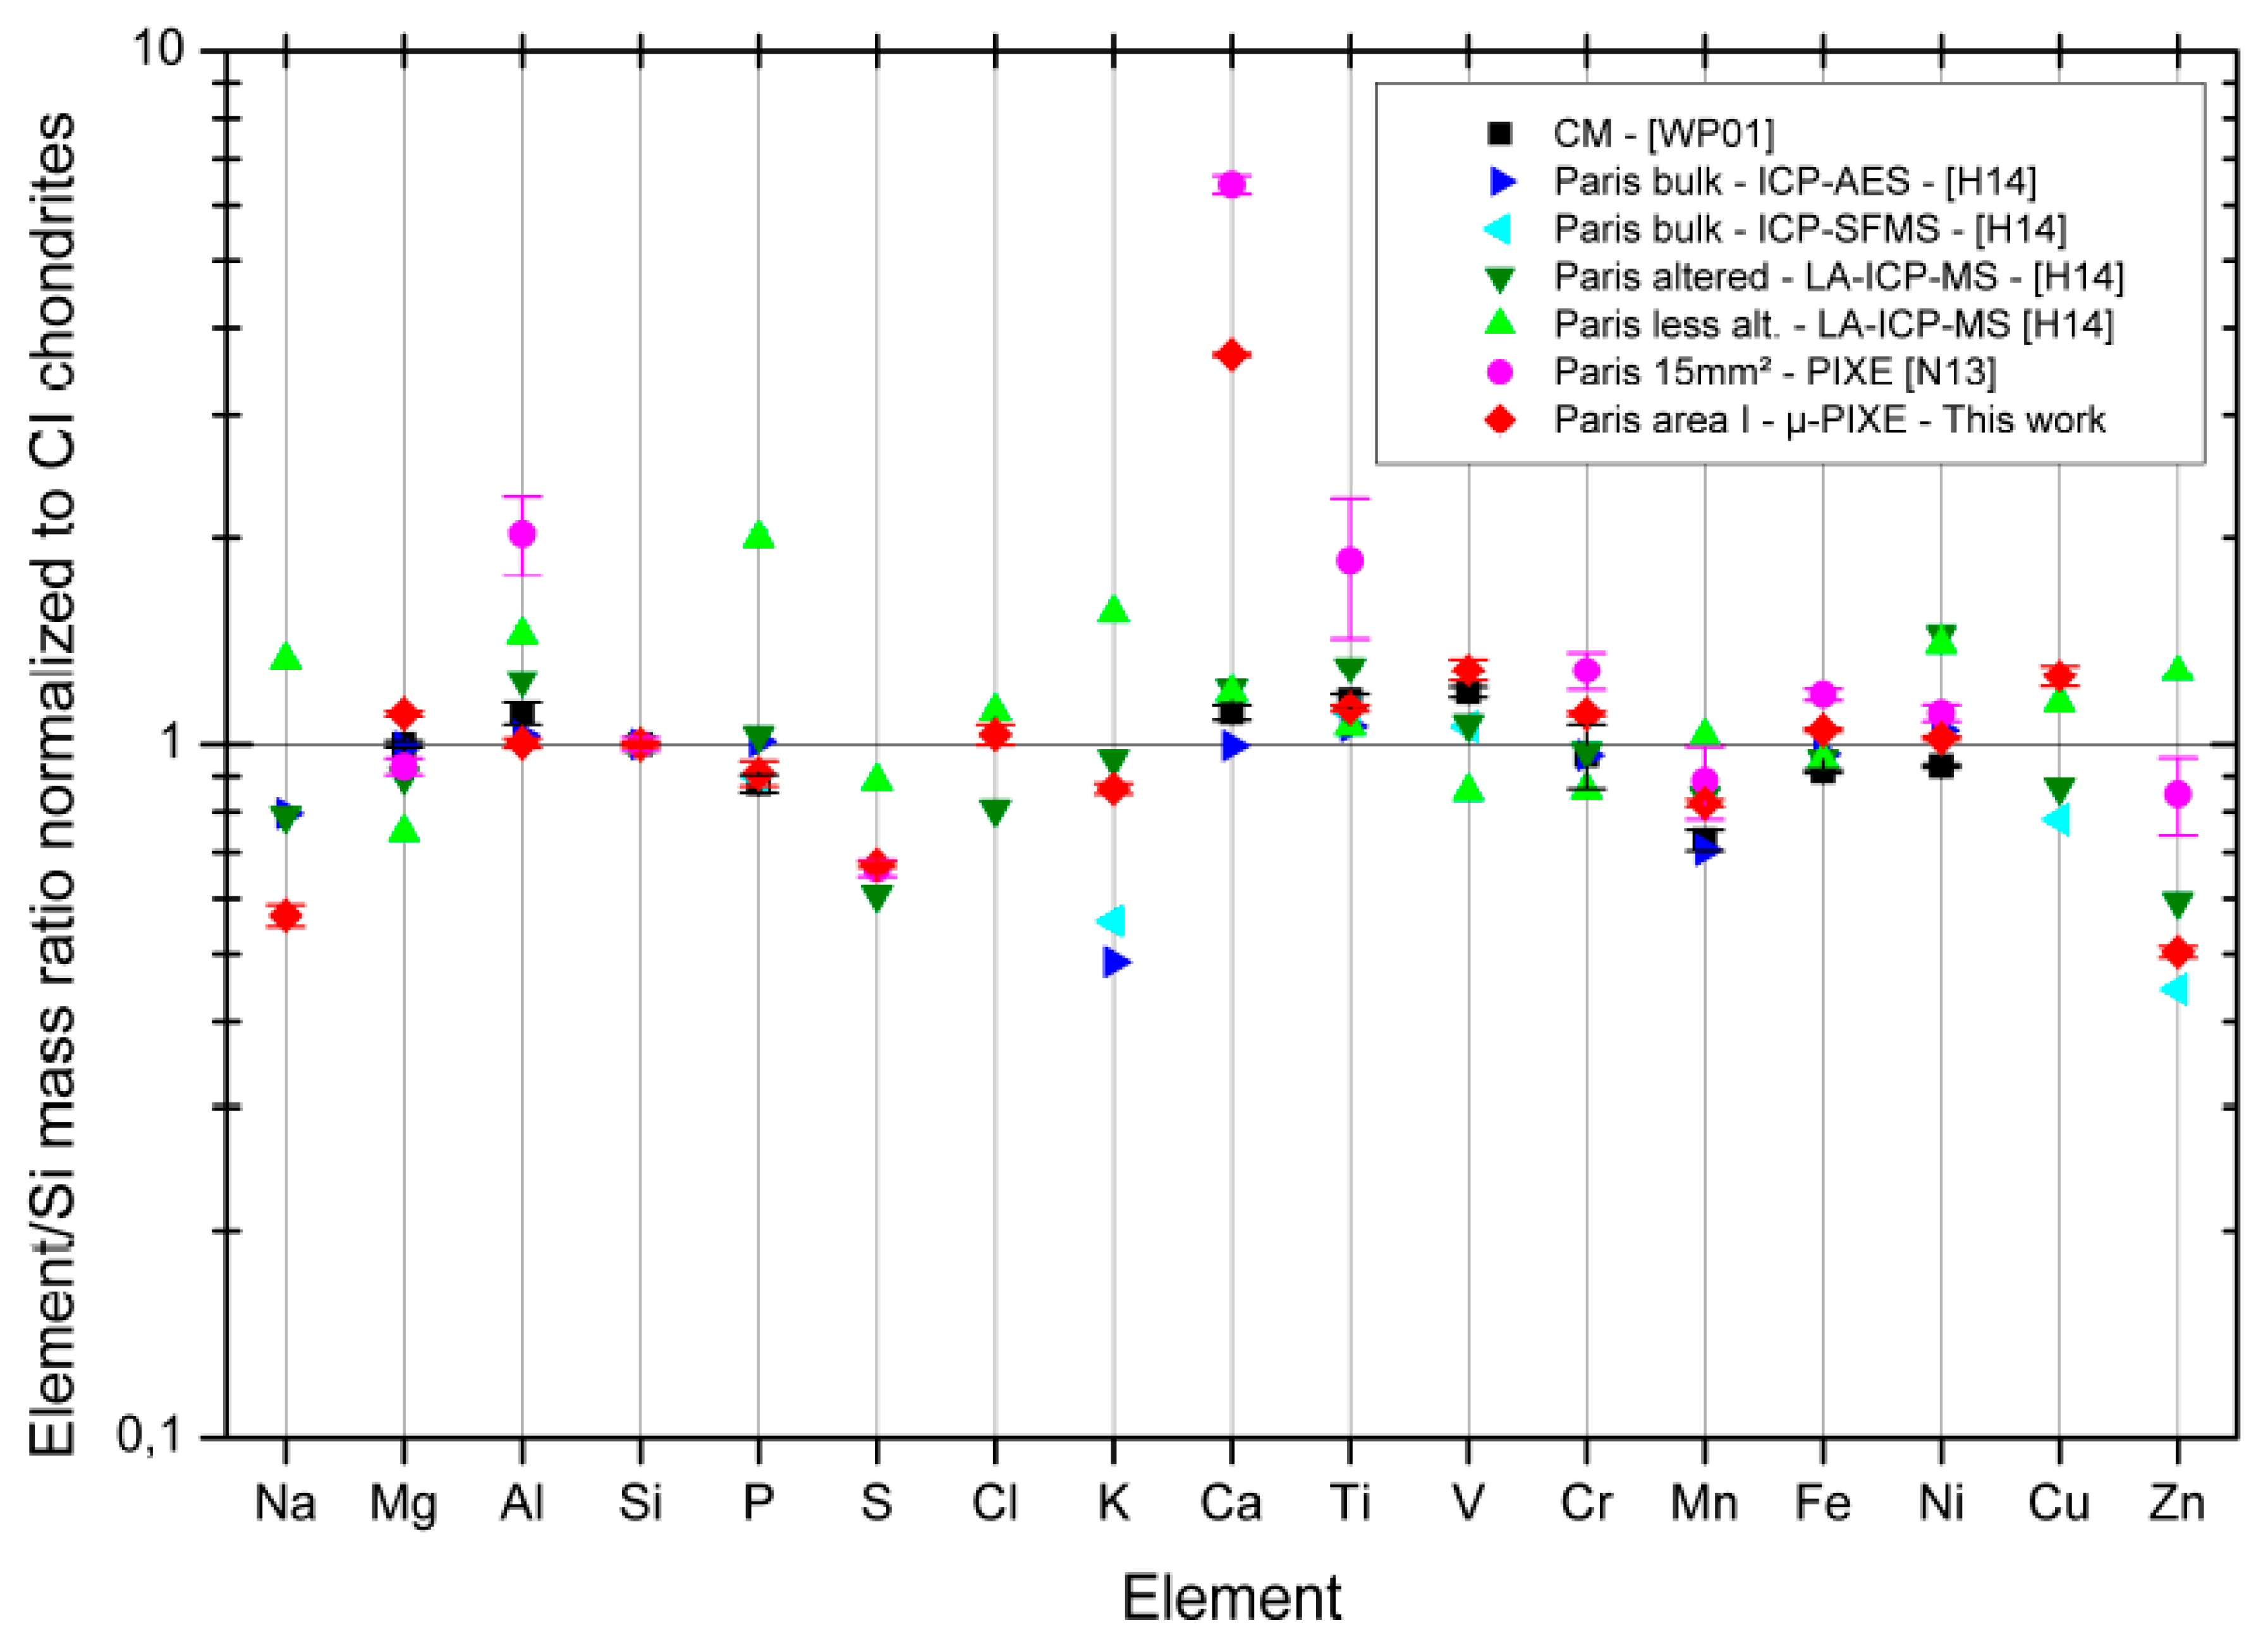
3.5. Micro-PIXE Results
3.6. TOF-SIMS Analysis
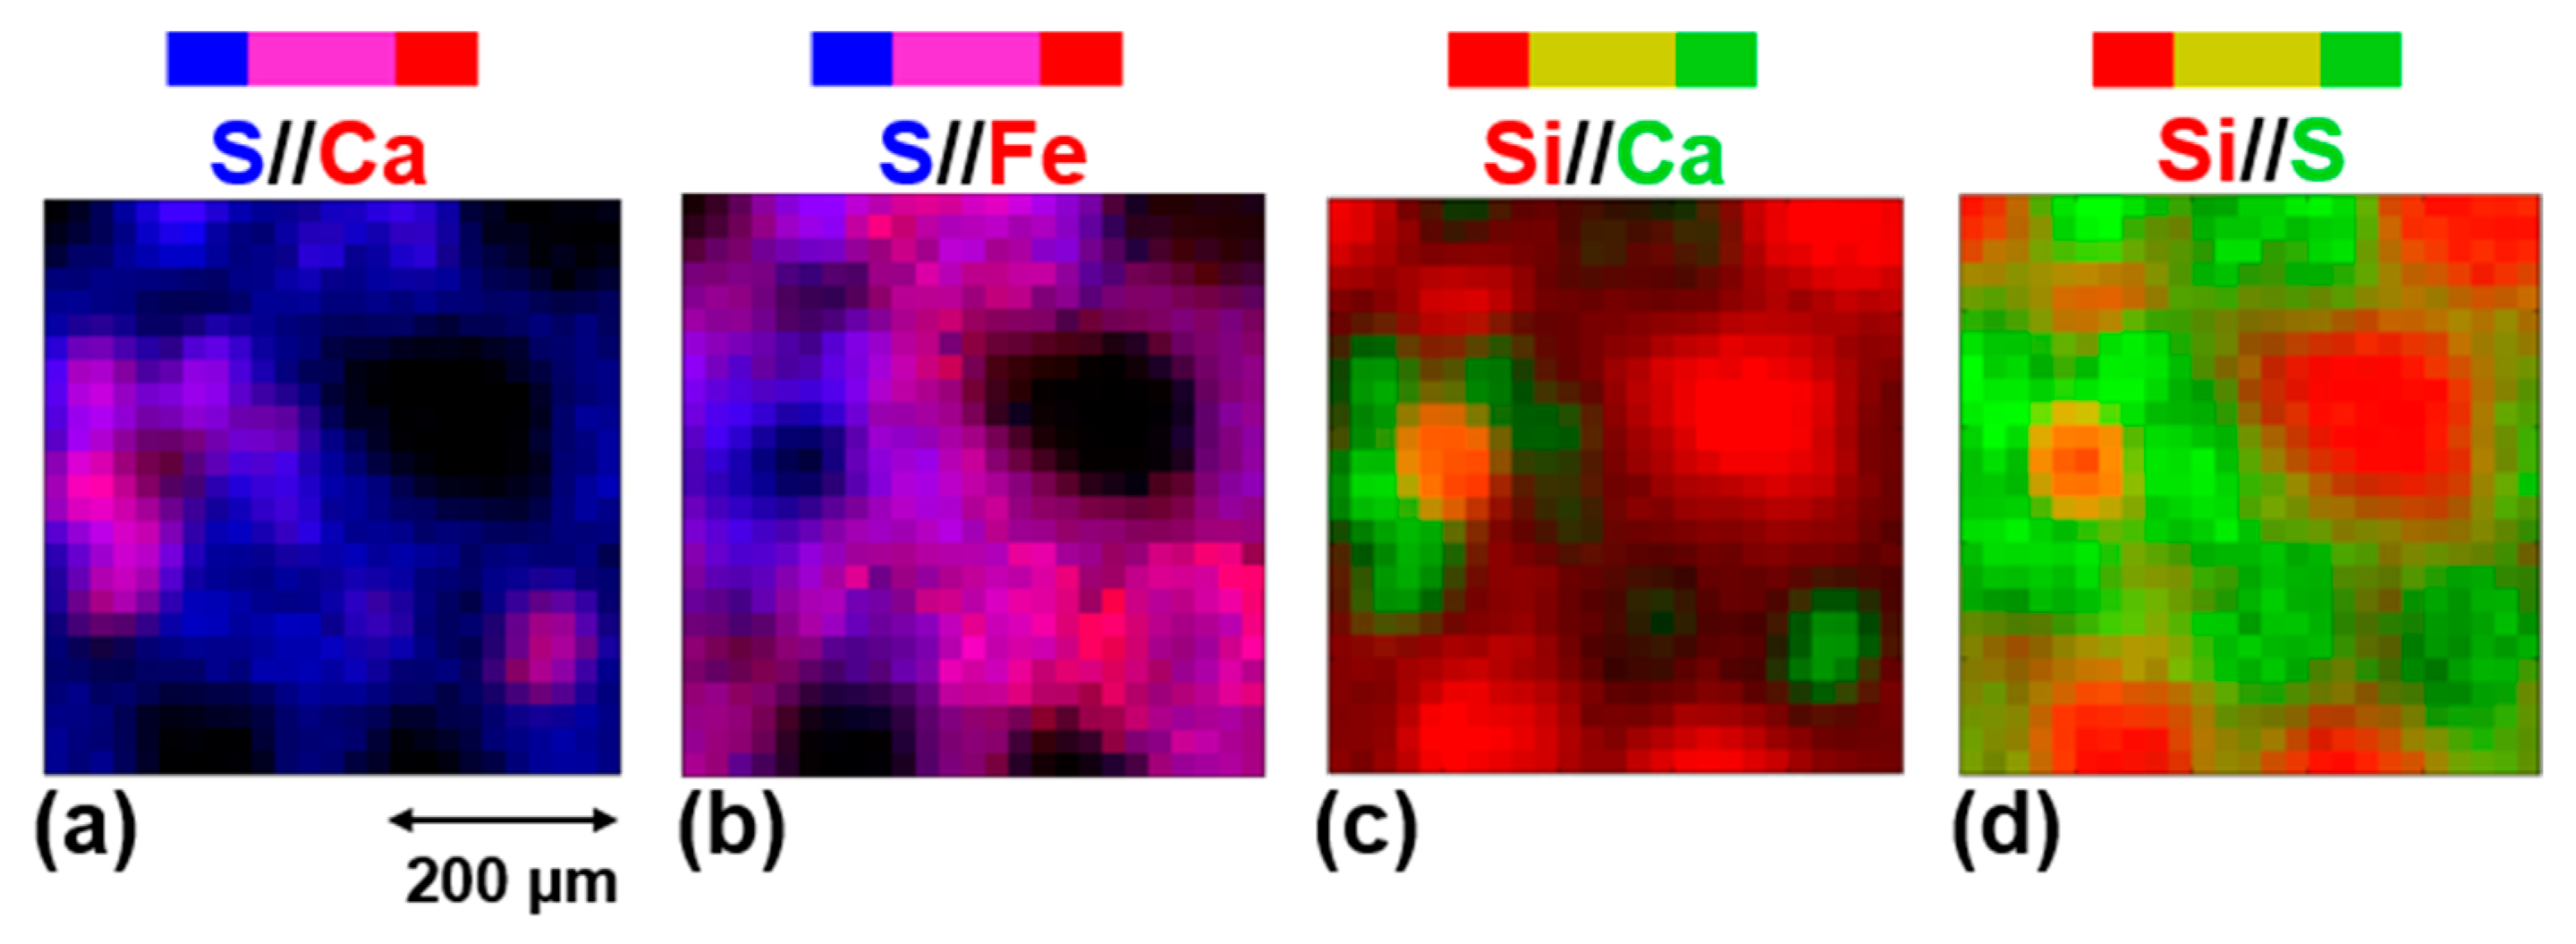
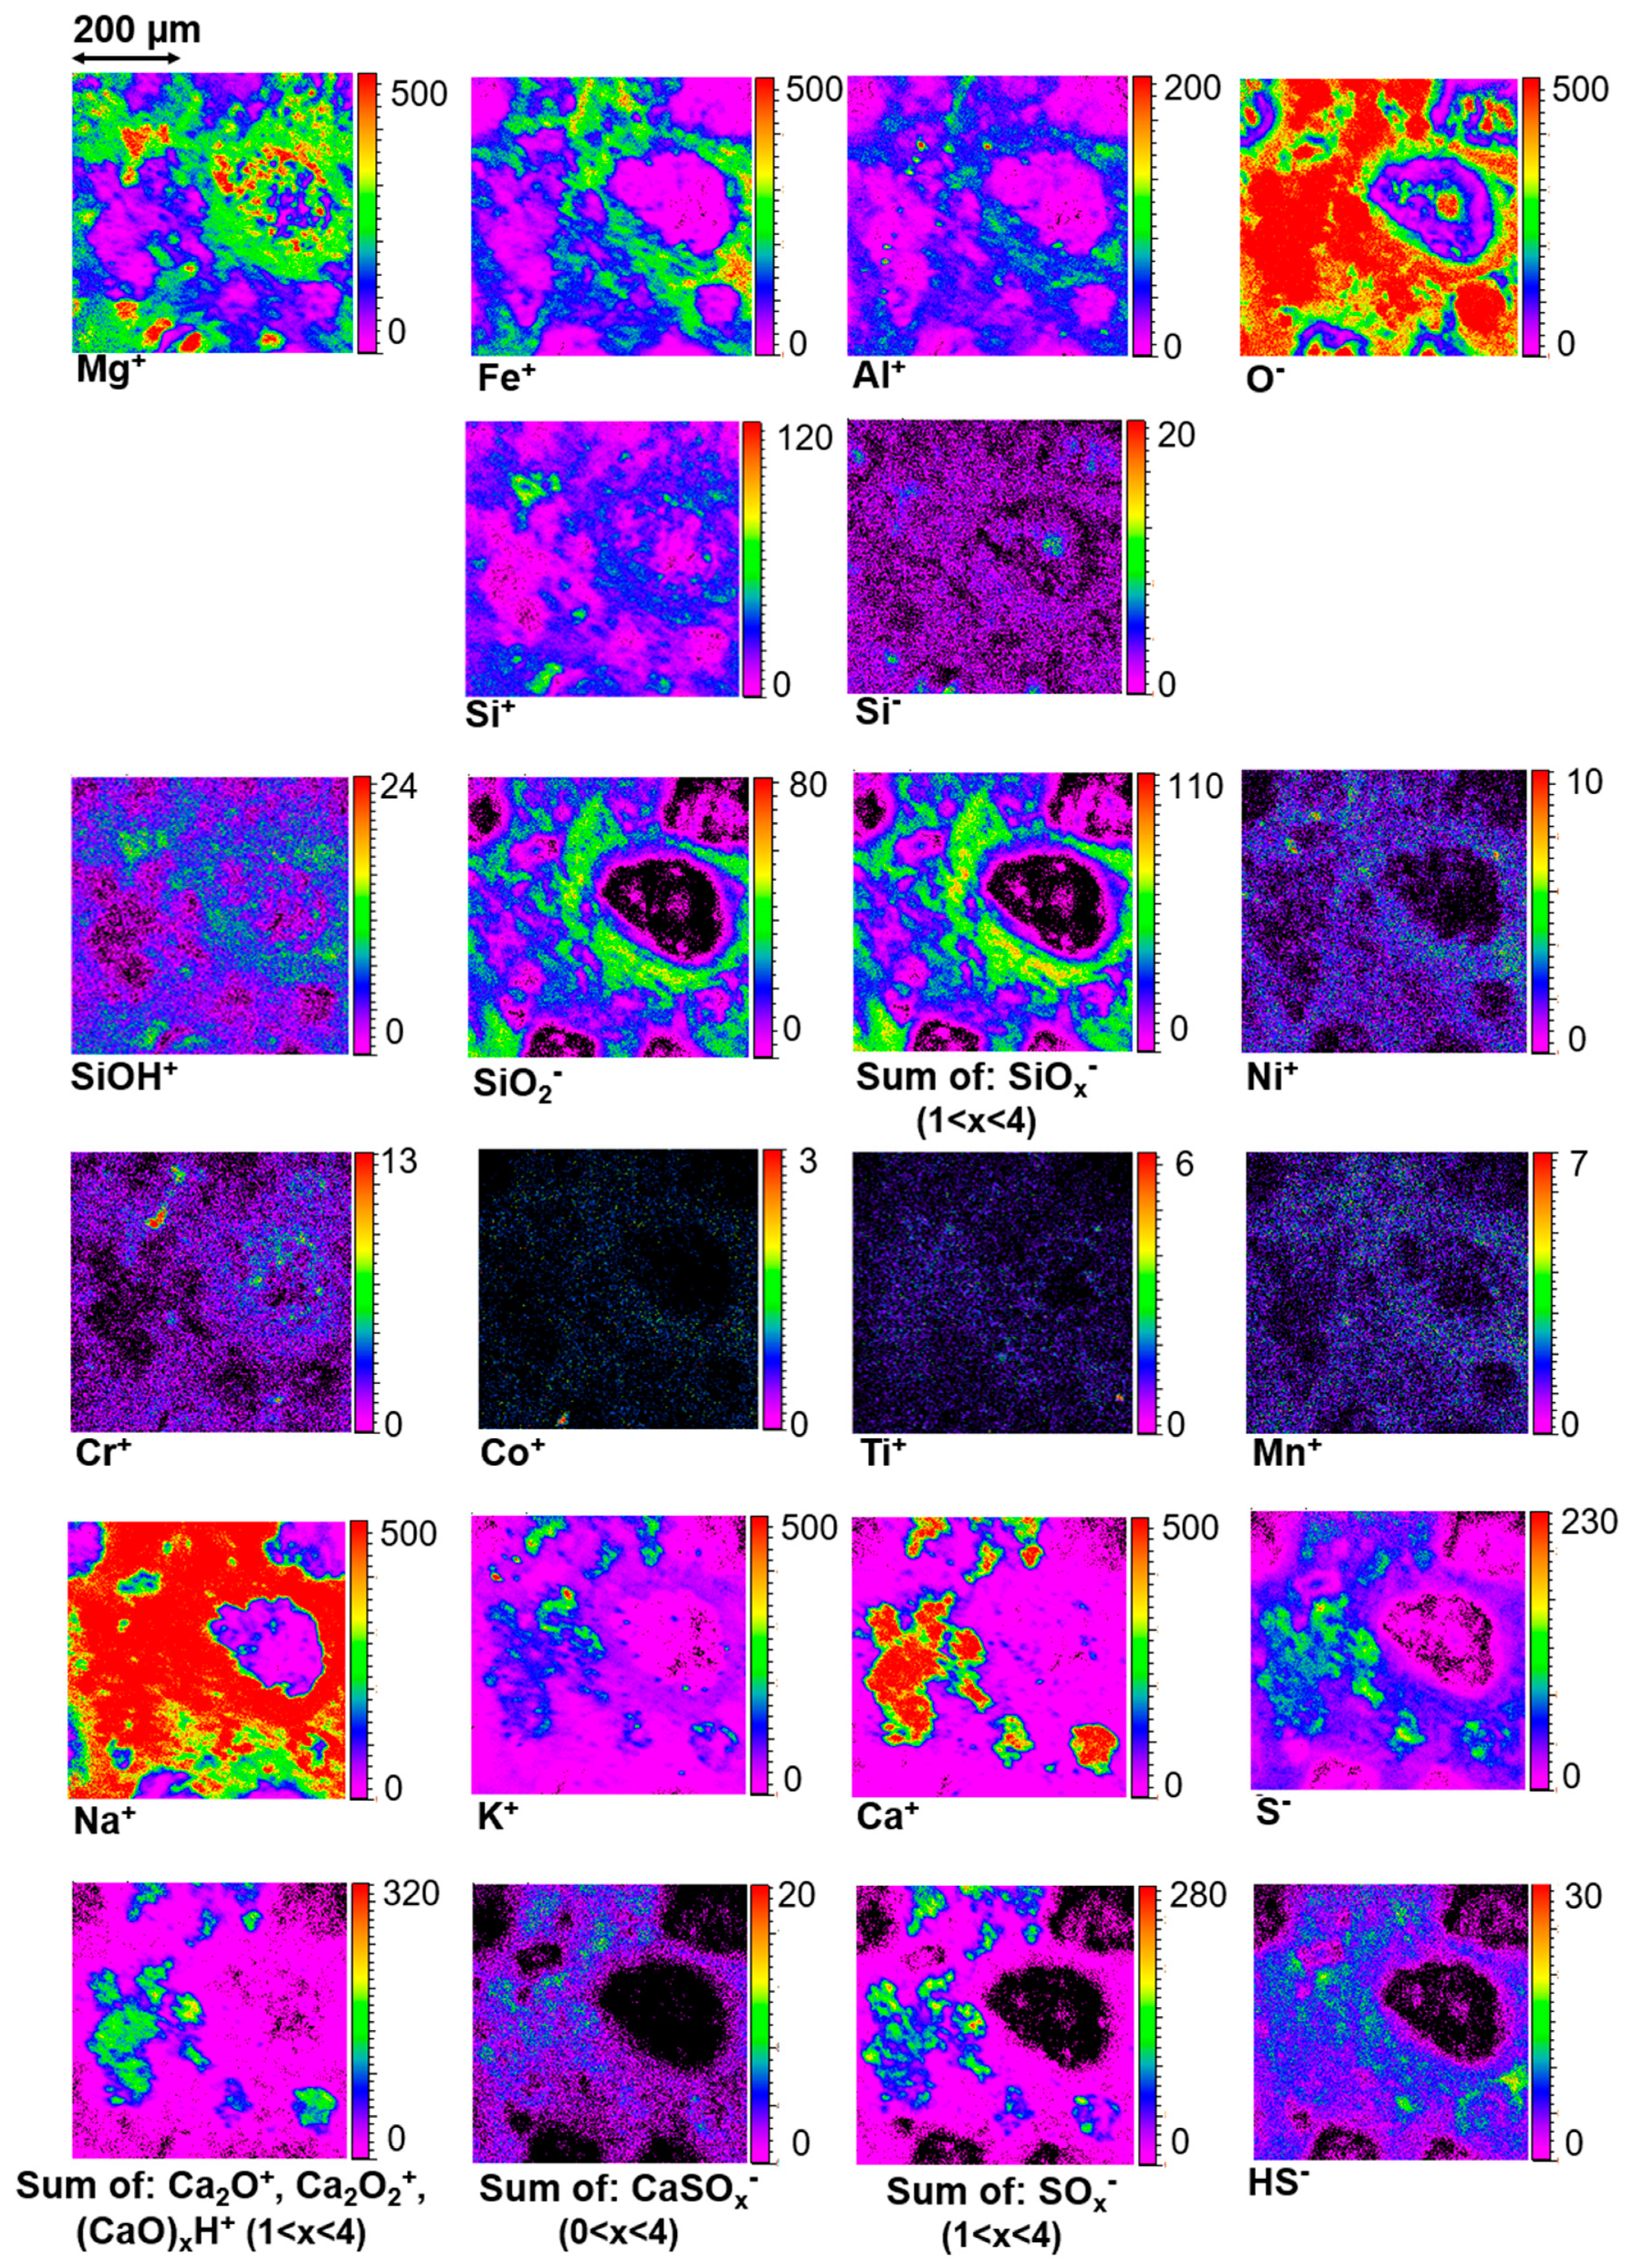
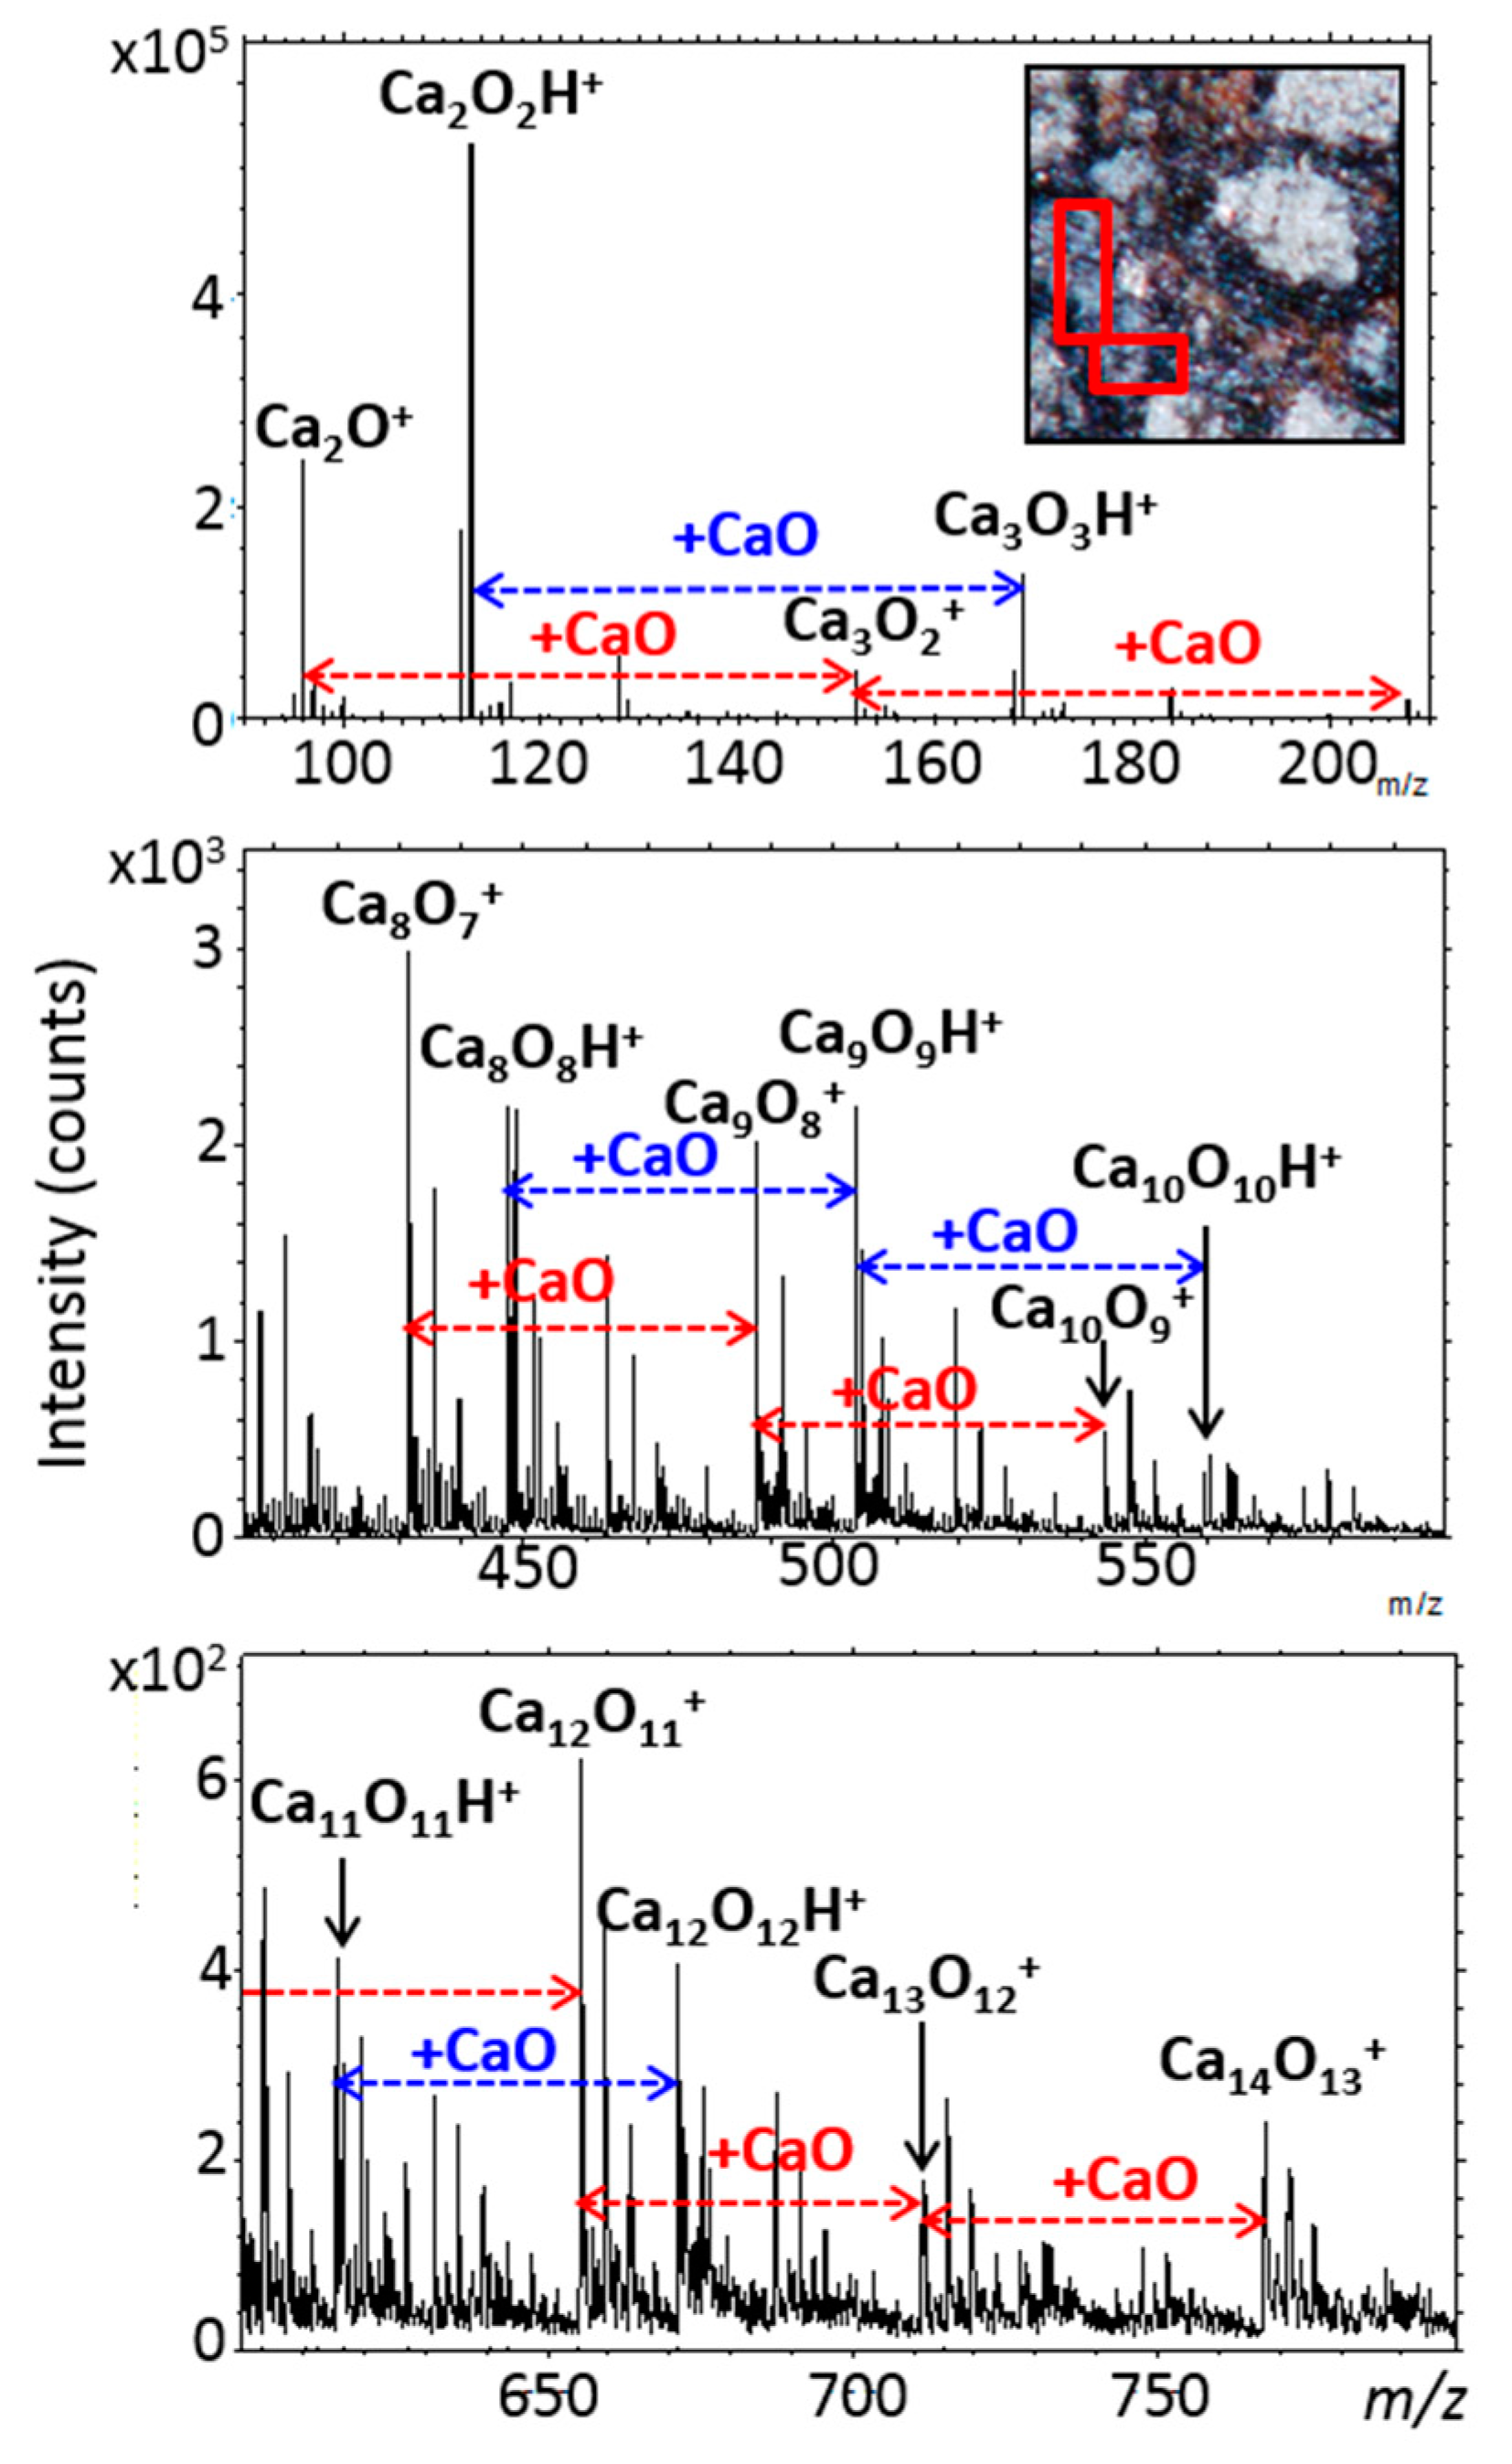
3.6.1. Elements and Minerals
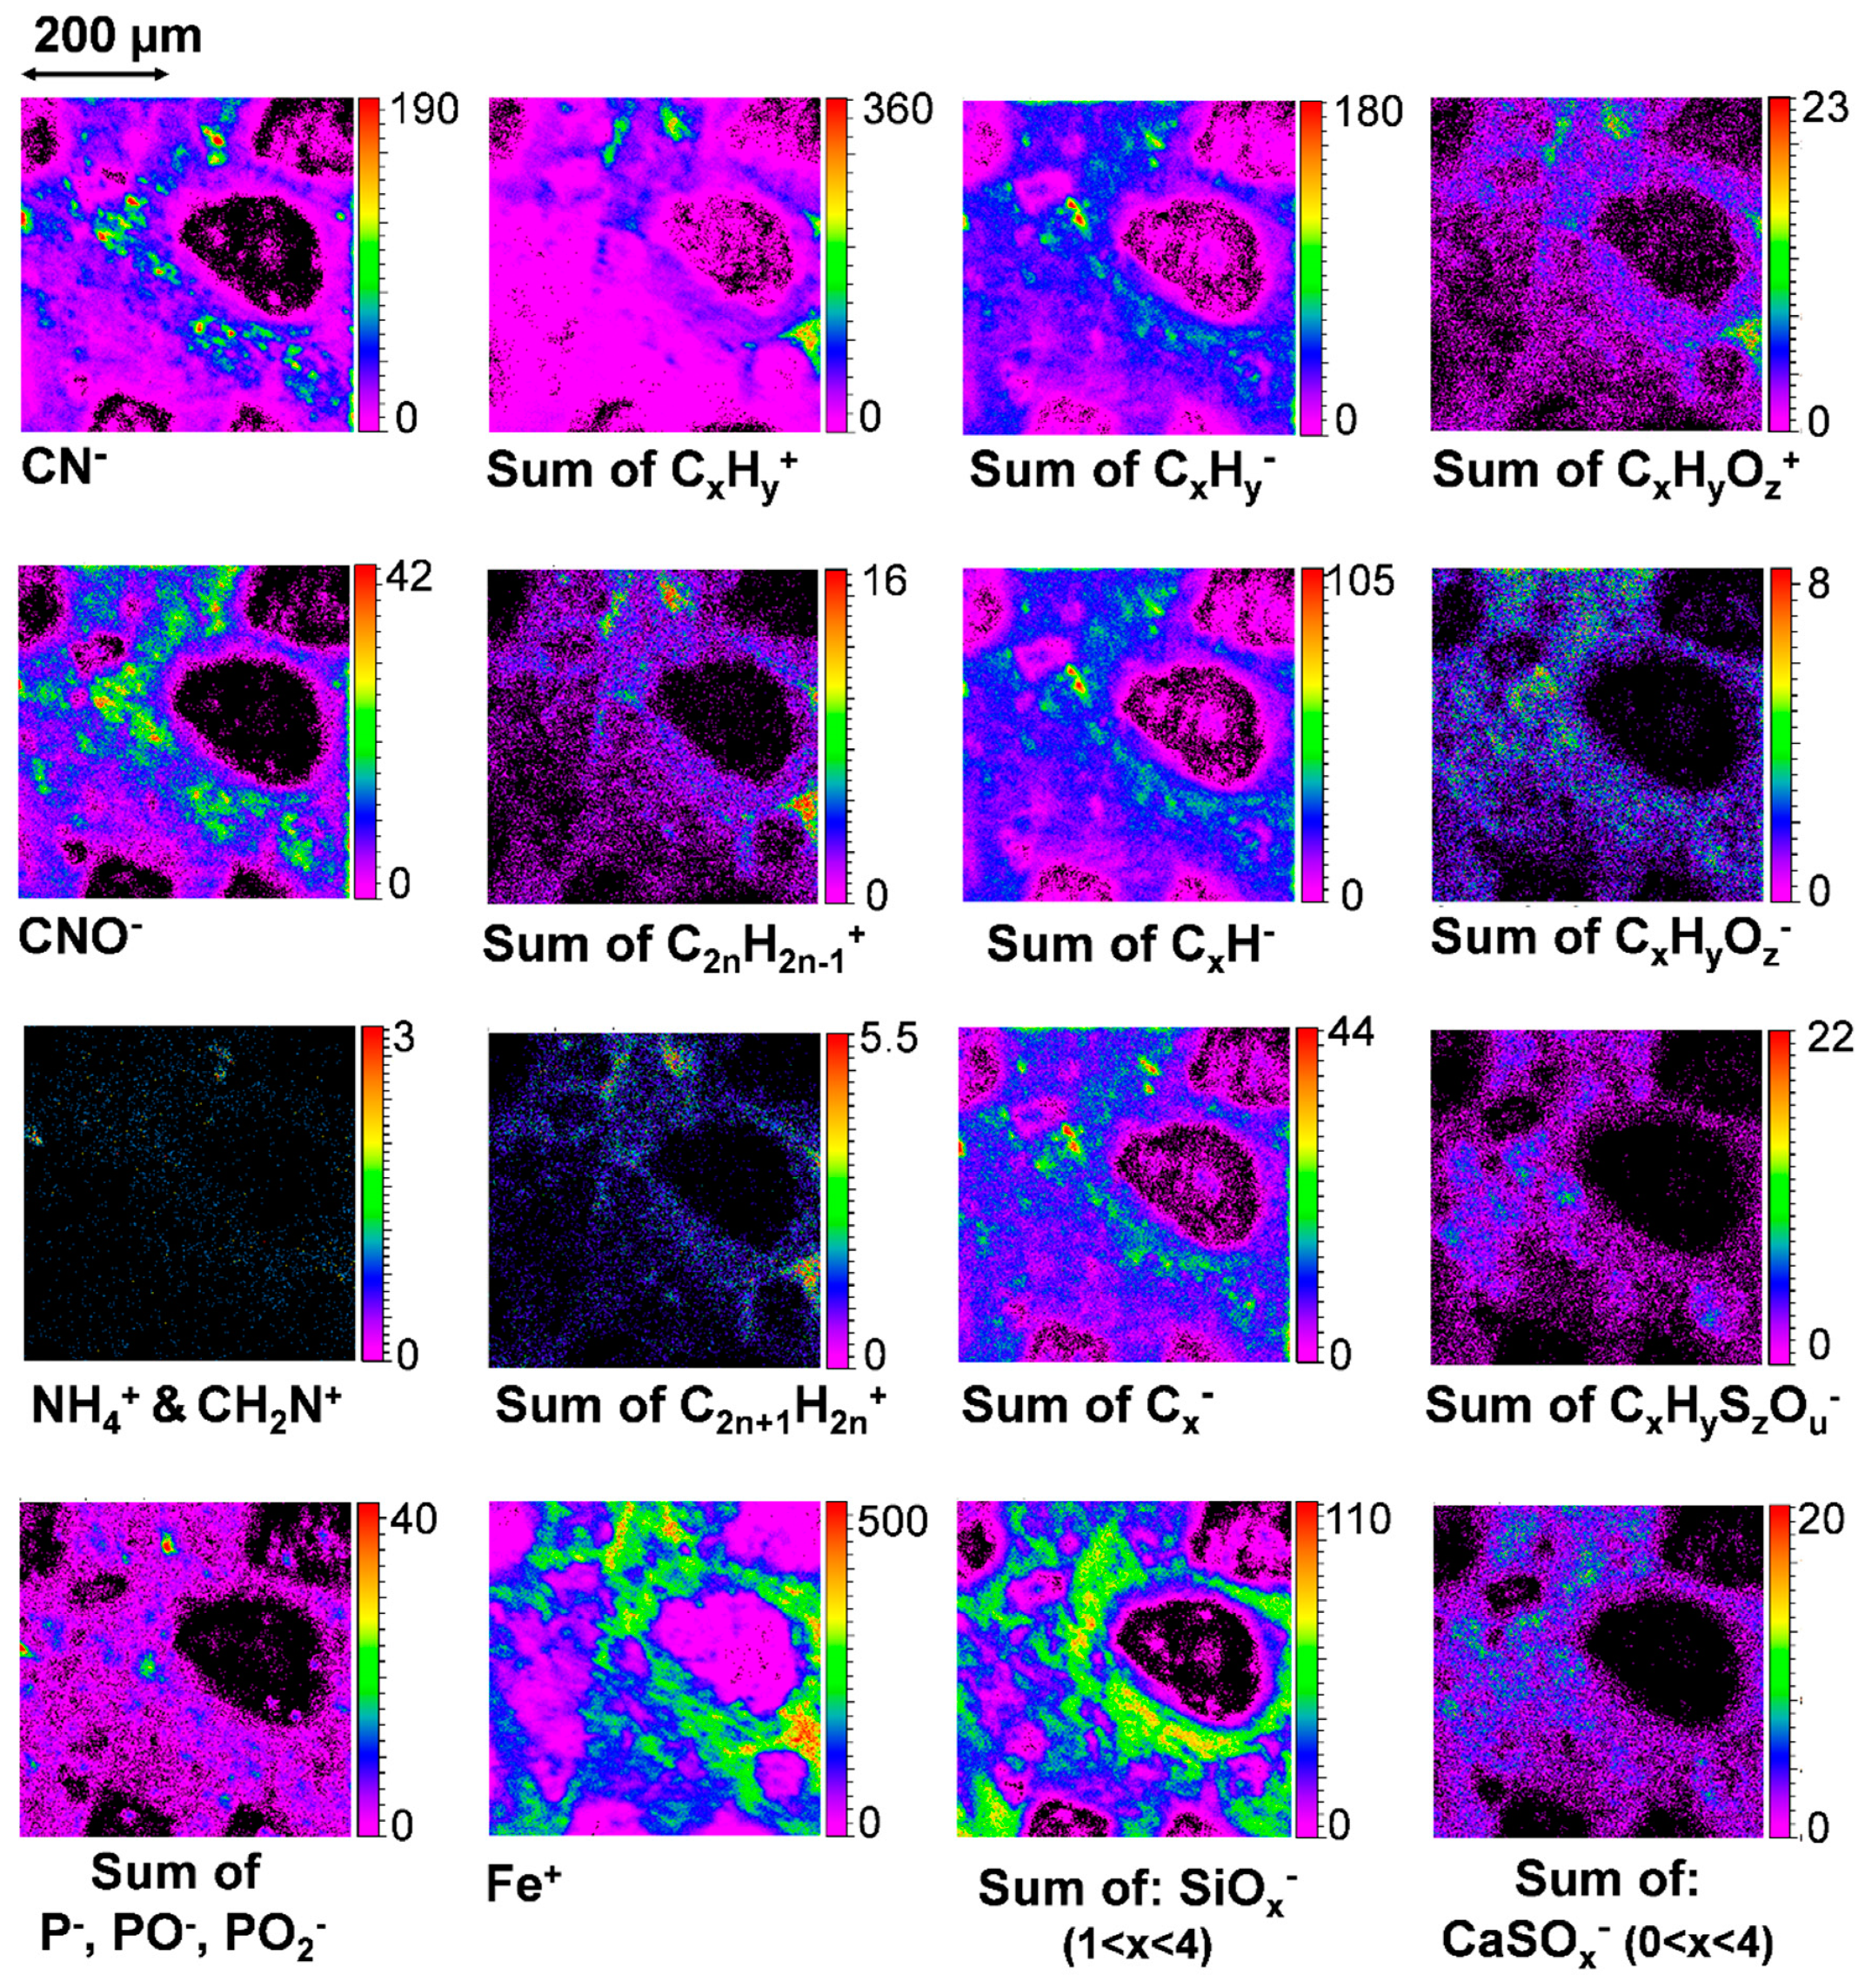
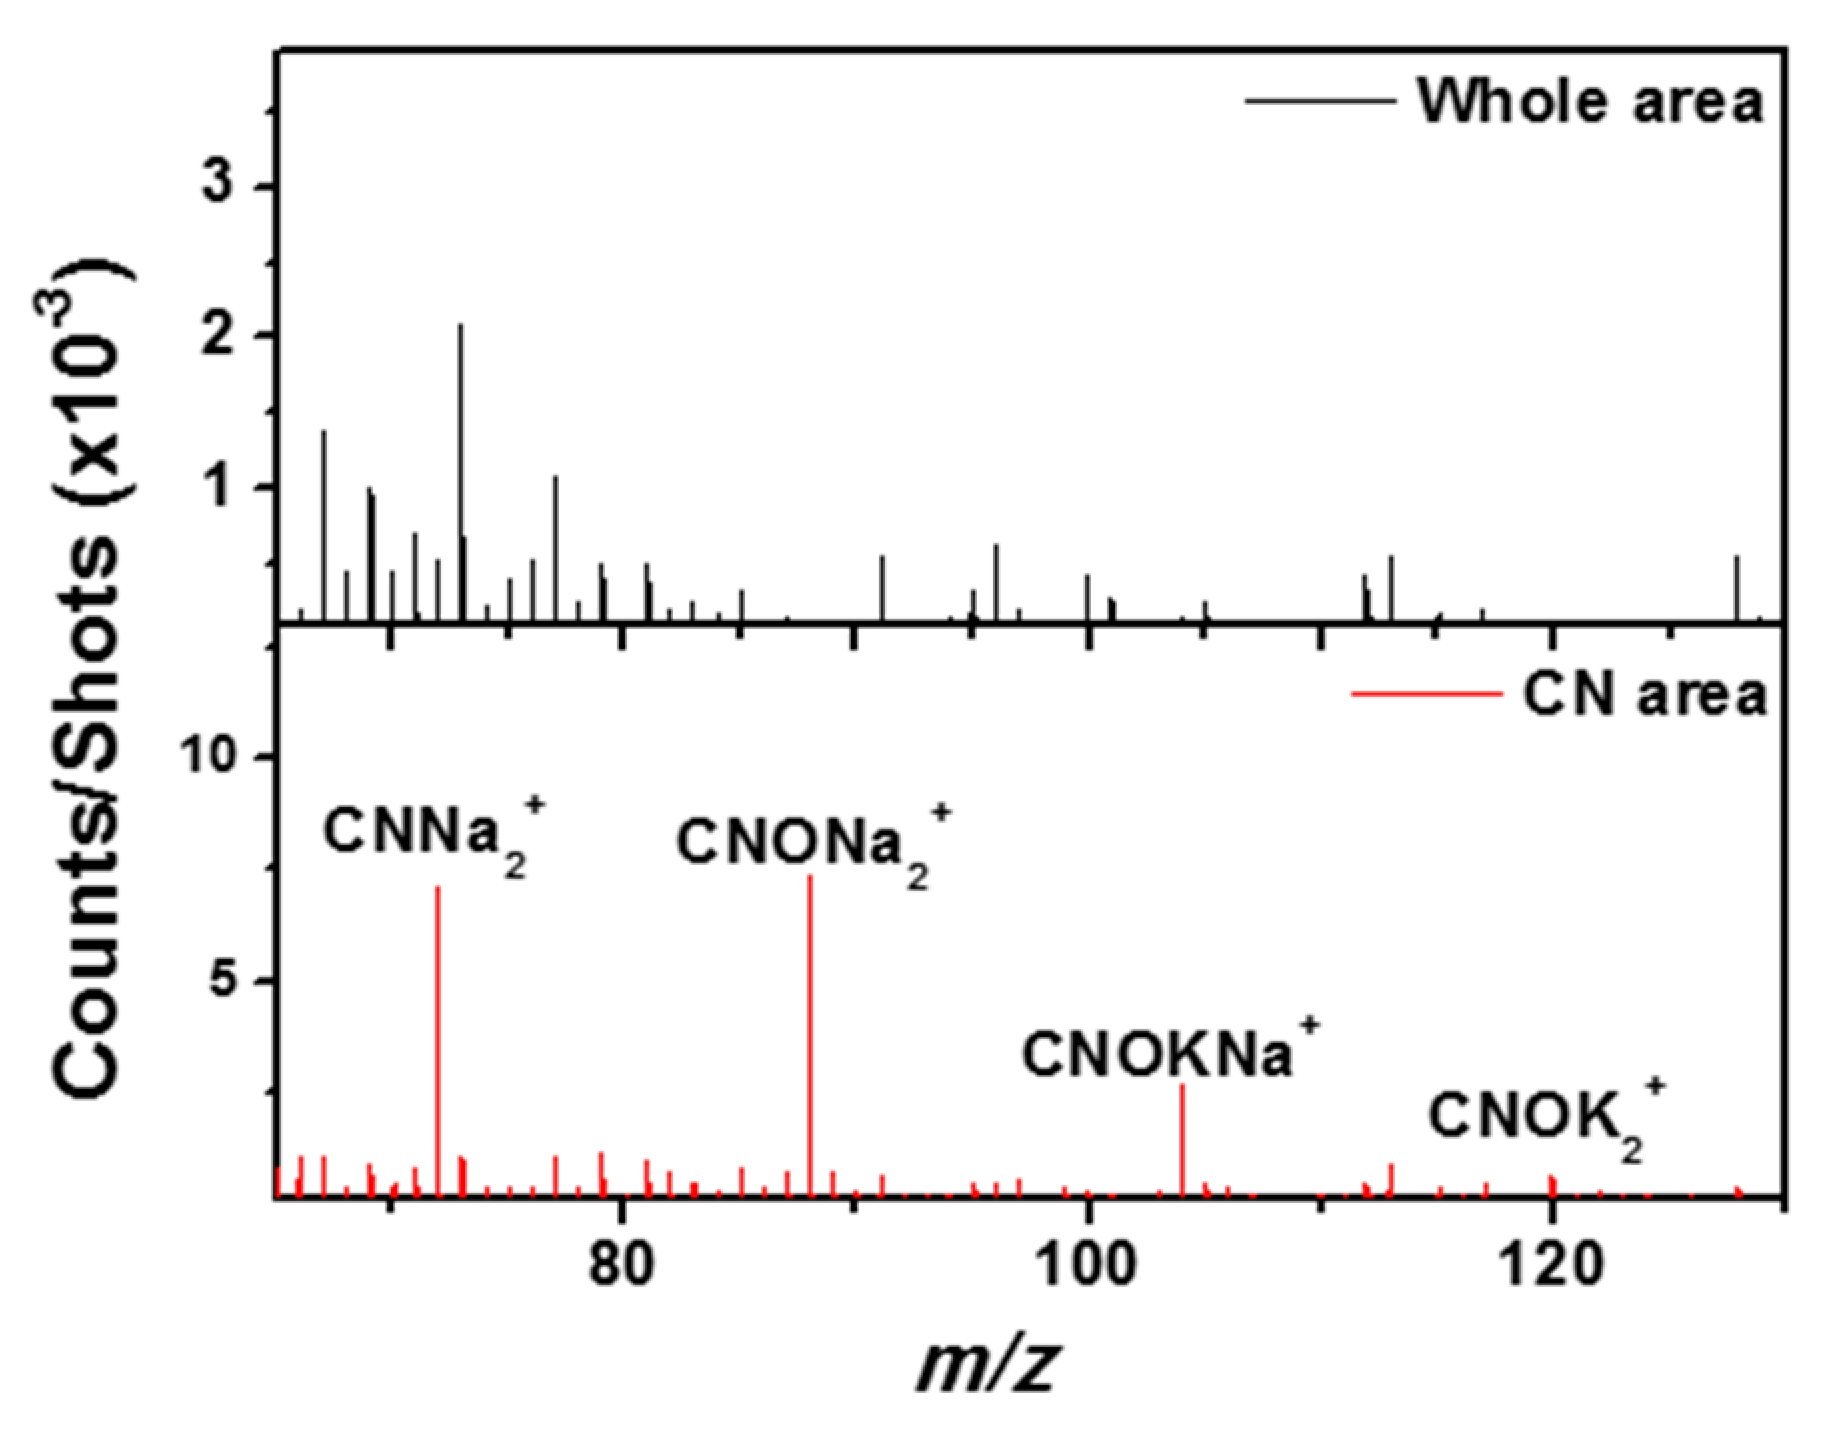
3.6.2. Carbon and Organic Matter
4. Discussion
4.1. Paris Elemental Composition
4.2. The Aqueous Alteration of the Matrix
4.3. Organics and Salts, Correlation with the Aqueous Alteration
- ligand exchange (for example, between –COO− groups on the organic matter in acidic conditions, and the hydroxyl groups of hydrated silicates or the iron hydroxide, goethite),
- cation bridging (through polyvalent cations such as Fe3+ that form positively charged bridges between acidic groups like –COO− of the organic matter and the negatively charged –OH− groups on hydrated silicates edges),
- and ion exchange between the mineral compound and organic functions (such as primary and secondary amines, amides and alcohols, and carboxylic acids).
4.4. Implication for Asteroids Remote Observations
5. Conclusions
Author Contributions
Funding
Acknowledgments
Conflicts of Interest
Appendix A
- Bismuth ion beams are delivered by a Liquid Metal Ion Gun, LMIG [107], and extracted by an electrode whose potential fixes their energy. Bismuth clusters follow a focusing column which contains an electro-dynamic mass filter [61] made up of a first chopper, a pulsing unit, a second chopper and a buncher. This arrangement permits to select a specific bismuth cluster (in our case, cluster ions Bi3+). The sample holder consists of a three-axis stage which allows to scan the sample and to analyze a large surface of millimetric dimensions with micron accuracy. The impact angle is 45°.
- A Gas Cluster Ion Beam, GCIB, argon source ([108]; Patent EP0516480) delivers large argon cluster beams. The clusters (containing thousands of argon atoms) are produced by an adiabatic expansion of the gas through a nozzle, under a high pressure towards vacuum, and are then ionized by electron impact. A first m/z separation is performed by a Wien filter before the ions are deflected to join the same focusing path to the target as the bismuth clusters. The impact angle is also 45°.
- Secondary ions are produced when the projectile hits the target. They are extracted and directed towards a reflection TOF mass spectrometer. The analyzed ions are post accelerated by a 15 kV potential before reaching the MCP (Micro Channel Plate) detector. The electrons from the MCP strike a fluorescent material and the resulting photons are detected by a photomultiplier.
Appendix B

References
- Schmitt-Kopplin, P.; Gabelica, Z.; Gougeon, R.D.; Fekete, A.; Kanawati, B.; Harir, M.; Gebefuegi, I.; Eckel, G.; Hertkorn, N. High molecular diversity of extraterrestrial organic matter in Murchison meteorite revealed 40 years after its fall. Proc. Natl. Acad. Sci. USA 2010, 107, 2763. [Google Scholar] [CrossRef]
- Martins, Z.; Modica, P.; Zanda, B.; d’Hendecourt, L.L.S. The amino acid and hydrocarbon contents of the Paris meteorite: Insights into the most primitive CM chondrite. Meteor. Planet. Sci. 2015, 50, 926–943. [Google Scholar] [CrossRef] [Green Version]
- Bonal, L.; Quirico, E.; Bourot-Denise, M.; Montagnac, G. Determination of the petrologic type of CV3 chondrites by Raman spectroscopy of included organic matter. Geochimica et Cosmochimica Acta 2006, 70, 1849–1863. [Google Scholar] [CrossRef]
- Busemann, H.; Alexander, M.O.D.; Nittler, L.R. Characterization of insoluble organic matter in primitive meteorites by microRaman spectroscopy. Meteor. Planet. Sci. 2007, 42, 1387–1416. [Google Scholar] [CrossRef]
- Kebukawa, Y.; Alexander, C.; Cody, G.D. Compositional diversity in insoluble organic matter in type 1, 2 and 3 chondrites as detected by infrared spectroscopy. Geochimica et Cosmochimica Acta 2011, 75, 3530–3541. [Google Scholar] [CrossRef]
- Orthous-Daunay, F.R.; Quirico, E.; Beck, P.; Brissaud, O.; Dartois, E.; Pino, T.; Schmitt, B. Mid-infrared study of the molecular structure variability of insoluble organic matter from primitive chondrites. Icarus 2013, 223, 534–543. [Google Scholar] [CrossRef]
- Derenne, S.; Robert, F. Model of molecular structure of the insoluble organic matter isolated from Murchison meteorite. Meteor. Planet. Sci. 2010, 45, 1461–1475. [Google Scholar] [CrossRef]
- Orthous-Daunay, F.R.; Quirico, E.; Lemelle, L.; Beck, P.; deAndrade, V.; Simionovici, A.; Derenne, S. Speciation of sulfur in the insoluble organic matter from carbonaceous chondrites by XANES spectroscopy. Earth Planet. Sci. Lett. 2010, 300, 321–328. [Google Scholar] [CrossRef]
- Cody, G.D.; Alexander, C. NMR studies of chemical structural variation of insoluble organic matter from different carbonaceous chondrite groups. Geochimica et Cosmochimica Acta 2005, 69, 1085–1097. [Google Scholar] [CrossRef]
- Sephton, M.; Love, G.; Watson, J.; Verchovsky, A.; Wright, I.P.; Snape, C.; Gilmour, I. Hydropyrolysis of insoluble carbonaceous matter in the Murchison meteorite: New insights into its macromolecular structure. Geochimica et Cosmochimica Acta 2004, 68, 1385–1393. [Google Scholar] [CrossRef]
- Martins, Z.; Alexander, C.M.O.D.; Orzechowska, G.E.; Fogel, M.L.; Ehrenfreund, P. Indigenous amino acids in primitive CR meteorites. Meteor. Planet. Sci. 2007, 42, 2125–2136. [Google Scholar] [CrossRef] [Green Version]
- Martins, Z.; Botta, O.; Fogel, M.L.; Sephton, M.A.; Glavin, D.P.; Watson, J.S.; Dworkin, J.P.; Schwartz, A.W.; Ehrenfreund, P. Extraterrestrial nucleobases in the Murchison meteorite. Earth Planet. Sci. Lett. 2008, 270, 130–136. [Google Scholar] [CrossRef] [Green Version]
- Glavin, D.P.; Dworkin, J.P. Enrichment of the amino acid L-isovaline by aqueous alteration on CI and CM meteorite parent bodies. Proc. Natl. Acad. Sci. USA 2009, 106, 5487. [Google Scholar] [CrossRef]
- Pizzarello, S.; Holmes, W. Nitrogen-containing compounds in two CR2 meteorites: 15N composition, molecular distribution and precursor molecules. Geochimica et Cosmochimica Acta 2009, 73, 2150–2162. [Google Scholar] [CrossRef]
- Glavin, D.P.; Callahan, M.P.; Dworkin, J.P.; Elsila, J.E. The effects of parent body processes on amino acids in carbonaceous chondrites. Meteor. Planet. Sci. 2010, 45, 1948–1972. [Google Scholar] [CrossRef] [Green Version]
- Callahan, M.P.; Smith, K.E.; Cleaves, H.J.; Ruzicka, J.; Stern, J.C.; Glavin, D.P.; House, C.H.; Dworkin, J.P. Carbonaceous meteorites contain a wide range of extraterrestrial nucleobases. Proc. Natl. Acad. Sci. USA 2011, 13995–13998. [Google Scholar] [CrossRef]
- Monroe, A.A.; Pizzarello, S. The soluble organic compounds of the Bells meteorite: Not a unique or unusual composition. Geochimica et Cosmochimica Acta 2011, 75, 7585–7595. [Google Scholar] [CrossRef]
- Orthous-Daunay, F.-R.; Thissen, R.; Vuitton, V.; Somogyi, A.; Mespoulede, M.; Beck, P.; Bonnet, J.-Y.; Dutuit, O.; Schmitt, B.; Quirico, E. Orbitrap-MS and FT-ICR-MS of free and labile organic matter from carbonaceous chondrites. In Proceedings of the 42nd Lunar and Planetary Science Conference (2011), Woodlands, TX, USA, 7–11 March 2011; p. 2654. [Google Scholar]
- Elsila, J.E.; de Leon, N.; Buseck, P.R.; Zare, R. Alkylation of polycyclic aromatic hydrocarbons in carbonaceous chondrites. Geochimica et Cosmochimica Acta 2005, 69, 1349–1357. [Google Scholar] [CrossRef]
- Sabbah, H.; Bonnamy, A.; Papanastasiou, D.; Cernicharo, J.; Martín-Gago, J.-A.; Joblin, C. Identification of PAH Isomeric Structure in Cosmic Dust Analogues: The AROMA setup. Astrophys. J. 2017, 843, 34. [Google Scholar] [CrossRef]
- Sephton, M.A. Organic compounds in carbonaceous meteorites. Nat. Prod. Rep. 2002, 19, 292–311. [Google Scholar] [CrossRef]
- Alexander, C.M.O.D.; Cody, G.D.; De Gregorio, B.T.; Nittler, L.R.; Stroud, R.M. The nature, origin and modification of insoluble organic matter in chondrites, the major source of Earth’s C and N. Chemie der Erde-Geochemistry 2017, 77, 227–256. [Google Scholar] [CrossRef]
- Le Guillou, C.; Brearley, A. Relationships between organics, water and early stages of aqueous alteration in the pristine CR3.0 chondrite MET 00426. Geochimica et Cosmochimica Acta 2014, 131, 344–367. [Google Scholar] [CrossRef]
- Garvie, L.A.J.; Buseck, P.R. Prebiotic carbon in clays from Orgueil and Ivuna (CI), and Tagish Lake (C2 ungrouped) meteorites. Meteor. Planet. Sci. 2007, 42, 2111–2117. [Google Scholar] [CrossRef]
- Le Guillou, C.; Bernard, S.; Brearley, A.; Remusat, L. Evolution of organic matter in Orgueil, Murchison and Renazzo during parent body aqueous alteration: In situ investigations. Geochimica et Cosmochimica Acta 2014, 131, 368–392. [Google Scholar] [CrossRef]
- Zanda, B.; Bourot-Denise, M.; Hewins, R.H.; Barrat, J.A.; Gattacceca, J. The paris CM chondrite yields new insights on the onset of parent body alteration. In Proceedings of the 73rd Annual Meteoritical Society Meeting (2010), New York, NY, USA, 26–30 July 2010; p. 5312. [Google Scholar]
- Bourot-Denise, M.; Zanda, B.; Marrocchi, Y.; Greenwood, R.; Pont, S.; Hewins, R.H.; Franchi, I.A.; Cornen, G. Paris: The slightly altered, slightly metamorphosed CM that bridges the gap between CMs and COs. In Proceedings of the 41st Lunar and Planetary Science Conference (2010), Houston, TX, USA, 1–5 March 2010; p. 1683. [Google Scholar]
- Blanchard, I.; Counelle, M.; Bourot-Denise, M.; Kearsley, A. Secondary processes within the paris CM chondrite. In Proceedings of the 74th Annual Meteoritical Society Meeting (2011), London, UK, 8–12 August 2011; p. 5099. [Google Scholar]
- Jambon, A.; Boudouma, O.; Zanda, B.; Couffignal, F. Chlorine in the paris CM: A preliminary study. In Proceedings of the 74th Annual Meteoritical Society Meeting (2011), London, UK, 8–12 August 2011; p. 5309. [Google Scholar]
- Remusat, L.; Bernard, S.; Le Guillou, C.; Brearley, A. Parent Body Influence on Organic Matter: The Message from Paris. In Proceedings of the 74th Annual Meteoritical Society Meeting (2011), London, UK, 8–12 August 2011; p. 5327. [Google Scholar]
- Marrocchi, Y.; Gounelle, M.; Blanchard, I.; Caste, F.; Kearsley, A.T. The Paris CM chondrite: Secondary minerals and asteroidal processing. Meteor. Planet. Sci. 2014, 49, 1232–1249. [Google Scholar] [CrossRef]
- Leroux, H.; Cuvillier, P.; Zanda, B.; Hewins, R.H. GEMS-like material in the matrix of the Paris meteorite and the early stages of alteration of CM chondrites. Geochimica et Cosmochimica Acta 2015, 170, 247–265. [Google Scholar] [CrossRef]
- Hewins, R.; Bourot-Denise, M.; Zanda, B.; Leroux, H.; Barrat, J.-A.; Humayun, M.; Gopel, C.; Greenwood, R.; Franchi, I.; Pont, S.; et al. The Paris meteorite, the least altered CM chondrite so far. Geochimica et Cosmochimica Acta 2014, 124, 190–222. [Google Scholar] [CrossRef]
- Noun, M.; Roumie, M.; Calligaro, T.; Nsouli, B.; Brunetto, R.; Baklouti, D.; Le Sergeant d’Hendecourt, L.; Della-Negra, S. On the characterization of the “paris” meteorite using PIXE, RBS and micro-PIXE. Nucl. Instrum. Methods Phys. Res. Sect. B 2013, 306, 261–264. [Google Scholar] [CrossRef]
- Piani, L.; Yurimoto, H.; Remusat, L. A dual origin for water in carbonaceous asteroids revealed by CM chondrites. Nat. Astron. 2018, 2, 317–323. [Google Scholar] [CrossRef] [Green Version]
- Pearson, V.K.; Sephton, M.A.; Franchi, I.A.; Gibson, J.M.; Gilmour, I. Carbon and nitrogen in carbonaceous chondrites: Elemental abundances and stable isotopic compositions. Meteor. Planet. Sci. 2006, 41, 1899–1918. [Google Scholar] [CrossRef]
- Merouane, S.; Djouadi, Z.; d’Hendecourt, L.L.S.; Zanda, B.; Borg, J. Hydrocarbon materials of likely interstellar origin from the Paris meteorite. Astrophys. J. 2012, 756, 154. [Google Scholar] [CrossRef]
- Dionnet, Z.; Aleon-Toppani, A.; Baklouti, D.; Borondics, F.; Brisset, F.; Djouadi, Z.; Sandt, C.; Brunetto, R. Organic and mineralogic heterogeneity of the Paris meteorite followed by FTIR hyperspectral imaging. Meteor. Planet. Sci. 2018, 53, 2608–2623. [Google Scholar] [CrossRef]
- Vinogradoff, V.; Le Guillou, C.; Bernard, S.; Binet, L.; Cartigny, P.; Brearley, A.J.; Remusat, L. Paris vs. Murchison: Impact of hydrothermal alteration on organic matter in CM chondrites. Geochimica et Cosmochimica Acta 2017, 212, 234–252. [Google Scholar] [CrossRef]
- Uesugi, M.; Naraoka, H.; Ito, M.; Yabuta, H.; Kitajima, F.; Takano, Y.; Mita, H.; Ohnishi, I.; Kebukawa, Y.; Yada, T.; et al. Sequential analysis of carbonaceous materials in Hayabusa-returned samples for the determination of their origin. Earth Planets Space 2014, 66, 102. [Google Scholar] [CrossRef] [Green Version]
- Naraoka, H.; Aoki, D.; Fukushima, K.; Uesugi, M.; Ito, M.; Kitajima, F.; Mita, H.; Yabuta, H.; Takano, Y.; Yada, T.; et al. ToF-SIMS analysis of carbonaceous particles in the sample catcher of the Hayabusa spacecraft. Earth Planets Space 2015, 67, 67. [Google Scholar] [CrossRef] [Green Version]
- Sugita, S.; Honda, R.; Morota, T.; Kameda, S.; Sawada, H.; Tatsumi, E.; Yamada, M.; Honda, C.; Yokota, Y.; Kouyama, T.; et al. The geomorphology, color, and thermal properties of Ryugu: Implications for parent-body processes. Science 2019, eaaw0422. [Google Scholar] [CrossRef]
- Bibring, J.P.; Langevin, Y.; Carter, J.; Eng, P.; Gondet, B.; Jorda, L.; Le Mouélic, S.; Mottola, S.; Pilorget, C.; Poulet, F.; et al. 67P/Churyumov-Gerasimenko surface properties as derived from CIVA panoramic images. Science 2015, 349, aab0671. [Google Scholar] [CrossRef]
- Stephan, T.; Jessberger, E.K.; Klöck, W.; Rulle, H.; Zehnpfenning, J. TOF-SIMS analysis of interplanetary dust. Earth Planet. Sci. Lett. 1994, 128, 453–467. [Google Scholar] [CrossRef]
- Leitner, J.; Stephan, T.; Kearsley, A.T.; Hörz, F.; Flynn, G.J.; Sandford, S.A. TOF-SIMS analysis of crater residues from Wild 2 cometary particles on Stardust aluminum foil. Meteor. Planet. Sci. 2008, 43, 161–185. [Google Scholar] [CrossRef]
- Stephan, T.; Flynn, G.J.; Sandford, S.A.; Zolensky, M.E. TOF-SIMS analysis of cometary particles extracted from Stardust aerogel. Meteor. Planet. Sci. 2008, 43, 285–298. [Google Scholar] [CrossRef]
- Stephan, T.; Rost, D.; Vicenzi, E.; Bullock, E.; Macpherson, G.J.; Westphal, A.; Snead, C.J.; Flynn, G.; Sandford, S.A.; Zolensky, M.E. TOF-SIMS analysis of cometary matter in Stardust aerogel tracks. Meteor. Planet. Sci. 2008, 43, 233–246. [Google Scholar] [CrossRef]
- Stephan, T.; Butterworth, A.; Hörz, F.; Snead, C.J.; Westphal, A. TOF-SIMS analysis of Allende projectiles shot into silica aerogel. Meteor. Planet. Sci. 2006, 41, 211–216. [Google Scholar] [CrossRef]
- Bland, P.A.; Stadermann, F.J.; Floss, C.; Rost, D.; Vicenzi, E.P.; Kearsley, A.T.; Benedix, G.K. A cornucopia of presolar and early solar system materials at the micrometer size range in primitive chondrite matrix. Meteor. Planet. Sci. 2007, 42, 1417–1427. [Google Scholar] [CrossRef]
- Henkel, T.; Stephan, T.; Jessberger, E.K.; Hoppe, P.; Strebel, R.; Amari, S.; Lewis, R.S. 3-D elemental and isotopic composition of presolar silicon carbides. Meteor. Planet. Sci. 2007, 42, 1121–1134. [Google Scholar] [CrossRef]
- Rost, D.; Stephan, T.; Greshake, A.; Fritz, J.; Weber, I.; Jessberger, E.; Stöffler, D. A combined ToF-SIMS and EMP/SEM study of a three-phase symplectite in the Los Angeles basaltic shergottite. Meteor. Planet. Sci. 2009, 44, 1225–1237. [Google Scholar] [CrossRef]
- Stephan, T.; Jessberger, E.K.; Heiss, C.H.; Rost, D. TOF-SIMS analysis of polycyclic aromatic hydrocarbons in Allan Hills 84001. Meteor. Planet. Sci. 2003, 38, 109–116. [Google Scholar] [CrossRef]
- Rost, D.; Henkel, T.; King, A.; Lyon, I. C60 ToF-SIMS: A tool for high-resolution mapping of elements and organic compounds. Geochimica et Cosmochimica Acta 2008, 72, A807. [Google Scholar]
- Simkus, D.; Goreva, Y.; McCoy, T.J.; Herd, C. ToF-SIMS Analysis of Prebiotic Organic Compounds in the Murchison Meteorite. In Proceedings of the 46th Lunar and Planetary Science Conference (2015), Woodlands, TX, USA, 16–20 March 2015; p. 2513. [Google Scholar]
- Bonal, L.; Brunetto, R.; Beck, P.; Dartois, E.; Dionnet, Z.; Djouadi, Z.; Duprat, J.; Füri, E.; Kakazu, Y.; Montagnac, G.; et al. Visible-IR and Raman microspectroscopic investigation of three Itokawa particles collected by Hayabusa: Mineralogy and degree of space weathering based on nondestructive analyses. Meteor. Planet. Sci. 2015, 50, 1562–1576. [Google Scholar] [CrossRef]
- Brunetto, R.; Borg, J.; Dartois, E.; Rietmeijer, F.J.M.; Grossemy, F.; Sandt, C.; Le Sergeant d’Hendecourt, L.; Rotundi, A.; Dumas, P.; Djouadi, Z.; et al. Mid-IR, Far-IR, Raman micro-spectroscopy, and FESEM–EDX study of IDP L2021C5: Clues to its origin. Icarus 2011, 212, 896–910. [Google Scholar] [CrossRef]
- Calligaro, T.; Coquinot, Y.; Pichon, L.; Moignard, B. Advances in elemental imaging of rocks using the AGLAE external microbeam. Nucl. Instrum. Methods Phys. Res. Sect. B Beam Interact. Mater. Atoms 2011, 269, 2364–2372. [Google Scholar] [CrossRef]
- GUPIX and GUPIXWIN. Available online: http://pixe.physics.uoguelph.ca/gupix/ (accessed on 24 March 2019).
- Maxwell, J.A.; Campbell, J.L.; Teesdale, W.J. The Guelph PIXE software package. Nucl. Instrum. Methods Phys. Res. Sect. B Beam Interact. Mater. Atoms 1989, 43, 218–230. [Google Scholar] [CrossRef]
- Noun, M.; Van Elslande, E.; Touboul, D.; Glanville, H.; Bucklow, S.; Walter, P.; Brunelle, A. High mass and spatial resolution mass spectrometry imaging of Nicolas Poussin painting cross section by cluster TOF-SIMS. J. Mass Spectrom. 2016, 51, 1196–1210. [Google Scholar] [CrossRef]
- Brunelle, A.; Touboul, D.; Laprévote, O. Biological tissue imaging with time-of-flight secondary ion mass spectrometry and cluster ion sources. J. Mass Spectrom. 2005, 40, 985–999. [Google Scholar] [CrossRef]
- Cramer, H.-G.; Jürgens, U.; Niehuis, E.; Terhorst, M.; Zhang, Z.; Benninghoven, A. Secondary Ion Mass Spectrometry, SIMS IX; Benninghoven, A., Nihei, Y., Shimizu, R., Werner, H.W., Eds.; Wiley: New York, NY, USA, 1994. [Google Scholar]
- Toyoda, N.; Matsuo, J.; Yamada, I. Surface modification with gas cluster ion beams from fundamental characteristics to applications. Nucl. Instrum. Methods Phys. Res. Sect. B Beam Interact. Mater. Atoms 2004, 216, 379–389. [Google Scholar] [CrossRef]
- Noun, M. Interaction agrégat-surface. Spectrométrie de masse par temps de vol et application analytique à des études sur des médicaments et sur la météorite Paris. Ph.D. Thesis, Université Paris Sud, Orsay, France, 2013. [Google Scholar]
- Cloutis, E.A.; Hudon, P.; Hiroi, T.; Gaffey, M.J.; Mann, P. Spectral reflectance properties of carbonaceous chondrites: 2. CM chondrites. Icarus 2011, 216, 309–346. [Google Scholar] [CrossRef]
- DeMeo, F.E.; Carry, B. The taxonomic distribution of asteroids from multi-filter all-sky photometric surveys. Icarus 2013, 226, 723–741. [Google Scholar] [CrossRef] [Green Version]
- Quirico, E.; Moroz, L.V.; Schmitt, B.; Arnold, G.; Faure, M.; Beck, P.; Bonal, L.; Ciarniello, M.; Capaccioni, F.; Filacchione, G.; et al. Refractory and semi-volatile organics at the surface of comet 67P/Churyumov-Gerasimenko: Insights from the VIRTIS/Rosetta imaging spectrometer. Icarus 2016, 272, 32–47. [Google Scholar] [CrossRef] [Green Version]
- Salisbury, J.W. Mid-infrared spectroscopy laboratory data: Chapter 4. In Remote Geochemical Analysis; Pieters, C.M., Englert, P.A.J., Eds.; Cambridge University Press: New York, NY, USA, 1993. [Google Scholar]
- Cambier, P. Infrared study of goethites of varying crystallinity and particle size: I. Interpretation of OH and lattice vibration frequencies. Clay Miner. 1986, 21, 191–200. [Google Scholar] [CrossRef]
- Ruan, H.D.; Frost, R.L.; Kloprogge, J.T.; Duong, L. Infrared spectroscopy of goethite dehydroxylation: III. FT-IR microscopy of in situ study of the thermal transformation of goethite to hematite. Spectrochim. Acta Part A Mol. Biomol. Spectrosc. 2002, 58, 967–981. [Google Scholar] [CrossRef]
- Bishop, J.; Lane, M.; Dyar, M.; Brown, A.J. Reflectance and Emission Spectroscopy Study of Four Groups of Phyllosilicates: Smectites, Kaolinite-Serpentines, Chlorites and Micas. Clay Miner. 2008, 43, 35–54. [Google Scholar] [CrossRef]
- Beck, P.; Quirico, E.; Montes-Hernandez, G.; Bonal, L.; Bollard, J.; Orthous-Daunay, F.R.; Howard, K.T.; Schmitt, B.; Brissaud, O.; Deschamps, F.; et al. Hydrous mineralogy of CM and CI chondrites from infrared spectroscopy and their relationship with low albedo asteroids. Geochimica et Cosmochimica Acta 2010, 74, 4881–4892. [Google Scholar] [CrossRef]
- Beck, P.; Garenne, A.; Quirico, E.; Bonal, L.; Montes-Hernandez, G.; Moynier, F.; Schmitt, B. Transmission infrared spectra (2–25 μm) of carbonaceous chondrites (CI, CM, CV–CK, CR, C2 ungrouped): Mineralogy, water, and asteroidal processes. Icarus 2014, 229, 263–277. [Google Scholar] [CrossRef]
- Bowey, J.E.; Morlok, A.; Köhler, M.; Grady, M. 2–16 μm spectroscopy of micron-sized enstatite (Mg,Fe)2Si2O6 silicates from primitive chondritic meteorites. Mon. Not. R. Astron. Soc. 2007, 376, 1367–1374. [Google Scholar] [CrossRef]
- Demyk, K.; D’hendecourt, L.; Leroux, H.; Jones, A.; Borg, J. IR spectroscopic study of olivine, enstatite and diopside irradiated with low energy H+ and He+ ions. Astron. Astrophys. 2004, 420, 233–243. [Google Scholar] [CrossRef]
- Morlok, A.; Koike, C.; Tomioka, N.; Mann, I.; Tomeoka, K. Mid-infrared spectra of the shocked Murchison CM chondrite: Comparison with astronomical observations of dust in debris disks. Icarus 2010, 207, 45–53. [Google Scholar] [CrossRef] [Green Version]
- RRUFF™ Project. Available online: http://rruff.info/ (accessed on 24 March 2019).
- Lafuente, B.; Downs, R.T.; Yang, H.; Stone, N. The power of databases: The RRUFF project. In Highlights in Mineralogical Crystallography; Armbruster, T., Danisi, R.M., Eds.; W. De Gruyter: Berlin, Germany, 2015. [Google Scholar]
- Quirico, E.; Orthous-Daunay, F.R.; Beck, P.; Bonal, L.; Brunetto, R.; Dartois, E.; Pino, T.; Montagnac, G.; Rouzaud, J.N.; Engrand, C.; et al. Origin of insoluble organic matter in type 1 and 2 chondrites: New clues, new questions. Geochimica et Cosmochimica Acta 2014, 136, 80–99. [Google Scholar] [CrossRef]
- Lodders, K.; Palme, H.; Gail, H.-P. 4.4 Abundances of the elements in the Solar System. In Landolt-Börnstein―Group VI Astronomy and Astrophysics 4B (Solar System); Springer: Berlin/Heidelberg, Germany, 2009; Volume 4B. [Google Scholar] [CrossRef]
- Wolf, D.; Palme, H. The solar system abundances of phosphorus and titanium and the nebular volatility of phosphorus. Meteor. Planet. Sci. 2001, 36, 559–571. [Google Scholar] [CrossRef]
- Lee, M.R.; Lindgren, P.; Sofe, M.R. Aragonite, breunnerite, calcite and dolomite in the CM carbonaceous chondrites: High fidelity recorders of progressive parent body aqueous alteration. Geochimica et Cosmochimica Acta 2014, 144, 126–156. [Google Scholar] [CrossRef] [Green Version]
- Smith, F.G.; Kidd, D.J. Hematite-Goethite relations in neutral and alkaline solutions under pressure. Am. Mineral. 1949, 34, 403. [Google Scholar]
- Pollack, J.B.; Wilson, R.N.; Goles, G.G. A re-examination of the stability of goethite on Mars. J. Geophys. Res. 1970, 75, 7491–7500. [Google Scholar] [CrossRef]
- Cudennec, Y.; Lecerf, A. The transformation of ferrihydrite into goethite or hematite, revisited. J. Solid State Chem. 2006, 179, 716–722. [Google Scholar] [CrossRef] [Green Version]
- Gialanella, S.; Girardi, F.; Ischia, G.; Lonardelli, I.; Mattarelli, M.; Montagna, M. On the goethite to hematite phase transformation. J. Therm. Anal. Calorim. 2010, 102, 867–873. [Google Scholar] [CrossRef]
- Floss, C.; Le Guillou, C.; Brearley, A. Coordinated NanoSIMS and FIB-TEM analyses of organic matter and associated matrix materials in CR3 chondrites. Geochimica et Cosmochimica Acta 2014, 139, 1–25. [Google Scholar] [CrossRef]
- Bardin, N.; Duprat, J.; Engrand, C.; Slodzian, G.; Baklouti, D.; Dartois, E.; Brunetto, R.; Delauche, L.; Wu, T.-D.; Guerquin-Kern, J.-L.; et al. D/H and 15N/14N isotopic ratios in organic matter of ultracarbonaceous antarctic micrometeorites. In Proceedings of the 78th Annual Meeting of the Meteoritical Society (2015), Berkeley, CA, USA, 27–31 July 2015; p. 5275. [Google Scholar]
- Lacy, J.H.; Baas, F.; Allamandola, L.J.; Persson, S.E.; McGregor, P.J.; Lonsdale, C.J.; Geballe, T.R.; van de Bult, C.E.P. 4.6 micron absorption features due to solid phase CO and cyano group molecules toward compact infrared sources. Astrophys. J. 1984, 276, 533–543. [Google Scholar] [CrossRef]
- Schutte, W.A.; Greenberg, J.M. Further evidence for the OCN- assignment to the XCN band in astrophysical ice analogs. Astron. Astrophys. 1996, 309, 633–647. [Google Scholar]
- Pilling, S.; Seperuelo Duarte, E.; da Silveira, E.F.; Balanzat, E.; Rothard, H.; Domaracka, A.; Boduch, P. Radiolysis of ammonia-containing ices by energetic, heavy, and highly charged ions inside dense astrophysical environments. Astron. Astrophys. 2010, 509, A87. [Google Scholar] [CrossRef]
- Poch, O.; Istiqomah, I.; Quirico, E.; Beck, P.; Schmitt, B.; Theulé, P.; Faure, A.; Hily-Blant, P.; Rousseau, B.; Potin, S.; et al. First detection of ammonium salts on a cometary nucleus, revealing a new reservoir of nitrogen. Sci. Adv. 2019. under review. [Google Scholar]
- Keil, R.G.; Mayer, L.M. 12.12—Mineral Matrices and Organic Matter. In Treatise on Geochemistry, 2nd ed.; Holland, H.D., Turekian, K.K., Eds.; Elsevier: Amsterdam, The Netherlands, 2014; pp. 337–359. [Google Scholar] [CrossRef]
- Ruf, A.; Kanawati, B.; Hertkorn, N.; Yin, Q.-Z.; Moritz, F.; Harir, M.; Lucio, M.; Michalke, B.; Wimpenny, J.; Shilobreeva, S.; et al. Previously unknown class of metalorganic compounds revealed in meteorites. Proc. Natl. Acad. Sci. USA 2017, 114, 2819–2824. [Google Scholar] [CrossRef] [Green Version]
- De Sanctis, M.C.; Ammannito, E.; McSween, H.Y.; Raponi, A.; Marchi, S.; Capaccioni, F.; Capria, M.T.; Carrozzo, F.G.; Ciarniello, M.; Fonte, S.; et al. Localized aliphatic organic material on the surface of Ceres. Science 2017, 355, 719. [Google Scholar] [CrossRef]
- SSHADE Database. Available online: www.sshade.eu (accessed on 24 March 2019).
- Schmitt, B.; Albert, D.; Bollard, P.; Bonal, L.; Gorbacheva, M.; Mercier, L. SSHADE in H2020: Development of an European Database Infrastructure in Solid Spectroscopy. In Proceedings of the European Planetary Science Congress 2015, Nantes, France, 27 September–2 October 2015; p. 628. [Google Scholar]
- Vernazza, P.; Fulvio, D.; Brunetto, R.; Emery, J.P.; Dukes, C.A.; Cipriani, F.; Witasse, O.; Schaible, M.J.; Zanda, B.; Strazzulla, G.; et al. Paucity of Tagish Lake-like parent bodies in the Asteroid Belt and among Jupiter Trojans. Icarus 2013, 225, 517–525. [Google Scholar] [CrossRef]
- Vernazza, P.; Marsset, M.; Beck, P.; Binzel, R.P.; Birlan, M.; Brunetto, R.; Demeo, F.E.; Djouadi, Z.; Dumas, C.; Merouane, S.; et al. Interplanetary dust particles as samples of icy asteroids. Astrophys. J. 2015, 806, 204. [Google Scholar] [CrossRef]
- Vernazza, P.; Marsset, M.; Beck, P.; Binzel, R.P.; Birlan, M.; Cloutis, E.A.; DeMeo, F.E.; Dumas, C.; Hiroi, T. Compositional Homogeneity of CM Parent Bodies. Astron. J. 2016, 152, 54. [Google Scholar] [CrossRef]
- Kitazato, K.; Milliken, R.E.; Iwata, T.; Abe, M.; Ohtake, M.; Matsuura, S.; Arai, T.; Nakauchi, Y.; Nakamura, T.; Matsuoka, M.; et al. The surface composition of asteroid 162173 Ryugu from Hayabusa2 near-infrared spectroscopy. Science 2019. [Google Scholar] [CrossRef]
- Hamilton, V.E.; Simon, A.A.; Christensen, P.R.; Reuter, D.C.; Clark, B.E.; Barucci, M.A.; Bowles, N.E.; Boynton, W.V.; Brucato, J.R.; Cloutis, E.A.; et al. Evidence for widespread hydrated minerals on asteroid (101955) Bennu. Nat. Astron. 2019. [Google Scholar] [CrossRef]
- Capaccioni, F.; Coradini, A.; Filacchione, G.; Erard, S.; Arnold, G.; Drossart, P.; De Sanctis, M.C.; Bockelee-Morvan, D.; Capria, M.T.; Tosi, F.; et al. The organic-rich surface of comet 67P/Churyumov-Gerasimenko as seen by VIRTIS/Rosetta. Science 2015, 347, aaa0628. [Google Scholar] [CrossRef] [Green Version]
- Pilorget, C.; Bibring, J.P. NIR reflectance hyperspectral microscopy for planetary science: Application to the MicrOmega instrument. Planet. Space Sci. 2013, 76, 42–52. [Google Scholar] [CrossRef]
- Bardyn, A.; Baklouti, D.; Cottin, H.; Fray, N.; Briois, C.; Paquette, J.; Stenzel, O.; Engrand, C.; Fischer, H.; Hornung, K.; et al. Carbon-rich dust in comet 67P/Churyumov-Gerasimenko measured by COSIMA/Rosetta. Mon. Not. R. Astron. Soc. 2017, 469, S712–S722. [Google Scholar] [CrossRef] [Green Version]
- Rivkin, A.S.; Emery, J.P. Detection of ice and organics on an asteroidal surface. Nature 2010, 464, 1322. [Google Scholar] [CrossRef]
- Swanson, L.W. Liquid metal ion sources: Mechanism and applications. Nucl. Instrum. Methods Phys. Res. 1983, 218, 347–353. [Google Scholar] [CrossRef]
- Yamada, I.; Takagi, T. Current status of ionized-cluster beam technique: A low energy ion beam deposition. Nucl. Instrum. Methods Phys. Res. Sect. B 1987, 21, 120–123. [Google Scholar] [CrossRef]
- Bejjani, A.; Noun, M.; Della-Negra, S.; Tannous, R.; Chalhoub, G.; Hamdan, M.; Nsouli, B. Topography Measurements Using High Mass Resolution Time of Flight Secondary Ion Mass Spectrometry: Application To Banknotes. Anal. Chem. 2019. under review. [Google Scholar]
- Luck, J.M.; Ben Othman, D.; Albarède, F.; Barrat, J.-A. Cu and Zn Isotopic Variations in Carbonaceous Chondrites and Iron Meteorites. In Proceedings of the 64th Annual Meteoritical Society Meeting (2001), Rome, Italy, 10–14 September 2001; p. 5123. [Google Scholar]


| Concentration (ppm) | LOD (ppm) | Fit Error (%) | Stat. Error (%) | |
|---|---|---|---|---|
| Na | 3450 | 139 | 3.18 | 2.82 |
| Mg | 12,9103 | 83 | 0.44 | 0.12 |
| Al | 10,395 | 59 | 1.12 | 0.49 |
| Si | 130,313 | 53 | 0.4 | 0.08 |
| P | 1070 | 59 | 3.72 | 3.27 |
| S | 43,764 | 13 | 0.54 | 0.13 |
| Cl | 878 | 29 | 2.98 | 2.55 |
| K | 572 | 9 | 1.3 | 0.97 |
| Ca | 41,109 | 11 | 0.24 | 0.03 |
| Ti | 619 | 12 | 0.64 | 1.39 |
| V | 85 | 8 | 3.4 | 4.49 |
| Cr | 3573 | 7 | 0.34 | 0.14 |
| Mn | 1935 | 35 | 0.75 | 0.85 |
| Fe | 236,305 | 11 | 0.17 | 0.01 |
| Ni | 13,424 | 6 | 0.26 | 0.07 |
| Cu | 201 | 12 | 3.27 | 6.43 |
| Zn | 198 | 3 | 1.41 | 1.11 |
| Positive Mode | Negative Mode | ||
|---|---|---|---|
| Detected m/z | Proposed Attribution * | Detected m/z | Proposed Attribution * |
| 43.892[0] | CHP+ (−1.3 ppm) | 40.019[3] | C2H2N− (0.4 ppm) |
| 60.011[9] | C2H5P+ (−6.7 ppm) | 43.019[5] | C2H3O− (13.4 ppm) |
| 68.989[4] | C3H2P+ (7.5 ppm) | 45.034[2] | C2H5O− (−8.8 ppm) |
| 73.016[2] | C2H3NO2+ (5.5 ppm) | 55.018[1] | C3H3O− (−15 ppm) |
| 73.054[5] | C2H7N3+ (−5.0 ppm) | 56.980[7] | C2HS− (5.2 ppm) |
| C4H9O+ (−18.2 ppm) | SiCHO− (9.2 ppm) | ||
| 74.023[9] | C2H4NO2+ (2.0 ppm) | 59.013[2] | C2H3O2− (−11 ppm) |
| 75.032[8] | C2H5NO2+ (8.1 ppm) | 67.017[5] | C2HN3− (−1.2 ppm) |
| 77.001[4] | C5HO+ (−10.8 ppm) | 69.989[0] | H3SOF− (−5.6 ppm) † |
| 83.046[7] | C3H5N3+ (−17.4 ppm) | C3H2S− (10.7 ppm) | |
| 89.043[6] | C4H9S+ (2.8 ppm) | 71.012[7] | C3H3O2− (−16.3 ppm) |
| 101.047[3] | C4H7NO2+ (2.1 ppm) | CH2F3− (18.1 ppm) | |
| 102.053[4] | C5H10S+ (13.9 ppm) | 71.050[8] | C2H5N3− (−16.5 ppm) |
| 106.085[3] | C4H12NO2+ (−9.2 ppm) | C4H7O− (8.4 ppm) | |
| 108.101[3] | C2H12N4O+ (6.5 ppm) | 74.989[7] | C2H3SO− (−10.4 ppm) |
| 112.009[3] | C4H4SN2+ (3 ppm) | C2O2F−(12 ppm) † | |
| SiC3H4N2O+ (5.1 ppm) | 76.029[0] | CH4N2O2− (15 ppm) | |
| 113.007[9] | C5H5SO+ (20.6 ppm) | 87.020[4] | C2H3N2O2− (4.2 ppm) |
| 120.986[1] | C5HSN2+ (5.3 ppm) | 90.040[2] | C3H8SN− (17.2 ppm) |
| 121.120[3] | C4H15N3O+ (−5.5 ppm) | SiC2H8NO− (20.1 ppm) | |
| 122.126[5] | C4H16N3O+ (18.9 ppm) | 91.018[3] | C4HN3− (−0.8 ppm) |
| 131.096[6] | C6H13NO2+ (18.9 ppm) | C6H3O− (−15.6 ppm) | |
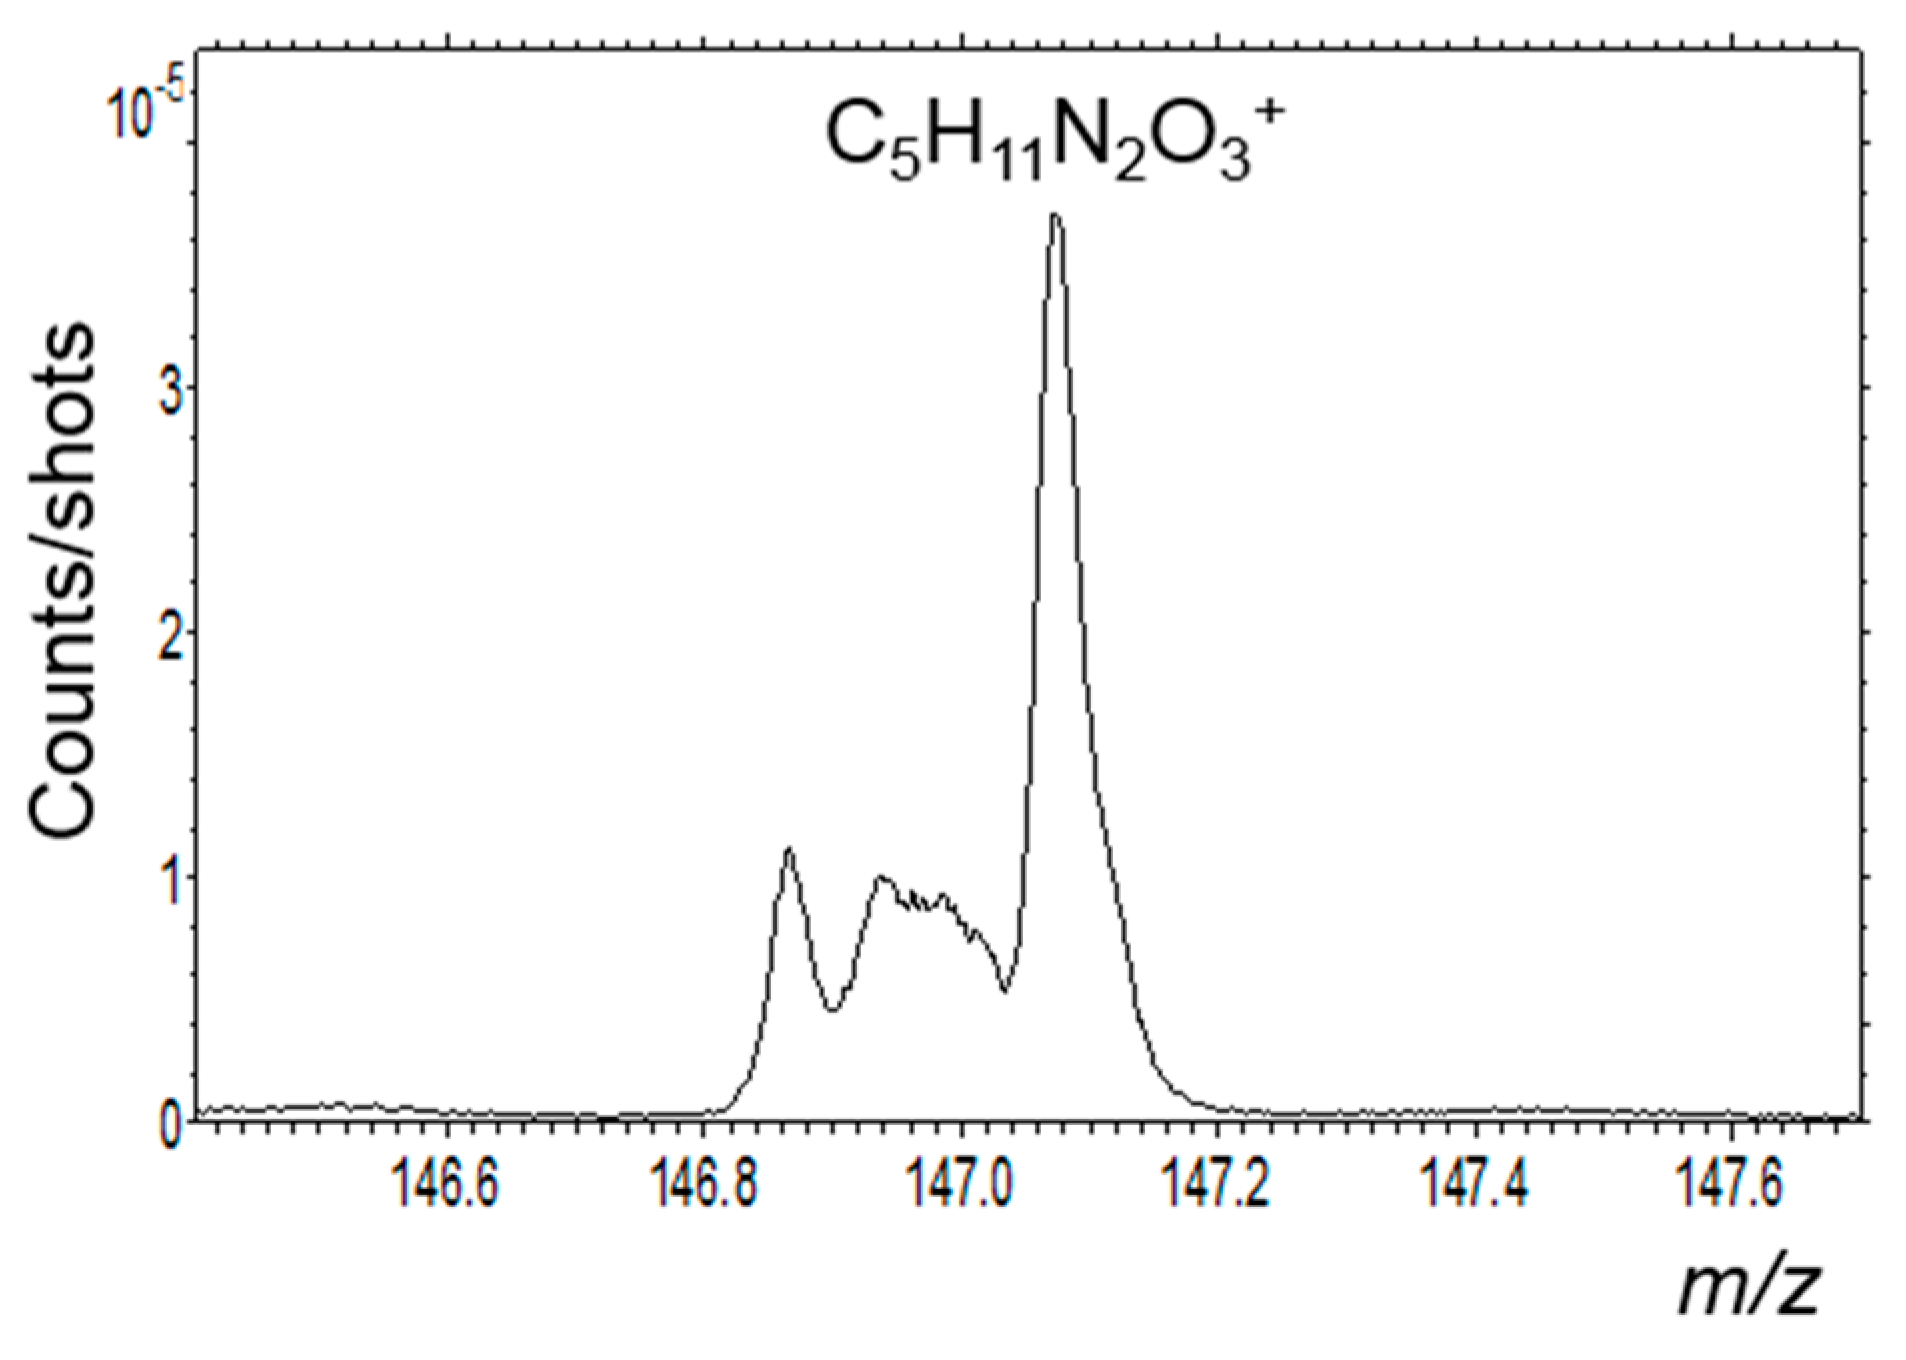
| 146.070[4] | C5H10N2O3+ (12.1 ppm) | 93.033[0] | C6H3O− (−2.2 ppm) |
| 165.055[8] | C9H9O3+ (7.1 ppm) | C6H5O− (−16.7 ppm) | |
| 173.044[0] | C7H9O5+ (−2.6 ppm) | 98.007[3] | C4H4SN− (3.3 ppm) |
| 177.055[5] | C10H9O3+ (5.1 ppm) | 104.024[0] | C5H2N3− (−7.9 ppm) |
| 245.078[8] | C14H13O4+ (−8.4 ppm) | C2H4N2O3− (12.5 ppm) | |
| 108.001[9] | CH4SN2O2− (18.5 ppm) | ||
| C6H4S− (−18.7 ppm) | |||
| 121.025[5] | C2H5N2O4− (0.4 ppm) | ||
| C5H3N3O− (−18.7 ppm) | |||
| 132.001[2] | C3H4SN2O2− (10.1 ppm) | ||
| C8H4S− (−20.4 ppm) | |||
| Ala | Phe | Asp | Ile | Asn | His | Leu | Lys | Met | Orn | Pro | Ser | Thr | Trp | Tyr | Val | |
|---|---|---|---|---|---|---|---|---|---|---|---|---|---|---|---|---|
| NH− | ✓ | ✓ | ✓ | ✓ | ✓ | ✓ | ✓ | ✓ | ✓ | ✓ | ✓ | ✓ | ✓ | ✓ | ✓ | |
| NH2− | ✓ | ✓ | ✓ | ✓ | ✓ | ✓ | ✓ | ✓ | ✓ | ✓ | ✓ | ✓ | ||||
| CN− | ✓ | ✓ | ✓ | ✓ | ✓ | ✓ | ✓ | |||||||||
| CH2N− | ✓ | ✓ | ✓ | ✓ | ✓ | ✓ | ||||||||||
| NO− | ✓ | ✓ | ✓ | ✓ | ✓ | |||||||||||
| S− | ✓ | |||||||||||||||
| HS− | ✓ | |||||||||||||||
| CHS− | ✓ | |||||||||||||||
| CH3S− | ✓ | |||||||||||||||
| C2N− | ✓ | ✓ | ✓ | ✓ | ||||||||||||
| C2HN− | ✓ | ✓ | ✓ | ✓ | ✓ | ✓ | ✓ | ✓ | ✓ | ✓ | ✓ | ✓ | ✓ | ✓ | ✓ | |
| C2H2N− | ✓ | |||||||||||||||
| C2O− | ✓ | ✓ | ✓ | ✓ | ✓ | ✓ | ✓ | ✓ | ✓ | ✓ | ✓ | ✓ | ✓ | |||
| C2HO− | ✓ | ✓ | ✓ | |||||||||||||
| CN2− | ✓ | |||||||||||||||
| C2H2N− | ✓ | ✓ | ✓ | ✓ | ✓ | ✓ | ✓ | ✓ | ✓ | ✓ | ✓ | ✓ | ✓ | ✓ | ||
| CNO− | ✓ | ✓ | ✓ | ✓ | ✓ | ✓ | ✓ | ✓ | ✓ | ✓ | ✓ | ✓ | ✓ | ✓ | ✓ | |
| CO2− | ✓ | ✓ | ✓ | ✓ | ✓ | ✓ | ✓ | ✓ | ✓ | ✓ | ✓ | ✓ | ✓ | |||
| CH2NO− | ✓ | ✓ | ||||||||||||||
| CHO2− | ✓ | ✓ | ✓ | ✓ | ✓ | ✓ | ✓ | ✓ | ✓ | ✓ | ✓ | ✓ | ✓ | ✓ | ✓ | ✓ |
| NO2− | ✓ | |||||||||||||||
| C4H− | ✓ | ✓ | ||||||||||||||
| C3N− | ✓ | ✓ | ||||||||||||||
| C2H2O2− | ✓ | ✓ | ||||||||||||||
| C2H3O2− | ✓ | ✓ | ||||||||||||||
| C2H4NO− | ✓ | ✓ | ||||||||||||||
| C3H4NO− | ✓ | ✓ | ||||||||||||||
| C3H3O2− | ✓ | ✓ | ✓ | ✓ | ✓ | ✓ | ✓ | ✓ | ✓ | ✓ | ✓ | ✓ | ✓ | ✓ | ||
| C2H2NO2− | ✓ | ✓ | ✓ | ✓ | ✓ | ✓ | ✓ | ✓ | ✓ | ✓ | ✓ | ✓ | ✓ | ✓ | ✓ | |
| C3H2NO2− | ✓ | |||||||||||||||
| C3H4NO2− | ✓ | ✓ | ✓ | |||||||||||||
| C3H6NO3− | ✓ | |||||||||||||||
| C3H7NO3− | ✓ | |||||||||||||||
| C4H5N2O2− | ✓ | |||||||||||||||
| C4H4NO3− | ✓ | |||||||||||||||
| C5H6NO2− | ✓ | |||||||||||||||
| C5H8NO2− | ✓ | |||||||||||||||
| C4H8NO3− | ✓ | |||||||||||||||
| C4H9NO3− | ✓ | |||||||||||||||
| C8H7O− | ✓ | |||||||||||||||
| C4H6NO4− | ✓ | |||||||||||||||
| C6H11N2O2− | ✓ |
| Ala | Phe | Asp | Ile | Asn | His | Leu | Lys | Met | Orn | Pro | Ser | Thr | Trp | Tyr | Val | |
|---|---|---|---|---|---|---|---|---|---|---|---|---|---|---|---|---|
| NH3+ | ✓ | ✓ | ✓ | ✓ | ✓ | ✓ | ✓ | ✓ | ✓ | ✓ | ✓ | ✓ | ✓ | ✓ | ✓ | |
| NH4+ | ✓ | ✓ | ✓ | ✓ | ✓ | ✓ | ✓ | ✓ | ✓ | ✓ | ✓ | ✓ | ✓ | ✓ | ✓ | |
| C2H3+ | ✓ | |||||||||||||||
| CH2N+ | ✓ | ✓ | ✓ | ✓ | ✓ | ✓ | ✓ | ✓ | ✓ | ✓ | ✓ | ✓ | ✓ | ✓ | ||
| CH3N+ | ✓ | ✓ | ✓ | |||||||||||||
| C2H5+ | ✓ | ✓ | ✓ | ✓ | ✓ | ✓ | ✓ | ✓ | ||||||||
| CH4N+ | ✓ | ✓ | ✓ | ✓ | ✓ | ✓ | ✓ | ✓ | ✓ | ✓ | ✓ | ✓ | ✓ | ✓ | ✓ | |
| CH5N+ | ✓ | |||||||||||||||
| CH3O+ | ✓ | |||||||||||||||
| S+ | ✓ | |||||||||||||||
| C3H3+ | ✓ | |||||||||||||||
| C2H2N+ | ✓ | ✓ | ✓ | |||||||||||||
| C2H3N+ | ✓ | ✓ | ✓ | ✓ | ||||||||||||
| C2H4N+ | ✓ | ✓ | ✓ | ✓ | ✓ | ✓ | ✓ | ✓ | ✓ | ✓ | ✓ | ✓ | ✓ | ✓ | ✓ | ✓ |
| C2H5N+ | ✓ | ✓ | ✓ | ✓ | ✓ | |||||||||||
| C2H6N+ | ✓ | ✓ | ✓ | ✓ | ✓ | ✓ | ✓ | ✓ | ✓ | ✓ | ✓ | ✓ | ✓ | ✓ | ✓ | |
| CH2NO+ | ✓ | ✓ | ✓ | |||||||||||||
| CH4NO+ | ✓ | ✓ | ✓ | |||||||||||||
| C2H5O+ | ✓ | |||||||||||||||
| CH3S+ | ✓ | |||||||||||||||
| C4H3+ | ✓ | |||||||||||||||
| C3H2N+ | ✓ | ✓ | ✓ | ✓ | ||||||||||||
| C4H5+ | ✓ | |||||||||||||||
| C3H4N+ | ✓ | ✓ | ✓ | ✓ | ✓ | ✓ | ✓ | ✓ | ✓ | ✓ | ||||||
| C3H6N+ | ✓ | ✓ | ✓ | ✓ | ✓ | ✓ | ✓ | ✓ | ✓ | ✓ | ✓ | ✓ | ✓ | |||
| C3H8N+ | ✓ | ✓ | ✓ | ✓ | ✓ | ✓ | ✓ | ✓ | ✓ | ✓ | ✓ | ✓ | ||||
| C2H5NO+ | ✓ | |||||||||||||||
| C2H5S+ | ✓ | |||||||||||||||
| C3HNO+ | ✓ | |||||||||||||||
| C3H2NO+ | ✓ | |||||||||||||||
| C4H6N+ | ✓ | ✓ | ||||||||||||||
| C3H5N2+ | ✓ | |||||||||||||||
| C3H4NO+ | ✓ | ✓ | ||||||||||||||
| C4H8N+ | ✓ | ✓ | ✓ | ✓ | ✓ | ✓ | ✓ | ✓ | ✓ | |||||||
| C3H6NO+ | ✓ | ✓ | ✓ | ✓ | ||||||||||||
| C4H10N+ | ✓ | ✓ | ✓ | ✓ | ||||||||||||
| C3H7NO+ | ✓ | ✓ | ✓ | ✓ | ||||||||||||
| C3H8NO+ | ✓ | |||||||||||||||
| C2H5NO2+ | ✓ | ✓ | ✓ | |||||||||||||
| C6H5+ | ✓ | |||||||||||||||
| C4H5N2+ | ✓ | |||||||||||||||
| C5H8N+ | ✓ | ✓ | ✓ | ✓ | ✓ | ✓ | ||||||||||
| C4H6NO+ | ✓ | ✓ | ||||||||||||||
| C5H10N+ | ✓ | ✓ | ||||||||||||||
| C5H12N+ | ✓ | ✓ | ✓ | ✓ | ✓ | ✓ | ✓ | ✓ | ✓ | ✓ | ||||||
| C3H7N2O+ | ✓ | |||||||||||||||
| C3H8NO2+ | ✓ | |||||||||||||||
| C7H7+ | ✓ | |||||||||||||||
| C5H5N2O+ | ✓ | |||||||||||||||
| C8H7N+ | ✓ | |||||||||||||||
| C8H10N+ | ✓ | |||||||||||||||
| C9H8N+ | ✓ | |||||||||||||||
| C8H10NO+ | ✓ | ✓ | ||||||||||||||
| C5H13N2O2+ | ✓ | |||||||||||||||
| C4H8NO4+ | ✓ | |||||||||||||||
| C6H10N3O2+ | ✓ | |||||||||||||||
| C9H12NO2+ | ✓ | |||||||||||||||
| C4H8N2O3K+ | ✓ | |||||||||||||||
| C4H7NO4K+ | ✓ |
© 2019 by the authors. Licensee MDPI, Basel, Switzerland. This article is an open access article distributed under the terms and conditions of the Creative Commons Attribution (CC BY) license (http://creativecommons.org/licenses/by/4.0/).
Share and Cite
Noun, M.; Baklouti, D.; Brunetto, R.; Borondics, F.; Calligaro, T.; Dionnet, Z.; Le Sergeant d’Hendecourt, L.; Nsouli, B.; Ribaud, I.; Roumie, M.; et al. A Mineralogical Context for the Organic Matter in the Paris Meteorite Determined by A Multi-Technique Analysis. Life 2019, 9, 44. https://doi.org/10.3390/life9020044
Noun M, Baklouti D, Brunetto R, Borondics F, Calligaro T, Dionnet Z, Le Sergeant d’Hendecourt L, Nsouli B, Ribaud I, Roumie M, et al. A Mineralogical Context for the Organic Matter in the Paris Meteorite Determined by A Multi-Technique Analysis. Life. 2019; 9(2):44. https://doi.org/10.3390/life9020044
Chicago/Turabian StyleNoun, Manale, Donia Baklouti, Rosario Brunetto, Ferenc Borondics, Thomas Calligaro, Zélia Dionnet, Louis Le Sergeant d’Hendecourt, Bilal Nsouli, Isabelle Ribaud, Mohamad Roumie, and et al. 2019. "A Mineralogical Context for the Organic Matter in the Paris Meteorite Determined by A Multi-Technique Analysis" Life 9, no. 2: 44. https://doi.org/10.3390/life9020044