Article

Effects of Vitamin A on Immune Responses and Vitamin A Metabolism in Broiler Chickens Challenged with Necrotic Enteritis

Engineering Research Center of Feed Protein Resources on Agricultural By-Products, Ministry of Education, Hubei Key Laboratory of Animal Nutrition and Feed Science, Wuhan Polytechnic University, Wuhan 430023, China
*
Author to whom correspondence should be addressed.
These authors contributed equally to this work.
Life 2023, 13(5), 1122; https://doi.org/10.3390/life13051122
Submission received: 27 February 2023 / Revised: 28 April 2023 / Accepted: 29 April 2023 / Published: 1 May 2023
(This article belongs to the Special Issue Trends and Outlooks in Poultry Nutrition)

Abstract

:

Simple Summary

Vitamin A is an anti-inflammatory vitamin and essential for the health of humans and animals. Necrotic enteritis is an enteric inflammatory disease in poultry caused by Clostridium perfringens infection. Due to the ban on using antibiotics in feed, necrotic enteritis has caused great economic losses in poultry production. Previous observations indicated that phospholipase C secreted by C. perfringens might interfere with the transformation of vitamin A into retinoic acid via the stimulation of prostaglandin E2 production, which impaired the modulation of vitamin A on immune responses. Therefore, the present study investigated the effects of dietary supplementation with a large dose of vitamin A on the immune responses and vitamin A metabolism in broilers suffering from necrotic enteritis and explored the underlying mechanisms. The results showed that vitamin A supplementation in chicken diets improved hepatic vitamin A deposition and modulated the expression of Th2 cell-related cytokines in the jejunum and spleen. In addition, dietary supplementation with vitamin A inhibited the expression of genes involved in the Janus kinase/signal transducer and activator of the transcription pathway and genes encoding retinoic acid receptors in the spleen of broilers. The present study indicated the modulatory effects of vitamin A supplementation in diets on the immune responses and vitamin A metabolism in necrotic enteritis-challenged broilers.

Abstract

Necrotic enteritis (NE) is an important enteric inflammatory disease of poultry, and the effects of vitamin A (VitA) on NE birds are largely unknown. The present study was conducted to investigate the effects of VitA on the immune responses and VitA metabolism of NE broilers as well as the underlying mechanisms. Using a 2 × 2 factorial arrangement, 336 1-day-old Ross 308 broiler chicks were randomly assigned to 4 groups with 7 replicates. Broilers in the control (Ctrl) group were fed a basal diet without extra VitA supplementation. Broilers in the VitA group were fed a basal diet supplemented with 12,000 IU/kg of VitA. Birds in NE and VitA + NE groups were fed corresponding diets and, in addition, co-infected with Eimeria spp. and Clostridium perfringens on days 14 to 20. Samples of the blood, jejunum, spleen and liver were obtained on day 28 for analysis, and meanwhile, lesion scores were also recorded. The results showed that NE challenge increased lesion score in the jejunum and decreased serum glucose, total glyceride, calcium, phosphorus and uric acid levels (p < 0.05). VitA supplementation reduced the levels of serum phosphorus, uric acid and alkaline phosphatase in NE-challenged birds and increased serum low-density lipoprotein content and the activity of aspartate aminotransferase and creatine kinase (p < 0.05). Compared with the Ctrl group, the VitA and NE groups had higher mRNA expression of interferon-γ in the jejunum (p < 0.05). NE challenge up-regulated mRNA expression of interleukin (IL)-13, transforming growth factor-β4, aldehyde dehydrogenase (RALDH)-2 and RALDH-3 in the jejunum, while VitA supplementation increased jejunal IL-13 mRNA expression and hepatic VitA content, but down-regulated splenic IL-13 mRNA expression (p < 0.05). The VitA + NE group had higher serum prostaglandin E2 levels and the Ctrl group had higher splenic RALDH-3 mRNA expression than that of the other three groups (p < 0.05). NE challenge up-regulated jejunal retinoic acid receptor (RAR)-β and retinoid X receptor (RXR)-α as well as splenic RAR-α and RAR-β mRNA expression (p < 0.05). VitA supplementation up-regulated jejunal RAR-β expression but down-regulated mRNA expression of RXR-α, RXR-γ, signal transducers and activators of transcription (STAT) 5 and STAT6 in the spleen (p < 0.05). Moreover, compared with the Ctrl group, the VitA and NE groups had down-regulated mRNA expression of jejunal and splenic Janus kinase (JAK) 1 (p < 0.05). In conclusion, NE challenge induced jejunal injury and expression of Th2 and Treg cell-related cytokines and enhanced RALDH and RAR/RXR mRNA expression, mainly in the jejunum of broilers. VitA supplementation did not alleviate jejunal injury or Th2 cell-related cytokine expression; however, it improved hepatic VitA deposition and inhibited the expression of RALDH-3, RXR and the JAK/STAT signaling pathway in the spleen of broilers. In short, the present study suggested the modulatory effects of vitamin A on the immune responses and vitamin A metabolism in broiler chickens challenged with necrotic enteritis.

1. Introduction

Vitamin A (VitA) is a micronutrient that is essential for maintaining vision, promoting growth and development, and protecting the integrity of intestinal mucosal epithelia. Furthermore, VitA is known as an anti-inflammation vitamin due to its critical role in enhancing immune function through the regulation of cellular and humoral immune processes [1]. VitA deficiency affects cytokine release and antibody production, reduces the production of natural killer cells, monocytes and macrophages, and impairs the maturation and proliferation of T- and B-lymphocytes [2]. It has been reported that broiler chickens fed VitA-deficient (400 IU/kg) diets developed a T helper (Th) 2 pro-inflammatory response, whereas chickens fed VitA-rich (15,000 IU/kg) diets exhibited a Th1 anti-inflammatory response [3].
The VitA is present as retinol, retinal and retinoic acid, among which retinoic acid shows the most biological activity. The conversion of retinol into retinal is a reversible step, catalyzed by the alcohol dehydrogenase (Adh) family. The aldehyde dehydrogenase (RALDH) family then catalyzes retinal to form retinoic acid, and this step is irreversible [4]. Retinoic acid is the ligand for the nuclear retinoic acid receptor (RAR), which acts as a ligand-activated transcription factor that heterodimerizes with retinoid X receptor (RXR) and regulates gene expression [5]. In mammals, retinoic acid supplementation increased RALDH-2 expression and promoted the balance between Th17 and regulatory T (Treg) cell populations in the gut-associated lymphoid tissue in the presence of infection and inflammation [6,7]. Meanwhile, it was evidenced that retinoic acid exerted anti-inflammatory effects by inhibiting Janus kinase (JAK)/signal transducers and activators of the transcription (STAT) signaling pathway in rats [8,9].
Necrotic enteritis (NE) in chickens is an enteric disease due to Clostridium perfringens that has caused significant economic losses worldwide [10]. C. perfringens challenge triggers inflammatory responses in the broiler intestine by inducing Th2 and Th17 cytokine secretion [11], disrupting Th17/Treg homeostasis [12] and activating the JAK/STAT signaling pathway in the intestine of broiler chickens [13]. Both VitA and retinoic acid play critical roles in maintaining Th17/Treg balance in the intestine of mammals [14,15]. Coccidiosis is an important susceptibility factor to NE because the infection is known to increase mucogenesis and release essential amino acids from damaged tissue, thus providing nutrients for C. perfringens [16]. Adequate VitA (8000 IU/kg) has been reported to improve resistance to enteric diseases such as coccidiosis in broiler chickens [17,18]. Therefore, VitA might prevent NE by modulating immune responses in broilers.
It has been shown that type I phospholipase C secreted by C. perfringens can stimulate prostaglandin E2 (PGE2) production in organ-cultured rabbit gastric mucosa [19]. Furthermore, PGE2 can inhibit RALDH expression in mouse and human dendritic cells, and thus influence the immunomodulatory effects of VitA [20]. Therefore, it was speculated that VitA metabolism in NE birds might be interfered with by PGE2 production. In short, the aim of the present study was to investigate the effects of VitA at deficient (0 IU/kg) and high (12000 IU/kg) levels on the immune responses and VitA metabolism in NE birds and further explore the involvement of the JAK/STAT and RAR/RXR signaling pathways.

2. Materials and Methods

2.1. Experimental Design and Bird Management

All animal procedures used in the present study were approved by the Institutional Animal Care and Use Committee of Wuhan Polytechnic University (Number: WPU201904001). A 2 × 2 factorial randomized complete block design was used, and 336 1-day-old broiler chicks (Ross 308) were randomly assigned to 4 groups, each with 7 replicates of 12 birds (6 males and 6 females). The birds in the control (Ctrl) group were fed a corn–soybean meal basal diet including 1.05 mg/kg of carotene without extra VitA supplementation. According to the observation that a high level of VitA (15,000 IU/kg) showed great anti-inflammatory effects [3], birds in the VitA group were fed a basal diet supplemented with 12,000 IU/kg of VitA. Birds in NE and VitA + NE groups were fed corresponding diets and infected with Eimeria spp. and C. perfringens. The basal diet was formulated to meet or exceed the nutritional requirements of the National Research Council (1994) with the vitamin premix excluding VitA. The composition and nutrient levels of the basal diet are presented in Table 1. Retinol acetate, containing 500,000 IU/g of VitA, was used as the VitA source. Both the customized vitamin premix and retinol acetate were supplied by Blooming® Biotechnology Co., Ltd. (Beijing, China). The analyzed dietary VitA levels were 11,970 IU/kg and 12,020 IU/kg in VitA and VitA + NE groups, respectively, which were determined using high-performance liquid chromatography (HPLC). The trial lasted for 28 days. Birds were raised in wire cages in an environmentally controlled room with 23 h light and were allowed ad libitum access to water and mashed diets throughout the trial.

2.2. Co-infection of Eimeria spp. and C. perfringens

A live attenuated trivalent coccidian vaccine (SCOCVAC®) used for white-feathered broilers, comprising 5 × 10⁴ oocysts of Eimeria maxima PMHY strain and Eimeria tenella PTMZ strain and 1 × 10⁵ oocysts of Eimeria acervulina PAHY strain, was obtained from Foshan Standard Bio-Tech Co., Ltd. (Foshan, China). Avian C. pefringens type A filed strain (CVCC2030) was obtained from China Veterinary Culture Collection Center (Beijing, China) and identified using tryptose–sulfite–cycloserine agar plates before use. The NE model was established as described by Wu et al. [21]. Briefly, at 14 days of age, birds in the challenged group were orally inoculated with a 20-fold dose of the coccidian vaccine. Unchallenged birds received an equal volume of sterile PBS. On days 18 to 20, each Eimeria spp.-inoculated bird was subsequently gavaged orally with 1 mL of actively growing culture of C. perfringens (3 × 10⁸ CFU/mL). Uninfected birds were given an equal volume of sterile medium.

2.3. Sample Collection

Previous observations reported that higher jejunal lesion scores occurred at 7 days post-challenge of Eimeria spp. and C. perfringens than at 3 days post-challenge, and no significant difference in jejunal lesion scores was found between 7 and 17 days post-challenge [22]. Samples in the current study were collected on day 28. Two birds per replicate (fourteen birds per group) were randomly selected and blood was collected aseptically via the wing vein. The blood was centrifuged at 3000× g, 4 °C for 10 min to prepare serum, which was stored at −20 °C for the assay of biochemical and immune parameters as well as PGE2. Then, birds were euthanized by cervical dislocation. Approximately 1 cm of the mid-jejunum was sampled and immediately fixed in 4% paraformaldehyde for immunohistochemical analysis. The jejunum was longitudinally opened for NE lesion score. Jejunal mucosa and the spleen were sampled and stored at −80 °C for total RNA isolation. The liver was collected for the assay of VitA content.

2.4. Jejunal NE Lesion Score

The jejunal NE lesion score was performed on a scale from zero to six as described by Shojadoost et al. [10]. Briefly, 0 = no gross lesions; 1 = thin or friable walls, or diffuse superficial but removable fibrin; 2 = focal necrosis or ulceration with 1–5 foci, or non-removable fibrin deposit; 3 = focal necrosis or ulceration with 6–15 foci, or non-removable fibrin deposit; 4 = focal necrosis or ulceration with more than 16 foci, or non-removable fibrin deposit; 5 = variable patches of necrosis 2 to 3 cm long; 6 = diffuse and extensive necrosis typical of field cases. Two independent observers blinded to the experimental design performed the lesion scoring.

2.5. Determination of Serum Biochemical Indices

Serum biochemical indices were measured using a Hitachi 7100 Automatic Biochemical Analyzer (Hitachi Instruments, Co., Ltd., Tokyo, Japan). The commercial kits obtained from Wako Pure Chemical Industries, Ltd. (Tokyo, Japan) were used for the assay of serum total protein, albumin, globulin, total bilirubin, glucose, total glyceride, total cholesterol, high-density lipoprotein, low-density lipoprotein, calcium, phosphorus, uric acid, aspartate aminotransferase, alanine aminotransferase, alkaline phosphatase, glutamyl transpeptidase and creatine kinase.

2.6. Serum Immunoglobulin (Ig) A and IgG Assay

Serum IgA and IgG measurements were conducted using commercially available ELISA kits (Bethyl Laboratories, Inc., Montgomery, TX, USA) according to the manufacturer’s protocol as Song et al. [12] described. The serum samples were appropriately diluted and added to anti-chicken IgA or IgG antibody pre-coated 96-well strip plates. After one hour of incubation at room temperature, the unbound proteins and molecules were washed off, and a biotinylated detection antibody was added to the wells for the binding of captured IgA or IgG. After incubation and washing, a streptavidin-conjugated horseradish peroxidase (HRP) was added. The plates were incubated for 30 min at room temperature and washed four times. Then, the TMB substrate solution was added to each well to develop a colorimetric reaction, which was stopped with the addition of dilute sulfuric acid. The absorbance of the yellow product at 450 nm is proportional to the amount of IgA or IgG analyte present in the samples and a four-parameter standard curve can be generated. The assay ranges for IgA and IgG measurements were 0.69–500 ng/mL and 1.37–1000 ng/mL, respectively.

2.7. Immunohistochemical Analysis

The density of CD3+ intraepithelial T cells in the jejunal villus and crypt was analyzed with an indirect immunohistochemical method using a commercial kit obtained from Boster Biological Technology Co., Ltd., Wuhan, China [23]. After fixing, sectioning and blocking, the jejunal samples were incubated overnight at 4 °C with rat-anti human CD3 antibody (1:100 dilution), which cross-reacts with chicken CD3 complex. Then, the jejunal sections were incubated with a secondary antibody conjugated with HRP and the CD3+ T cells were visualized using chromogenic dye. Finally, the CD3+ T cells were quantified using a light microscope (Olympus, Tokyo, Japan), which was equipped with a digital camera (Olympus, Tokyo, Japan) and an image analysis program (ProRes CapturePro software, Jenoptik, Jena, Germany). Data were presented as the number of CD3+ T cells per 1000 μm2 of villus or crypt regions.

2.8. Measurement of VitA Content in Liver

The concentration of VitA in the liver was analyzed according to the procedure described by Idi et al. [24] with modifications. Approximately 3 g of the liver samples were homogenized on an ice bath with 6 mL of 96% ethanol (v/v). The homogenate was further saponified with methanol, 20% ascorbic acid (w/v) and potassium hydroxide solution (1:1, w/v). Finally, retinol was extracted with petroleum ether and diethyl ether (1:1, v/v), and the extract was subsequently injected into the HPLC system.
The Waters Breeze HPLC system (Waters Corporation, Milford, MA, USA), which comprises 1525 binary HPLC pumps, a 2487 Dual-λ absorbance detector, a 717 plus autosampler, Breeze system software and a chromatographic column (Waters XBridge C18, 3.5 μm, 4.6 mm × 250 mm), was used. Identification and quantification of retinol were obtained using a comparison of retention time as well as peak areas with external standards. The mobile phase consisted of water and methanol with a flow rate of 0.8 mL/min. An ultraviolet detector was performed with a wavelength of 325 nm. The content of VitA was expressed as milligrams of retinol per 100 g of wet tissue.

2.9. Serum PGE2 Assay

The serum PGE2 level was measured using a commercial ELISA kit obtained from R&D Systems, Inc. (Minneapolis, MN, USA). The assay was conducted according to the instructions of the manufacturer. Briefly, in the first incubation at room temperature for 2 h, PGE2 in serum bound to the antibody coated in a 96-well plate. During the second incubation at room temperature for 30 min, HRP-labeled PGE2 bound to the remaining antibody sites. After washing to remove the unbound HRP-labeled PGE2, a substrate solution was added to each well for the determination of bound HRP activity. The color development was stopped, and the absorbance was read at 450 nm. The intensity of color was inversely proportional to the concentration of PGE2 in serum.

2.10. RNA Isolation and Quantitative Real-Time PCR

Total RNA was isolated from the jejunum, spleen and liver samples using Trizol reagent (Invitrogen Life Technologies, Carlsbad, CA, USA) as previously described [23]. The concentration and purity of total RNA were checked using a NanoDrop® ND-2000 UV-VIS spectrophotometer (Thermo Scientific, Wilmington, DE, USA). The RNA integrity was verified using agarose gel electrophoresis. One microgram of total RNA was reverse transcribed using the PrimeScript® RT reagent Kit with gDNA Eraser (Takara Biotechnology (Dalian) Co., Ltd., Dalian, China). The quantitative real-time PCR was conducted with a 7500-fluorescence detection system (Applied Biosystems, Foster City, CA, USA) using the SYBR Premix Ex TaqTM kit (Takara Biotechnology (Dalian) Co., Ltd.). The primer pairs for the amplification of cytokine genes (INF-γ, IL-13, IL-17 and TGF-β4), retinoic acid synthesis-associated genes (Adh-1, RALDH-2 and RALDH-3), key genes in the JAK/STAT signaling pathway (JAK1, JAK2, STAT1, STAT5 and STAT6) and retinoic acid receptor genes (RAR-α, RAR-β, RAR-γ, RXR-α and RXR-γ) in the jejunum and spleen are presented in Table 2. The β-actin served as a housekeeping gene. The PCR conditions were an initial denaturation step at 95 °C for 30 s then 40 cycles at 95 °C for 5 s, and the annealing and extension temperatures ranged between 58 and 62 °C for 34 s (Table 2). Each biological sample was run in triplicate. Gene expression was quantified using the comparative threshold cycle method, and the data were expressed as relative values to the Ctrl group [25].

2.11. Statistical Analysis

The data were analyzed with a two-factorial ANOVA using a univariate general linear model with SPSS version 21.0 (SPSS Inc., Chicago, IL, USA). Differences among individual treatment means were tested using Duncan’s multiple comparison when significant interactions between VitA supplementation and NE challenge were observed. Pearson correlation analysis of significant data from the serum, jejunal and hepatic samples was conducted and shown in a heat map. Results are presented as the mean ± SEM. p < 0.05 was considered significant.

3. Results

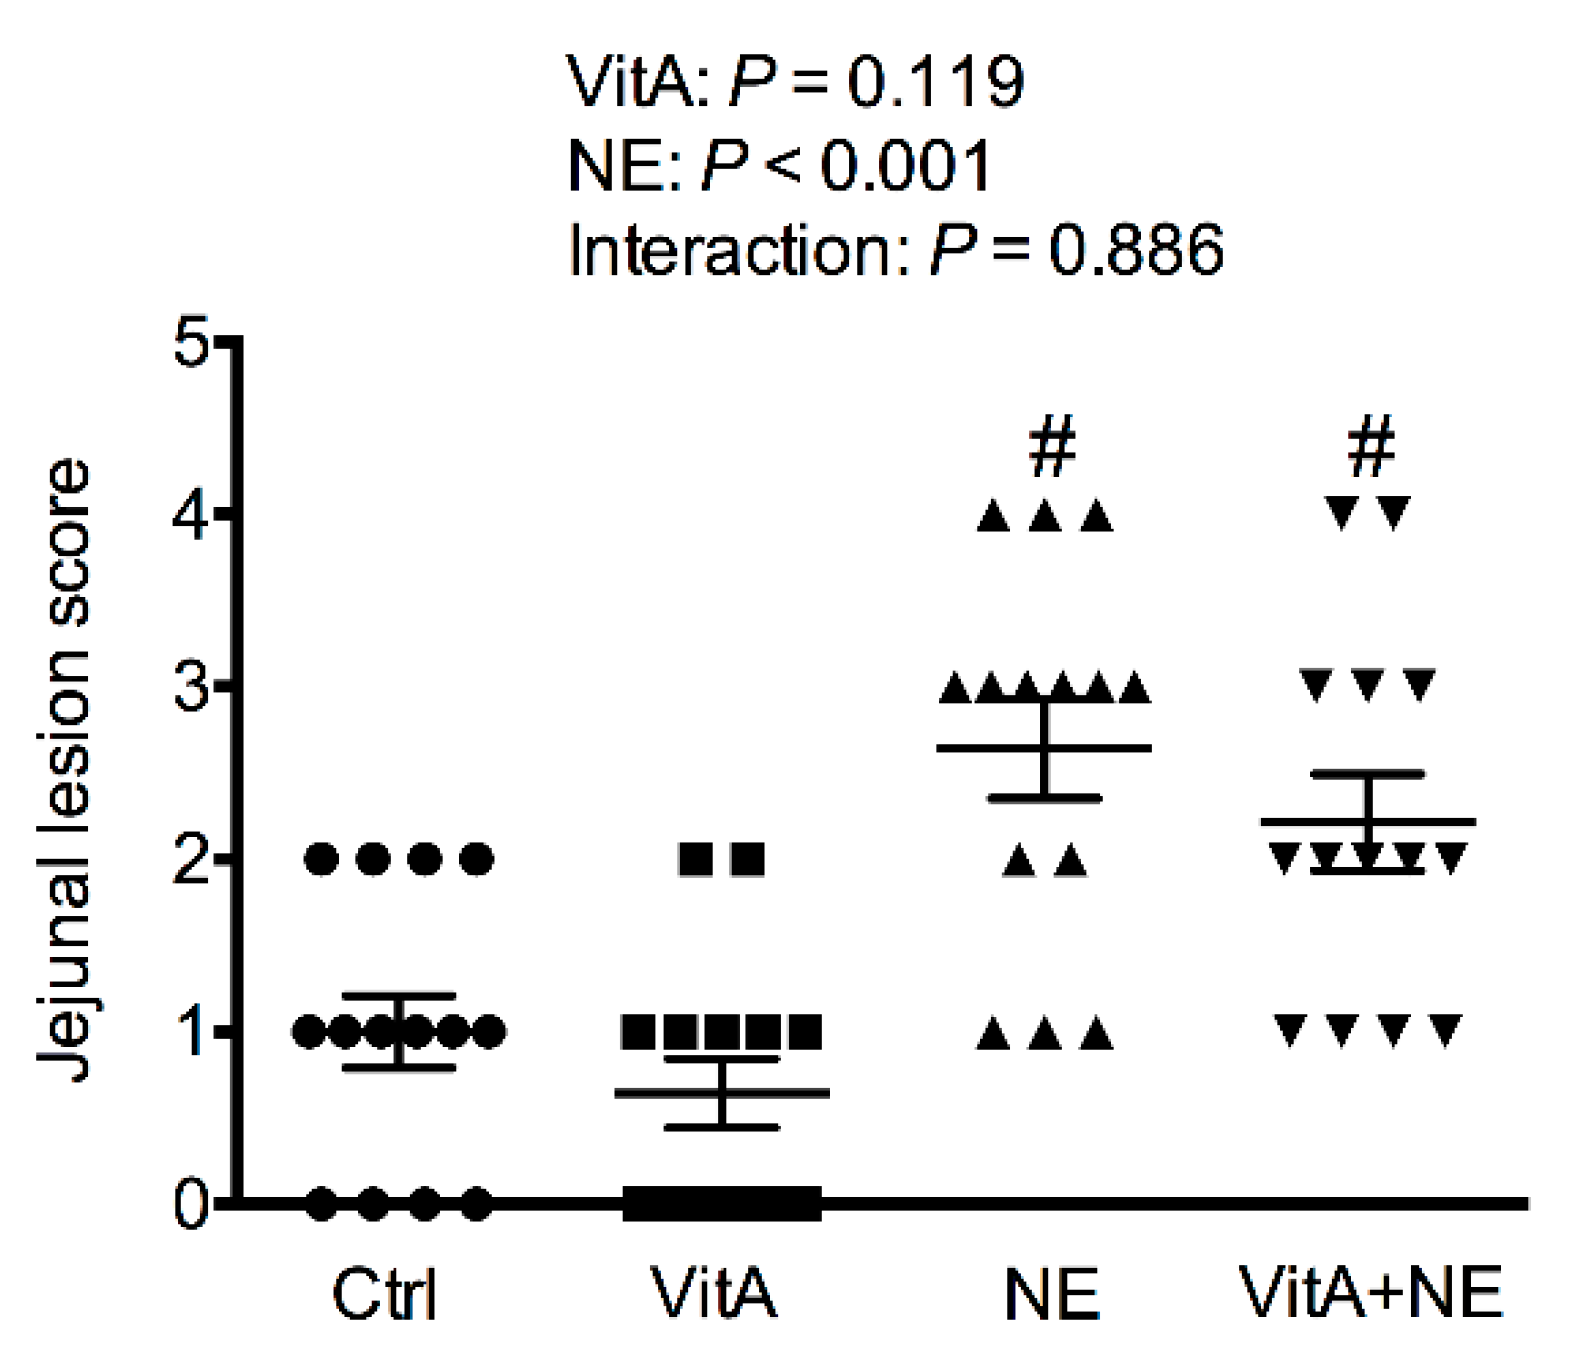
3.1. Jejunal NE Lesion Score

As shown in Figure 1, co-infection with Eimeria spp. and C. perfringens significantly increased the jejunal NE lesion score both in the NE and VitA + NE groups compared to the non-infected groups (p < 0.05). In addition, dietary supplementation with VitA did not affect the jejunal lesion score.

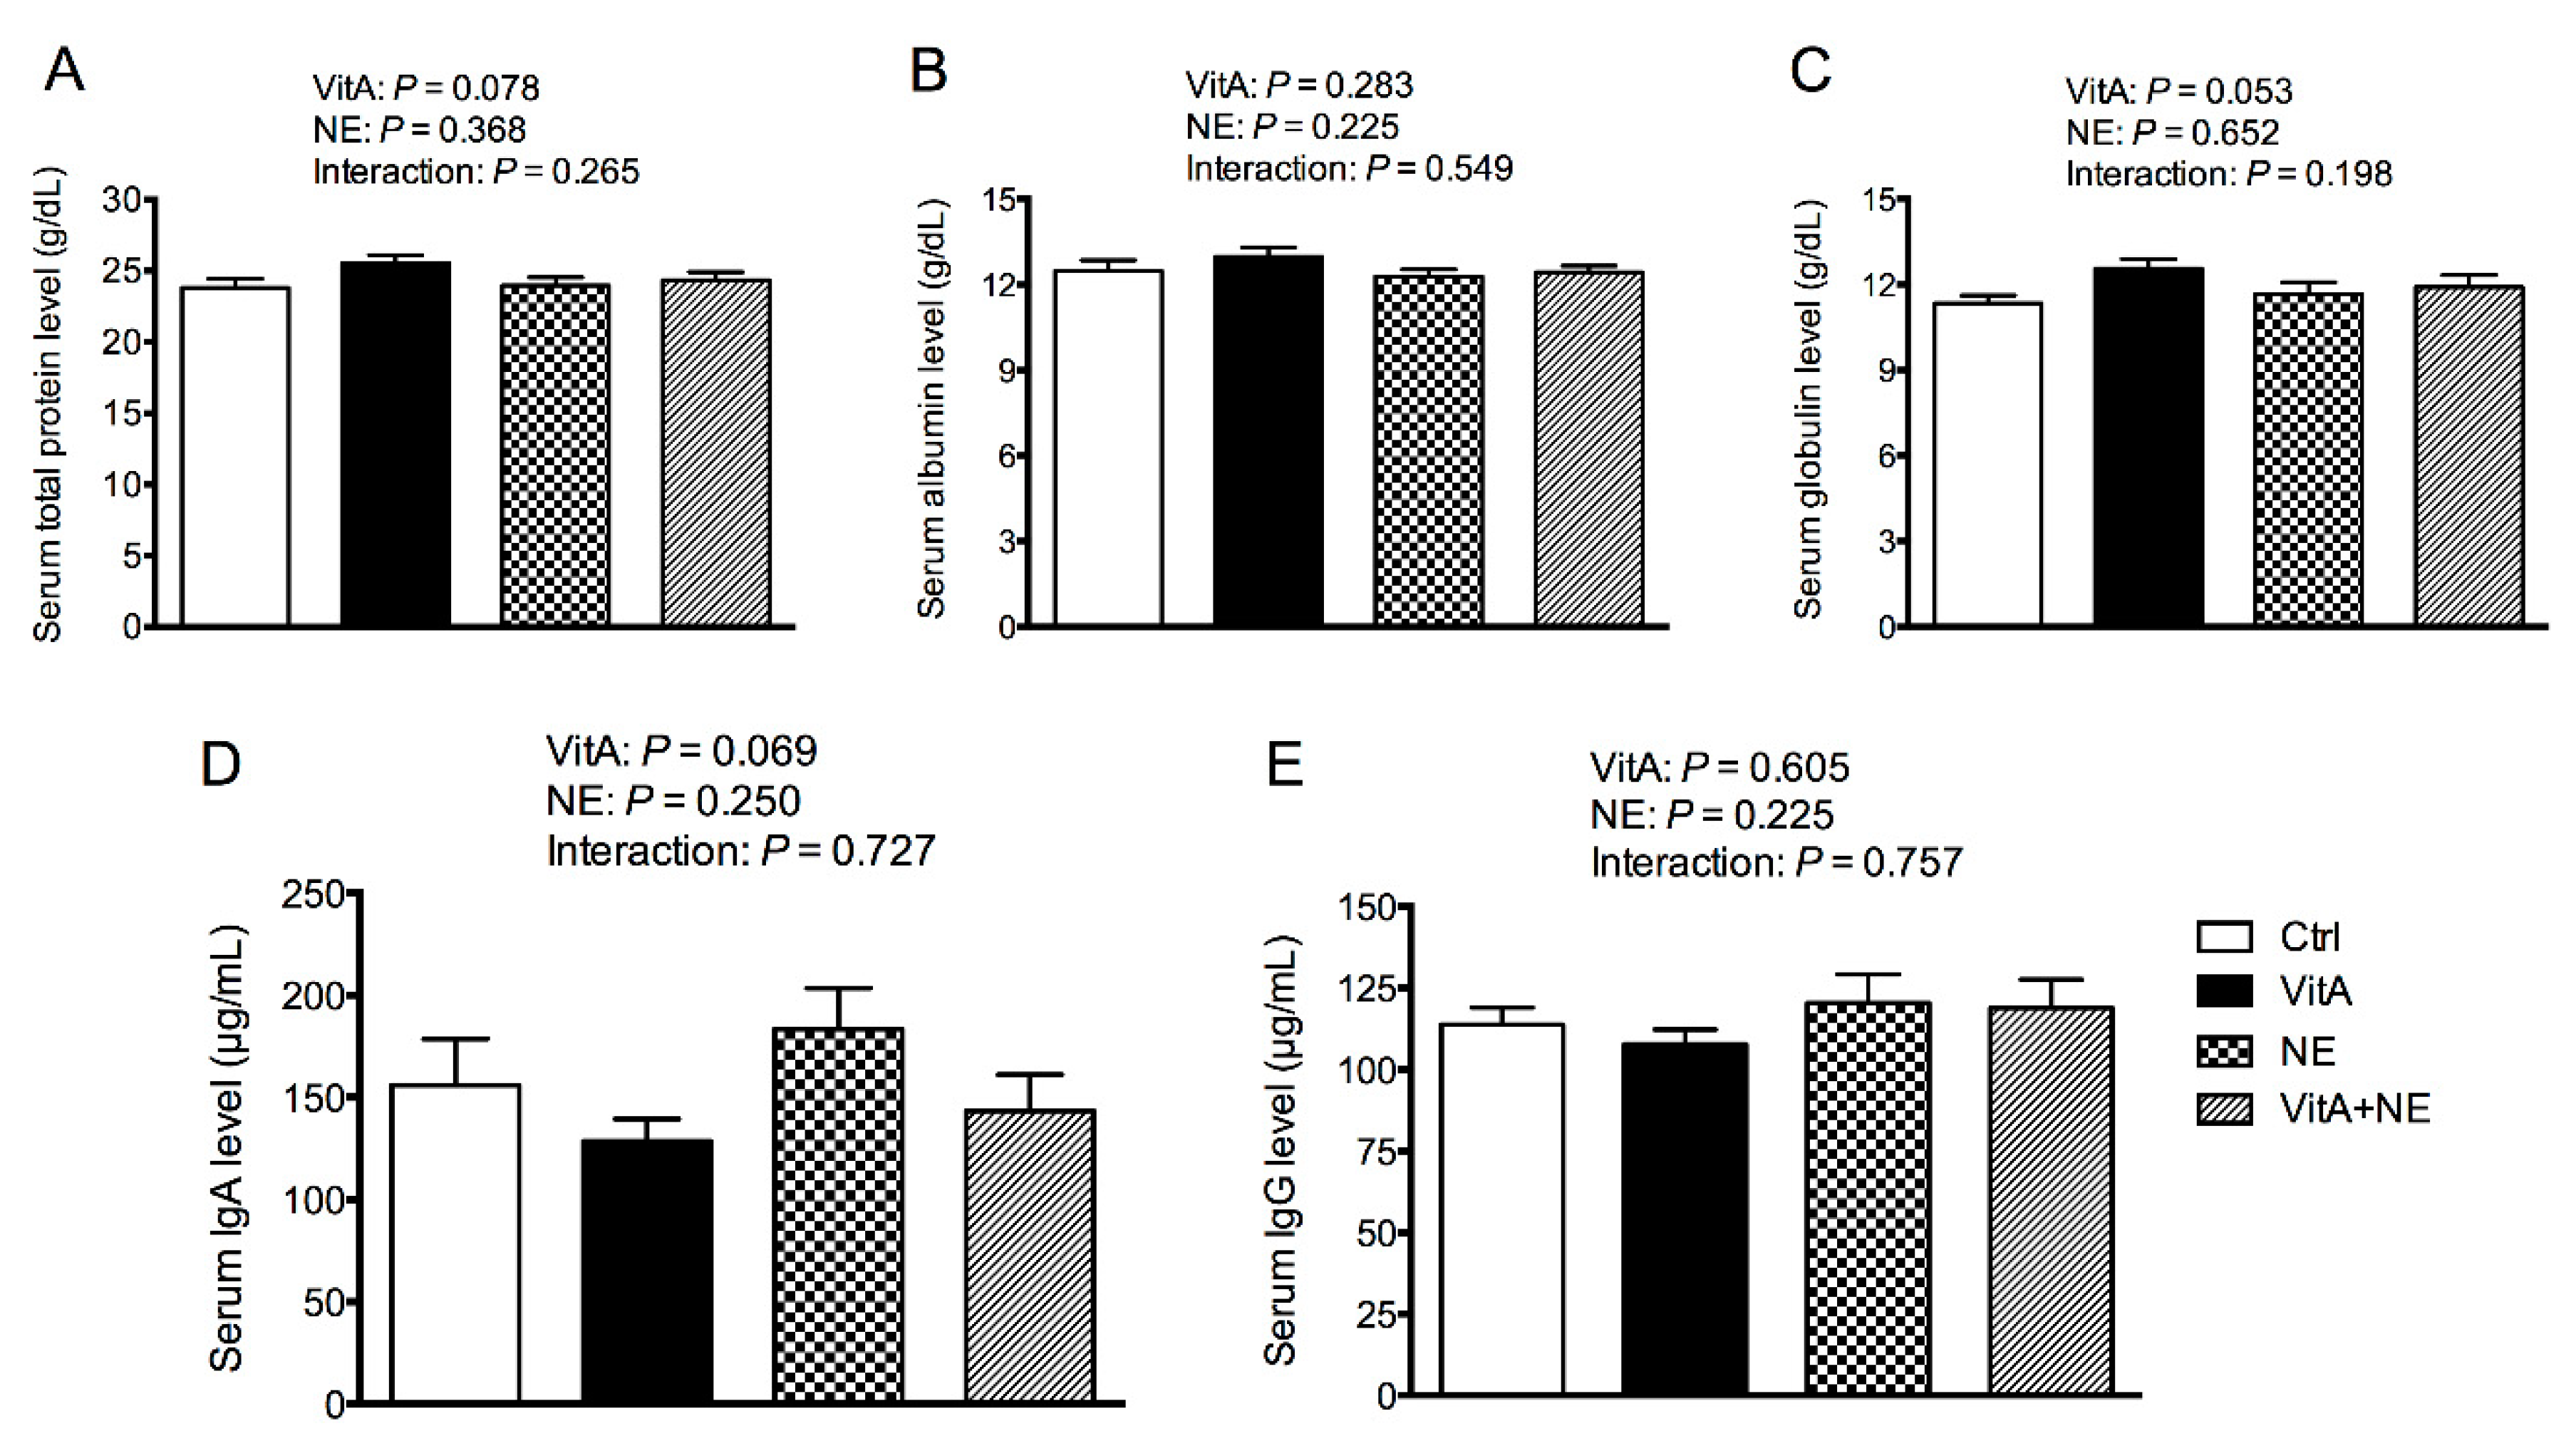
3.2. Serum Biochemical Indices

As presented in Table 3, dietary supplementation with VitA significantly increased serum low-density lipoprotein levels and the activity of aspartate aminotransferase and creatine kinase, and it also reduced serum phosphorus and uric acid contents (p < 0.05). NE challenge significantly decreased the levels of serum glucose, total glycerides, calcium, phosphorus and uric acid (p < 0.05). An interaction was found in serum alkaline phosphatase activity between VitA supplementation and NE challenge (p < 0.05). VitA supplementation decreased serum alkaline phosphatase activity in NE-challenged broilers (p < 0.05), while it had no effect on the unchallenged birds (p > 0.05).

3.3. Serum Immune Parameters

As shown in Figure 2, serum total protein, albumin, globulin, IgA and IgG contents were not significantly affected by VitA supplementation or NE challenge (p > 0.05). In addition, VitA supplementation tended to increase serum total protein (p = 0.078) and globulin (p = 0.053) levels.

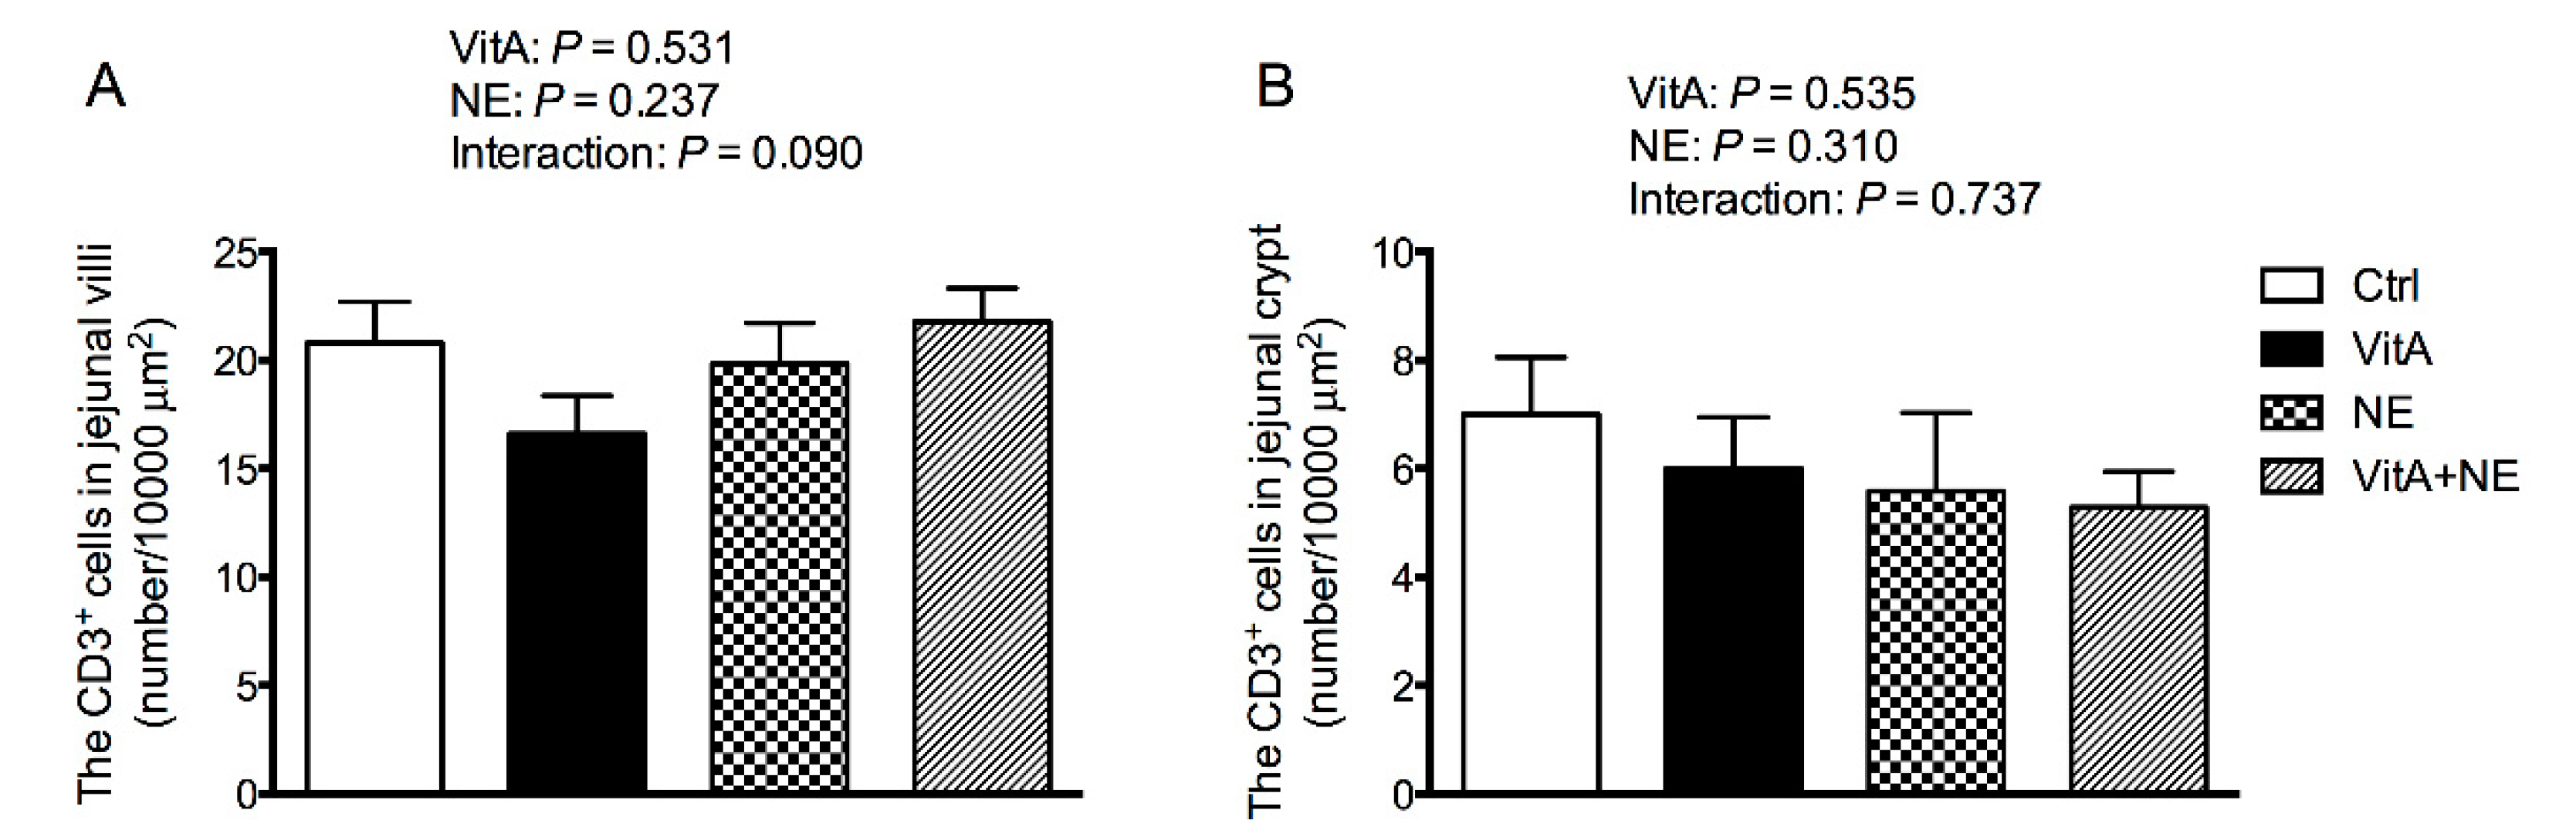
3.4. Jejunal CD3+ T Cell Density

The CD3+ T cell density in the jejunal villi and crypts among groups was not significantly affected either by VitA supplementation or NE challenge, as show in Figure 3 (p > 0.05).

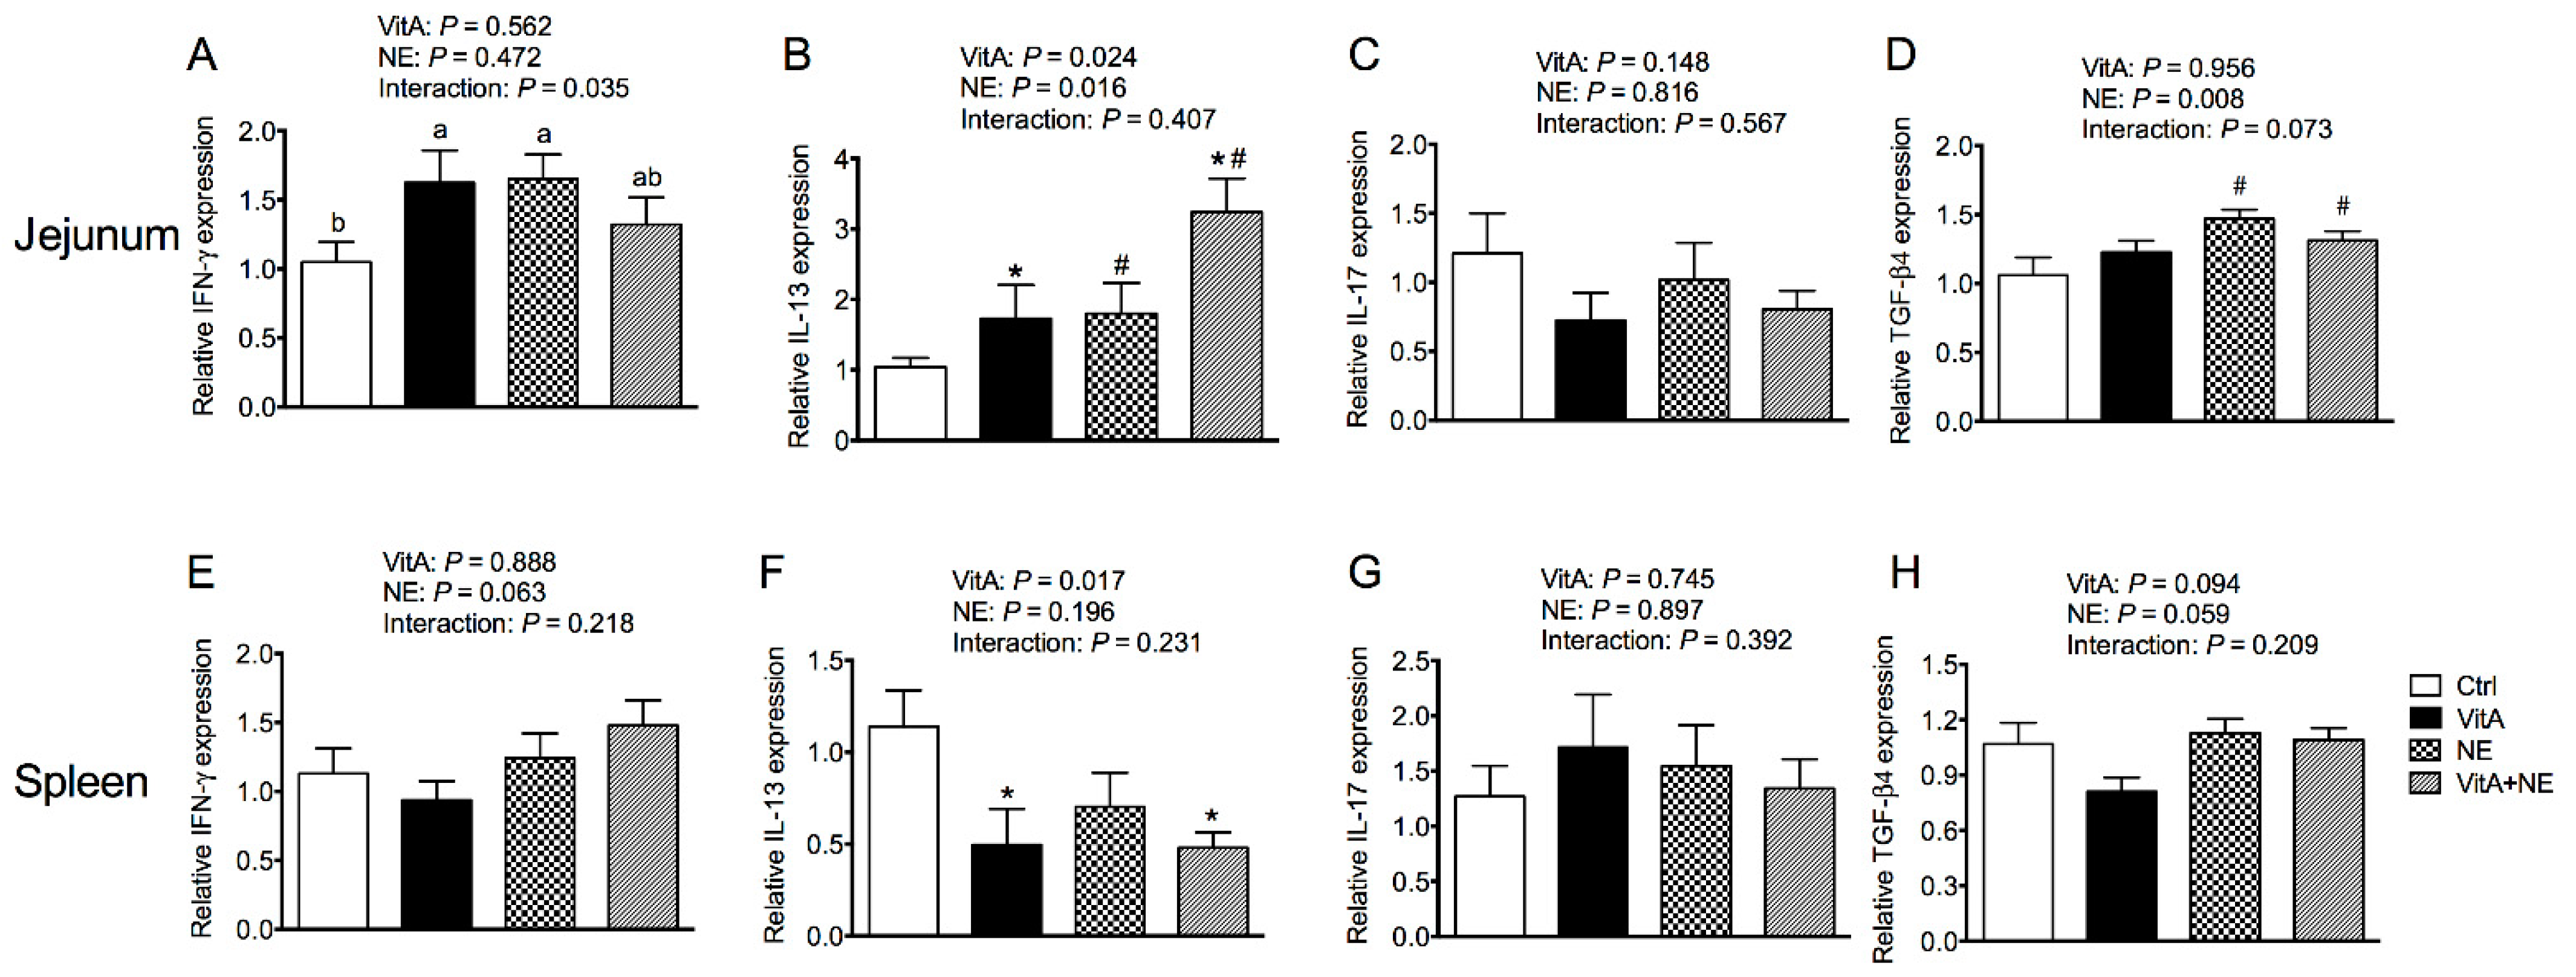
3.5. Immune Gene Expression in the Jejunum and Spleen

VitA supplementation increased the relative mRNA expression of IL-13 in the jejunum (p < 0.05) (Figure 4B). NE challenge increased both the relative mRNA expression of IL-13 and TGF-β4 in the jejunum (p < 0.05) (Figure 4B,D). In addition, an interaction was found in the relative mRNA expression of IFN-γ in the jejunum among groups (p < 0.05). VitA supplementation increased jejunal IFN-γ mRNA expression in unchallenged birds (p < 0.05) but did not significantly affect it in NE-challenged birds (p > 0.05) (Figure 4A). Regarding the spleen, the VitA-supplemented diet down-regulated the mRNA expression of IL-13 (p < 0.05) (Figure 4F). NE challenge tended to increase the mRNA expression of IL-13 (p = 0.063) and TGF-β4 (p = 0.059) (Figure 4E,H). Moreover, Jejunal IL-17 as well as splenic IFN-γ, IL-17 and TGF-β4 expression was not significantly influenced by the treatments (p > 0.05) (Figure 4C,E,G,H).

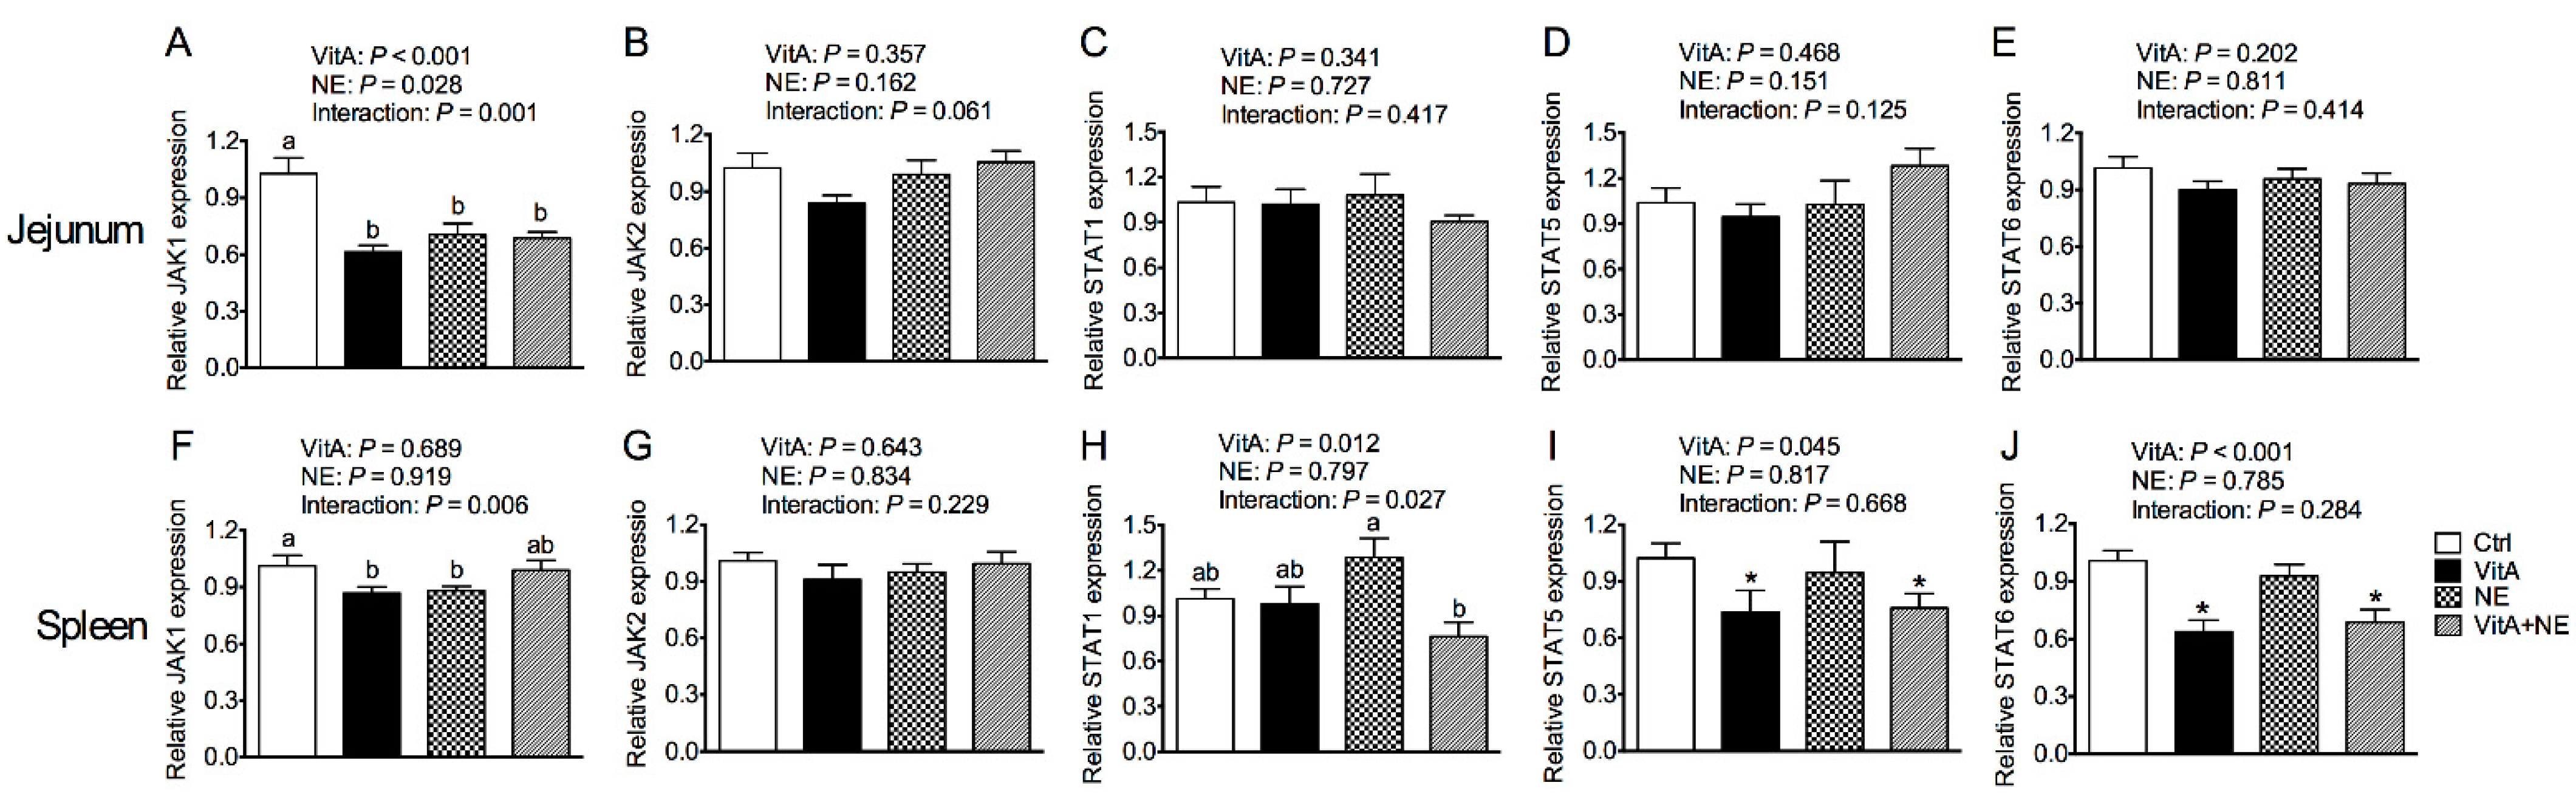
3.6. Gene Expression of the JAK-STAT Signaling Pathway Components in the Jejunum and Spleen

VitA supplementation and NE challenge showed interactive effects on the mRNA expression of JAK1 in the jejunum (p < 0.05) (Figure 5A). VitA supplementation down-regulated jejunal JAK1 mRNA expression in unchallenged birds (p < 0.05) and did not significantly affect it in challenged birds (p > 0.05). The gene expression of JAK2 and STATs in the jejunum was not significantly affected by the treatments (p > 0.05) (Figure 5B–E). VitA supplementation and NE challenge had interactive effects on JAK1 and STAT1 mRNA expression in the spleen (p < 0.05) (Figure 5F,H). VitA supplementation down-regulated splenic JAK1 and STAT1 mRNA expression in unchallenged and challenged birds, respectively (p < 0.05). Moreover, VitA supplementation down-regulated STAT5 and STAT6 mRNA expression in the spleen (p < 0.05) (Figure 5I,J). The gene expression of splenic JAK2 was not significantly influenced (p > 0.05) (Figure 5G).

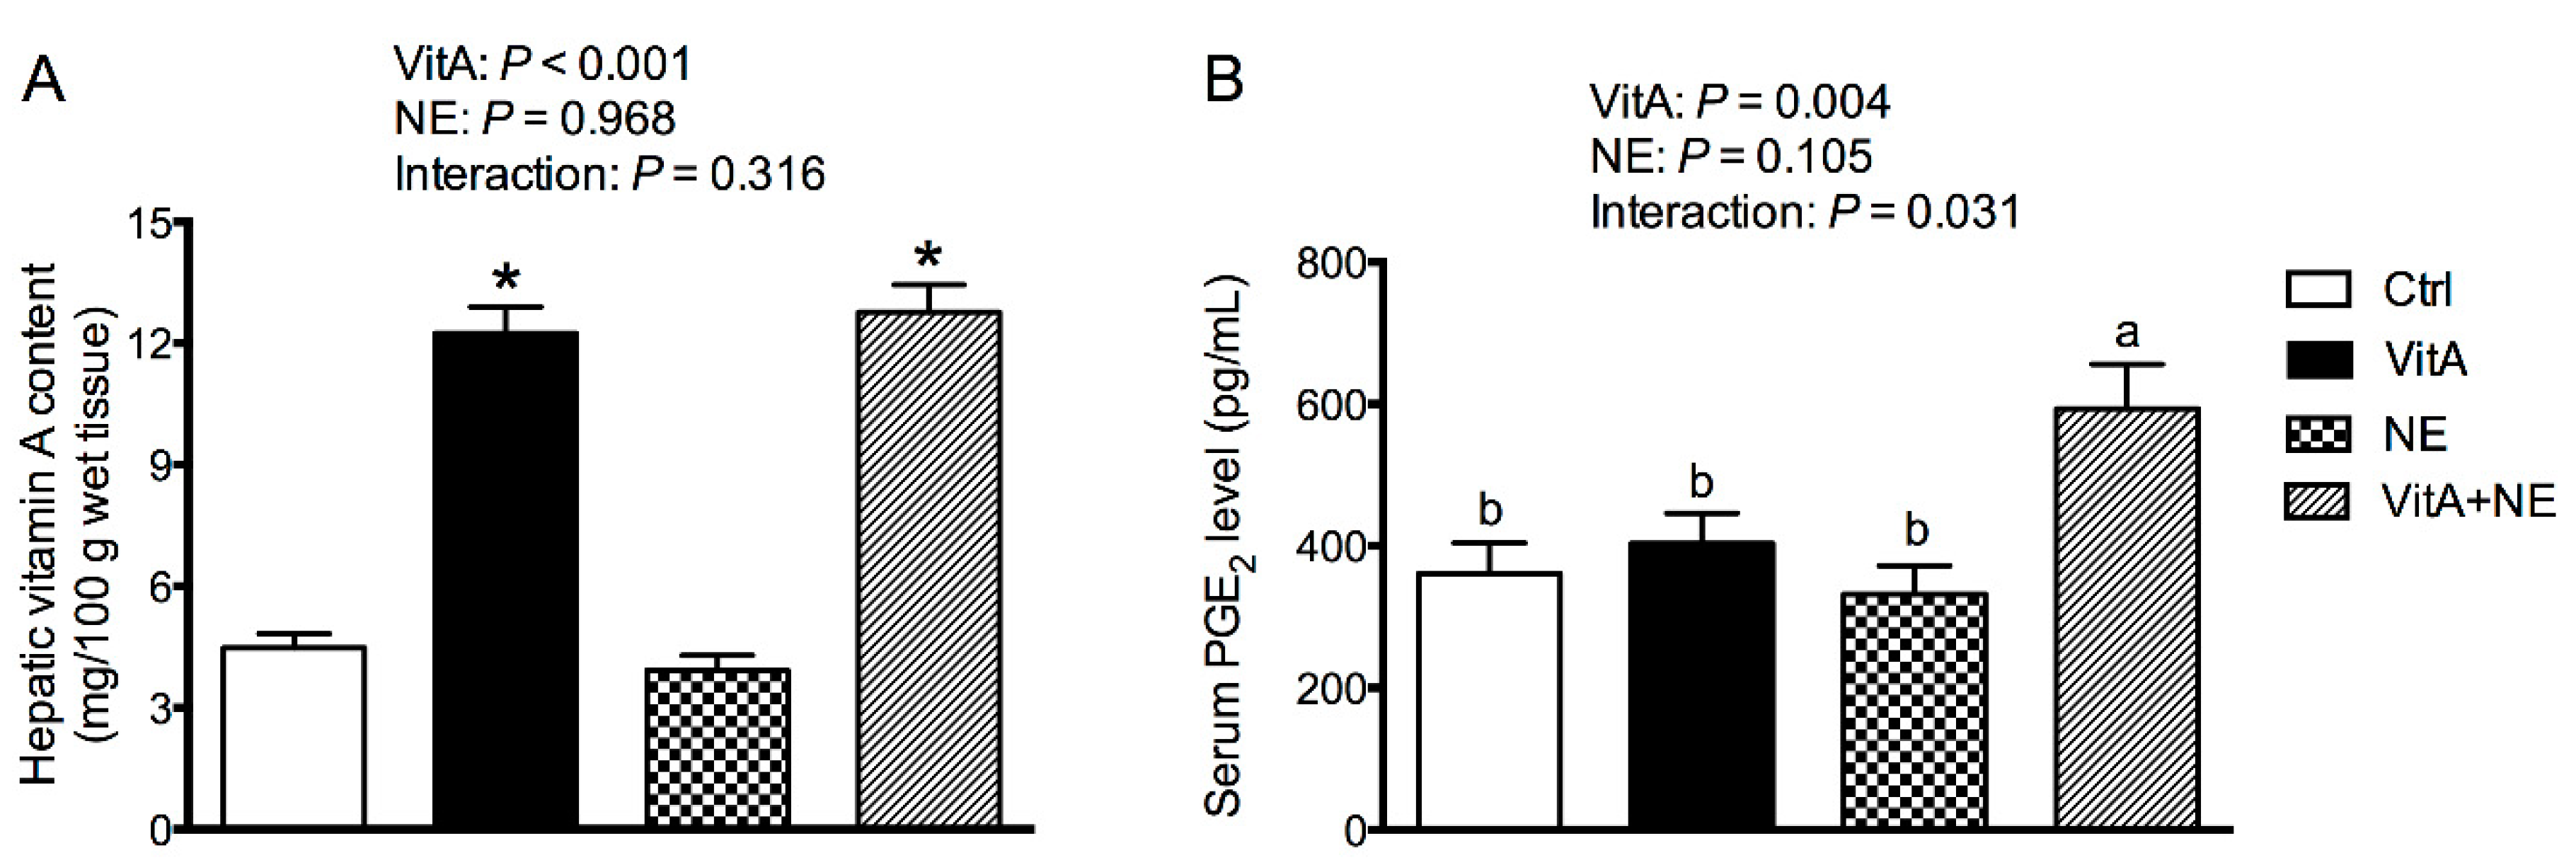
3.7. Hepatic VitA Content and Serum PGE2 Level

Significantly higher concentrations of VitA in the liver were identified in both the VitA and VitA + NE groups than those in birds in Ctrl and NE groups (p < 0.001) (Figure 6A). Additionally, VitA supplementation and NE challenge had an interactive effect on serum PGE2 level, and as shown in Figure 6B, VitA supplementation increased serum PGE2 content in NE-challenged birds (p < 0.05) but did not significantly affect it in unchallenged birds (p > 0.05).

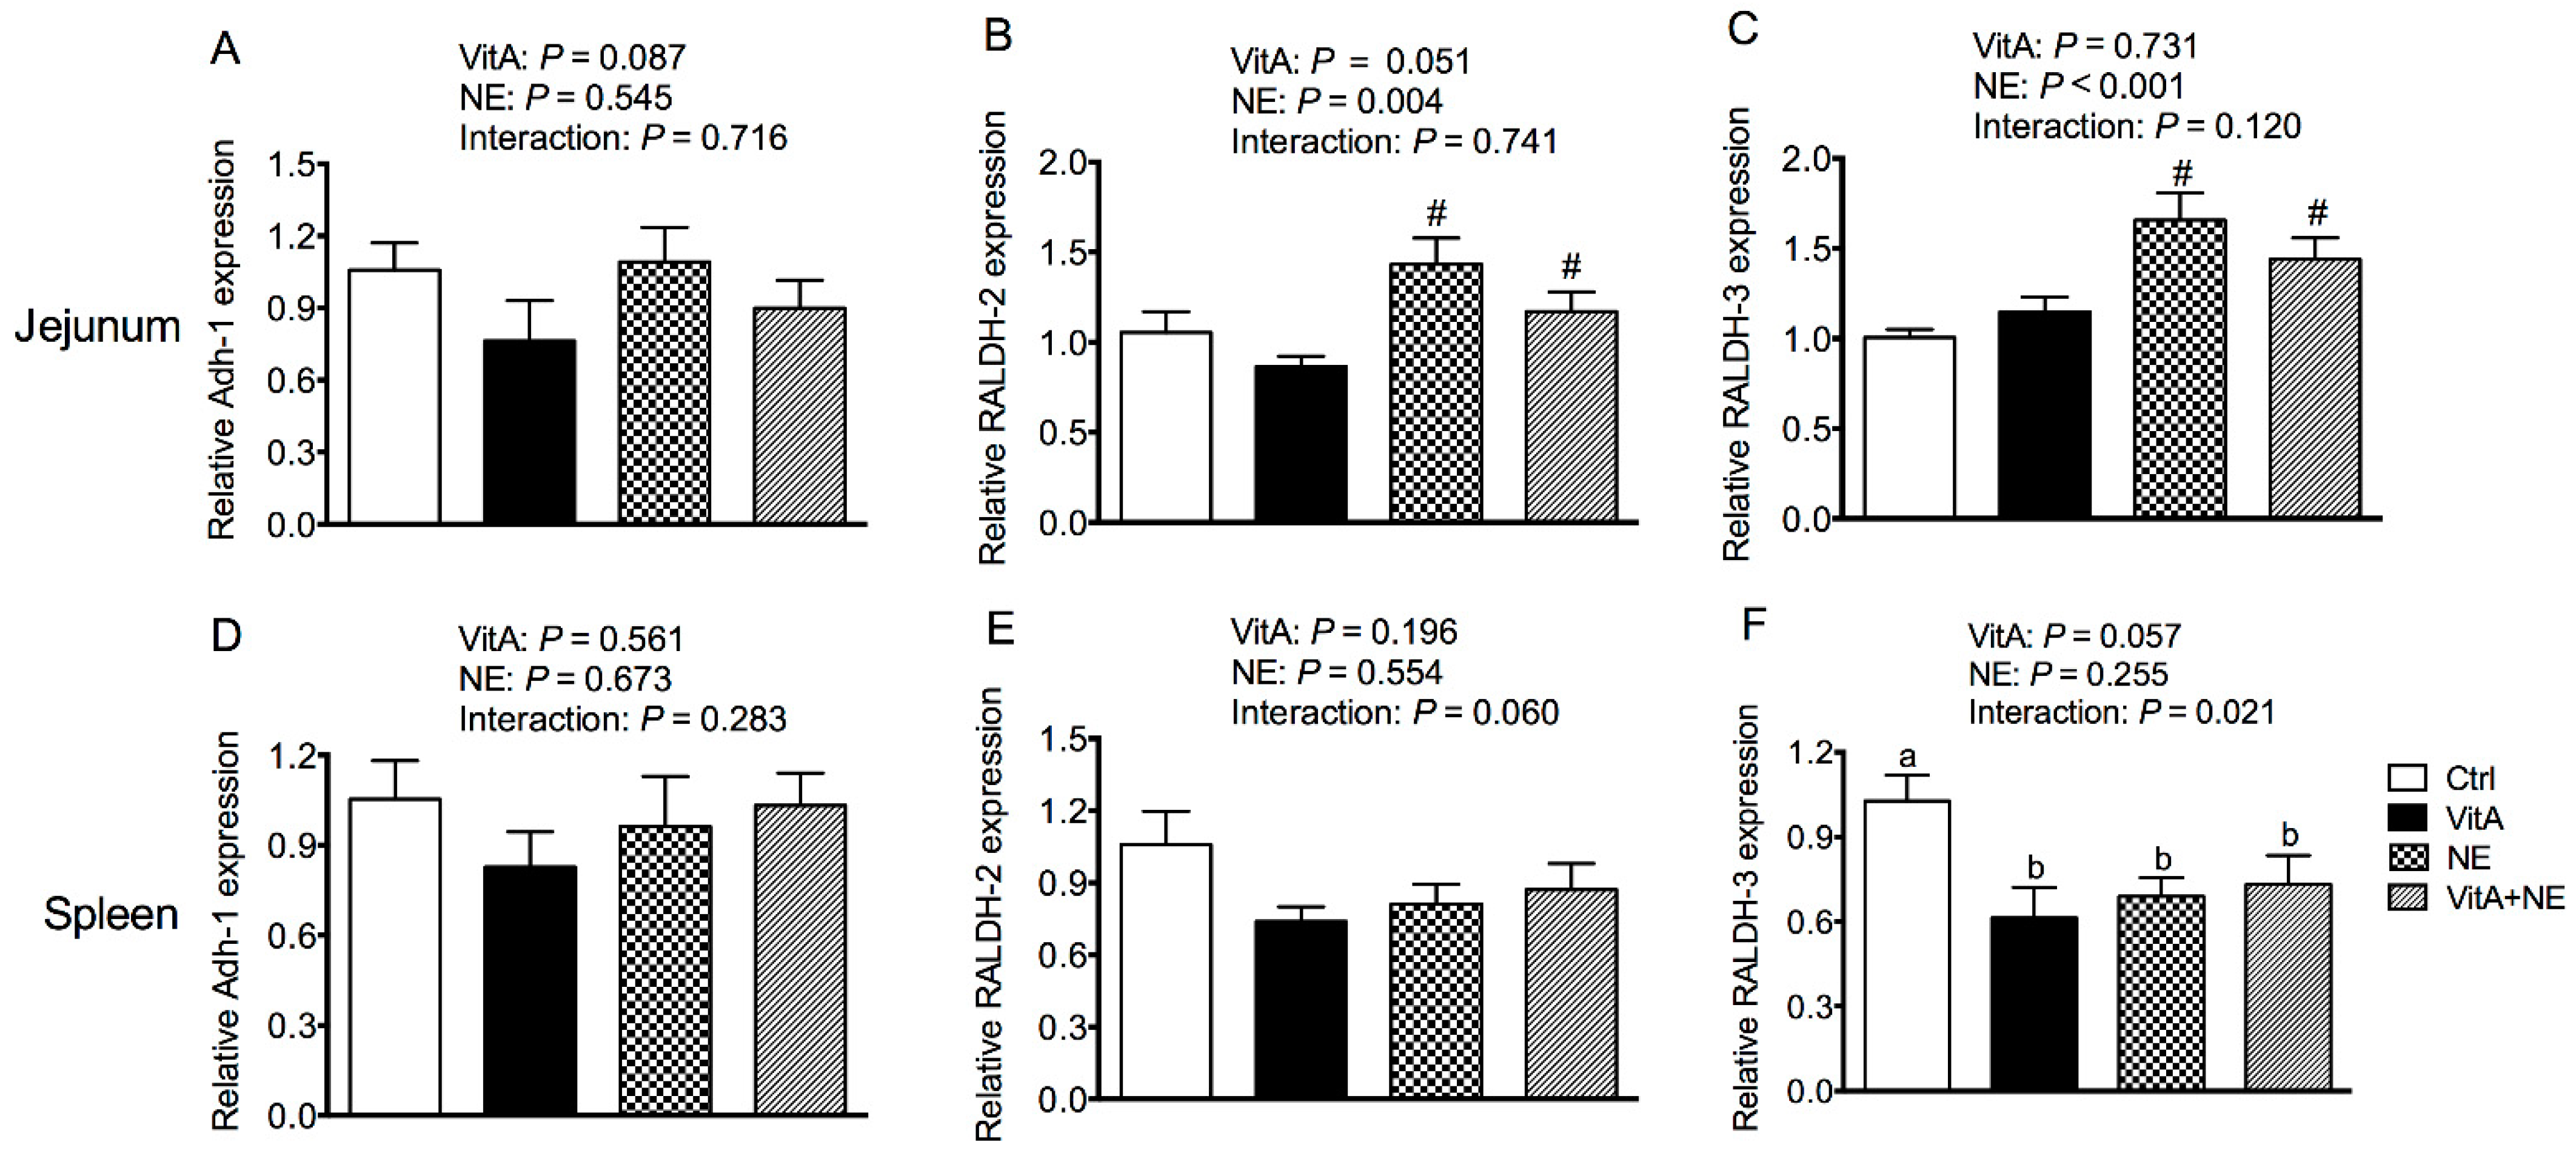
3.8. The Relative mRNA Expression of Genes Involved in Retinoic Acid Synthesis in the Jejunum and Spleen

Figure 7B,C show that NE challenge significantly up-regulated RALDH-2 and RALDH-3 relative mRNA expression in the jejunum (p < 0.05). VitA supplementation and NE challenge showed an interactive effect on RALDH-3 mRNA expression in the spleen (p < 0.05) (Figure 7F). In detail, VitA supplementation down-regulated RALDH-3 mRNA expression in the spleen of unchallenged broilers (p < 0.05) but did not significantly influence it in their challenged counterparts (p > 0.05). In addition, the relative Adh-1 mRNA expression in the jejunum and spleen as well as RALDH-2 expression in the spleen was not significantly affected by the treatments (p > 0.05) (Figure 7A,D,E).

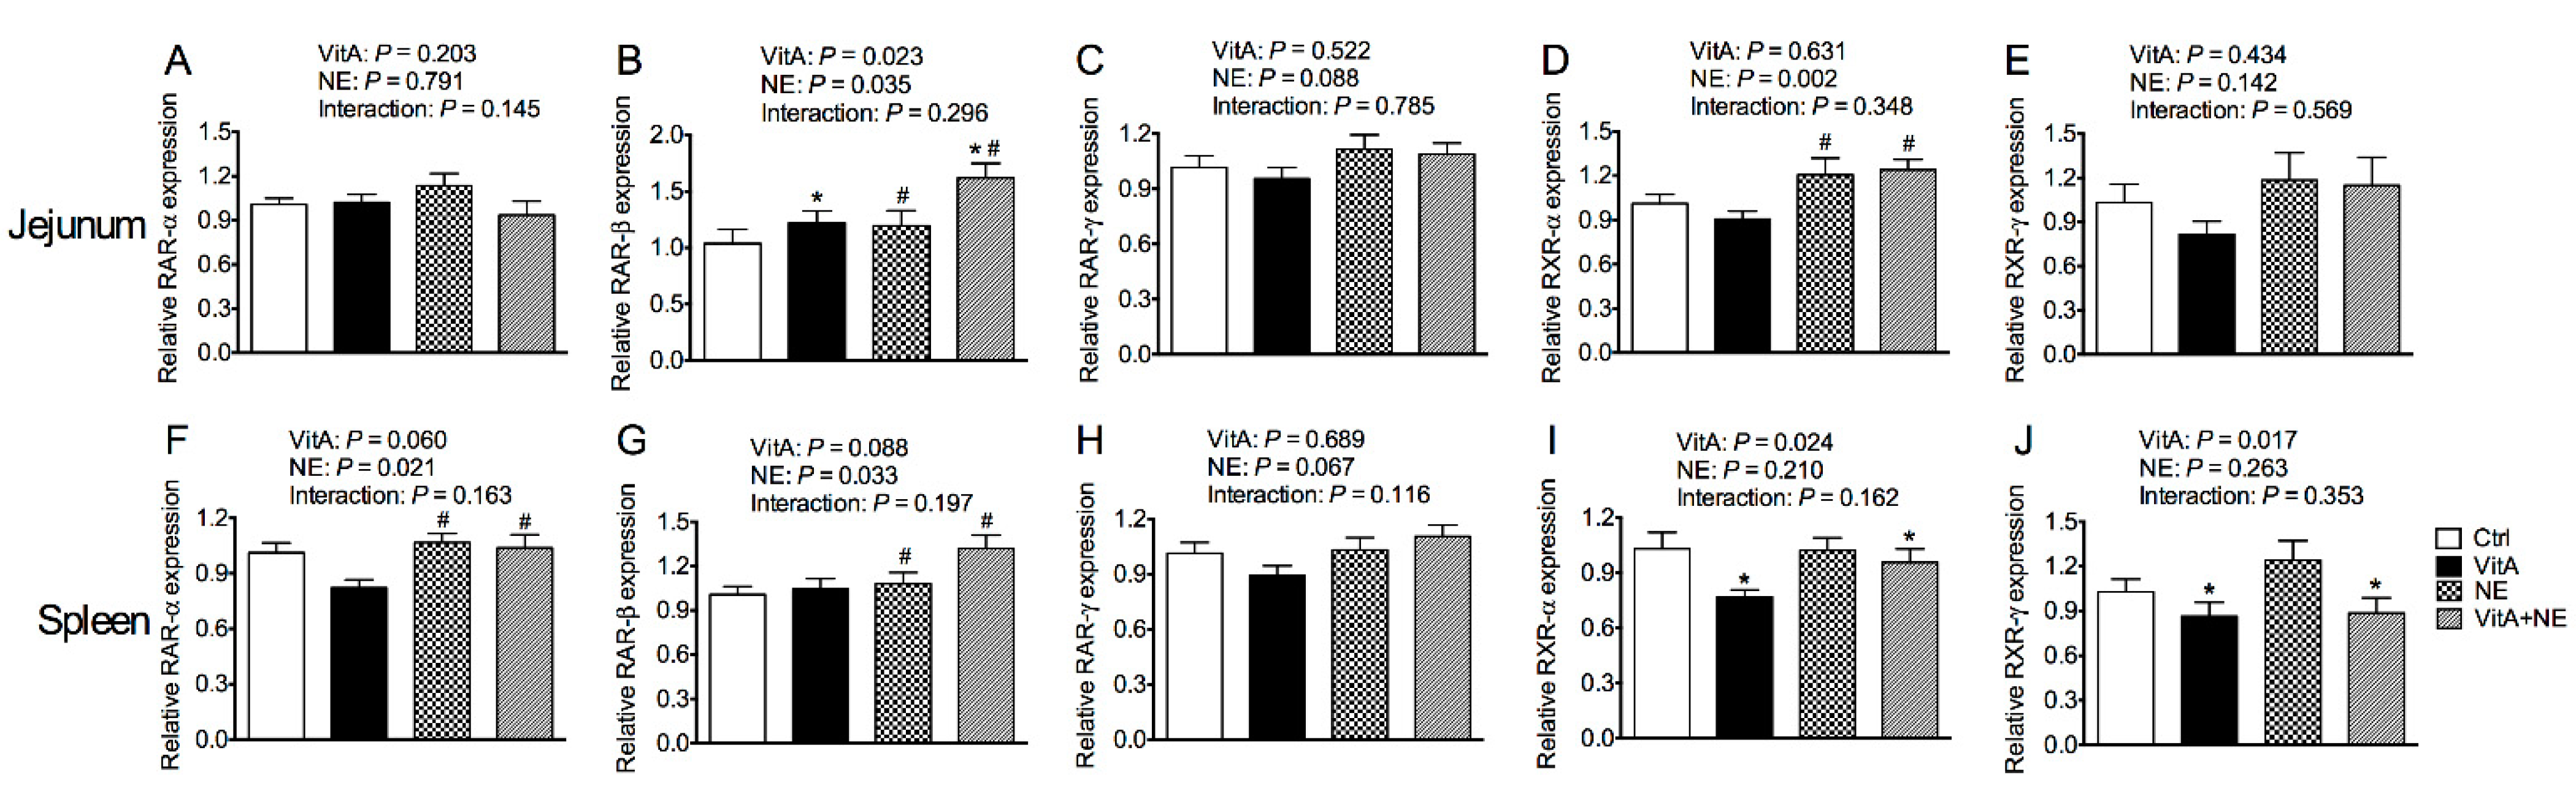
3.9. The Relative mRNA expression of Genes Encoding Retinoic Acid Receptors in the Jejunum and Spleen

VitA supplementation increased the mRNA expression of RAR-β in the jejunum of broiler chickens (p < 0.05) (Figure 8B). NE challenge up-regulated the mRNA expression of RAR-β and RXR-α in the jejunum of broiler chickens (p < 0.05) (Figure 8B,D). On the other hand, VitA supplementation down-regulated the mRNA expression of RXR-α and RXR-γ in the spleen (p < 0.05) (Figure 8I, J). In contrast, NE challenge increased splenic RAR-α and RAR-β mRNA expression (p < 0.05) (Figure 8F,G). Although, the relative mRNA expression of RAR-α, RAR-γ and RXR-γ in the jejunum as well as RAR-γ in the spleen was not significantly influenced (p > 0.05) (Figure 8A,C,E,H).

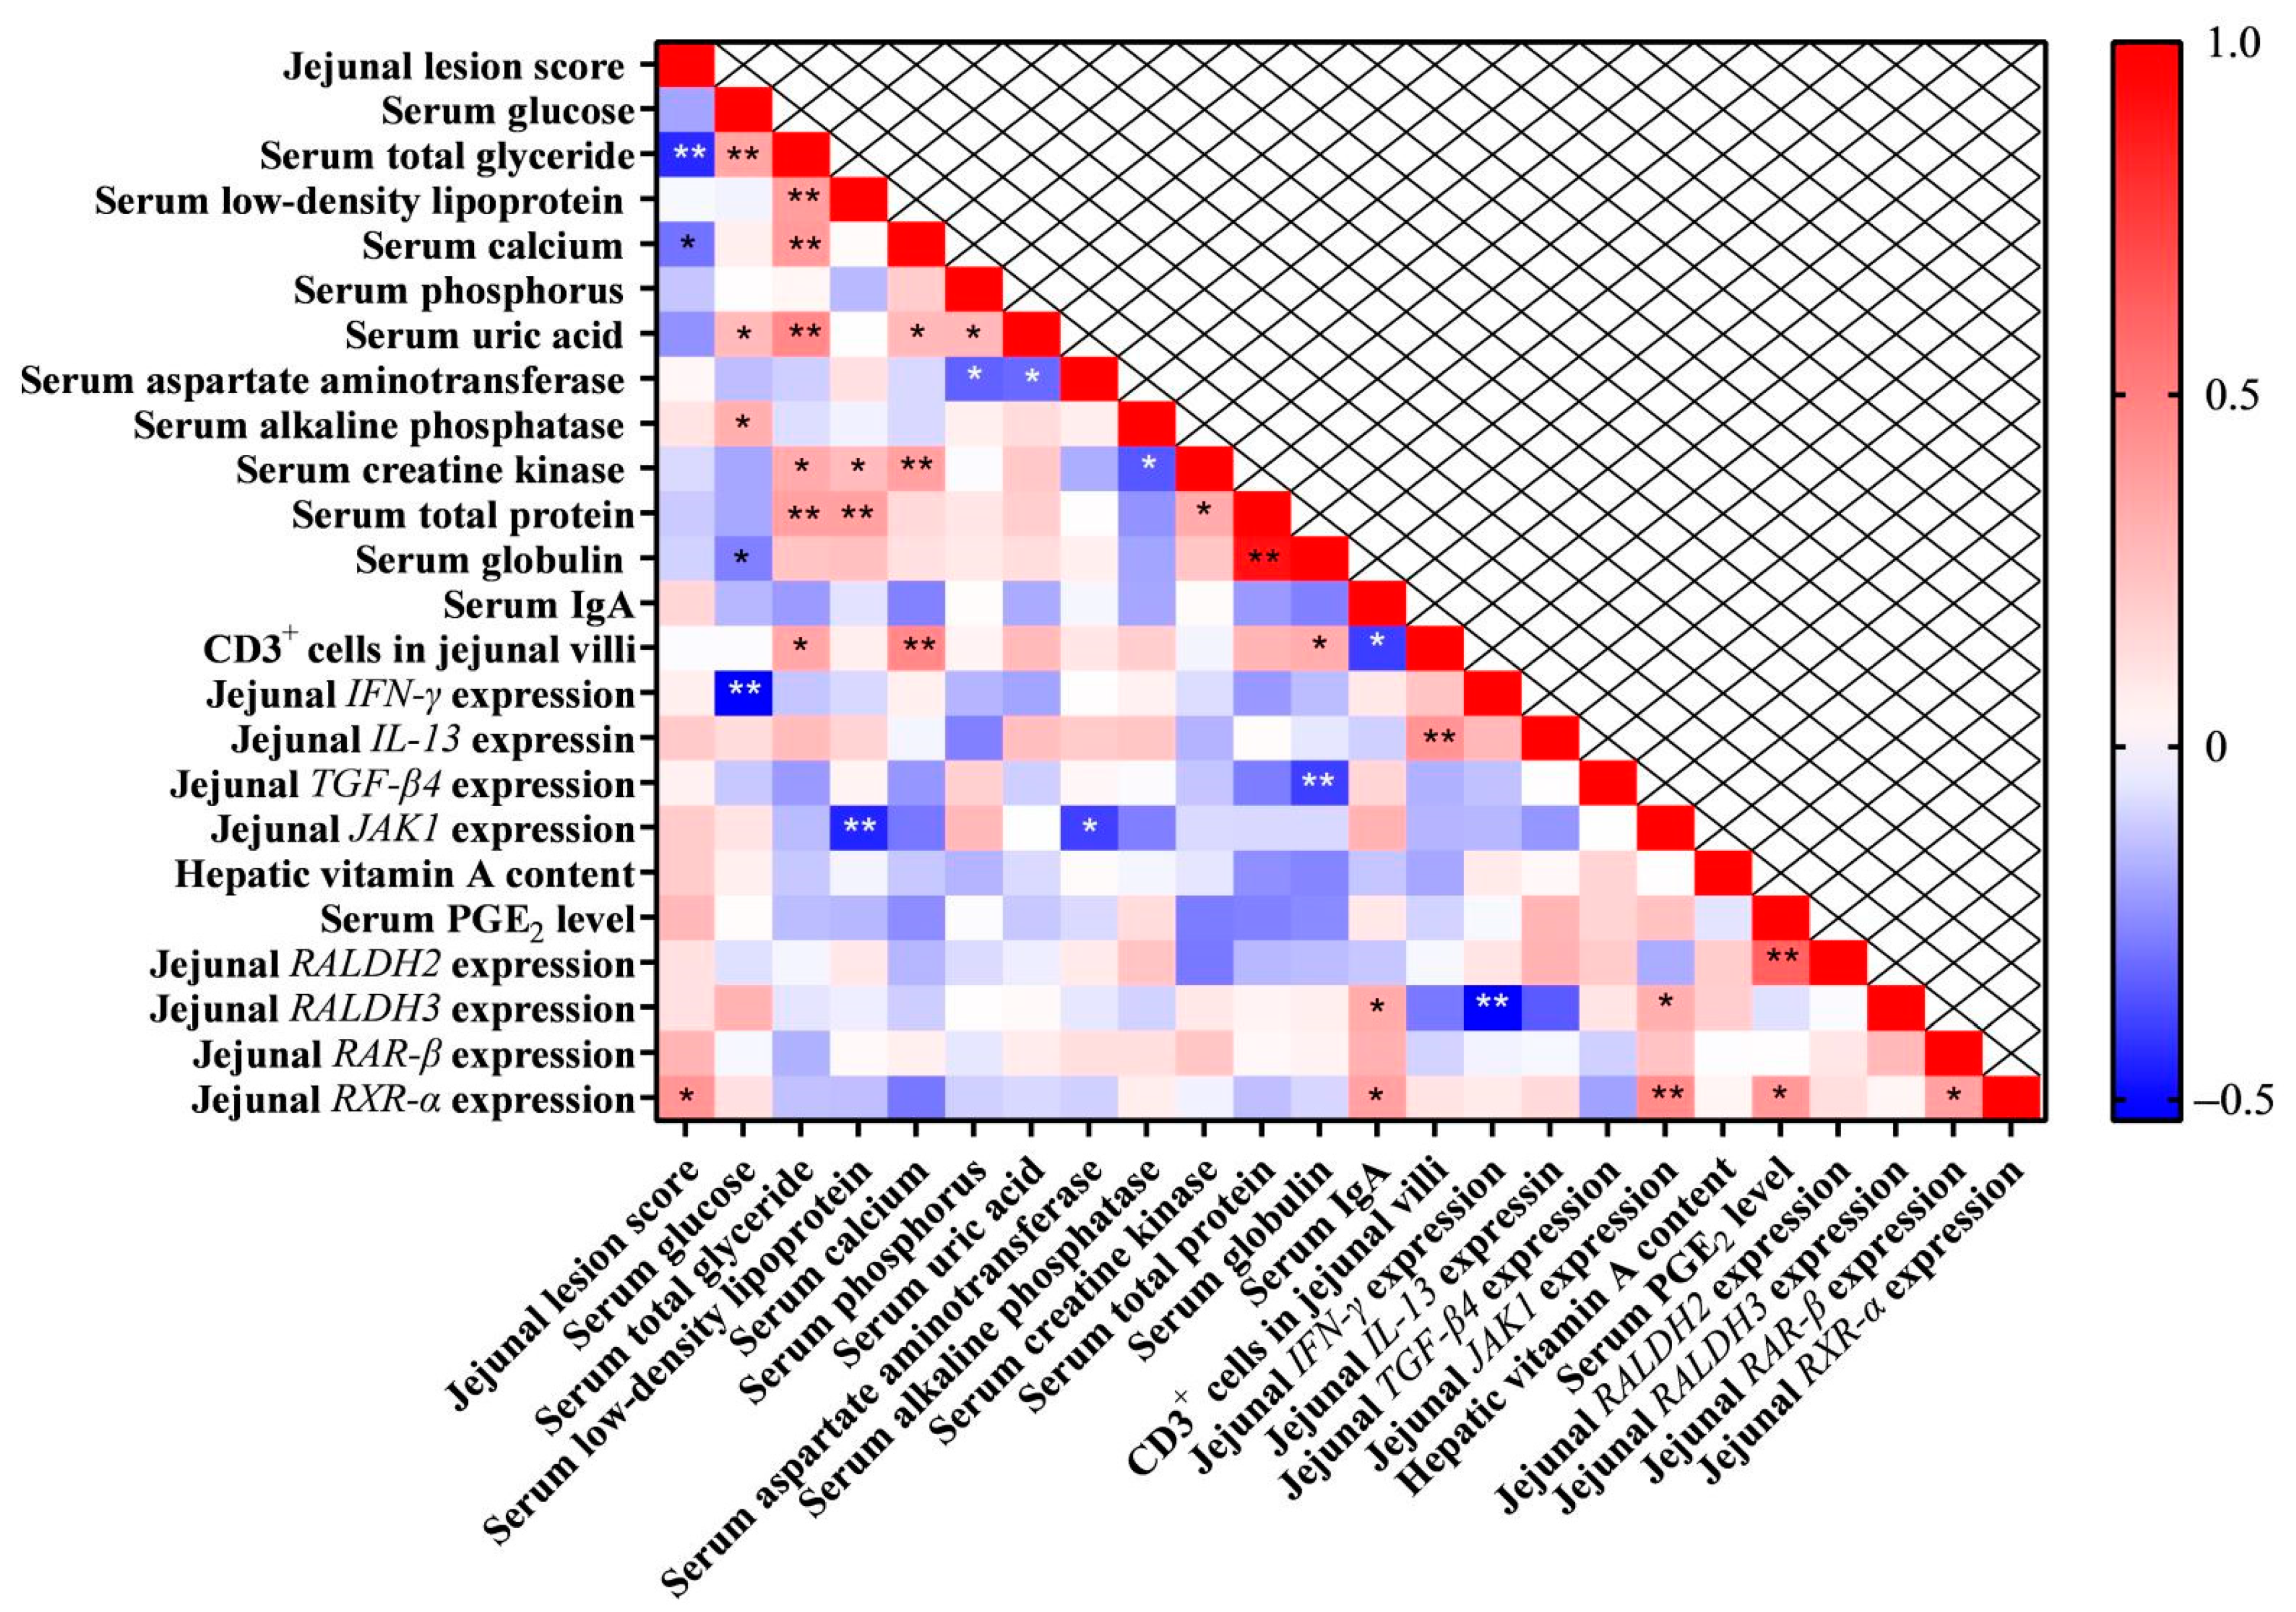
3.10. Pearson Correlation Analysis of Parameters

As shown in Figure 9, there was a significant positive correlation among most serum biochemical indices, but they exhibited a negative correlation with jejunal NE lesion score as well as cytokine and JAK1 expression. CD3+ cell counts in the jejunal villi were positively correlated with serum biochemical indices but negatively correlated with serum IgA content. Jejunal RALDH and RAR/RXR expression showed a positive correlation with serum IgA and PGE2 levels and JAK1 expression.

4. Discussion

NE is a multifactorial disease commonly seen in 2–5-week-old broiler chickens. The clinical form of NE is characterized by diarrhea and high mortality, and subclinical NE is usually unnoticed with poor growth performance due to subtle epithelial damage leading to impaired nutrient absorption [26]. The jejunal lesion score increased with NE challenge in the present study, indicating the successful establishment of NE. This was consistent with the decrease in feed intake and impairment of the intestinal barrier function in NE-challenged birds [27]. At the same time, serum glucose, total glyceride, calcium, phosphorus and uric acid levels were reduced with NE challenge as well. This suggested that the metabolism of carbohydrates, lipids, proteins and minerals might be interfered with by NE challenge. Xue et al. [28] reported that in a NE model for broilers induced with Eimeria spp. and C. perfringens co-infection, the serum cholesterol and uric acid contents were reduced in challenged birds. In the present study, the decrease in phosphorus and uric acid levels and increase in aspartate aminotransferase and creatine kinase activities induced with VitA supplementation indicated that excess VitA in the diet caused hepatic, cardiac and renal damage [29]. On the contrary, VitA supplementation increased serum low-density lipoprotein content regardless of NE challenge and reduced alkaline phosphatase activity in NE-challenged birds, which exhibited beneficial effects on lipid transportation and hepatobiliary function. Considering the crucial role of the liver in lipid metabolism, more studies should explore how VitA influences liver function in NE-challenged broiler chickens.
VitA plays an essential role in the regulation of innate and cell-mediated immunity [2]. In the present study, VitA supplementation tended to increase serum total protein and globulin levels but decrease IgA content. This suggested that VitA tended to enhance non-specific immune response without IgA involvement. VitA has been demonstrated to play a critical role in immunoglobulin synthesis, and dietary deficiency of VitA is associated with impaired IgA and IgG synthesis [30]. This phenomenon was not observed in the present study. Similarly, Rombout et al. [30] reported that plasma IgA was not significantly affected by dietary VitA deficiency or supplementation. It was reported that local cell-mediated immunity could be modulated by VitA as well. Dalloul et al. [17] observed that VitA deficiency decreased the CD3+ T cell population in the small intestine of broilers with and without E. acervulina challenge. CD3+ T cells within the intestinal epithelium are an important component of the local immune system, and the increase in CD3+ T cells indicates a strong resistance to enteric diseases [23]. Alizadeh et al. [31] reported that in ovo administration of retinoic acid increased the percentage of CD3+CD8+ T cells in the spleen of neonatal chickens at 5 and 10 days post-hatch. In the current study, CD3+ T cell density in the jejunal villi and crypts was not significantly influenced by VitA treatment. This might be attributed to the mature immune system of broilers at 28 days of age and the low severity of NE. In addition, CD3+ T cell density may also be influenced by different tissue sources.
In NE chickens, the innate immune responses mediated by TLR signaling activation lead to the maturation of dendritic cells and the subsequent differentiation of naïve T helper cells into mature effector cells with diverse functions, such as Th1, Th2, Th17 and Treg, which secrete IFN-γ, IL-13, IL-17 and TGF-β, respectively [32]. In the present study, NE challenge significantly up-regulated the jejunal IL-13 and TGF-β4 mRNA expression, which suggested that Th2 and Treg cells might be involved in the adaptive immunity against Eimeria spp. and C. perfringens infection. Similarly, the previous observation showed that C. perfringens challenge significantly increased the mRNA expression of IL-1β and TGF-β4 in the jejunum of broiler chickens [23]. Sersun Calefi et al. [33] reported that Eimeria spp. and C. perfringens co-infection was highly correlated with IFN-α, IFN-γ, IL-4, IL-13, IL-16, LITAF, TGF-β4 and TNFSF15 in the jejunum, indicating that Th2 type cytokines mainly participated in avian NE. The current study showed that VitA supplementation up-regulated jejunal IFN-γ expression in unchallenged birds. Consistently, Dalloul et al. [17] reported that VitA deficiency decreased serum IFN-γ levels and local immune defenses, leading to low resistance to E. acervulina infection. The present study observed that VitA exhibited opposite effects on IL-13 mRNA expression in the jejunum and spleen. VitA supplementation up-regulated jejunal IL-13, while it down-regulated splenic IL-13. Consistently, Shojadoost et al. [34] reported that in ovo inoculation of 270 μmol/egg of retinoic acid down-regulated the relative expression of IL-13 in the spleen of chicken embryos at 24 h post-inoculation. In contrast, Fan et al. [35] demonstrated that dietary supplementation with 12,000 IU/kg VitA up-regulated IL-13 mRNA expression in the lungs of broilers. This suggested that VitA showed tissue-specific effects on IL-13 expression, indicating its enhancement and suppression of Th2-related cytokine expression in the jejunum and spleen of broilers, respectively. The pathogen infection stimulated pro-inflammatory responses with IL-13 expression. Lessard et al. [3] demonstrated that chickens fed a highly VitA-enriched diet (15000 IU/kg) developed a Th1 rather than a Th2 immune response mainly in the spleen.
The JAK/STAT signaling pathway is implicated in the pathogenesis of inflammatory and autoimmune diseases, and it can be activated by many cytokines [36]. In the classical singling pathway, cytokine binding of its cognate receptor leads to receptor dimerization followed by docking of JAK and consequent hetero- and homodimerization of STAT. Activated STAT then undergoes translocation to the nucleus to bind DNA elements to regulate the transcription of associated genes [37]. It has been reported that E. maxima and C. perfringens co-infection activate the JAK/STAT signaling pathway in the ileal and splenic innate immune response of NE broilers, especially the Marek’s disease-susceptible chicken line 7.2 [38,39]. In the present study, NE challenge did not significantly up-regulate the expression of JAKs and STATs, which might be due to the low severity of NE. Interestingly, on the contrary, it was observed that a VitA-supplemented diet down-regulated jejunal and splenic JAK1 in unchallenged broilers, splenic STAT1 in challenged birds and splenic STAT5 and STAT6 regardless of the challenge. Choi et al. [9] reported that 9-cis-retinoic acid and all-trans-retinoic acid increased the mRNA expression of suppressors of cytokine signaling (SOCS), which are negative regulators of the JAK/STAT pathway, and thereby inhibited IFN-γ-induced activation of JAK1, JAK2, STAT1 and STAT3 in astrocytes. Uniyal et al. [8] observed that all-trans retinoic acid ameliorated inflammation and improved alveolar epithelium regeneration by interfering with the normal binding of ligands and receptors in the ERK and JAK/STAT pathways in the lungs of emphysematous rats. The suppression of JAK/STAT in the current study might be attributed to retinoic acid or VitA metabolites, but the underlying mechanism needs further investigation. Combining the results from immune responses in serum, jejunum, and spleen, the present study indicated the modulatory effects of vitamin A supplementation in diets on the immune responses in NE-challenged broilers.
Given the significance of the liver on metabolism in the body, it is, therefore, necessary to continue to investigate the deposition status of VitA in the liver. The liver is the major storage site for VitA, containing 80% of the total body reserves when VitA status is normal [40]. It was as expected that birds fed the VitA-supplemented diet had much higher hepatic VitA content in the current study. Yuan et al. [41] reported that supplementation with increasing levels of VitA linearly increased VitA in the liver and yolk of broiler breeders. Retinol and retinyl ester are dietary forms of VitA but not biologically active. They need transformation by Adh and RALDH to become retinoic acid [42]. The intestine is another important part regulating the VitA metabolism. The present study showed that NE challenge up-regulated RALDH-2 and RALDH-3 in the jejunum. This was contradictory to previous speculation that C. perfringens challenge might suppress RALDH expression via PGE2 production. The serum PGE2 level was elevated in the challenged birds fed the VitA-supplemented diet in the present study. Cattin et al. [43] reported that bacterial/fungal pathogens in the gut promoted RALDH activity in monocyte-derived dendritic cells, which boosted HIV infection and outgrowth in CD4+ T cells. Broadhurst et al. [44] demonstrated that Schistosoma mansoni infection up-regulated RALDH2 to induce retinoic acid synthesis in alternatively activated macrophages during retinoic acid-dependent Th2 immunity in mice. Therefore, the up-regulation of jejunal RALDH in NE-challenged broilers might be a way to produce retinoic acid for enhancing immune responses against pathogens and parasites. The content of retinoic acid should be determined in further investigations. The present study revealed that VitA supplementation down-regulated splenic RALDH-3 expression in unchallenged birds and showed no significant effects on the decrease in splenic RALDH-3 expression in NE birds. It was evidenced that supplementation with a mixture of VitA and 10% all-trans-retinoic acid exhibited excess retinol availability in the lung of rats, resulting in decreased uptake of VitA and production of retinoic acid through the down-regulated expression of RALDH [45]. The relationship between nutrition and the liver–spleen axis has recently been emphasized, which includes the role of dietary supplementation with vitamins [46]. The conversion of VitA to retinoic acid in the spleen was scarcely reported.
Retinoic acid is the main active form of VitA, and it is transported to the nucleus after synthesis and recognized by RAR/RXR heterodimers bound to retinoic acid response elements where they regulate the transcriptional progression of various genes [47]. The present study observed that the VitA-supplemented diet up-regulated jejunal RAR-β and down-regulated splenic RXR-α and RXR-γ, indicating a tissue-specific response. Krüger et al. [48] demonstrated that feeding calves a milk-based formula with VitA did not significantly affect jejunal RAR and RXR mRNA levels, but it increased hepatic RAR-β expression compared to counterpart diets without VitA. It was demonstrated that VitA deficiency down-regulated RAR-α mRNA in the intestinal mucosa of rats and thereby failed to modulate mucosal immunity [49]. Few studies in the literature reported the effects of VitA or retinoic acid on RAR and RXR expression in the spleen. In the current study, NE challenge up-regulated jejunal RAR-β and RXR-α as well as splenic RAR-α and RAR-β. This was consistent with the up-regulation of RALDH expression with NE challenge. Luo et al. [50] evidenced that the expression of the nuclear receptors RXR-α and peroxisome proliferator-activated receptor α was decreased in the inflamed colonic mucosa of ulcerative colitis patients and in IL-1β-treated Caco2-BBE cells. Further investigation on RAR and RXR expression in NE birds is needed in the future.
The Pearson correlation analysis of serum and jejunal parameters greatly reflected the effects of NE challenge on these parameters. As NE challenge decreased serum biochemical indices and increased the jejunal lesion score as well as cytokine expression, there was a positive correlation among most serum biochemical indices, which were negatively correlated with jejunal lesion score and cytokine expression. NE challenge up-regulated jejunal RALDH and RAR/RXR expression, which showed a positive correlation with serum PGE2 levels. Meanwhile, jejunal villus CD3+ cell counts positively correlated with serum biochemical indices and negatively correlated with serum IgA content. This suggested that local and systematic immune responses to NE challenge differed. Jejunal JAK1 expression negatively correlated with serum biochemical indices and positively correlated with jejunal RALDH3 and RXR-α expression. This indicated the involvement of the JAK/STAT and RAR/RXR signaling pathways in NE broilers fed the VitA-supplemented diet.

5. Conclusions

NE challenge induced jejunal injury, Th2 and Treg cell-related cytokine expression and enhanced RALDH and RAR/RXR expression mainly in the jejunum of broilers. VitA supplementation improved hepatic VitA deposition and did not alleviate jejunal injury and Th2 cell-related cytokine expression, but it inhibited the expression of RALDH-3, RXR and the JAK/STAT signaling pathway in the spleen of broilers. The present study indicated the modulatory effects of VitA supplementation in diets on the immune responses and VitA metabolism in NE-challenged broilers.

Author Contributions

Conceptualization, S.G. and B.D.; methodology, L.H., Y.Z. and J.N.; software, S.G. and L.H.; validation, Z.Z., and P.L.; formal analysis, S.G., Z.Z. and B.D.; investigation, S.G., L.H., Y.Z. and J.N.; resources, Z.Z.; data curation, S.G., C.L. and Z.Z.; writing—original draft preparation, S.G. and L.H.; writing—review and editing, C.L., Z.Z., P.L. and B.D.; visualization, Y.Z. and J.N.; supervision, B.D.; project administration, S.G. and B.D.; funding acquisition, S.G. and B.D. All authors have read and agreed to the published version of the manuscript.

Funding

This research was funded by the National Natural Science Foundation of China (No. 32172757), the National Key R&D Program of China (No. 2016YFD0501202), the National Science Foundation of Hubei Province (2021CFB559) and the Open Project of Hubei Key Laboratory of Animal Nutrition and Feed Science (No. 201902).

Institutional Review Board Statement

This study was approved by the Institutional Animal Care and Use Committee of Wuhan Polytechnic University (protocol code: WPU201904001 and approved on 25 March 2019).

Informed Consent Statement

Not applicable.

Data Availability Statement

Not applicable.

Conflicts of Interest

The authors declare no conflict of interest.

References

  1. Huang, Z.; Liu, Y.; Qi, G.; Brand, D.; Zheng, S.G. Role of vitamin A in the immune system. J. Clin. Med. 2018, 7, 258. [Google Scholar] [CrossRef] [PubMed]
  2. Munteanu, C.; Schwartz, B. The relationship between nutrition and the immune system. Front. Nutr. 2022, 9, 1082500. [Google Scholar] [CrossRef] [PubMed]
  3. Lessard, M.; Hutchings, D.; Cave, N.A. Cell-mediated and humoral immune responses in broiler chickens maintained on diets containing different levels of vitamin A. Poult. Sci. 1997, 76, 1368–1378. [Google Scholar] [CrossRef] [PubMed]
  4. Pino-Lagos, K.; Guo, Y.; Noelle, R.J. Retinoic acid: A key player in immunity. BioFactors 2010, 36, 430–436. [Google Scholar] [CrossRef] [PubMed]
  5. Rochette-Egly, C.; Germain, P. Dynamic and combinatorial control of gene expression by nuclear retinoic acid receptors (RARs). Nucl. Recept. Signal. 2009, 7, e005. [Google Scholar] [CrossRef]
  6. Collins, C.B.; Aherne, C.M.; Kominsky, D.; McNamee, E.N.; Lebsack, M.D.P.; Eltzschig, H.; Jedlicka, P.; Rivera-Nieves, J. Retinoic acid attenuates ileitis by restoring the balance between T-helper 17 and T regulatory cells. Gastroenterology 2011, 141, 1821–1831. [Google Scholar] [CrossRef]
  7. Manicassamy, S.; Ravindran, R.; Deng, J.; Oluoch, H.; Denning, T.L.; Kasturi, S.P.; Rosenthal, K.M.; Evavold, B.D.; Pulendran, B. Toll-like receptor 2-dependent induction of vitamin A-metabolizing enzymes in dendritic cells promotes T regulatory responses and inhibits autoimmunity. Nat. Med. 2009, 15, 401–409. [Google Scholar] [CrossRef]
  8. Uniyal, S.; Dhasmana, A.; Tyagi, A.; Muyal, J.P. ATRA reduces inflammation and improves alveolar epithelium regeneration in emphysematous rat lung. Biomed. Pharmacother. 2018, 108, 1435–1450. [Google Scholar] [CrossRef]
  9. Choi, W.-H.; Ji, K.-A.; Jeon, S.-B.; Yang, M.-S.; Kim, H.; Min, K.-J.; Shong, M.; Jou, I.; Joe, E.-H. Anti-inflammatory roles of retinoic acid in rat brain astrocytes: Suppression of interferon-γ-induced JAK/STAT phosphorylation. Biochem. Biophys. Res. Commun. 2005, 329, 125–131. [Google Scholar] [CrossRef]
  10. Shojadoost, B.; Vince, A.R.; Prescott, J.F. The successful experimental induction of necrotic enteritis in chickens by Clostridium perfringens: A critical review. Vet. Res. 2012, 43, 74. [Google Scholar] [CrossRef]
  11. Fasina, Y.O.; Lillehoj, H.S. Characterization of intestinal immune response to Clostridium perfringens infection in broiler chickens. Poult. Sci. 2019, 98, 188–198. [Google Scholar] [CrossRef] [PubMed]
  12. Song, B.; Li, P.; Yan, S.; Liu, D.; Gao, M.; Lv, H.; Lv, Z.; Guo, Y. Effects of dietary astragalus polysaccharide supplementation on the Th17/Treg balance and the gut microbiota of broiler chickens challenged with necrotic enteritis. Front. Immunol. 2022, 13, 781934. [Google Scholar] [CrossRef] [PubMed]
  13. Zhang, B.; Gan, L.; Shahid, M.S.; Lv, Z.; Fan, H.; Liu, D.; Guo, Y. In vivo and in vitro protective effect of arginine against intestinal inflammatory response induced by Clostridium perfringens in broiler chickens. J. Anim. Sci. Biotechnol. 2019, 10, 73. [Google Scholar] [CrossRef] [PubMed]
  14. Tejón, G.; Manríquez, V.; De Calisto, J.; Flores-Santibáñez, F.; Hidalgo, Y.; Crisóstomo, N.; Fernández, D.; Sauma, D.; Mora, J.R.; Bono, M.R.; et al. Vitamin A impairs the reprogramming of Tregs into IL-17-producing cells during intestinal inflammation. BioMed Res. Int. 2015, 2015, 137893. [Google Scholar] [CrossRef]
  15. Penny, H.L.; Prestwood, T.R.; Bhattacharya, N.; Sun, F.; Kenkel, J.A.; Davidson, M.G.; Shen, L.; Zuniga, L.A.; Seeley, E.S.; Pai, R.; et al. Restoring retinoic acid attenuates intestinal inflammation and tumorigenesis in APCMin/+ mice. Cancer Immunol. Res. 2016, 4, 917–926. [Google Scholar] [CrossRef]
  16. Moore, R.J. Necrotic enteritis predisposing factors in broiler chickens. Avian Pathol. 2016, 45, 275–281. [Google Scholar] [CrossRef]
  17. Dalloul, R.A.; Lillehoj, H.S.; Shellem, T.A.; Doerr, J.A. Effect of vitamin A deficiency on host intestinal immune response to Eimeria acervulina in broiler chickens. Poult. Sci. 2002, 81, 1509–1515. [Google Scholar] [CrossRef]
  18. Dalloul, R.A.; Lillehoj, H.S.; Shellem, T.A.; Doerr, J.A. Intestinal immunomodulation by vitamin A deficiency and lactobacillus-based probiotic in Eimeria acervulina—Infected broiler chickens. Avian Dis. 2003, 47, 1313–1320. [Google Scholar] [CrossRef]
  19. Preclik, G.; Stange, E.F.; Ditschuneit, H. Activation of PGE2-secretion from gastric mucosa by a type I phospholipase C is mediated by a direct release of arachidonic acid. Clin. Physiol. Biochem. 1992, 9, 78–86. [Google Scholar]
  20. Stock, A.; Booth, S.; Cerundolo, V. Prostaglandin E2 suppresses the differentiation of retinoic acid-producing dendritic cells in mice and humans. J. Exp. Med. 2011, 208, 761–773. [Google Scholar] [CrossRef]
  21. Wu, Y.; Shao, Y.; Song, B.; Zhen, W.; Wang, Z.; Guo, Y.; Shahid, M.S.; Nie, W. Effects of Bacillus coagulans supplementation on the growth performance and gut health of broiler chickens with Clostridium perfringens-induced necrotic enteritis. J. Anim. Sci. Biotechnol. 2018, 9, 9. [Google Scholar] [CrossRef] [PubMed]
  22. Wu, Y.; Zhen, W.; Geng, Y.; Wang, Z.; Guo, Y. Pretreatment with probiotic Enterococcus faecium NCIMB 11181 ameliorates necrotic enteritis-induced intestinal barrier injury in broiler chickens. Sci. Rep. 2019, 9, 10256. [Google Scholar] [CrossRef] [PubMed]
  23. Guo, S.; Xi, Y.; Xia, Y.; Wu, T.; Zhao, D.; Zhang, Z.; Ding, B. Dietary Lactobacillus fermentum and Bacillus coagulans supplementation modulates intestinal immunity and microbiota of broiler chickens challenged by Clostridium perfringens. Front. Vet. Sci. 2021, 8, 680742. [Google Scholar] [CrossRef] [PubMed]
  24. Idi, A.; Permin, A.; Jensen, S.K.; Murrell, K.D. Effect of a minor vitamin A deficiency on the course of infection with Ascaridia galli (Schrank, 1788) and the resistance of chickens. Helminthologia 2007, 44, 3–9. [Google Scholar] [CrossRef]
  25. Heid, C.A.; Stevens, J.; Livak, K.J.; Williams, P.M. Real time quantitative PCR. Genome Res. 1996, 6, 986–994. [Google Scholar] [CrossRef]
  26. Kulkarni, R.R.; Gaghan, C.; Correll, K.; Sharif, S.; Taha-Abdelaziz, K. Probiotic as alternatives to antibiotics for the prevention and control of necrotic enteritis in chickens. Pathogens 2022, 11, 692. [Google Scholar] [CrossRef]
  27. Li, P.; Liu, C.; Niu, J.; Zhang, Y.; Li, C.; Zhang, Z.; Guo, S.; Ding, B. Effects of dietary supplementation with vitamin A on antioxidant and intestinal barrier function of broilers co-infected with coccidia and Clostridium perfringens. Animals 2022, 12, 3431. [Google Scholar] [CrossRef]
  28. Xue, G.D.; Barekatain, R.; Wu, S.B.; Chot, M.; Swick, R.A. Dietary L-glutamine supplementation improves growth performance, gut morphology, and serum biochemical indices of broiler chickens during necrotic enteritis challenge. Poult. Sci. 2018, 97, 1334–1341. [Google Scholar] [CrossRef]
  29. Savaris, V.D.L.; Souza, C.; Wachholz, L.; Broch, J.; Polese, C.; Carvalho, P.L.O.; Pozza, P.C.; Eyng, C.; Nunes, R.V. Interactions between lipid source and vitamin A on broiler performance, blood parameters, fat and protein deposition rate, and bone development. Poult. Sci. 2021, 100, 174–185. [Google Scholar] [CrossRef]
  30. Rombout, J.H.W.M.; Sijtsma, S.R.; West, C.E.; Karabinis, Y.; Sijtsma, O.K.W.; Van Der Zijpp, A.J.; Koch, G. Effect of vitamin A deficiency and Newcastle disease virus infection on IgA and IgM secretion in chickens. Br. J. Nutr. 1992, 68, 753–763. [Google Scholar] [CrossRef]
  31. Alizadeh, M.; Astill, J.; Alqazlan, N.; Shojadoost, B.; Taha-Abdelaziz, K.; Bavananthasivam, J.; Doost, J.S.; Sedeghiisfahani, N.; Sharif, S. In ovo co-administration of vitamins (A and D) and probiotic lactobacilli modulates immune responses in broiler chickens. Poult. Sci. 2022, 101, 101717. [Google Scholar] [CrossRef] [PubMed]
  32. Oh, S.T.; Lillehoj, H.S. The role of host genetic factors and host immunity in necrotic enteritis. Avian Pathol. 2016, 45, 313–316. [Google Scholar] [CrossRef] [PubMed]
  33. Sersun Calefi, A.; Quinteiro-Filho, W.M.; de Siqueira, A.; Nacimento Lima, A.P.; Cruz, D.S.G.; Queiroz Hazarbassanov, N.; Auciello Salvagni, F.; Borsoi, A.; de Oliveira Massoco Salles Gomes, C.; Maiorka, P.C.; et al. Heat stress, Eimeria spp. and C. perfringens infections alone or in combination modify gut Th1/Th2 cytokine balance and avian necrotic enteritis pathogenesis. Vet. Immunol. Immunopathol. 2019, 210, 28–37. [Google Scholar] [CrossRef] [PubMed]
  34. Shojadoost, B.; Alizadeh, M.; Taha-Abdelaziz, K.; Doost, J.S.; Astill, J.; Sharif, S. In ovo inoculation of vitamin A modulates chicken embryo immune functions. J. Interferon Cytokine Res. 2021, 41, 20–28. [Google Scholar] [CrossRef]
  35. Fan, X.; Liu, S.; Liu, G.; Zhao, J.; Jiao, H.; Wang, X.; Song, Z.; Lin, H. Vitamin A deficiency impairs mucin expression and suppresses the mucosal immune function of the respiratory tract in chicks. PLoS ONE 2015, 10, e0139131. [Google Scholar] [CrossRef]
  36. Banerjee, S.; Biehl, A.; Gadina, M.; Hasni, S.; Schwartz, D.M. JAK-STAT signaling as a target for inflammatory and autoimmune diseases: Current and future prospects. Drugs 2017, 77, 521–546. [Google Scholar] [CrossRef]
  37. Ou, A.; Ott, M.; Fang, D.; Heimberger, A.B. The role and therapeutic targeting of JAK/STAT signaling in glioblastoma. Cancers 2021, 13, 437. [Google Scholar] [CrossRef]
  38. Truong, A.D.; Rengaraj, D.; Hong, Y.; Hoang, C.T.; Hong, Y.H.; Lillehoj, H.S. Differentially expressed JAK-STAT signaling pathway genes and target microRNAs in the spleen of necrotic enteritis-afflicted chicken lines. Res. Vet. Sci. 2017, 115, 235–243. [Google Scholar] [CrossRef]
  39. Truong, A.D.; Rengaraj, D.; Hong, Y.; Hoang, C.T.; Hong, Y.H.; Lillehoj, H.S. Analysis of JAK-STAT signaling pathway genes and their microRNAs in the intestinal mucosa of genetically disparate chicken lines induced with necrotic enteritis. Vet. Immunol. Immunopathol. 2017, 187, 1–9. [Google Scholar] [CrossRef]
  40. Blomhoff, R.; Wake, K. Perisinusoidal stellate cells of the liver: Important roles in retinol metabolism and fibrosis. FASEB J. 1991, 5, 271–277. [Google Scholar] [CrossRef]
  41. Yuan, J.; Roshdy, A.R.; Guo, Y.; Wang, Y.; Guo, S. Effect of dietary vitamin A on reproductive performance and immune response of broiler breeders. PLoS ONE 2014, 9, e105677. [Google Scholar] [CrossRef] [PubMed]
  42. Szymański, Ł.; Skopek, R.; Palusińska, M.; Schenk, T.; Stengel, S.; Lewicki, S.; Kraj, L.; Kamiński, P.; Zelent, A. Retinoic acid and its derivatives in skin. Cells 2020, 9, 2660. [Google Scholar] [CrossRef] [PubMed]
  43. Cattin, A.; Wacleche, V.S.; Fonseca Do Rosario, N.; Marchand, L.R.; Dias, J.; Gosselin, A.; Cohen, E.A.; Estaquier, J.; Chomont, N.; Routy, J.-P.; et al. RALDH activity induced by bacterial/fungal pathogens in CD16+ monocyte-derived dendritic cells boosts HIV infection and outgrowth in CD4+ T Cells. J. Immunol. 2021, 206, 2638–2651. [Google Scholar] [CrossRef] [PubMed]
  44. Broadhurst, M.J.; Leung, J.M.; Lim, K.C.; Girgis, N.M.; Gundra, U.M.; Fallon, P.G.; Premenko-Lanier, M.; McKerrow, J.H.; McCune, J.M.; Loke, P. Upregulation of retinal dehydrogenase 2 in alternatively activated macrophages during retinoid-dependent type-2 immunity to helminth infection in mice. PLoS Pathog. 2012, 8, e1002883. [Google Scholar] [CrossRef]
  45. Owusu, S.A.; Ross, A.C. Retinoid homeostatic gene expression in liver, lung and kidney: Ontogeny and response to vitamin A-retinoic acid (VARA) supplementation from birth to adult age. PLoS ONE 2016, 11, e0145924. [Google Scholar] [CrossRef]
  46. Barrea, L.; Di Somma, C.; Muscogiuri, G.; Tarantino, G.; Tenore, G.C.; Orio, F.; Colao, A.; Savastano, S. Nutrition, inflammation and liver-spleen axis. Crit. Rev. Food Sci. Nutr. 2018, 58, 3141–3158. [Google Scholar] [CrossRef]
  47. Viera-Vera, J.; García-Arrarás, J.E. Retinoic acid signaling is associated with cell proliferation, muscle cell dedifferentiation, and overall rudiment size during intestinal regeneration in the sea cucumber, Holothuria glaberrima. Biomolecules 2019, 9, 873. [Google Scholar] [CrossRef]
  48. Krüger, K.A.; Blum, J.W.; Greger, D.L. Expression of nuclear receptor and target genes in liver and intestine of neonatal calves fed colostrum and vitamin A. J. Dairy Sci. 2005, 88, 3971–3981. [Google Scholar] [CrossRef]
  49. Dong, P.; Tao, Y.; Yang, Y.; Wang, W. Expression of retinoic acid receptors in intestinal mucosa and the effect of vitamin A on mucosal immunity. Nutrition 2010, 26, 740–745. [Google Scholar] [CrossRef]
  50. Luo, M.; Yeruva, S.; Liu, Y.; Chodisetti, G.; Riederer, B.; Menon, M.B.; Tachibana, K.; Doi, T.; Seidler, U.E. IL-1β-induced downregulation of the multifunctional PDZ adaptor PDZK1 is attenuated by ERK inhibition, RXRα, or PPARα stimulation in enterocytes. Front. Physiol. 2017, 8, 00061. [Google Scholar] [CrossRef]
Figure 1. The NE lesion score for the jejunum. Circles, squares, forward triangles and inverted triangles indicate individual samples in Ctrl, VitA, NE and VitA + NE groups, respectively. Ctrl, control; VitA, vitamin A; NE, necrotic enteritis. # Indicates the significant main effects of NE challenge vs. unchallenged (p < 0.05).
Life 13 01122 g001
Figure 2. Serum immune parameters in broiler chickens among groups. Serum total protein (A), albumin (B), globulin (C), IgA (D) and IgG (E) levels were analyzed. Data are expressed as mean and SE from 14 chickens. Ig, immunoglobulin; Ctrl, control; VitA, vitamin A; NE, necrotic enteritis.
Life 13 01122 g002
Figure 3. The CD3+ T cell counts in jejunal villus (A) and crypt (B) in broiler chickens among groups. Data are expressed as mean and SE from 14 chickens. Ctrl, control; VitA, vitamin A; NE, necrotic enteritis.
Life 13 01122 g003
Figure 4. The mRNA expression of cytokines in the jejunum (AD) and spleen (EH) in broiler chickens among groups. Data are expressed as mean and SE from 14 chickens. a,b Bars with different letters differ significantly (p < 0.05). * Indicates the significant main effects of VitA supplementation vs. no supplementation (p < 0.05). # Indicates the significant main effects of NE challenge vs. unchallenged (p < 0.05). IFN-γ, interferon-γ; IL, interleukin; TGF-β4, transforming growth factor-β4; Ctrl, control; VitA, vitamin A; NE, necrotic enteritis.
Life 13 01122 g004
Figure 5. The mRNA expression of genes involved in the JAK/STAT signaling pathway in the jejunum (AE) and spleen (FJ) in broiler chickens among groups. Data are expressed as mean and SE from 14 chickens. a,b Bars with different letters differ significantly (p < 0.05). * Indicates the significant main effects of VitA supplementation vs. no supplementation (p < 0.05). JAK, Janus kinase; STAT, signal transducer and activator of transcription; Ctrl, control; VitA, vitamin A; NE, necrotic enteritis.
Life 13 01122 g005
Figure 6. The hepatic VitA content (A) and serum PGE2 level (B) in broiler chickens among groups. Data are expressed as mean and SE from 14 chickens. a,b Bars with different letters differ significantly (p < 0.05). * Indicates the significant main effects of VitA supplementation vs. no supplementation (p < 0.05). Ctrl, control; VitA, vitamin A; NE, necrotic enteritis; PGE2, prostaglandin E2.
Life 13 01122 g006
Figure 7. The mRNA expression of genes involved in retinoic acid synthesis in the jejunum (AC) and spleen (DF) in broiler chickens among groups. Data were expressed as mean and SE from 14 chickens. a,b Bars with different letters differ significantly (p < 0.05). # Indicates the significant main effects of NE challenge vs. unchallenged (p < 0.05). Adh-1, aldehyde dehydrogenase-1; RALDH, retinal dehydrogenase; Ctrl, control; VitA, vitamin A; NE, necrotic enteritis.
Life 13 01122 g007
Figure 8. The mRNA expression of genes encoding RAR and RXR in the jejunum (AE) and spleen (FJ) in broiler chickens among groups. Data are expressed as mean and SE from 14 chickens. *Indicates the significant main effects of VitA supplementation vs. no supplementation (p < 0.05). #Indicates the significant main effects of NE challenge vs. unchallenged (p < 0.05). RAR, retinoic acid receptor; RXR, retinoid receptor X; Ctrl, control; VitA, vitamin A; NE, necrotic enteritis.
Life 13 01122 g008
Figure 9. The heat map showing the Pearson correlation analysis among parameters. Pearson correlation coefficients are indicated with the colored bar from blue to red. The significance of Pearson correlation coefficients is indicated with asterisks, where * p < 0.05 and ** p < 0.01.
Life 13 01122 g009
Table 1. The composition and nutrient levels of basal diets.
Item (%, Unless Otherwise Indicated)Starter Diet (d 1–21)Grower Diet
(d 22–28)
Ingredients
Corn (crude protein, 7.8%)51.7357.68
Soybean meal (crude protein, 43.0%)40.7335.15
Soybean oil3.363.66
Dicalcium phosphate1.921.33
Limestone1.161.26
Sodium chloride0.350.35
DL-Methionine (98%)0.260.13
Choline chloride (50%)0.250.20
Vitamin premix 10.040.04
Trance mineral premix 20.200.20
Calculated nutrient levels
Metabolic energy (Mcal/kg)2.923.00
Crude protein21.5019.50
Calcium1.000.90
Available Phosphorus0.450.35
Lysine1.171.04
Methionine 0.570.40
Threonine0.820.74
1 The vitamin premix supplied the following per kilogram of diet: vitamin D3, 2500 IU; vitamin K3 2.65 mg; vitamin E, 30 IU; vitamin B1, 2 mg; vitamin B2, 6 mg; vitamin B12, 0.025 mg; biotin, 0.0325 mg; folic acid, 1.25 mg; pantothenic acid, 12 mg; nicotinic acid, 50 mg. 2 The trace mineral premix supplied the following per kilogram of diet: copper, 8 mg; iron, 80 mg; zinc, 75 mg; manganese, 100 mg; selenium, 0.15 mg; iodine, 0.35 mg.
Table 2. Primers used for quantitative real-time PCR.
Gene NameAccession NumberForward Sequence (5′-3′)Reverse Sequence (5′-3′)Annealing and Extension Temperature (°C)
β-actinNM_205518GAGAAATTGTGCGTGACATCACCTGAACCTCTCATTGCCA60
IFN-γY07922AGCTGACGGTGGACCTATTATTGGCTTTGCGCTGGATTC60
IL-13AJ621735CCAGGGCATCCAGAAGCCAGTGCCGGCAAGAAGTT62
IL-17AJ493595CTCCGATCCCTTATTCTCCTCAAGCGGTTGTGGTCCTCAT62
TGF-β4M31160CGGGACGGATGAGAAGAACCGGCCCACGTAGTAAATGAT60
JAK1XM_015290965TGCACCGTGACTTAGCAGCAAGTCTGAATCAAGCATTCTGGAGCATACC 60
JAK2XM_015280061TCGCTATGGCATTATTCGGTGGGGTTTGGTCCTTTT60
STAT1XM_015289392TAAAGAGGGAGCAATCACATCAGGGAAAGTAACAGC60
STAT5XM_015299590TCCCACCTGGAGGATTCATTCTTCAGCACCTCCATCAC60
STAT6XM_015274736GCAACCTCTACCCCAACATCCCTTTCGCTTTCCACT62
Adh-1NM_204577GAAGGAGCTGGGATTGTGGCTGCATTCTCCACACTG58
RALDH-2AF064253CAAGACATGAACCCATCGGAGCTGGAGCAATCTTCC60
RALDH-3AF246710AGGCAGCATTCCAGAGAGTCAGCCAGCTTGTGTAGG60
RAR-αNM_204536AGGAGCTGATCGAGAAGGGAGCTGTTGTTCGTGGTG60
RAR-βNM_205326GCATCAGTGCAAAAGGTGTGTCAGTGGTTCGTGTCC60
RAR-γNM_205294GATGAAGATCACCGACCTGTCCTCCTCGAACATCTCG60
RXR-αNM_204536GATGCGAGACATGCAGATGGTCGGGGTATTTGTGCTTG60
RXR-γNM_205294CCAAGACGGAGGC ATACAGGGAGCGATGGGAGAAGGAT60
IFN-γ, interferon-γ; IL, interleukin; TGF-β4, transforming growth factor-β4; Adh-1, aldehyde dehydrogenase-1; RALDH, retinal dehydrogenase; RAR, retinoic acid receptor; RXR, retinoid receptor X; JAK, Janus kinase; STAT, signal transducer and activator of transcription.
Table 3. Effects of VitA on serum biochemical indices for NE-challenged broilers.
ItemCtrlVitANEVitA + NESEMp-Values
VitANEVitA × NE
Total bilirubin (mg/dL)1.14 1.031.07 1.06 0.02 0.145 0.665 0.263
Glucose (mg/dL)255.23253.46245.45236.212.310.2040.0030.386
Total glyceride (mg/dL)44.5455.7136.9232.702.530.4530.0020.100
Total cholesterol (mg/dL)118.42126.26117.29119.651.720.1410.2610.426
High-density lipoprotein (mg/dL)108.26112.61108.57110.991.630.3100.8440.771
Low-density lipoprotein (mg/dL)19.4925.7419.2221.440.710.0020.0770.119
Calcium (mg/dL)10.8911.0310.4910.570.100.5640.0360.872
Phosphorus (mg/dL)6.565.685.985.370.11<0.0010.0150.452
Uric acid (mg/dL)287.74 229.71 239.22 174.56 13.12 0.016 0.040 0.893
Aspartate aminotransferase (U/L)46.9264.2154.0965.232.350.002 0.348 0.479
Alanine aminotransferase (U/L)0.93 0.85 0.79 0.79 0.05 0.689 0.325 0.689
Alkaline phosphatase (U/L)4322.9 ab4478.5 ab5287.9 a3825.0 b190.710.0780.6700.030
Glutamyl transpeptidase (U/L)19.43 21.64 18.79 20.29 0.62 0.141 0.424 0.775
Creatine kinase (U/L)2454.52583.22017.92970.4138.680.0500.9270.132
a,b Means with different superscript letters differ significantly (p < 0.05). Ctrl, control; VitA, vitamin A; NE, necrotic enteritis.
Disclaimer/Publisher’s Note: The statements, opinions and data contained in all publications are solely those of the individual author(s) and contributor(s) and not of MDPI and/or the editor(s). MDPI and/or the editor(s) disclaim responsibility for any injury to people or property resulting from any ideas, methods, instructions or products referred to in the content.

