


Mass Spectrometry-Based Investigation of Sugarcane Exposed to Five Different Pesticides
 , , , , , and
Abstract
:1. Introduction
2. Materials and Methods
2.1. Plant Materials
2.2. Preparation of Extracts and Fractions
2.3. Liquid Chromatography–Mass Spectrometry Instrumentation, Conditions, and Compound Identification
2.4. Statistical Analysis (PCA and PLS)
2.5. Biometric Variables
2.6. Agro-Industrial Variables
3. Results
3.1. Agro-Industrial and Biometric Variables
3.2. Statistical and Metabolic Profile
4. Discussion
5. Conclusions
Supplementary Materials
Author Contributions
Funding
Institutional Review Board Statement
Informed Consent Statement
Data Availability Statement
Acknowledgments
Conflicts of Interest
References
- Su, W.; Huang, L.; Ling, H.; Mao, H.; Huang, N.; Su, Y.; Ren, Y.; Wang, D.; Xu, L.; Muhammad, K.; et al. Sugarcane Calcineurin B-like (CBL) Genes Play Important but Versatile Roles in Regulation of Responses to Biotic and Abiotic Stresses. Sci. Rep. 2020, 10, 167. [Google Scholar] [CrossRef]
- de Aquino, G.S.; de Conti Medina, C.; da Costa, D.C.; Shahab, M.; Santiago, A.D. Sugarcane Straw Management and Its Impact on Production and Development of Ratoons. Ind. Crops Prod. 2017, 102, 58–64. [Google Scholar] [CrossRef]
- Shi, F.; Lu, Y.; Sun, D.; An, Y. Imidacloprid Triggers Transcriptomic Changes in Sugarcane (Saccharum Officinarum). Trop. Plant Biol. 2021, 14, 203–212. [Google Scholar] [CrossRef]
- Afolami, S.; Solomon, S.; Daramola, F. Biodiversity of Plant-Parasitic Nematodes of Sugarcane in Bacita, Nigeria. J. Èntomol. Nematol. 2014, 6, 71–79. [Google Scholar] [CrossRef]
- de Araujo Noronha, M.; de Fátima Silva Muniz, M.; de Menezes Cruz, M.; Assunção, M.C.; da Cunha e Castro, J.M.; de Oliveira, E.R.L.; dos Santos Miranda, C.G.; Machado, A.C.Z. Espécies de Meloidogyne e de Pratylenchus Em Áreas Cultivadas Com Cana-de-Açúcar No Estado de Alagoas. Cienc. Rural 2017, 4, e20151402. [Google Scholar] [CrossRef]
- Martins, G.D.; Trindade Galo, M.D.L.B. Caracterização Espectral da Cana-de-Açúcar Infectada por Nematoides e Migdolus Fryanus por Espectrorradiometria de Campo. Bol. Cienc. Geod. 2015, 21, 783–796. [Google Scholar] [CrossRef]
- Oka, Y. Effects of Fluensulfone, Fluopyram and Their Combination on Meloidogyne Incognita and M. Javanica Hatching and Infectivity. Eur. J. Plant Pathol. 2022, 164, 269–281. [Google Scholar] [CrossRef]
- Cao, X.; Yang, H.; Liu, C.; Zhang, R.; Maienfisch, P.; Xu, X. Bioisosterism and Scaffold Hopping in Modern Nematicide Research. J. Agric. Food Chem. 2022, 70, 11042–11055. [Google Scholar] [CrossRef]
- Abd-Elgawad, M.M.M. Biological Control Agents in the Integrated Nematode Management of Potato in Egypt. Egypt. J. Biol. Pest Control 2020, 30, 1–13. [Google Scholar] [CrossRef]
- Chen, J.-X.; Song, B.-A. Natural Nematicidal Active Compounds: Recent Research Progress and Outlook. J. Integr. Agric. 2021, 20, 2015–2031. [Google Scholar] [CrossRef]
- Glassop, D.; Roessner, U.; Bacic, A.; Bonnett, G.D. Changes in the Sugarcane Metabolome with Stem Development. Are They Related to Sucrose Accumulation? Plant Cell Physiol. 2007, 48, 573–584. [Google Scholar] [CrossRef]
- Falco, M.C.; Marbach, P.A.S.; Pompermayer, P.; Lopes, F.C.C.; Silva-Filho, M.C. Mechanisms of Sugarcane Response to Herbivory. Genet. Mol. Biol. 2001, 24, 113–122. [Google Scholar] [CrossRef]
- Ferreira, D.A.; Martins, M.C.M.; Cheavegatti-Gianotto, A.; Carneiro, M.S.; Amadeu, R.R.; Aricetti, J.A.; Wolf, L.D.; Hoffmann, H.P.; de Abreu, L.G.F.; Caldana, C. Metabolite Profiles of Sugarcane Culm Reveal the Relationship among Metabolism and Axillary Bud Outgrowth in Genetically Related Sugarcane Commercial Cultivars. Front. Plant Sci. 2018, 9, 857. [Google Scholar] [CrossRef]
- Perlo, V.; Botha, F.C.; Furtado, A.; Hodgson-Kratky, K.; Henry, R.J. Metabolic Changes in the Developing Sugarcane Culm Associated with High Yield and Early High Sugar Content. Plant Direct 2020, 4, e00276. [Google Scholar] [CrossRef]
- Zhou, J.-R.; Sun, H.-D.; Ali, A.; Rott, P.C.; Javed, T.; Fu, H.-Y.; Gao, S.-J. Quantitative Proteomic Analysis of the Sugarcane Defense Responses Incited by Acidovorax Avenae Subsp. Avenae Causing Red Stripe. Ind. Crop. Prod. 2021, 162, 113275. [Google Scholar] [CrossRef]
- Ali, A.; Khan, M.; Sharif, R.; Mujtaba, M.; Gao, S.J. Sugarcane Omics: An Update on the Current Status of Research and Crop Improvement. Plants 2019, 8, 344. [Google Scholar] [CrossRef]
- Leme, G.M.; Coutinho, I.D.; Creste, S.; Hojo, O.; Carneiro, R.L.; Bolzani, V.D.S.; Cavalheiro, A.J. HPLC-DAD Method for Metabolic Fingerprinting of the Phenotyping of Sugarcane Genotypes. Anal. Methods 2014, 6, 7781–7788. [Google Scholar] [CrossRef]
- Abreu, L.S.; Alves, I.M.; Do Espirito Santo, R.F.; Do Nascimento, Y.M.; Dantas, C.A.G.; Dos Santos, G.G.L.; Le Hyaric, M.; Guedes, M.L.S.; Da Silva, M.S.; Villarreal, C.F.; et al. Antinociceptive Compounds and LC-DADESIMS n Profile from Dictyoloma Vandellianum Leaves. PLoS ONE 2019, 14, 1–17. [Google Scholar] [CrossRef]
- Dantas, C.A.G.; Abreu, L.S.; da Cunha, H.N.; Veloso, C.A.G.; Souto, A.L.; de Fátima Agra, M.; de Oliveira Costa, V.C.; da Silva, M.S.; Tavares, J.F. Dereplication of Phenolic Derivatives of Three Erythroxylum Species Using Liquid Chromatography Coupled with ESI-MSn and HRESIMS. Phytochem. Anal. 2021, 32, 1011–1026. [Google Scholar] [CrossRef]
- Tautenhahn, R.; Patti, G.J.; Rinehart, D.; Siuzdak, G. XCMS Online: A Web-Based Platform to Process Untargeted Metabolomic Data. Anal. Chem. 2012, 84, 5035–5039. [Google Scholar] [CrossRef] [PubMed]
- van Dlllewijn, C. Botany of Sugarcane. In Botany of Sugarcane; Chronica Botanica Company: Leyden, The Netherlands, 1952. [Google Scholar]
- CONSECANA-Conselho dos Produtores de Cana-de-Açúcar, Açúcar e Álcool do Estado de São Paulo; São Paulo, 2011.
- Marques, T.A.; Neves, L.C.G.; Rampazo, E.M.; Deltrejo Junior, E.L.; de Souza, F.C.; Marques, P.A.A. TRS Value of Sugarcane According to Bioenergy and Sugar Levels. Acta Sci. Agron. 2015, 37, 347–353. [Google Scholar] [CrossRef]
- Ogawa, E.M.; Costa, H.B.; Ventura, J.A.; Caetano, L.C.S.; Pinto, F.E.; Oliveira, B.G.; Barroso, M.E.S.; Scherer, R.; Endringer, D.C.; Romão, W. Chemical Profile of Pineapple Cv. Vitória in Different Maturation Stages Using Electrospray Ionization Mass Spectrometry. J. Sci. Food Agric. 2018, 98, 1105–1116. [Google Scholar] [CrossRef]
- Becker, L.; Poutaraud, A.; Hamm, G.; Muller, J.F.; Merdinoglu, D.; Carré, V.; Chaimbault, P. Metabolic Study of Grapevine Leaves Infected by Downy Mildew Using Negative Ion Electrospray—Fourier Transform Ion Cyclotron Resonance Mass Spectrometry. Anal. Chim. Acta 2013, 795, 44–51. [Google Scholar] [CrossRef]
- Coutinho, I.D.; Baker, J.M.; Ward, J.L.; Beale, M.H.; Creste, S.; Cavalheiro, A.J. Metabolite Profiling of Sugarcane Genotypes and Identification of Flavonoid Glycosides and Phenolic Acids. J. Agric. Food Chem. 2016, 64, 4198–4206. [Google Scholar] [CrossRef]
- Grieman, M.M.; Greaves, J.; Saltzman, E.S. Vanillic Acid in Polar Ice Cores A Method for Analysis of Vanillic Acid in Polar Ice Cores Vanillic Acid in Polar Ice Cores. Clim. Past Discuss. 2014, 10, 2805–2820. [Google Scholar] [CrossRef]
- Clifford, M.N.; Knight, S.; Kuhnert, N. Discriminating between the Six Isomers of Dicaffeoylquinic Acid by LC-MSn. J. Agric. Food Chem. 2005, 53, 3821–3832. [Google Scholar] [CrossRef]
- Brito, A.; Ramirez, J.E.; Areche, C.; Sepúlveda, B.; Simirgiotis, M.J. HPLC-UV-MS Profiles of Phenolic Compounds and Antioxidant Activity of Fruits from Three Citrus Species Consumed in Northern Chile. Molecules 2014, 19, 17400–17421. [Google Scholar] [CrossRef]
- Clifford, M.N.; Wu, W.; Kirkpatrick, J.; Kuhnert, N. Profiling the Chlorogenic Acids and Other Caffeic Acid Derivatives of Herbal Chrysanthemum by LC-MSn. J. Agric. Food Chem. 2007, 55, 929–936. [Google Scholar] [CrossRef]
- Pereira, O.R.; Silva, A.M.S.; Domingues, M.R.M.; Cardoso, S.M. Identification of Phenolic Constituents of Cytisus Multiflorus. Food Chem. 2012, 131, 652–659. [Google Scholar] [CrossRef]
- Cabral, B.; Gonçalves, T.A.F.; Abreu, L.S.; Andrade, A.W.L.; De Azevedo, F.D.L.A.A.; De Castro, F.D.; Tavares, J.F.; Guerra, G.C.B.; De Rezende, A.A.; De Medeiros, I.A.; et al. Cardiovascular Effects Induced by Fruit Peels from Passiflora Edulis in Hypertensive Rats and Fingerprint Analysis by HPLC-ESI-MS Nspectrometry. Planta Med. 2022, 88, 356–366. [Google Scholar] [CrossRef] [PubMed]
- Ferreres, F.; Sousa, C.; Valentão, P.; Andrade, P.B.; Seabra, R.M.; Gil-Izquierdo, Á. New C-Deoxyhexosyl Flavones and Antioxidant Properties of Passiflora Edulis Leaf Extract. J. Agric. Food Chem. 2007, 55, 10187–10193. [Google Scholar] [CrossRef] [PubMed]
- Ncube, E.N.; Mhlongo, M.I.; Piater, L.A.; Steenkamp, P.A.; Dubery, I.A.; Madala, N.E. Analyses of Chlorogenic Acids and Related Cinnamic Acid Derivatives from Nicotiana Tabacum Tissues with the Aid of UPLC-QTOF-MS/MS Based on the in-Source Collision-Induced Dissociation Method. Chem. Cent. J. 2014, 8, 66. [Google Scholar] [CrossRef] [PubMed]
- Clifford, M.N.; Johnston, K.L.; Knight, S.; Kuhnert, N. Hierarchical Scheme for LC-MSn Identification of Chlorogenic Acids. J. Agric. Food Chem. 2003, 51, 2900–2911. [Google Scholar] [CrossRef]
- Clifford, M.N.; Jaganath, I.B.; Ludwig, I.A.; Crozier, A. Chlorogenic Acids and the Acyl-Quinic Acids: Discovery, Biosynthesis, Bioavailability and Bioactivity. Nat. Prod. Rep. 2017, 34, 1391–1421. [Google Scholar] [CrossRef]
- Hamany Djande, C.Y.; Pretorius, C.; Tugizimana, F.; Piater, L.A.; Dubery, I.A. Metabolomics: A Tool for Cultivar Phenotyping and Investigation of Grain Crops. Agronomy 2020, 10, 831. [Google Scholar] [CrossRef]
- Shen, S.; Zhan, C.; Yang, C.; Fernie, A.R.; Luo, J. Metabolomics-Centered Mining of Plant Metabolic Diversity and Function: Past Decade and Future Perspectives. Mol. Plant 2023, 16, 43–63. [Google Scholar] [CrossRef] [PubMed]
- Dinardo-Miranda, L.L.; Fracasso, J.V.; Miranda, I.D. Damage Caused by Meloidogyne Javanica and Pratylenchus Zeae to Sugarcane Cultivars. Summa Phytopathol. 2019, 45, 146–156. [Google Scholar] [CrossRef]
- Dinardo-Miranda, L.L.; Miranda, I.D.; da Silva, H.D.S.; Fracasso, J.V. Biological Control of Phytoparasitic Nematodes in Sugarcane Fields. Pesqui. Agropecuária Trop. 2022, 52, 1–7. [Google Scholar] [CrossRef]
- Ebone, L.A.; Kovaleski, M.; Deuner, C.C. Nematicides: History, Mode, and Mechanism Action. Plant Sci. Today 2019, 6, 91–97. [Google Scholar] [CrossRef]
- Gowda, M.T.; Meena, B.R.; Krishnan, N.; Manjunath, M.; Sellaperumal, C.; Rai, A.B.; Singh, A.; Manimurugan, C.; Patil, J.; Pandey, K.K.; et al. Antimicrobial Peptides Producing Native Bacillus Spp. for the Management of Root-Knot Nematode Meloidogyne Incognita Infecting Okra (Abelmoschus Esculentus L. Moench). Biol. Control 2022, 171, 104951. [Google Scholar] [CrossRef]
- Dimkić, I.; Janakiev, T.; Petrović, M.; Degrassi, G.; Fira, D. Plant-Associated Bacillus and Pseudomonas Antimicrobial Activities in Plant Disease Suppression via Biological Control Mechanisms—A Review. Physiol. Mol. Plant Pathol. 2022, 117, 101754. [Google Scholar] [CrossRef]
- Leiss, K.A.; Maltese, F.; Choi, Y.H.; Verpoorte, R.; Klinkhamer, P.G.L. Identification of Chlorogenic Acid as a Resistance Factor for Thrips in Chrysanthemum. Plant Physiol. 2009, 150, 1567–1575. [Google Scholar] [CrossRef]
- Kundu, A.; Vadassery, J. Chlorogenic Acid-Mediated Chemical Defence of Plants against Insect Herbivores. Plant Biol. 2019, 21, 185–189. [Google Scholar] [CrossRef] [PubMed]
- Sabino, A.R.; Tavares, S.S.; Riffel, A.; Li, J.V.; Oliveira, D.J.A.; Feres, C.I.M.A.; Henrique, L.; Oliveira, J.S.; Correia, G.D.S.; Sabino, A.R.; et al. 1H NMR Metabolomic Approach Reveals Chlorogenic Acid as a Response of Sugarcane Induced by Exposure to Diatraea Saccharalis. Ind. Crops Prod. 2019, 140, 111651. [Google Scholar] [CrossRef]
- Volpi e Silva, N.; Mazzafera, P.; Cesarino, I. Should I Stay or Should I Go: Are Chlorogenic Acids Mobilized towards Lignin Biosynthesis? Phytochemistry 2019, 166, 112063. [Google Scholar] [CrossRef]
- Dixon, R.A.; Barros, J. Lignin Biosynthesis: Old Roads Revisited and New Roads Explored. Open Biol. 2019, 9, 1–14. [Google Scholar] [CrossRef]
- Bottcher, A.; Cesarino, I.; dos Santos, A.B.; Vicentini, R.; Sampaio Mayer, J.L.; Vanholme, R.; Morreel, K.; Goeminne, G.; Magalhães Silva Moura, J.C.; Nobile, P.M.; et al. Lignification in Sugarcane: Biochemical Characterization, Gene Discovery, and Expression Analysis in Two Genotypes Contrasting for Lignin Content. Plant Physiol. 2013, 163, 1539–1557. [Google Scholar] [CrossRef]
- Ralph, J.; Kim, H.; Lu, F.; Smith, R.A.; Karlen, S.D.; Nuoendagula; Yoshioka, K.; Eugene, A.; Liu, S.; Sener, C.; et al. Lignins and Lignification. In Recent Advances in Polyphenol Research; Wiley: New York, NY, USA, 2023; pp. 1–50. [Google Scholar] [CrossRef]
- Collucci, D.; Bueno, R.C.A.; Milagres, A.M.F.; Ferraz, A. Sucrose Content, Lignocellulose Accumulation and in Vitro Digestibility of Sugarcane Internodes Depicted in Relation to Internode Maturation Stage and Saccharum Genotypes. Ind. Crops Prod. 2019, 139, 111543. [Google Scholar] [CrossRef]
- Jardim-Messeder, D.; Felix-Cordeiro, T.; Barzilai, L.; de Souza-Vieira, Y.; Galhego, V.; Bastos, G.A.; Valente-Almeida, G.; Aiube, Y.R.A.; Faria-Reis, A.; Corrêa, R.L.; et al. Genome-Wide Analysis of General Phenylpropanoid and Monolignol-Specific Metabolism Genes in Sugarcane. Funct. Integr. Genom. 2021, 21, 73–99. [Google Scholar] [CrossRef]
- dos Santos, W.D.; Gonzaga, D.E.R.; Salvador, V.H.; Freitas, D.L.; Joia, B.M.; Oliveira, D.M.; Leite, D.C.C.; Bido, G.S.; Finger-Teixeira, A.; de Souza, A.P.; et al. Natural Lignin Modulators Improve Lignocellulose Saccharification of Field-Grown Sugarcane, Soybean, and Brachiaria. Biomass Bioenergy 2023, 168, 106684. [Google Scholar] [CrossRef]


| Agro-Industrial and Biometric Variables | |||||||||
|---|---|---|---|---|---|---|---|---|---|
| Fazenda Santa Emília Ii-Field 14 | |||||||||
| Products | Plants/Meter | Height (m) | Culm Diameter (mm) | Weight (kg) | Agricultural Productivity (t ha−1) | TRS * (kg) | TSH ** (t ha−1) | ||
| Base | Quite | Apex | |||||||
| T1—Control | 10.4 ± 0.6 | 2.4 ± 0.2 | 25 ± 1.5 | 22.9 ± 1.2 | 20.1 ± 1.2 | 520 ± 61.6 | 78.7 ± 9.3 | 156.8 ± 8.3 | 12.36 |
| T2—Bacillus subtilis and Bacillus licheniformis | 10.5 ± 0.9 | 2.5 ± 0.2 | 24.1 ± 1.2 | 21.9 ± 0.6 | 19.1 ± 1.1 | 568 ± 63 | 86.0 ± 9.5 | 153.1 ± 5.6 | 13.18 |
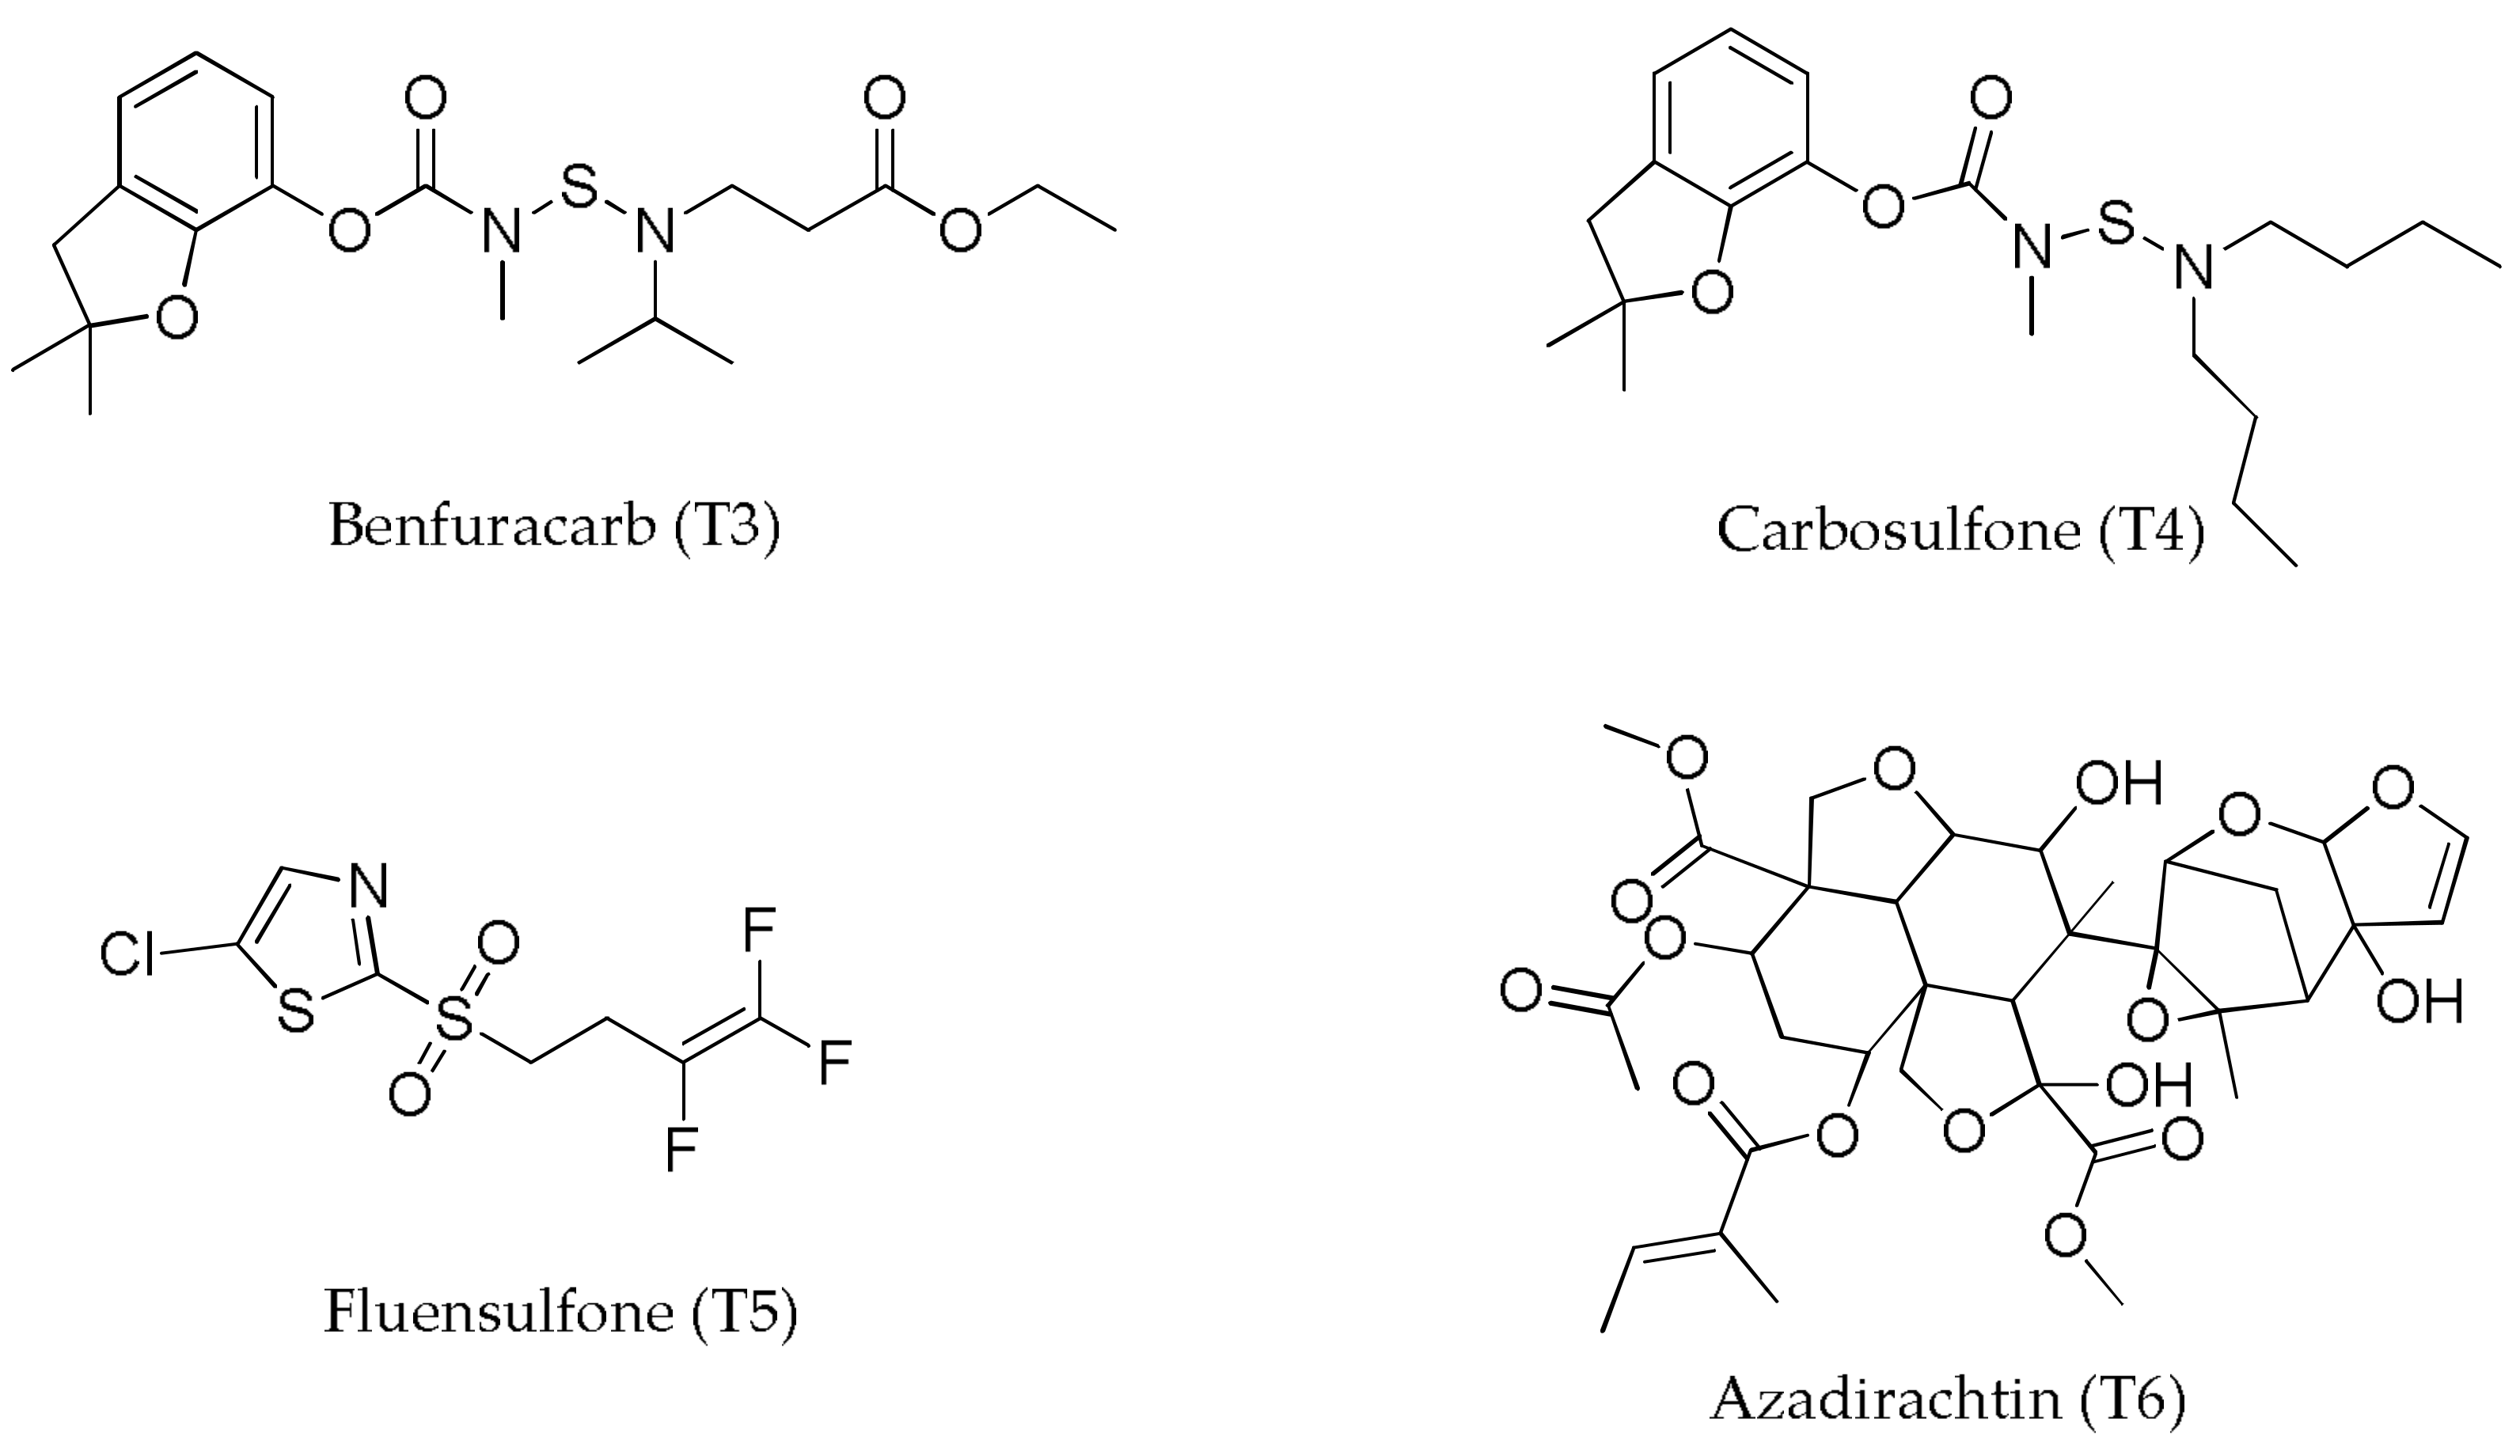
| T3—Benfuracarb | 9.9 ± 0.7 | 2.2 ± 0.2 | 24.5 ± 1.7 | 22.4 ± 1.7 | 19.3 ± 1.5 | 506 ± 64 | 76.6 ± 10 | 154.8 ± 8.7 | 11.87 |
| T4—Carbosulfan | 10.3 ± 0.5 | 2.4 ± 0.2 | 24.7 ± 1.6 | 23.1 ± 1.3 | 19.9 ± 1.6 | 574 ± 76.7 | 86.9 ± 11 | 155.9 ± 7.1 | 13.56 |
| T5—Fluensulfone | 11.1 ± 0.4 | 2.4 ± 0.2 | 25.1 ± 2.2 | 22.3 ± 1.2 | 19.2 ± 1.7 | 544 ± 79 | 82.4 ± 10 | 157.1 ± 5.1 | 12.95 |
| T6—Azadirachtin | 10.8 ± 1.1 | 2.4 ± 0.2 | 24.3 ± 1.4 | 22.4 ± 1.4 | 20 ± 1.6 | 522 ± 66 | 79.0 ± 8.9 | 155.1 ± 7.9 | 12.27 |
| General Average | 10.5 | 2.4 | 24.6 | 22.5 | 19.6 | 539 | 81.66 | 155.5 | 12.70 |
| Treatment | Peak No. | RT (min) | UV (nm) | m/z [M−H]− | Molecular Formula | Error (ppm) | MS2/MS3 | Annotation | Ref. |
|---|---|---|---|---|---|---|---|---|---|
| 1, 3, 4 | 1 | 8.1 | 253 | 329.0882 | C14H17O9 | −0.2 | MS2 [329]: 149(31); 167(100)/MS3 [329→167]:122(100) | Vanilic acid glucoside | [27] |
| 1, 3, 4 | 2 | 12.3 | 247 | 299.0778 | C13H15O8 | −4.5 | MS2 [299]: 137(100)/MS3 [299→137]: 93(100) | Hydroxybenzoic-4β-glucoside | [27] |
| 1, 3, 4 | 3 | 14.0 | 253 | 329.0888 | C14H17O9 | −2.9 | MS2 [329]: 152(11); 167(100)/MS3 [329→167]: 107(18); 123(59); 151(100) | Vanilic acid glucoside-isomer | [28] |
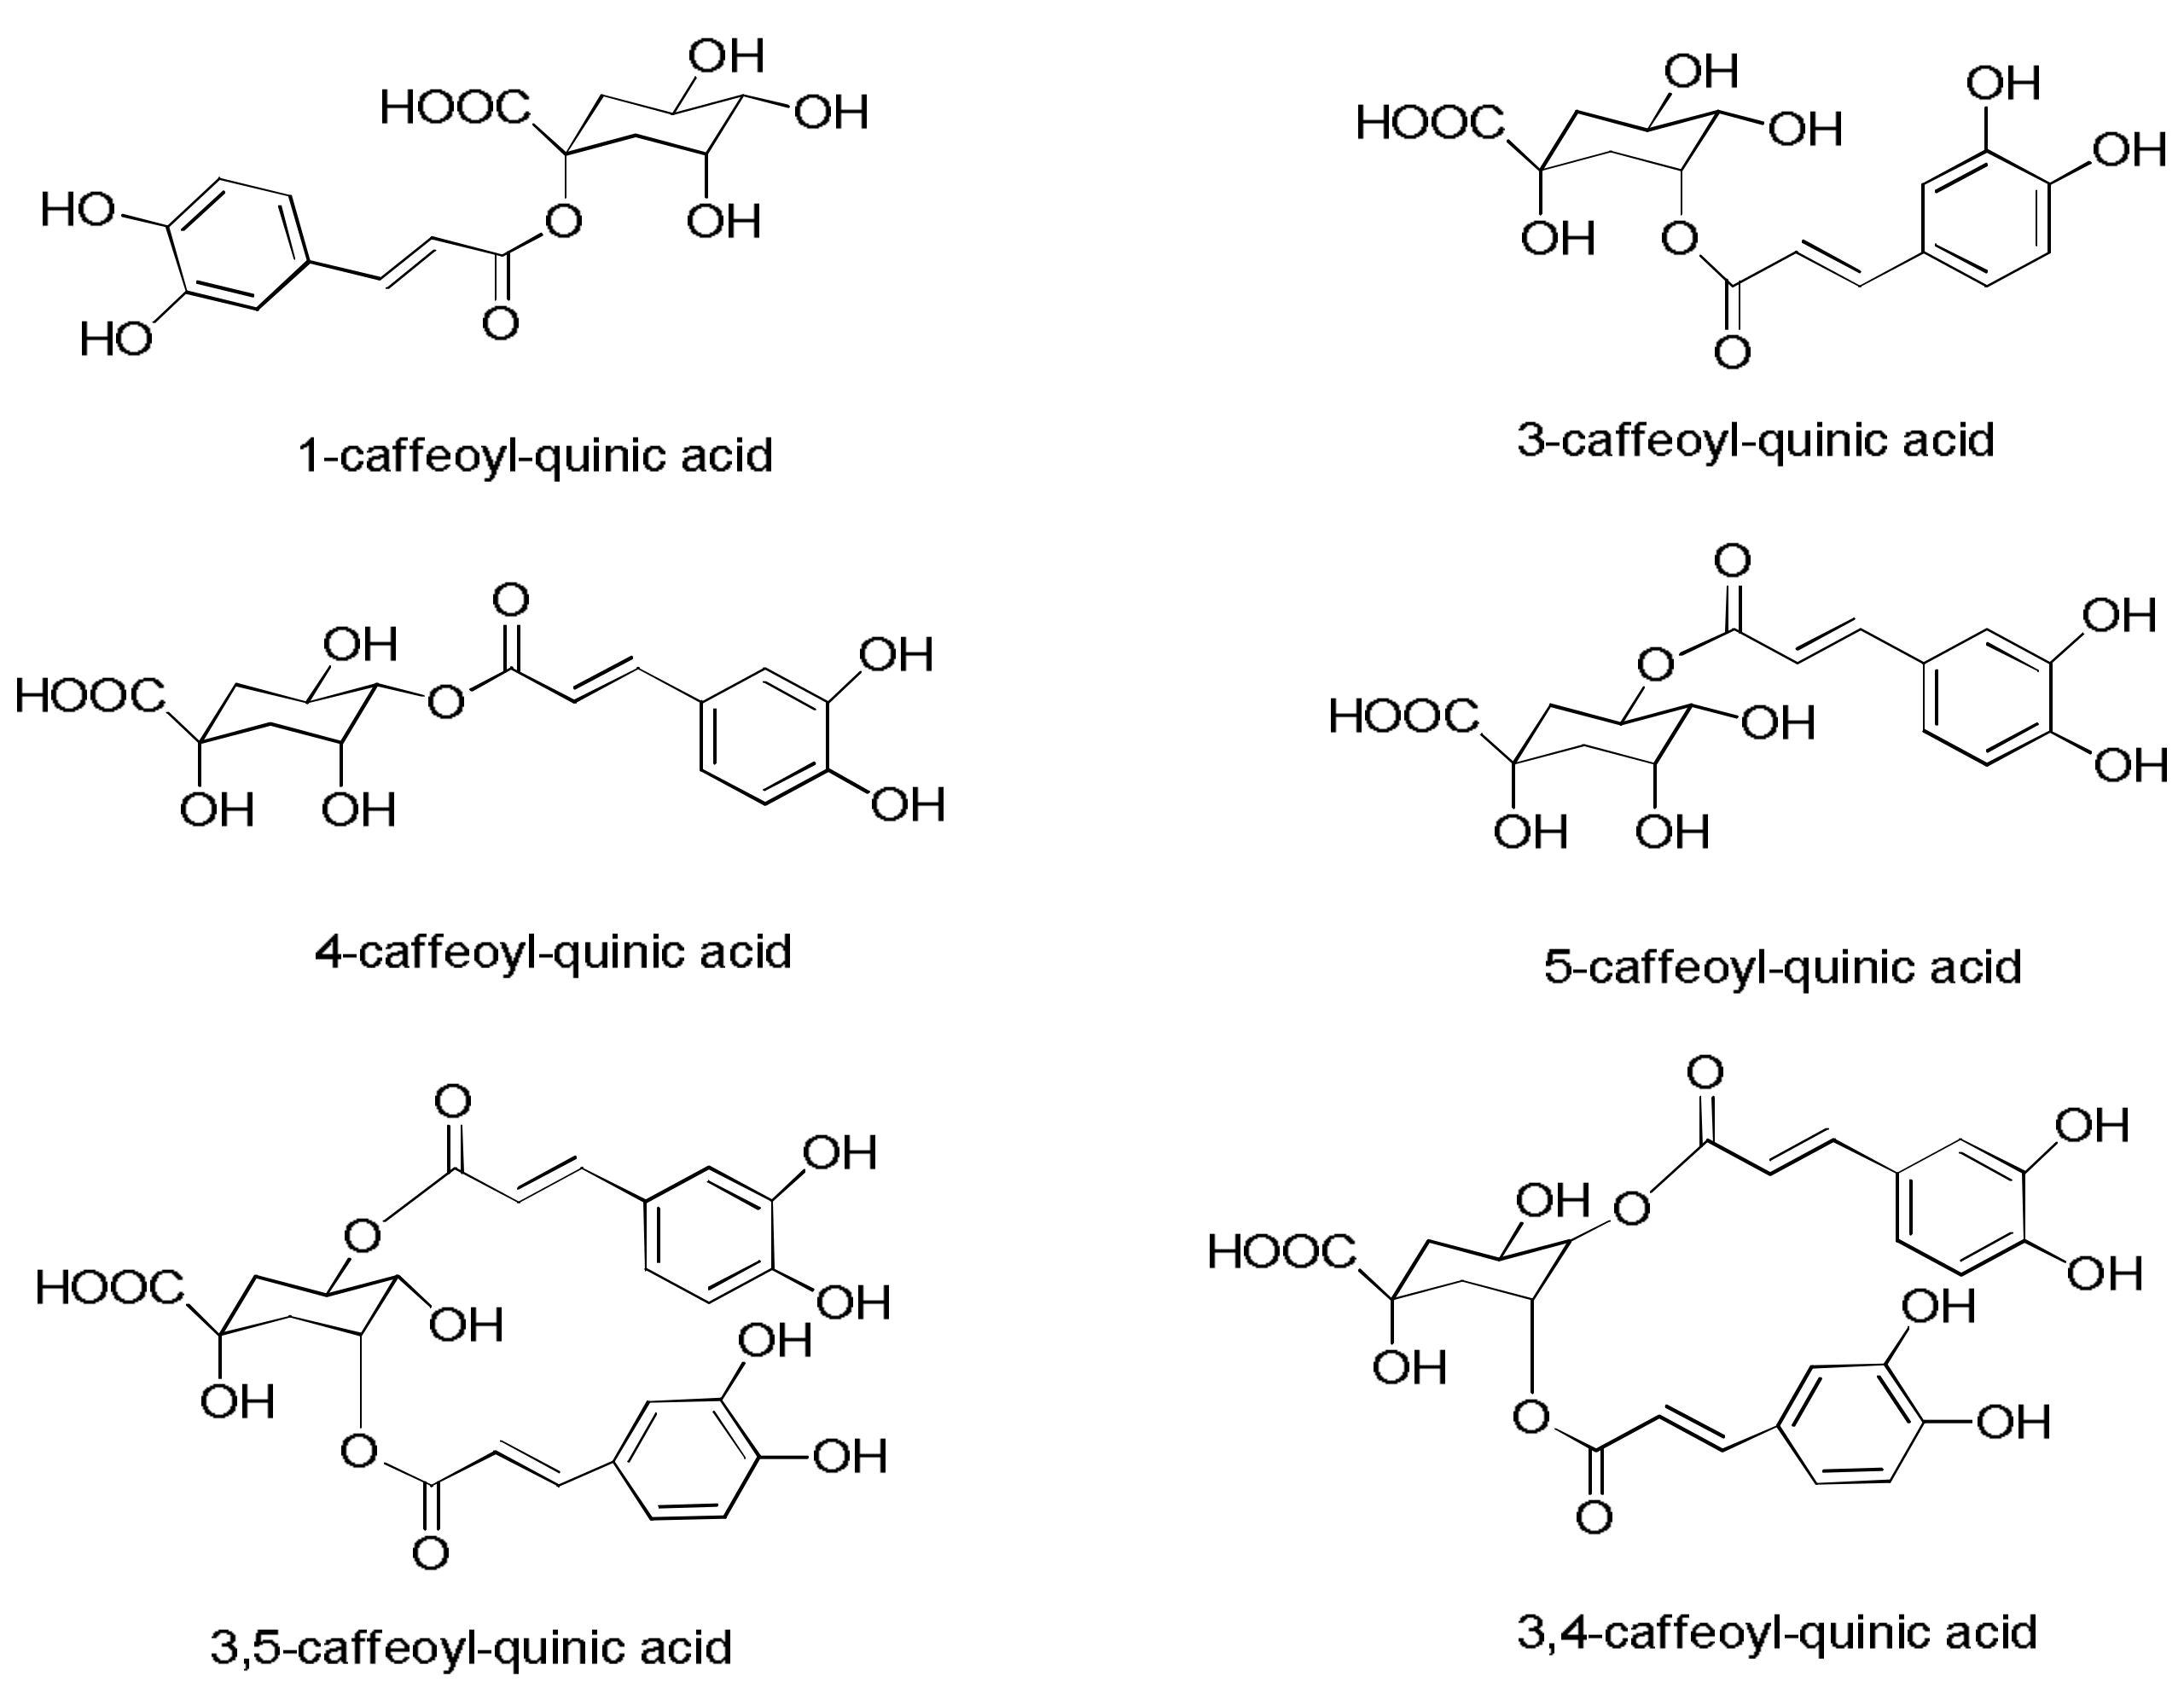
| 1, 3 | 4 | 15.0 | 325 | 353.0890 | C16H17O9 | −3.5 | MS2 [353]: 135(10); 139(38); 191(100)/MS3 [353→191]: 85 (55); 127(100); 173(79) | 3-caffeoylquinic acid | [29] |
| 1, 3 | 5 | 15.6 | 307 | 337.1105 | C13H21O9 | 5.0 | MS2 [337]: 163(100); 191(12)/MS3 [337→163]: 119 (100) | Coumaroylquinic acid | [29] |
| 1, 3 | 6 | 18.0 | 326 | 353.0876 | C16H17O9 | 0.5 | MS2 [353]: 191(100)/MS3 [353→191]: 85(56); 127(100); 173(81) | 1-caffeoylquinic acid | [29] |
| 1, 3 | 7 | 18.6 | 323 | 353.0865 | C16H17O9 | 3.6 | MS2 [353]: 173(100); 179(56); 191(41)/MS3 [353→173]: 71(13); 93(100); 111(58); 155(16) | 4-caffeoylquinic acid | [29] |
| 1, 3 | 8 | 20.2 | 323 | 353.0875 | C16H17O9 | 1.0 | MS2 [353]: 173(2); 179(3); 191(100)/MS3 [353→191]: 85 (71); 127(100); 173(86); | 5-caffeoylquinic acid | [29] |
| 1, 3, 4 | 9 | 20.9 | 276 | 579.1348 | C26H28O15 | 0.4 | MS2 [579]: 369(36); 399(59); 429(15); 441(21); 459(100); 471(6); 489(25)/MS3 [579→459]: 369(100); 399(85); 441(25) | Luteolin-6-C-glucosyl -8-C-arabinosidel | [27] |
| 1, 3, 4 | 10 | 21.7 | 275 | 579.1351 | C26H28O15 | 0.4 | MS2 [579]: 369(55); 399(62); 411(5); 429(19); 441(9); 459(35); 471(19); 489(100); 519(18); 561(10)/MS3 [579→489]: 369(100); 399(65); 429(6) | Luteolin-6-C-arabinosyl-8-C-glucoside | [27] |
| 1, 3, 4 | 11 | 21.8 | 271 | 563.1401 | C26H28O14 | 1.2 | MS2 [563]: 353(100); 365(14); 383(90); 413(17); 425(19); 443(48); 473(63); 503(42); 545(13)/MS3 [563→353]: 297(100); 325(99) | Apigenin-6-C-arabinosyl-8-C-glucoside | [27] |
| 1, 3 | 12 | 22.1 | 271 | 579.1375 | C26H28O15 | −2.8 | MS2 [579]: 369(36); 399(37); 429(15); 459(10); 471(11); 489(100); 519(23); 561(10)/MS3 [579→489]: 369(100); 399(32); 471(5) | Luteolin-6-C-arabinosyl-8-C-glucoside (isomer) | [27] |
| 1, 3, 4 | 13 | 22.1 | 313 | 563.1404 | C26H28O14 | −0.8 | MS2 [563]: 297(6); 353(97); 365(5); 383(75); 413(11); 425(10); 443(100); 473(63); 503(42); 545(13)/MS3 [563→443]: 297(100); 325(99) | Apigenin-6-C-glucosyl-8-C-arabinoside | [27] |
| 1, 3, 4 | 14 | 22.7 | 340 | 447.0921 | C21H19O11 | 2.7 | MS2 [477]: 327(99); 357(100); 429(27)/MS3 [477→357]: 285(27); 297(67); 311(23); 327(13) 339(100) | Luteolin-8-C-glucoside (isoorientin) | [27] |
| 1, 3, 4 | 15 | 22.7 | 272 | 593.1514 | C27H30O15 | 0.4 | MS2 [593]: 309(30); 327(33); 339(19); 357(30); 429(52); 473(100) 575(6)/MS3 [593→473]: 297(37); 327(100) | Apigenin-6.8-C-diglucoside | [30] |
| 1, 3, 4 | 16 | 23.6 | 275 | 431.0971 | C21H20O10 | 2.9 | MS2 [431]: 283(7); 311(100); 341(9)/MS3 [431→311]: 283(100) | Apigenin-8-C-glucoside (vitexin) | [30] |
| 1, 3, 4 | 17 | 23.6 | 328 | 563.1432 | C26H28O14 | −4.6 | MS2 [563]: 353(97); 383(58); 413(13); 443(100); 473(73); 485(7) 503(6); 515(10); 545(9)/MS3 [563→443]: 353(100); 383(15) | Apigenin-6-C-glucosylarabinoside | [31] |
| 1, 3, 4 | 18 | 24.2 | 337 | 447.0913 | C21H20O11 | 4.3 | MS2 [477]: 285(100)/MS3 [477→285]: 151(13); 175(52); 217(60); 257(21); 267(17) | Luteolin-7-O-glucoside | [32] |
| 1, 3 | 19 | 24.3 | 328 | 515.1186 | C25H24O12 | 1.8 | MS2 [515]: 353(100)/MS3 [515→353]: 135(8); 179(39); 191(100) | 3-5-dicaffeoylquinic acid | [27] |
| 1, 3, 4 | 20 | 24.8 | 270 | 431.0976 | C21H20O10 | 1.7 | MS2 [431]: 311(100); 341(37); 413(8)/MS3 [431→311]: 283(100) | Apigenin-6-C-glucoside (Isovitexin) | [30] |
| 1, 3, 4 | 21 | 24.2 | 270 | 577.1556 | C27H30O14 | 1.1 | MS2 [577]: 293(99); 311(7); 323(11); 335(5); 341(9); 413(100); 457(13)/MS3 [577→413]: 283 (100) | Apigenin-6-C-glucosylrhamnoside | [27] |
| 1, 3, 4 | 22 | 25.4 | 271 | 461.1088 | C22H22O11 | 0.4 | MS2 [461]: 285(6); 341(100); 371(24);/MS3 [461→431]: 297(100); 313(18) | Diosmetin-6-C-glucoside | [27] |
| 1, 3 | 23 | 25.3 | 285 | 515.1182 | C25H24O12 | 2.5 | MS2 [515]: 353(100)/MS3 [515→353]: 135(6); 173(100); 179(65); 191(31) | 3-4-dicaffeoylquinic acid | [27] |
| 1, 3, 4 | 24 | 26.4 | 270 | 461.1087 | C22H22O11 | 0.4 | MS2 [461]: 283(20); 299(100); 341(6)/MS3 [461→299]: 283(100) | Diosmetin-8-C-glucoside | [27] |
| 1, 3, 4 | 25 | 27.1 | 270 | 651.1523 | C36H28O12 | -2.3 | MS2 [651]: 271(16); 299(21); 313(32); 329(100)/MS3 [651→329]: 299(7); 314(100) | Tricin-7-O-a-L-rhamnosyl-glucuronide | [27] |
| 1, 3, 4 | 26 | 27.8 | 270 | 585.0544 | C23H22O16S | 2.0 | MS2 [585]: 255(100)/MS3 [585→255]: 97(11); 133(5); 157(10); 167(12); 175(100); 193(96); 211(16); 237(9) | Tricin-7-O-glucuronide-sulfate | [27] |
| 1, 3, 4 | 27 | 29.2 | 271 | 577.1554 | C27H30O14 | 1.5 | MS2 [577]: 413(18); 431(100)/MS3 [577→431]: 369(63); 413(100) | Apigenin -8-C-glucosylrhamnoside | [27] |
Disclaimer/Publisher’s Note: The statements, opinions and data contained in all publications are solely those of the individual author(s) and contributor(s) and not of MDPI and/or the editor(s). MDPI and/or the editor(s) disclaim responsibility for any injury to people or property resulting from any ideas, methods, instructions or products referred to in the content. |
© 2023 by the authors. Licensee MDPI, Basel, Switzerland. This article is an open access article distributed under the terms and conditions of the Creative Commons Attribution (CC BY) license (https://creativecommons.org/licenses/by/4.0/).
Share and Cite
de Souza, T.A.; Rodrigues, G.C.S.; de Souza, P.H.N.; Abreu, L.S.; Pereira, L.C.O.; da Silva, M.S.; Tavares, J.F.; Scotti, L.; Scotti, M.T. Mass Spectrometry-Based Investigation of Sugarcane Exposed to Five Different Pesticides. Life 2023, 13, 1034. https://doi.org/10.3390/life13041034
de Souza TA, Rodrigues GCS, de Souza PHN, Abreu LS, Pereira LCO, da Silva MS, Tavares JF, Scotti L, Scotti MT. Mass Spectrometry-Based Investigation of Sugarcane Exposed to Five Different Pesticides. Life. 2023; 13(4):1034. https://doi.org/10.3390/life13041034
Chicago/Turabian Stylede Souza, Thalisson A., Gabriela C. S. Rodrigues, Pedro H. N. de Souza, Lucas S. Abreu, Laiane C. O. Pereira, Marcelo S. da Silva, Josean F. Tavares, Luciana Scotti, and Marcus Tullius Scotti. 2023. "Mass Spectrometry-Based Investigation of Sugarcane Exposed to Five Different Pesticides" Life 13, no. 4: 1034. https://doi.org/10.3390/life13041034