
Effect of Drought on the Development of Deschampsia caespitosa (L.) and Selected Soil Parameters during a Three-Year Lysimetric Experiment

Abstract
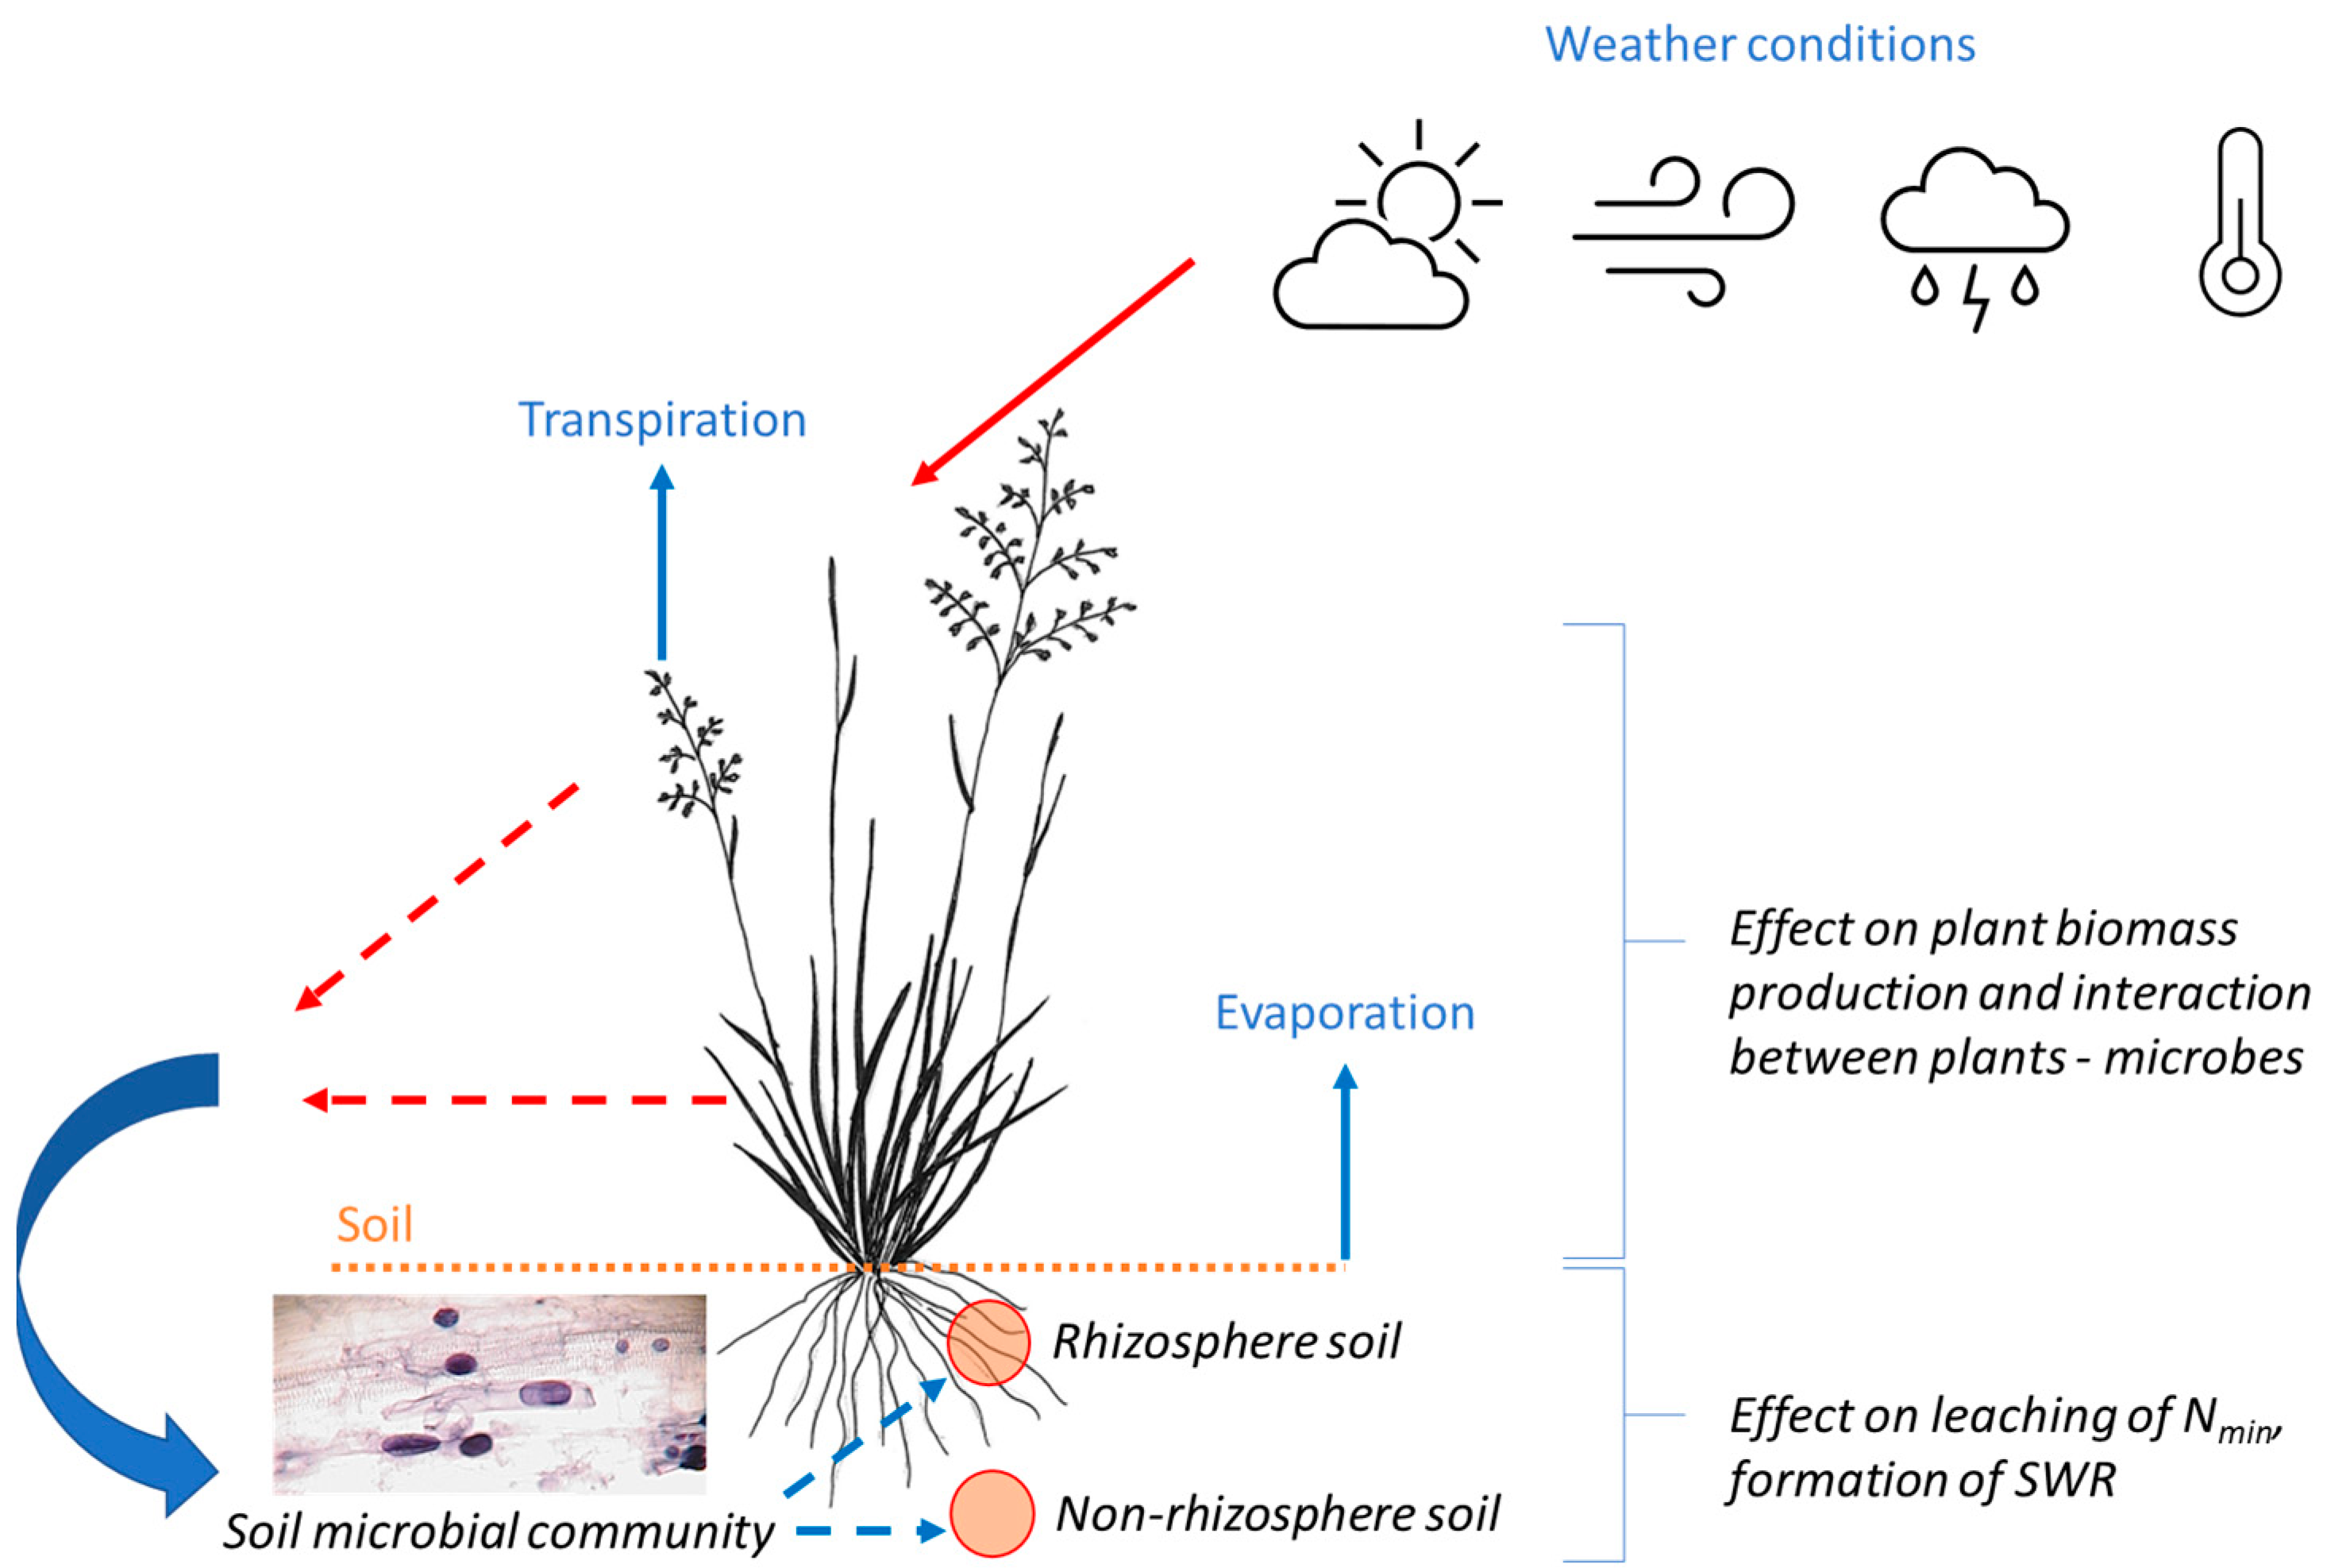
:1. Introduction
2. Materials and Methods
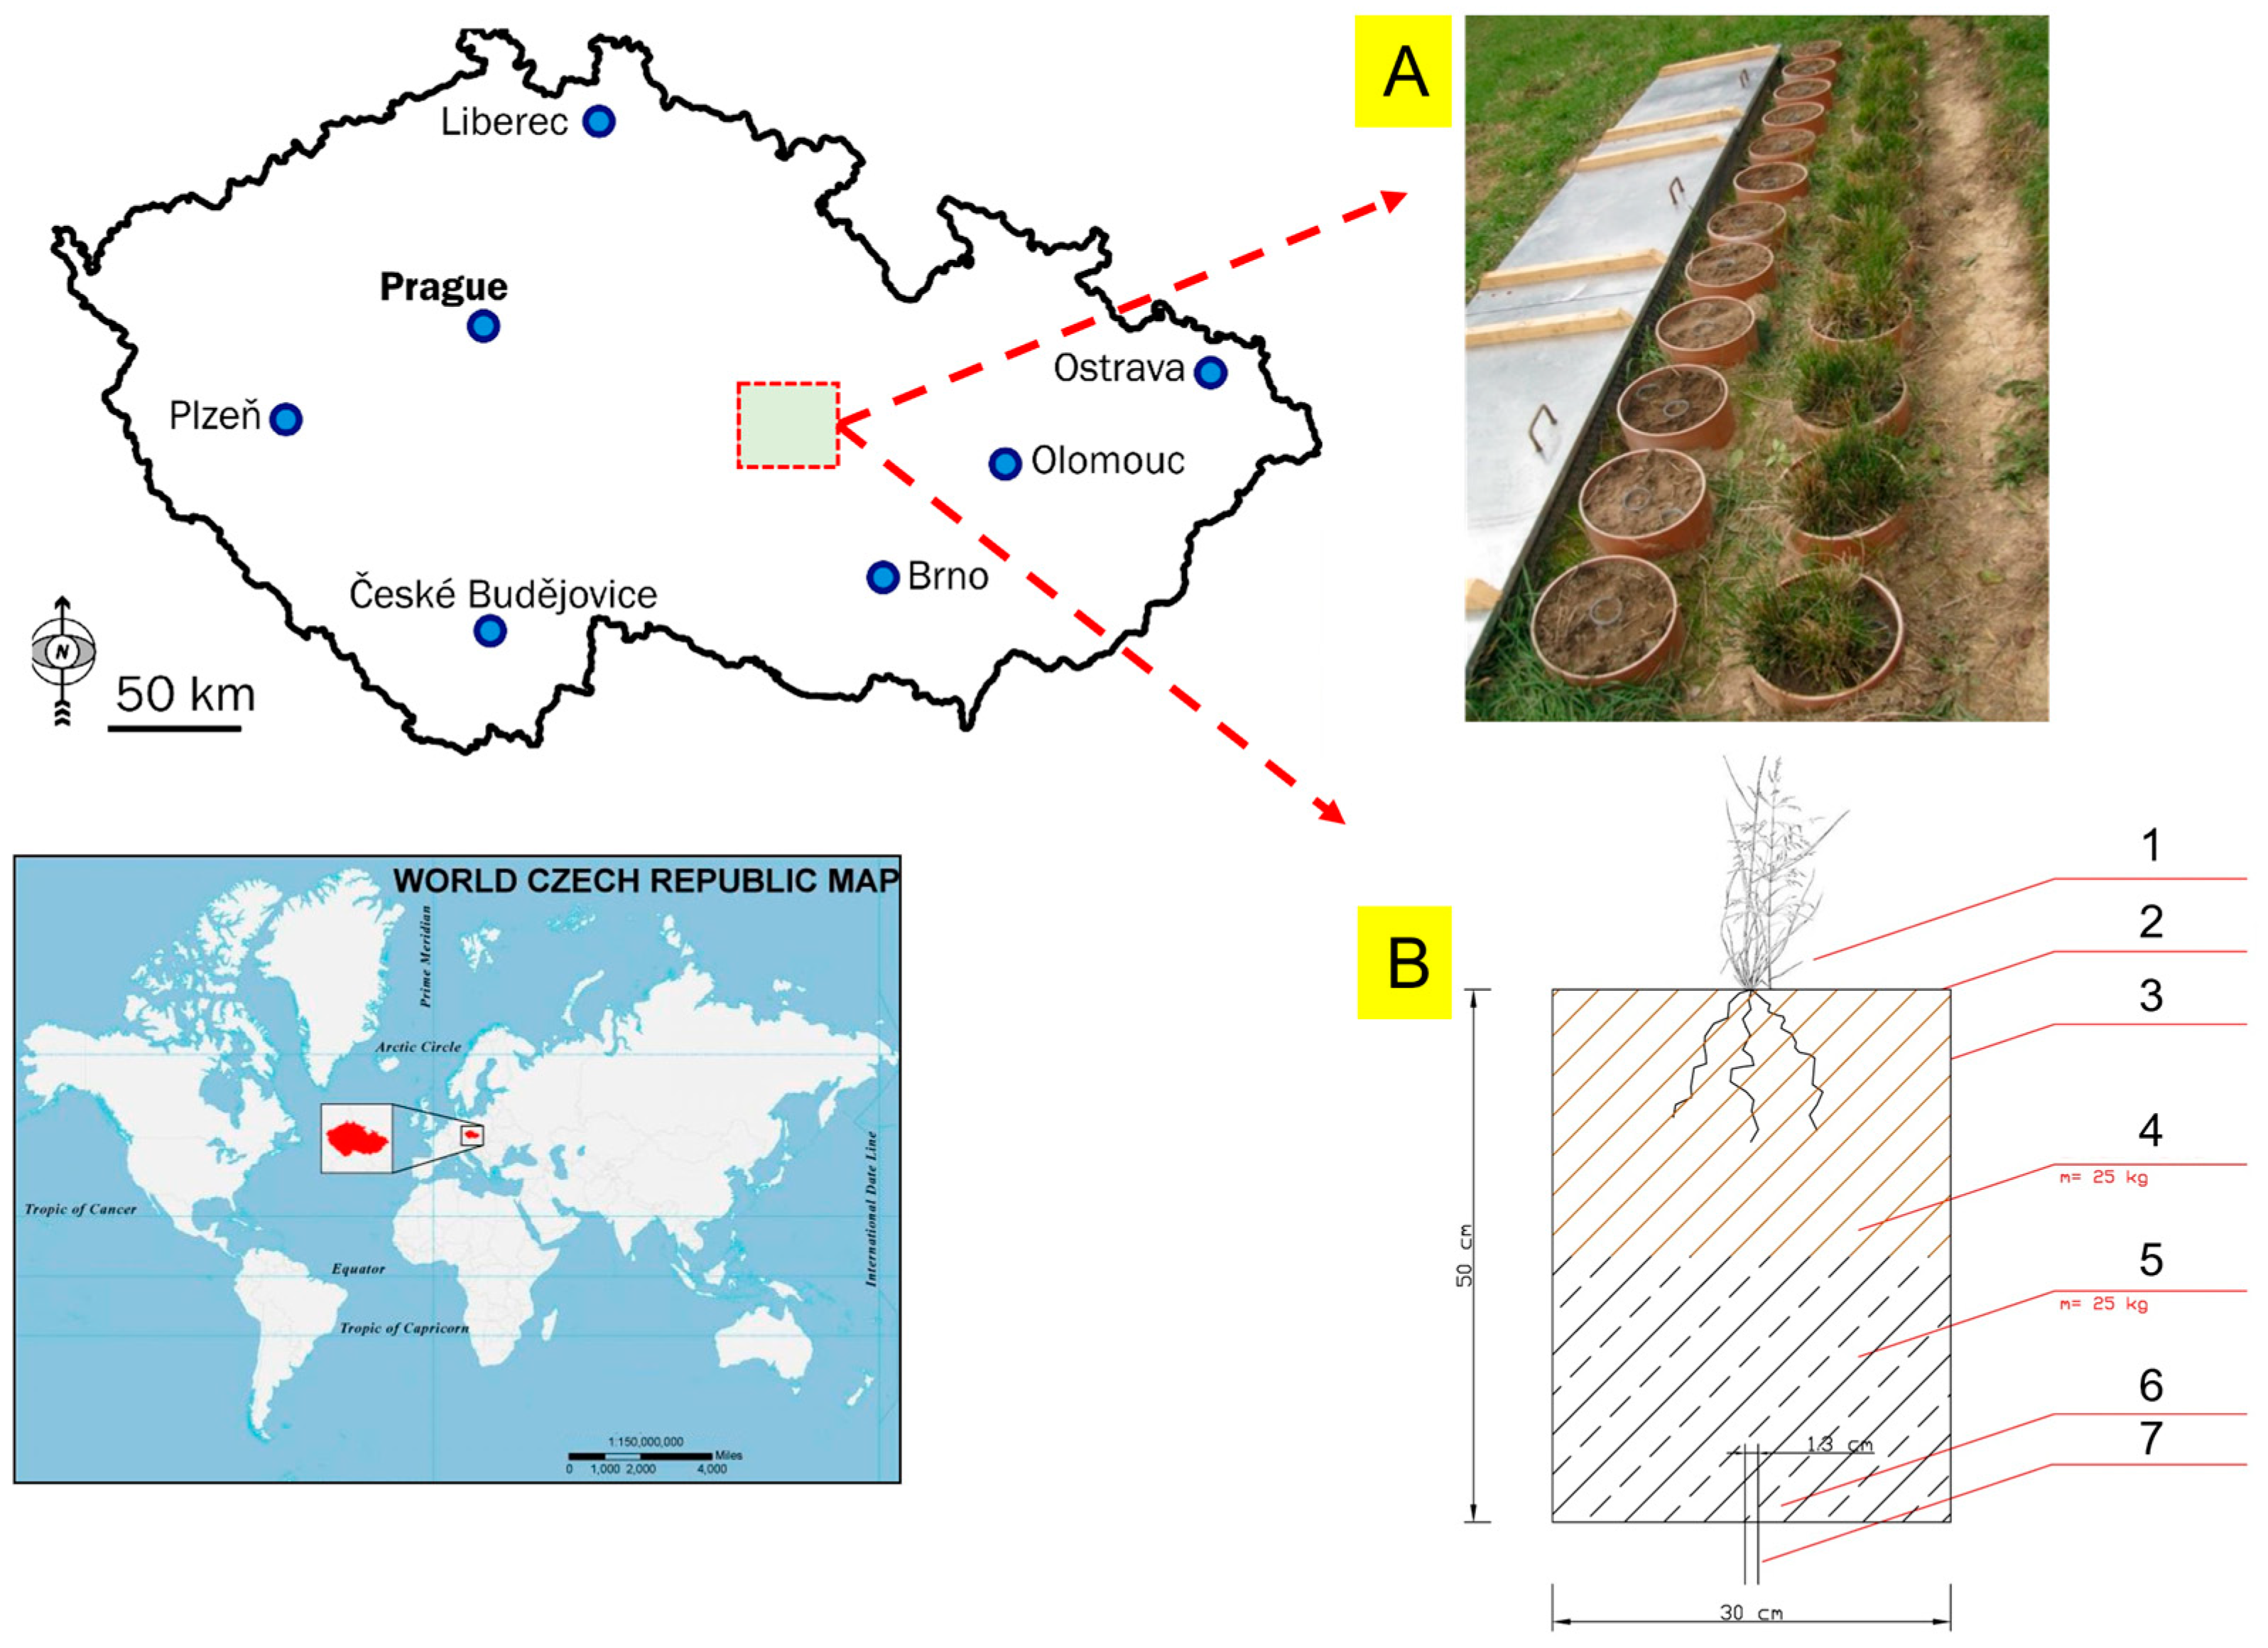
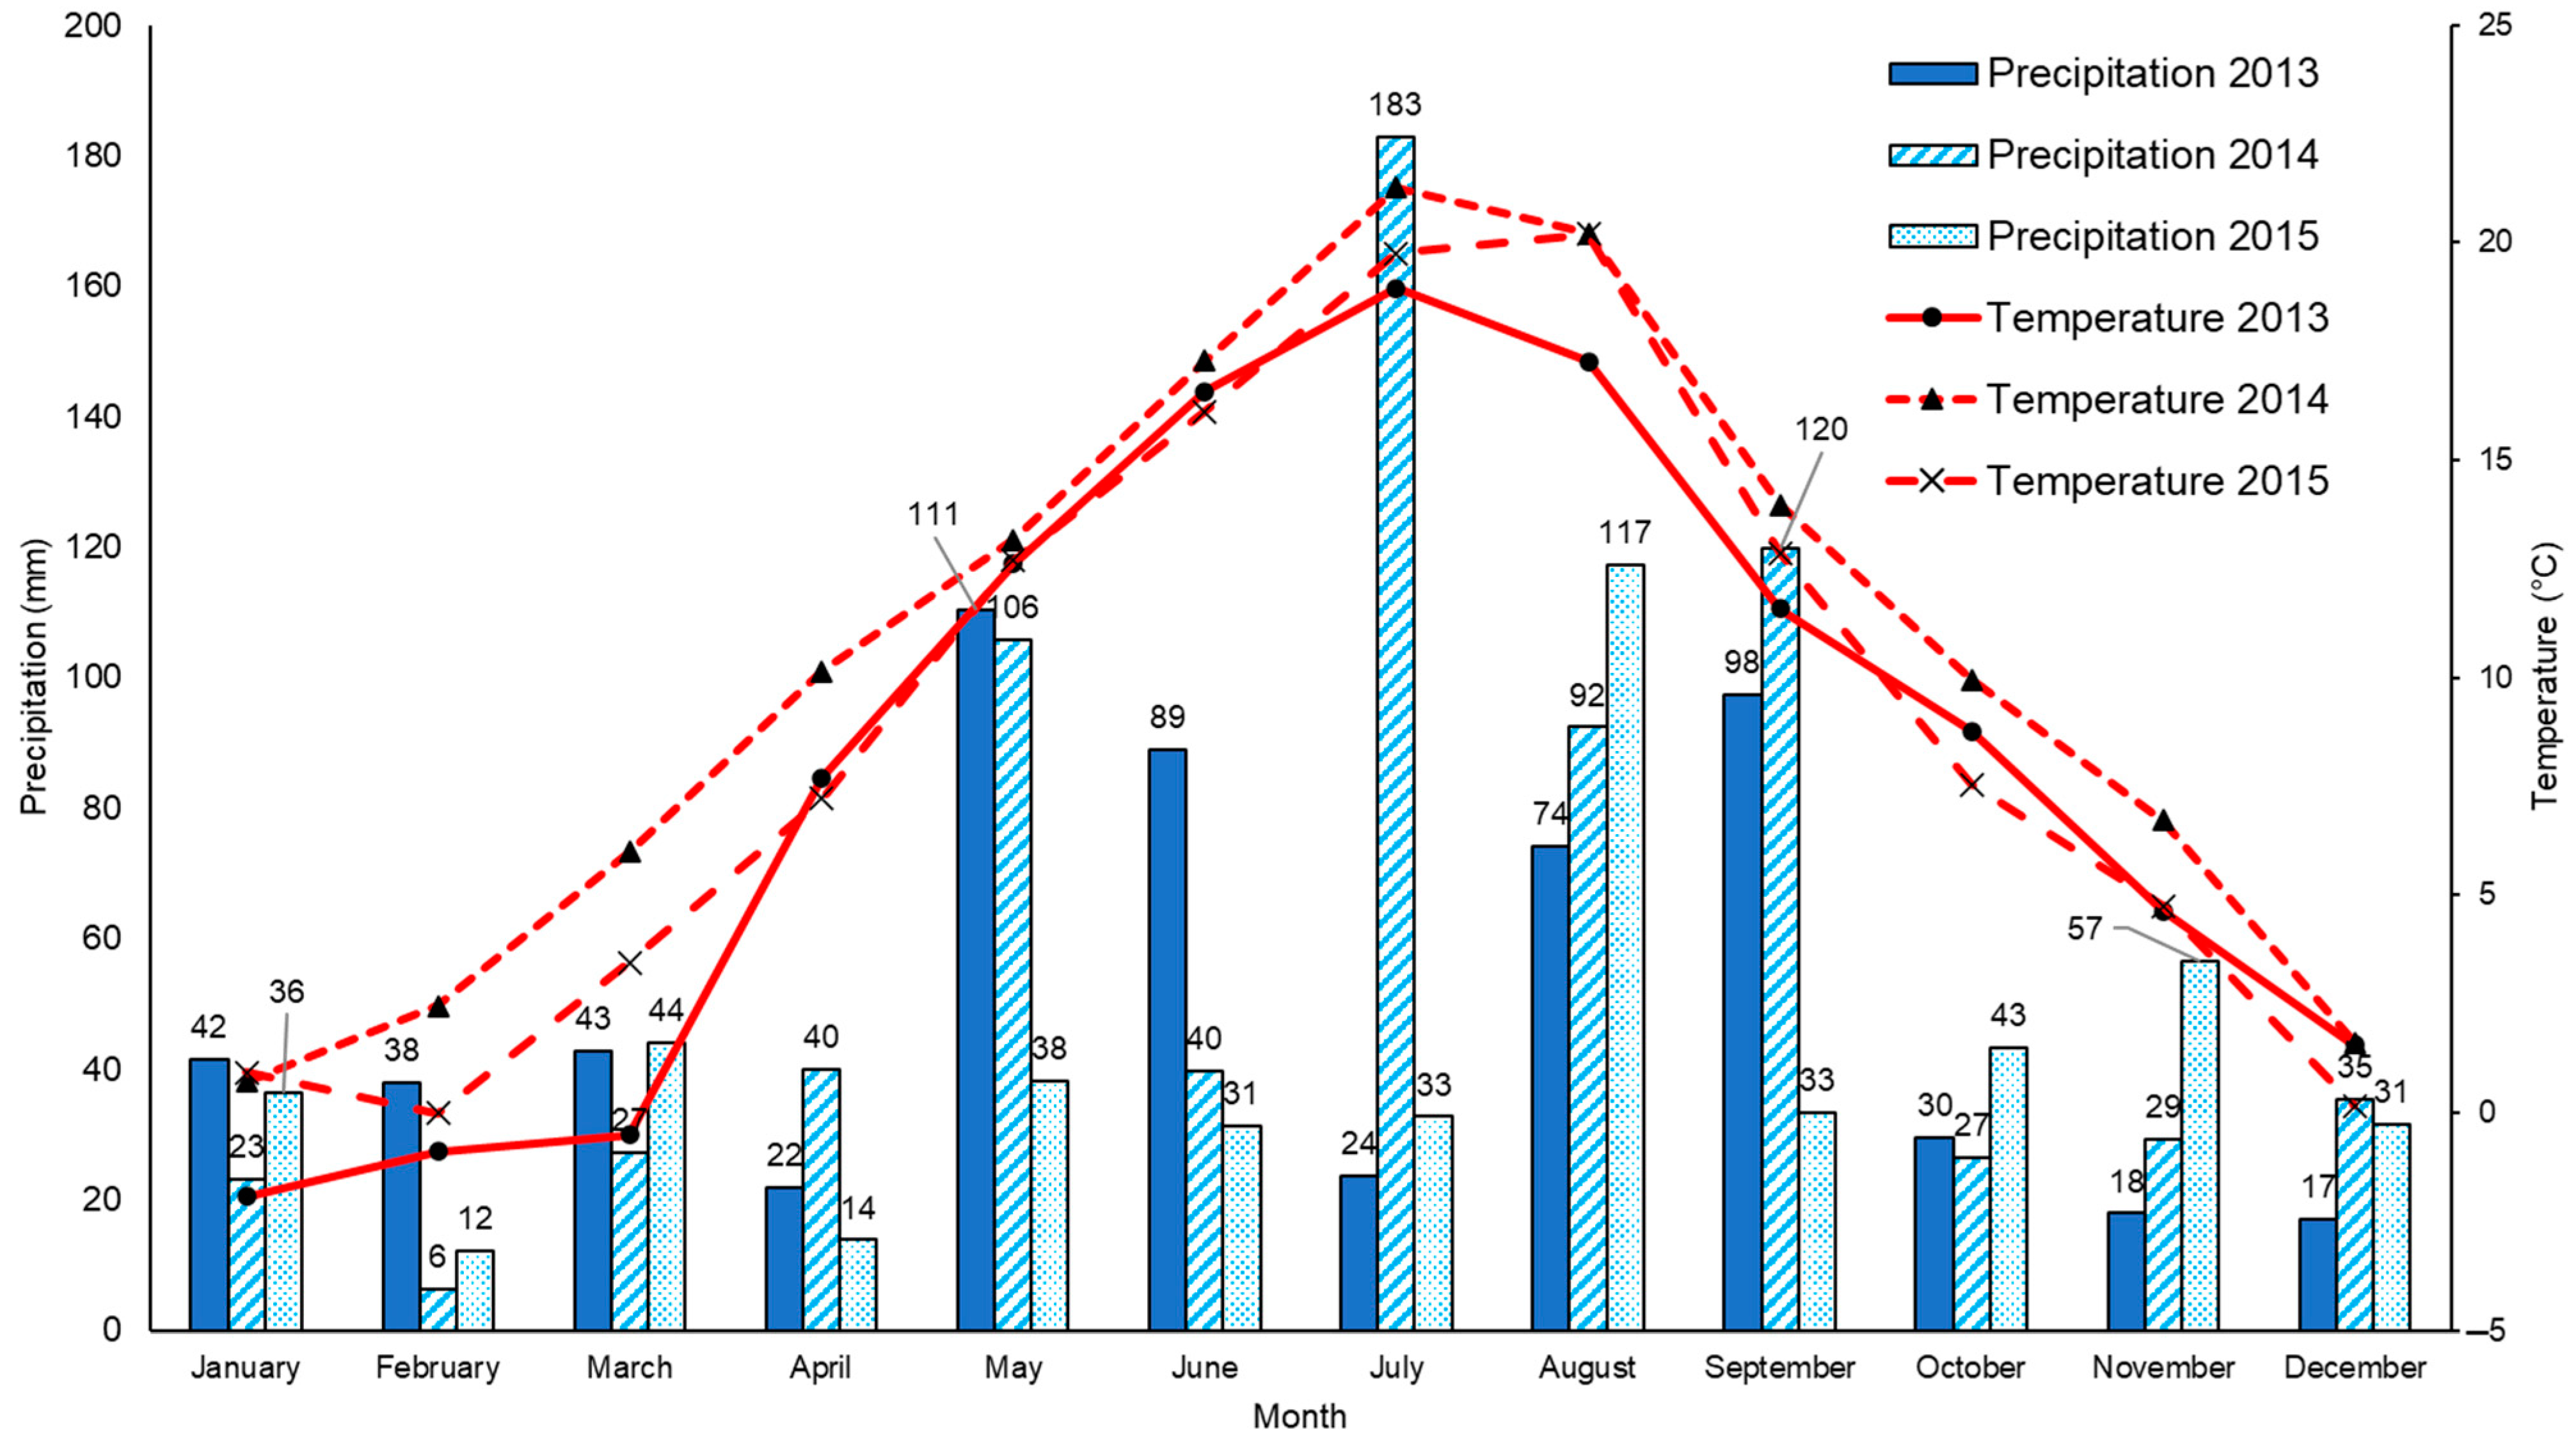
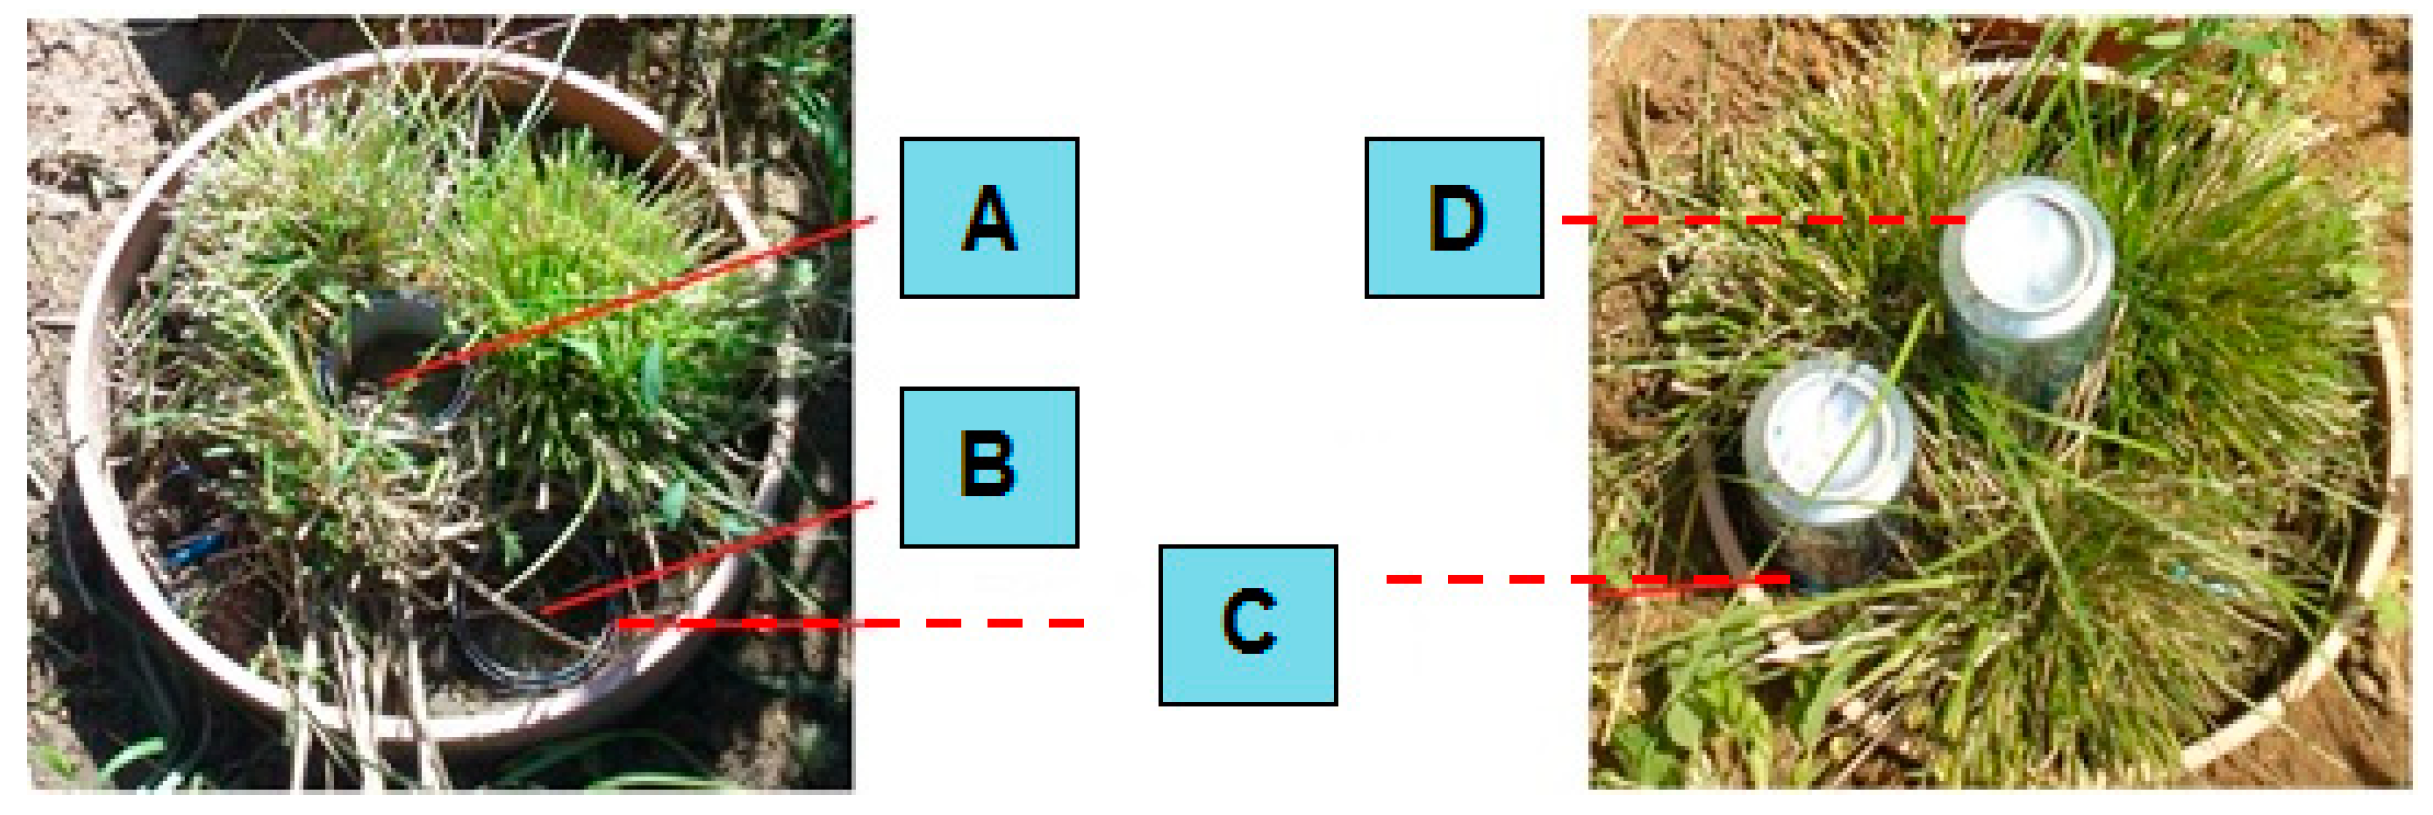
2.1. Field Experiment
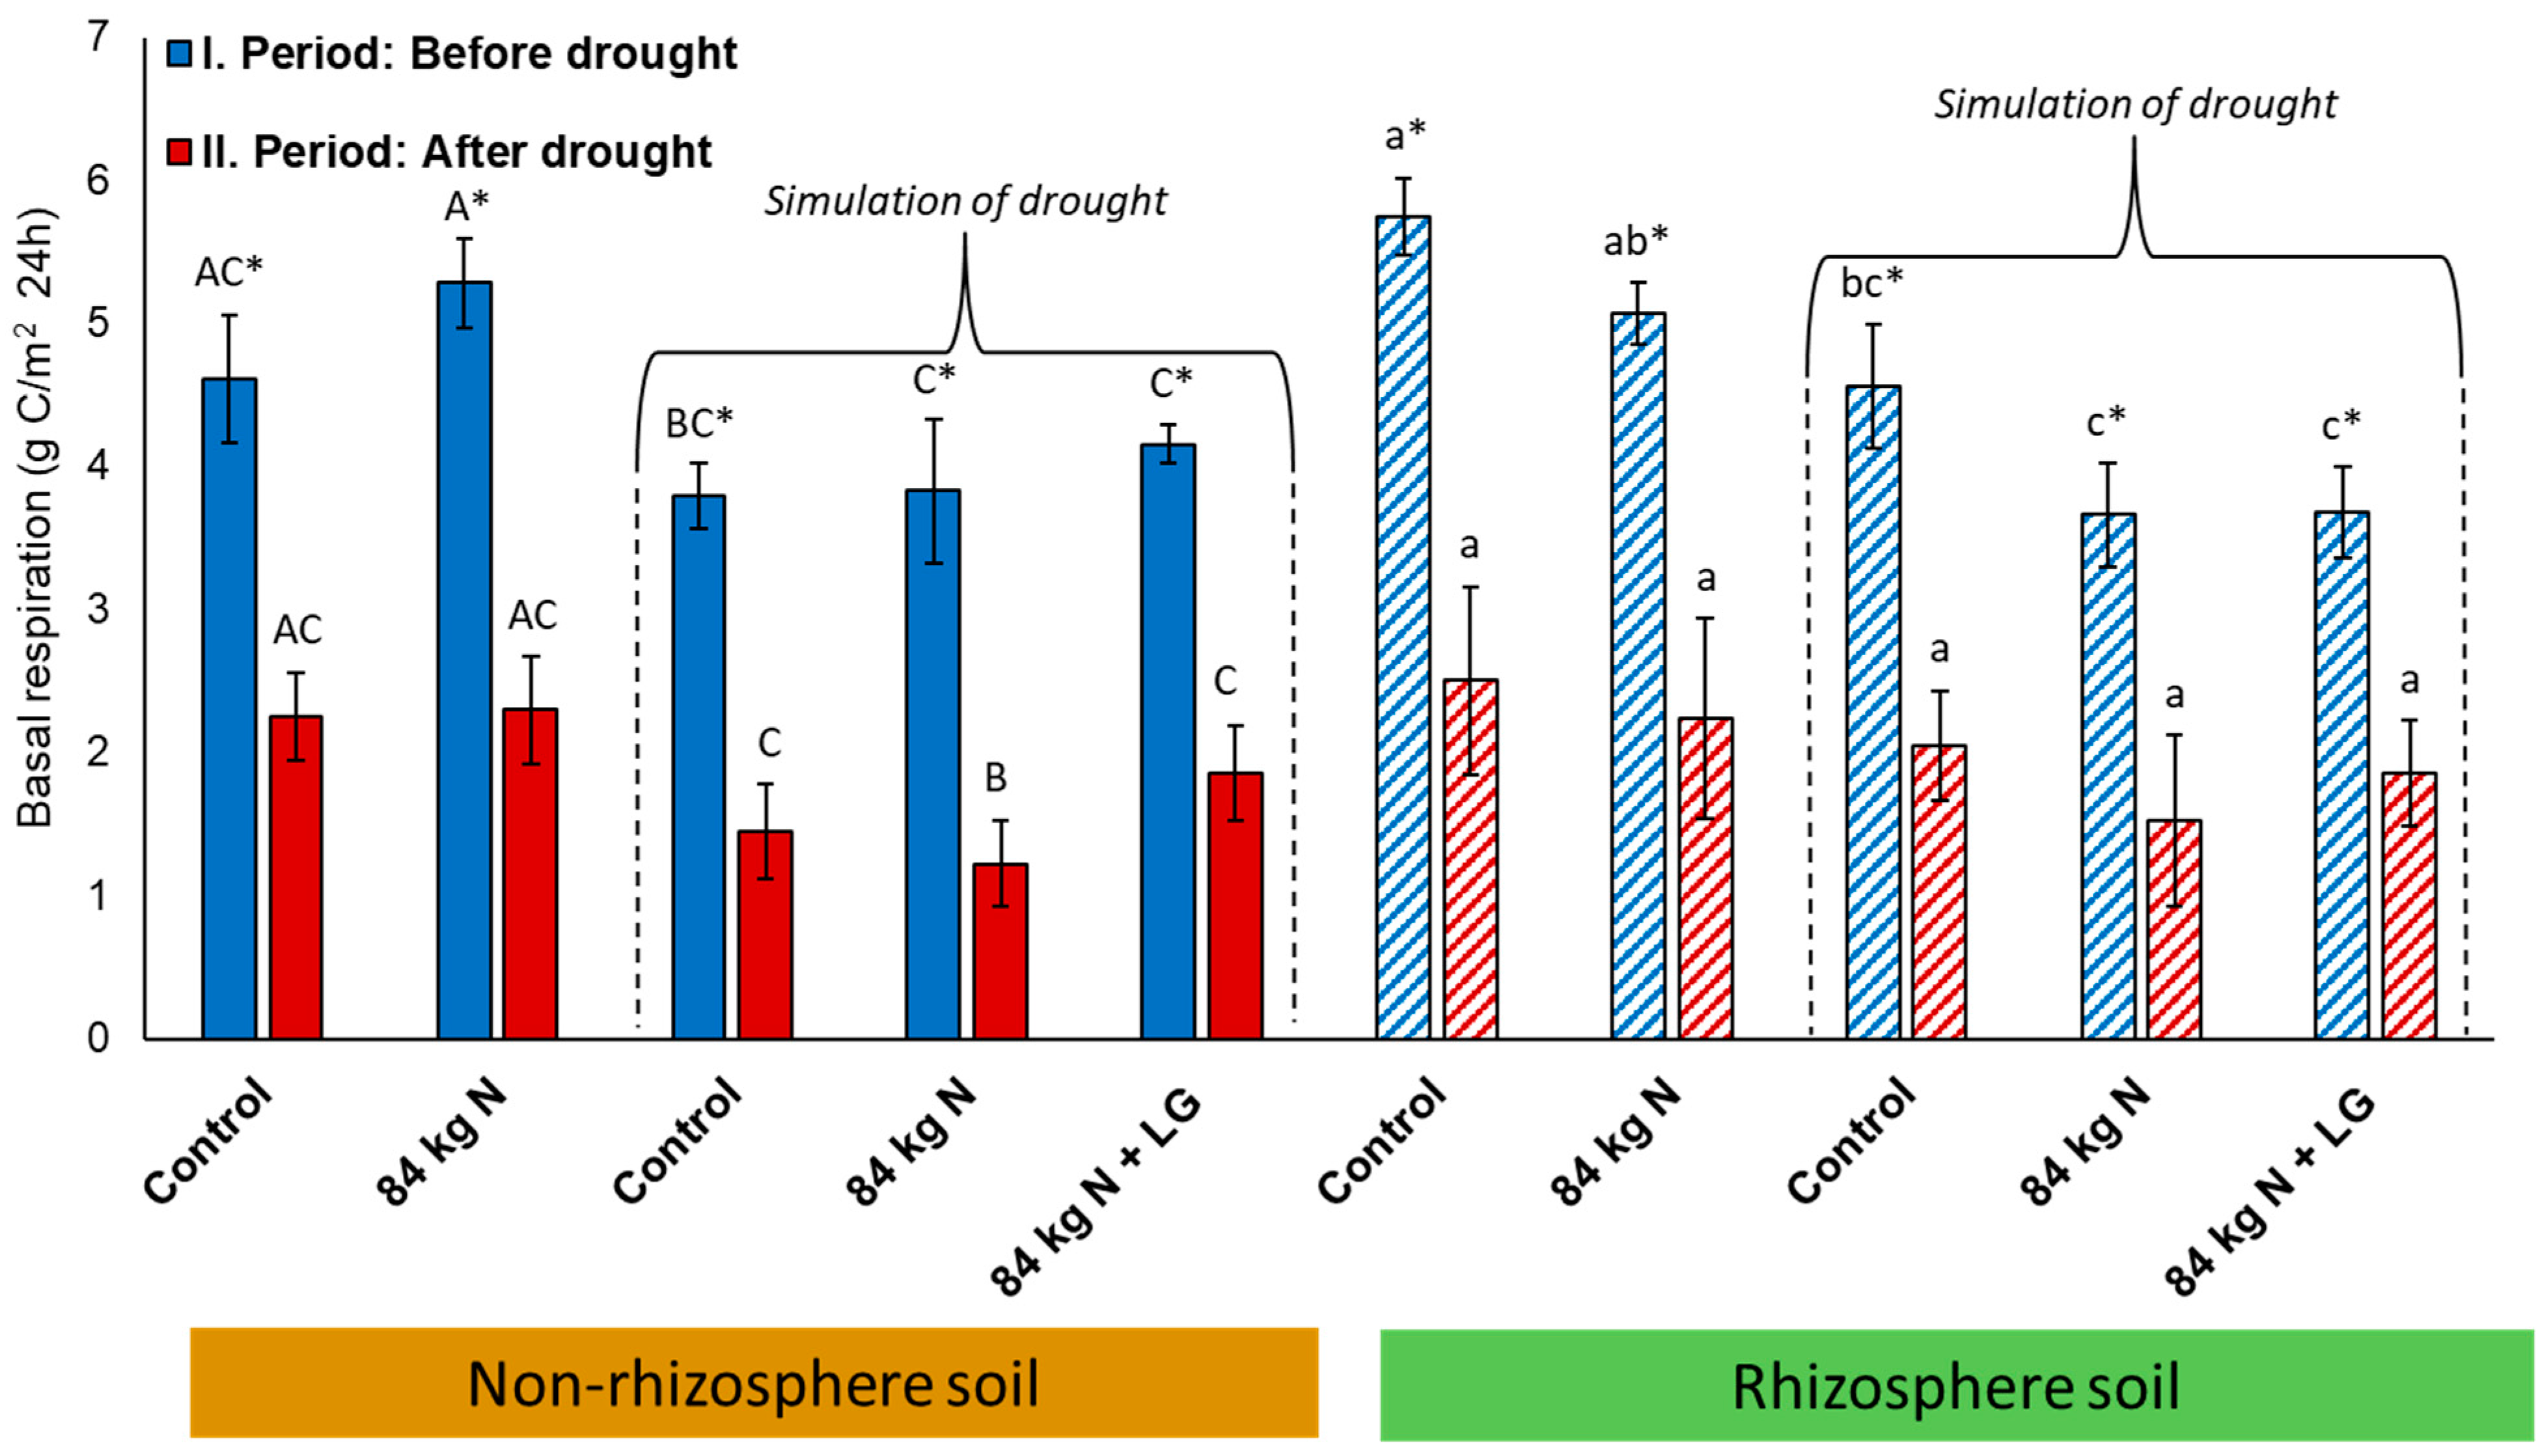
2.2. Measurement of Basal Respiration
2.3. Determination of Dehydrogenase Enzymatic Activity
2.4. Measuring the Loss in Mineral Nitrogen from the Soil
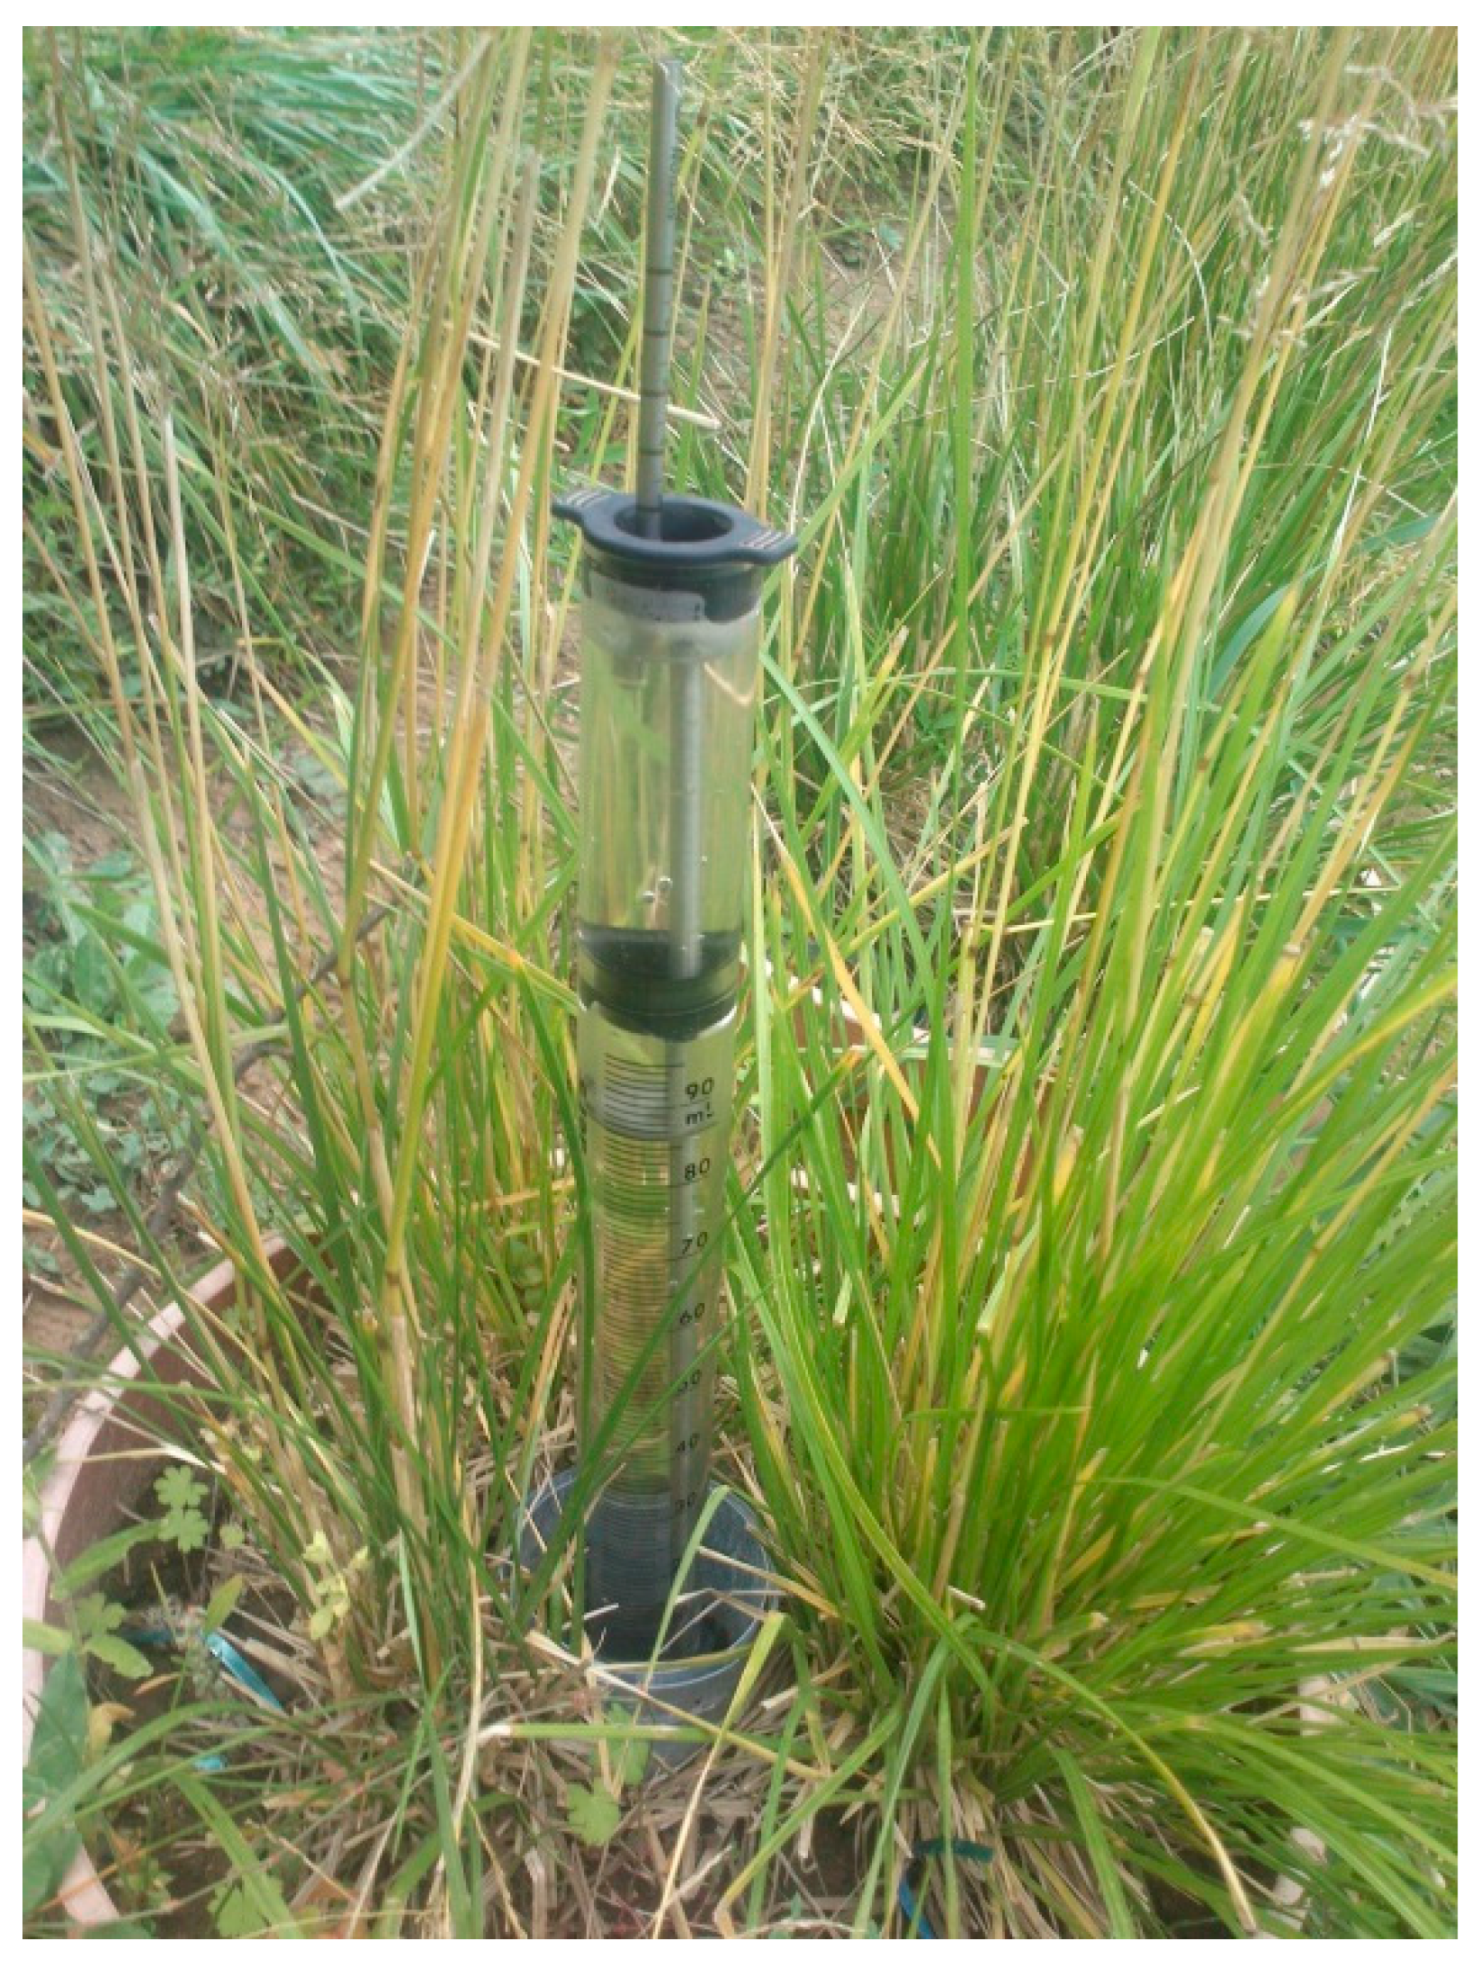
2.5. Determination of the Degree of Soil Hydrophobicity
2.6. Statistical Analysis
3. Results
3.1. Plant Biomass Production
3.2. Basal Respiration
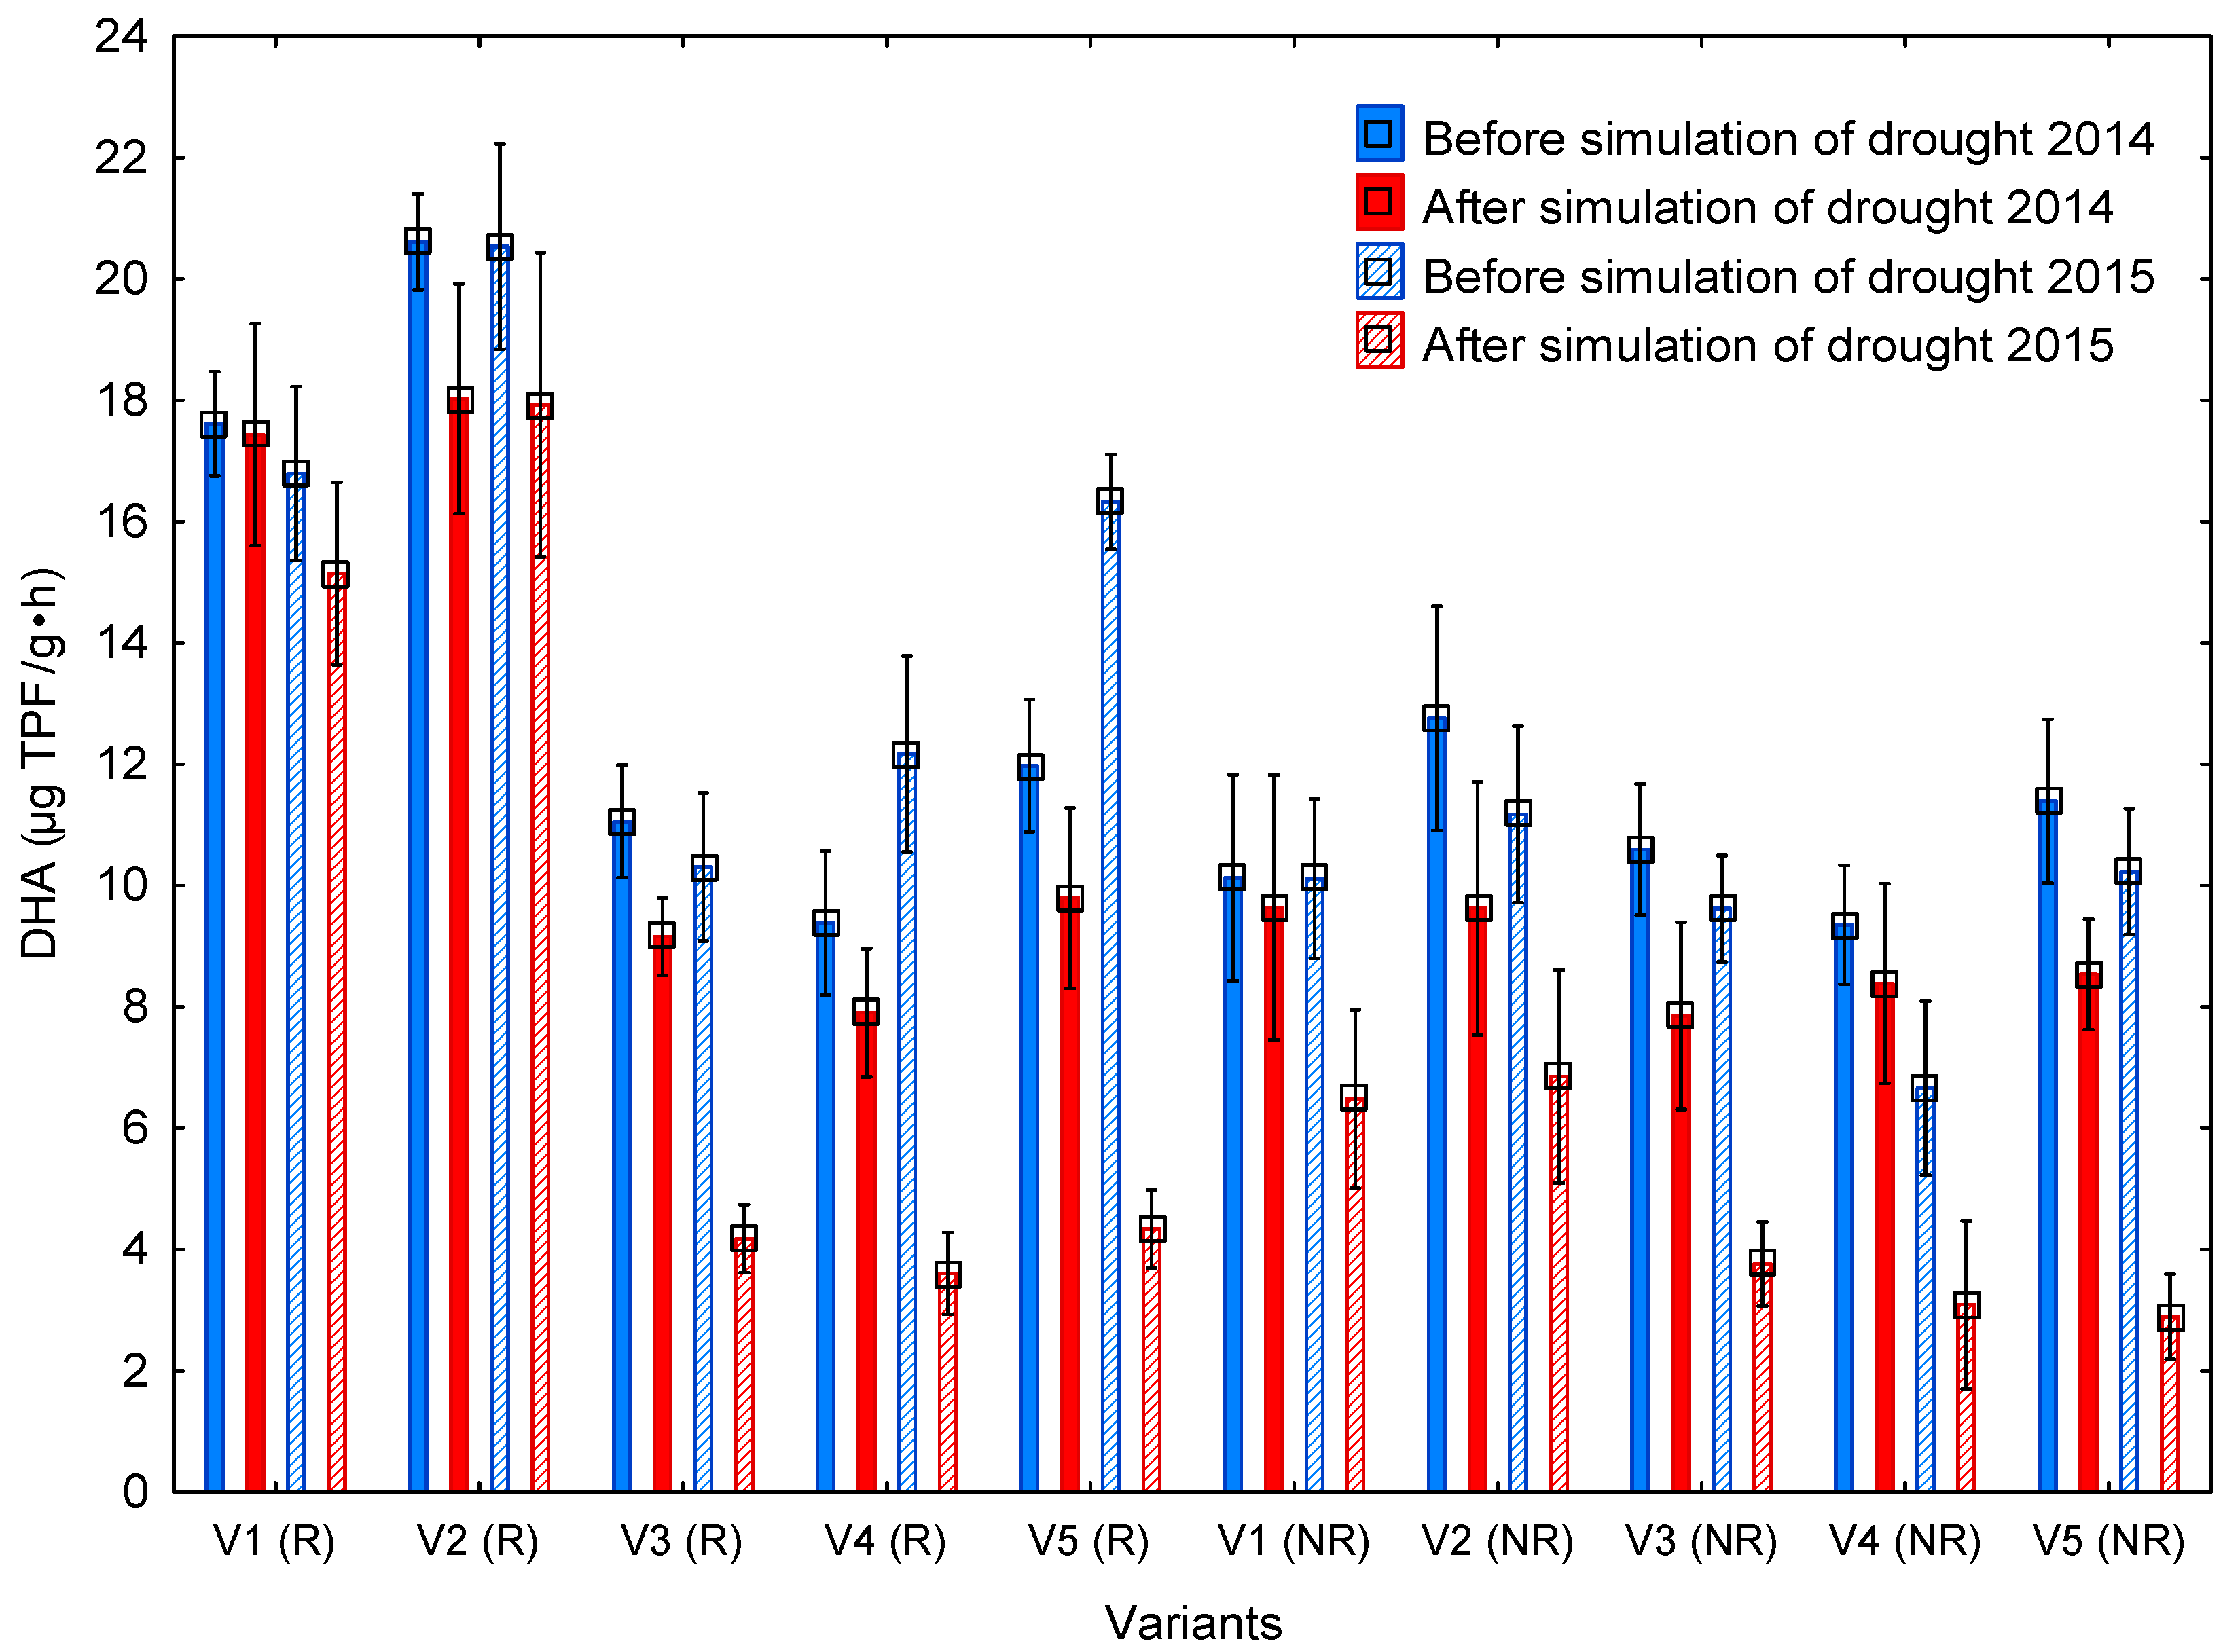
3.3. Dehydrogenase Activity
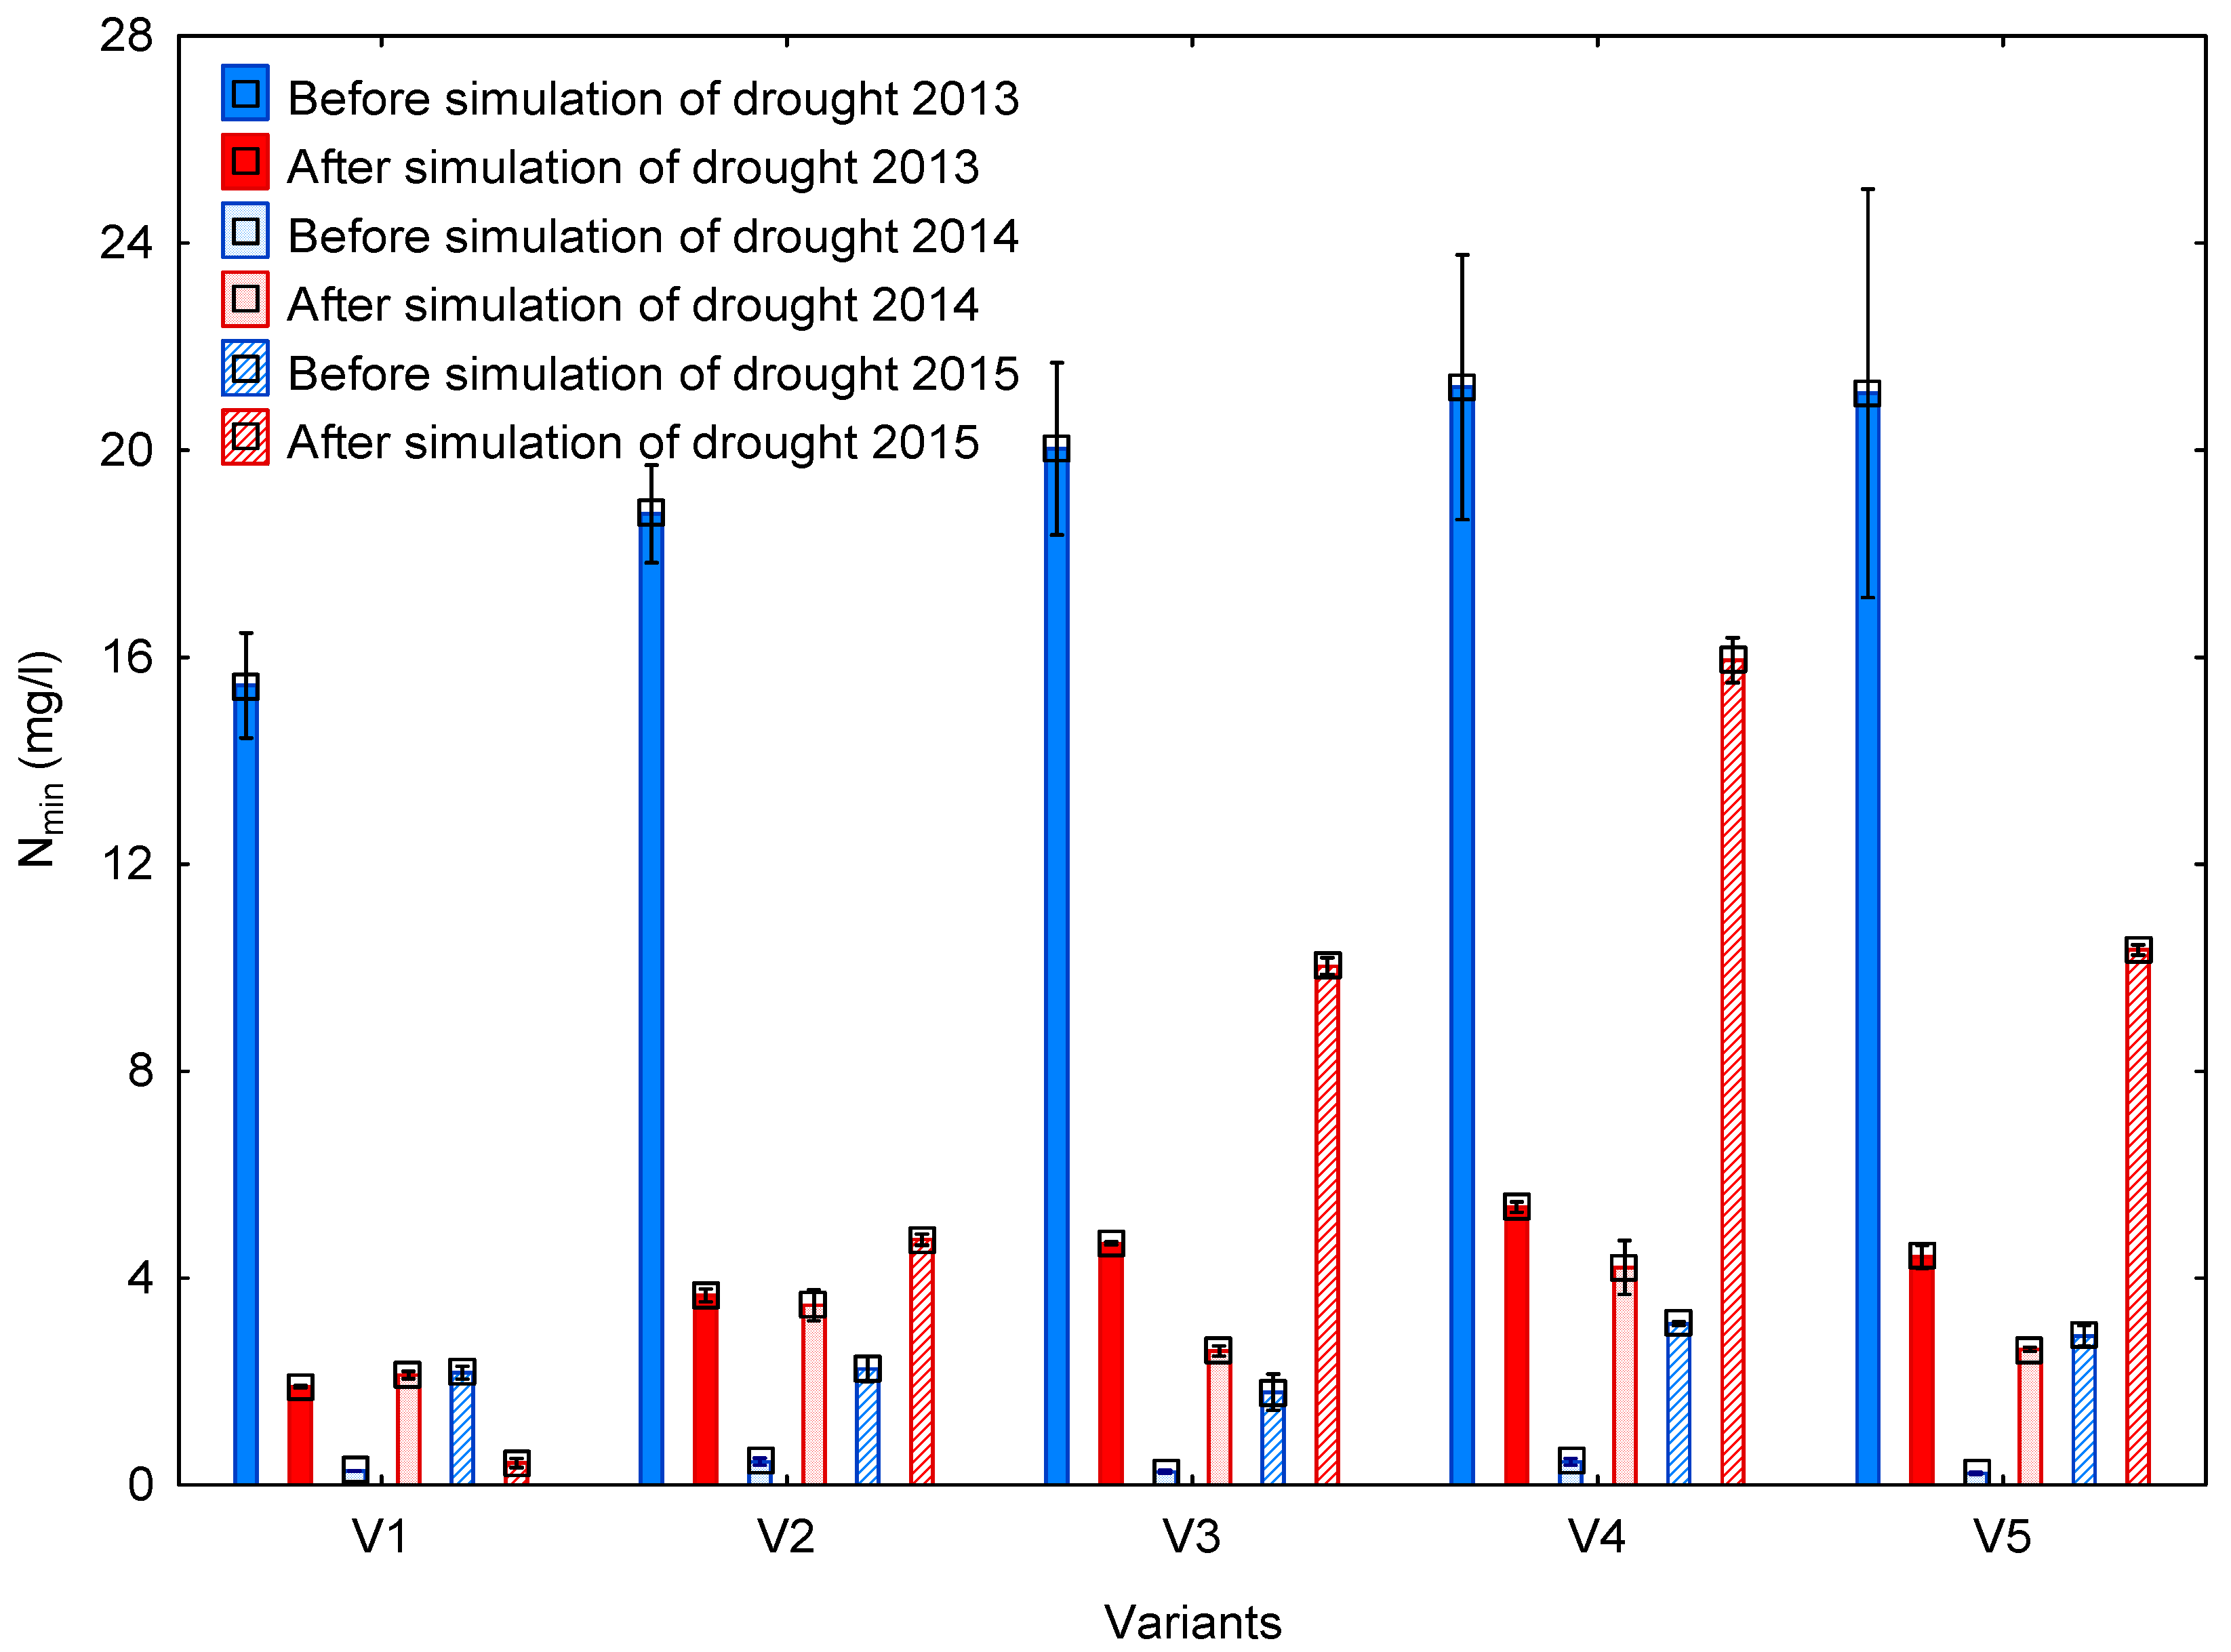
3.4. Leaching of Mineral Nitrogen
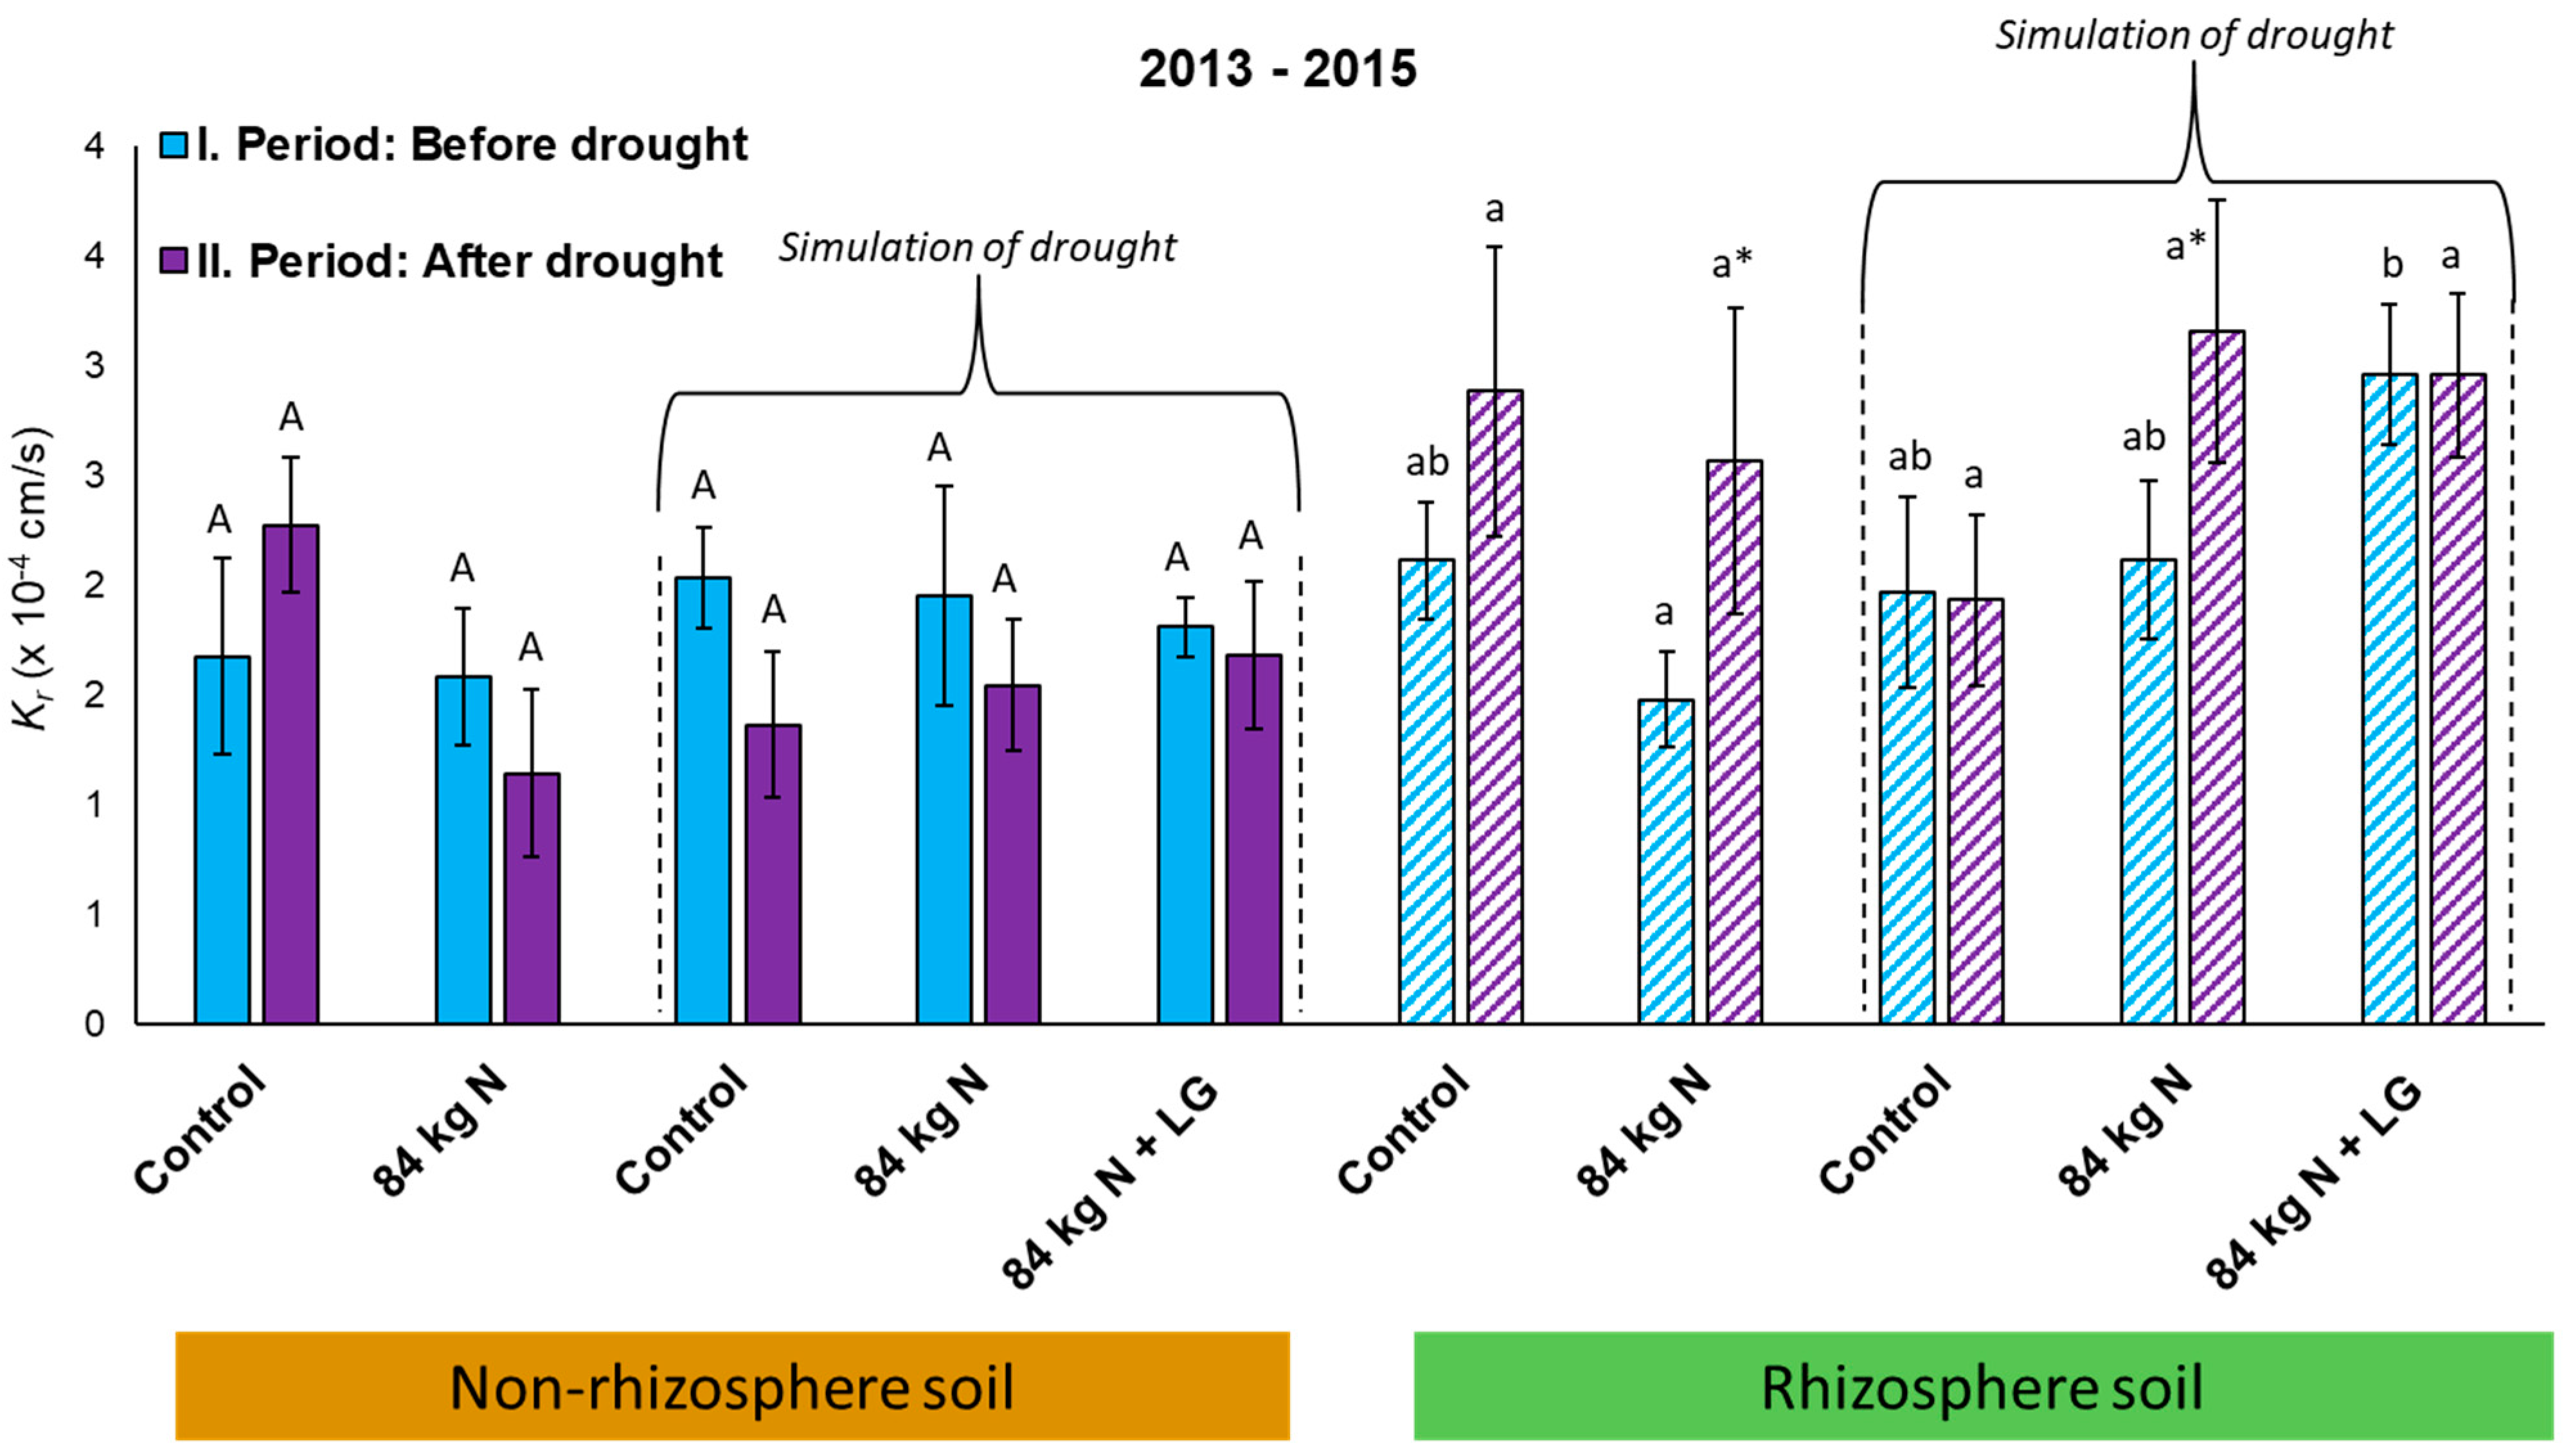
3.5. Unsaturated Hydraulic Conductivity—Expression of the Degree of Soil Water Repellence
4. Discussion
4.1. Plant Biomass Production
4.2. Basal Respiration
4.3. Dehydrogenase Activity
4.4. Leaching of Mineral Nitrogen
4.5. Soil Water Repellence
5. Conclusions
Author Contributions
Funding
Institutional Review Board Statement
Informed Consent Statement
Data Availability Statement
Acknowledgments
Conflicts of Interest
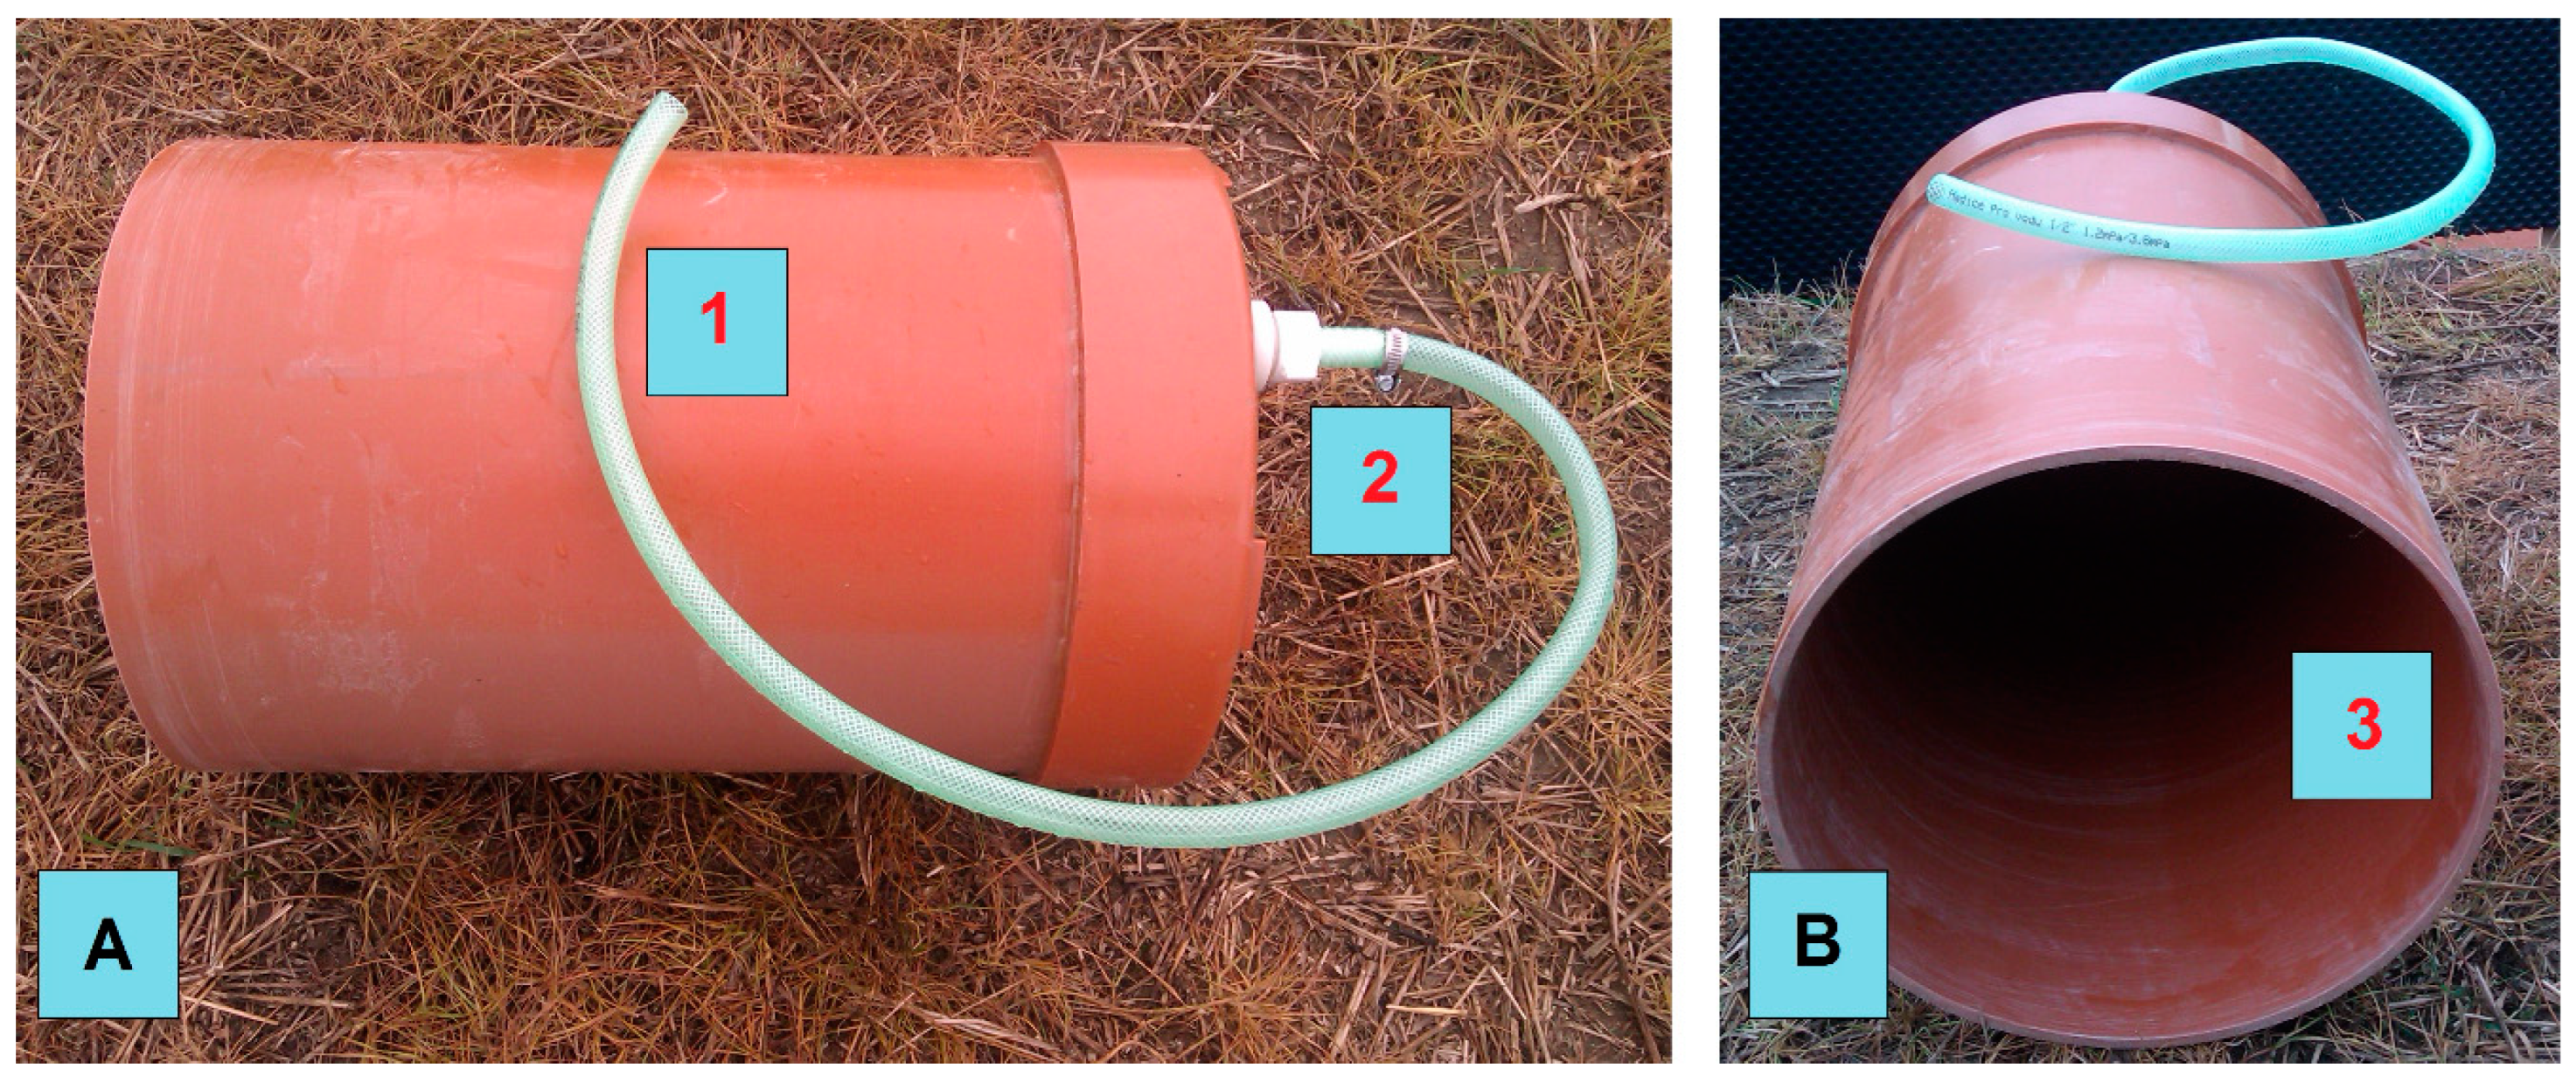
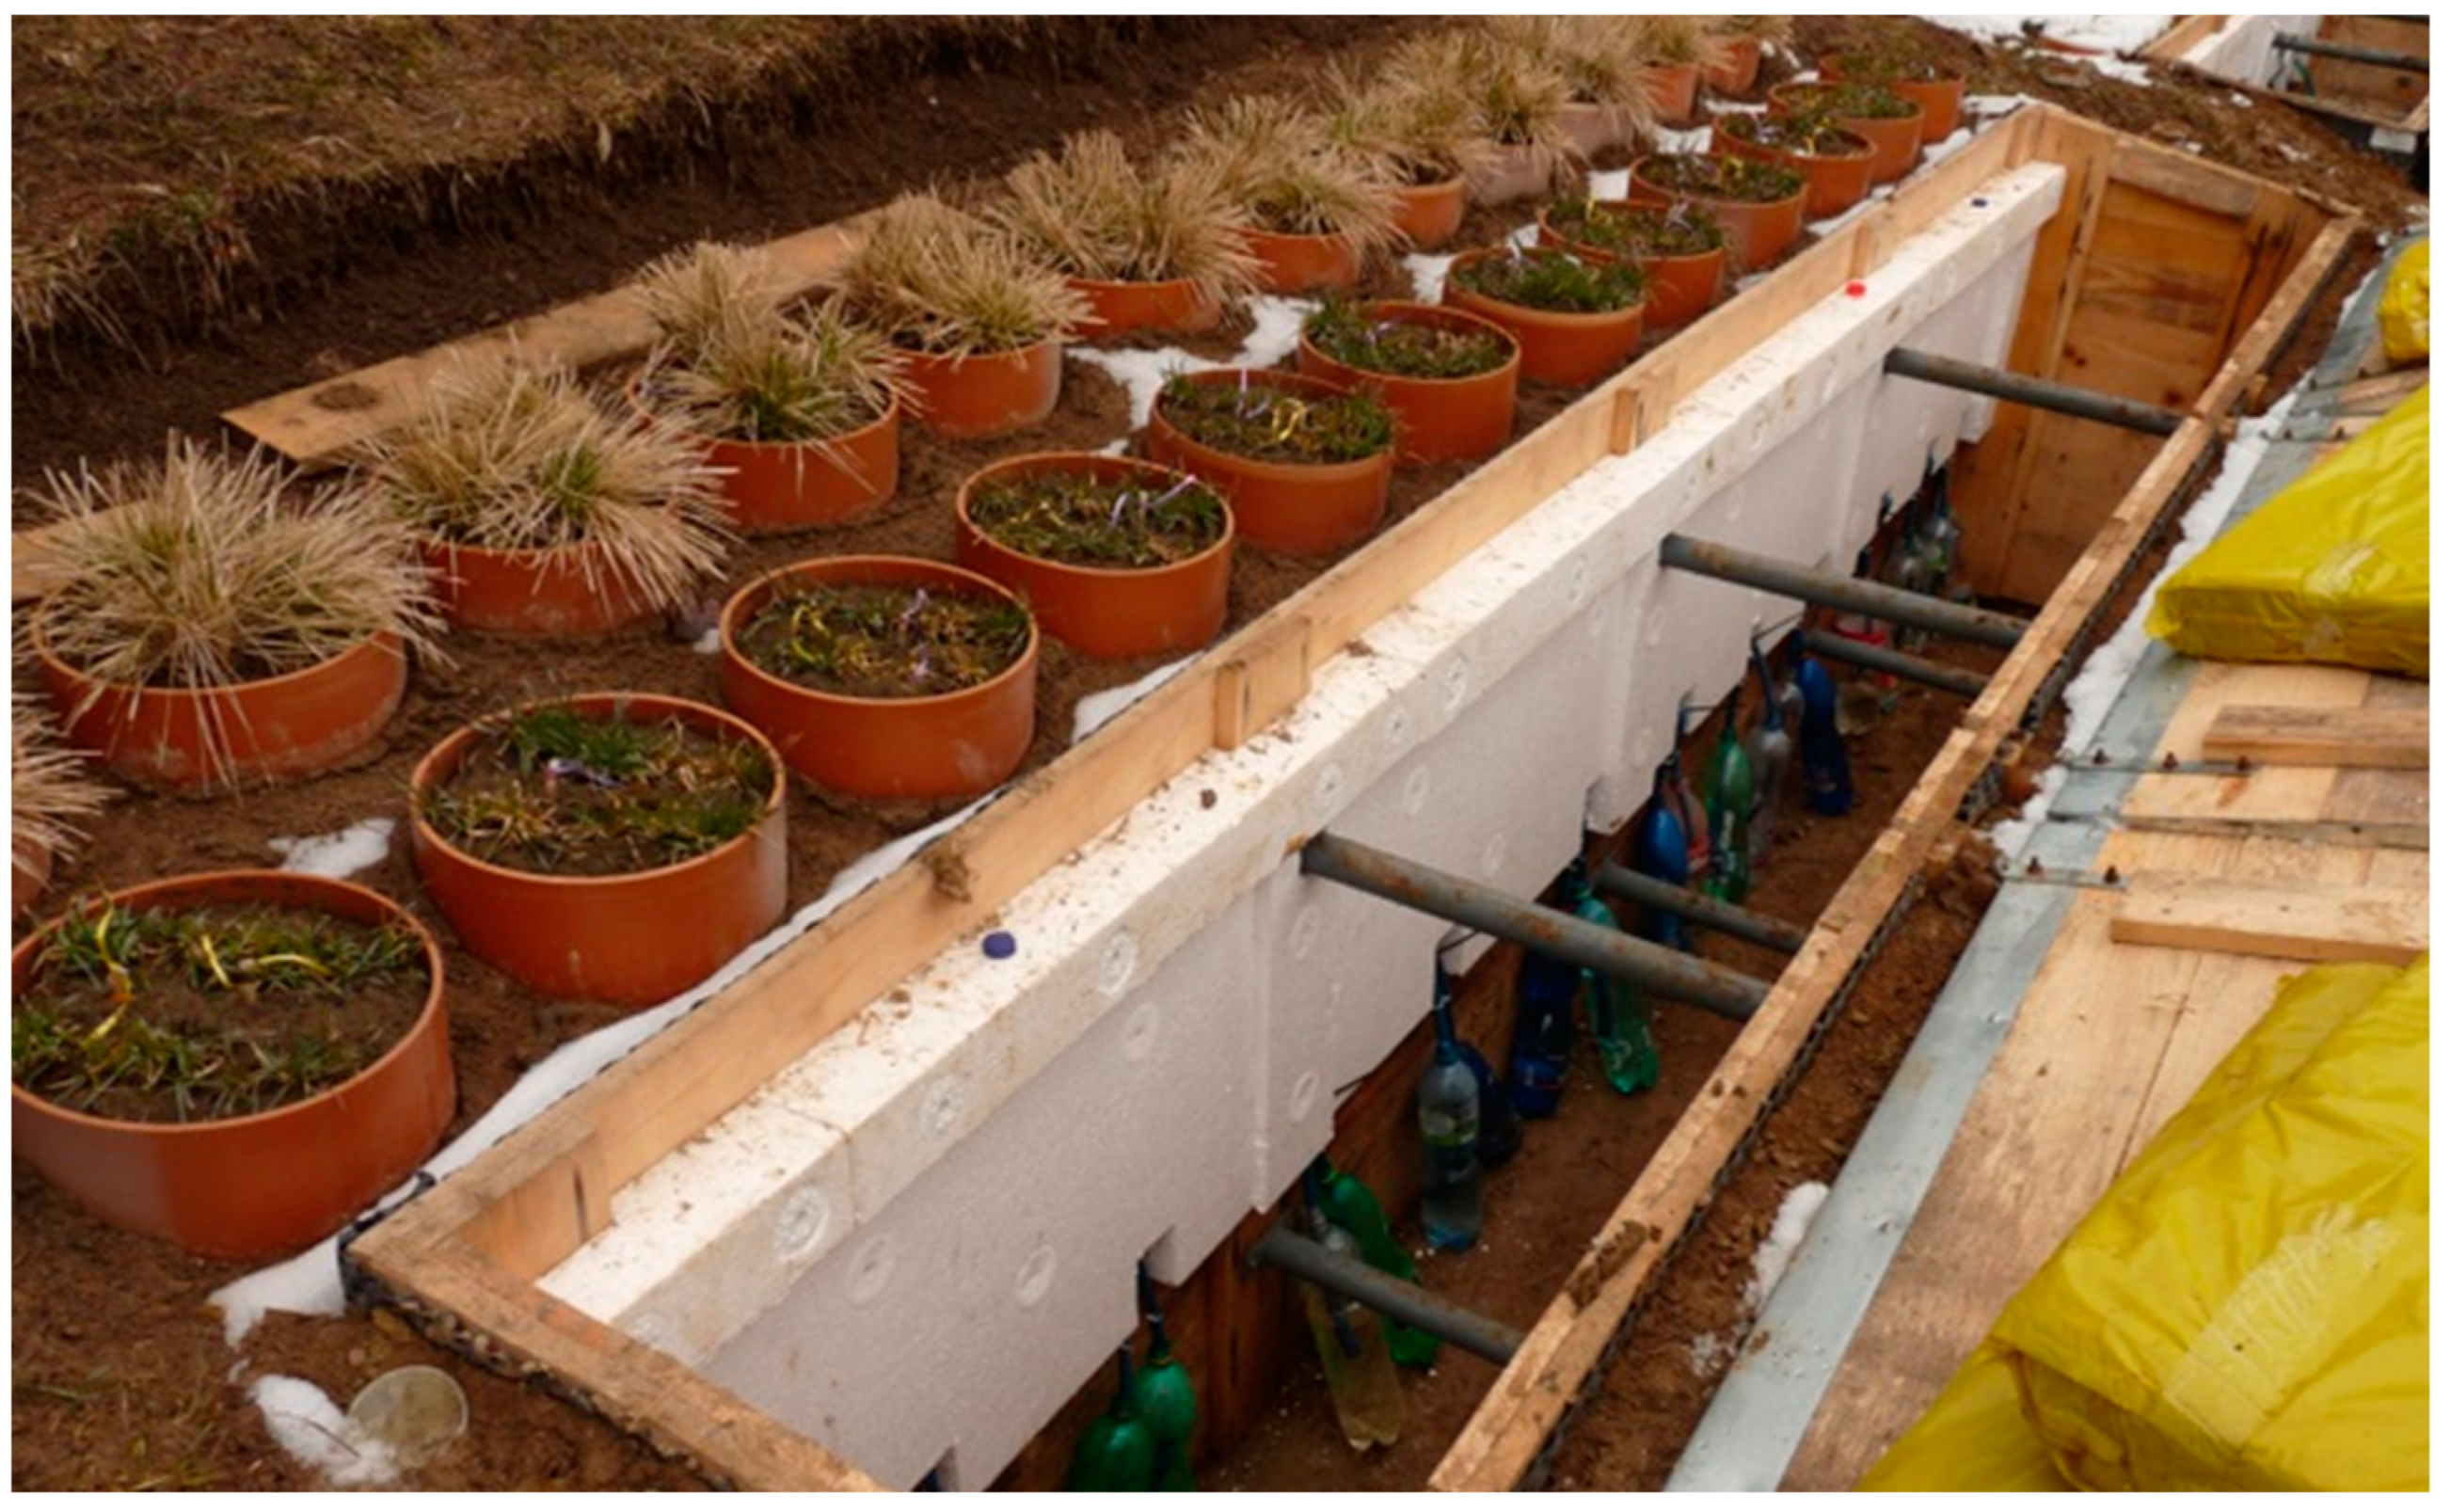
Appendix A. Soil Lysimeters


| Variants | 2013 | 2014 | 2015 | |||
|---|---|---|---|---|---|---|
| First | Second | First | Second | First | Second | |
| V1 | - | - | - | - | - | - |
| V2 | 19 April | 14 June | 18 April | 18 June | 22 April | 15 June |
| V3 | - | - | - | - | - | - |
| V4 | 19 April | 14 June | 18 April | 18 June | 22 April | 15 June |
| V5 | 19 April | 14 June | 18 April | 18 June | 22 April | 15 June |

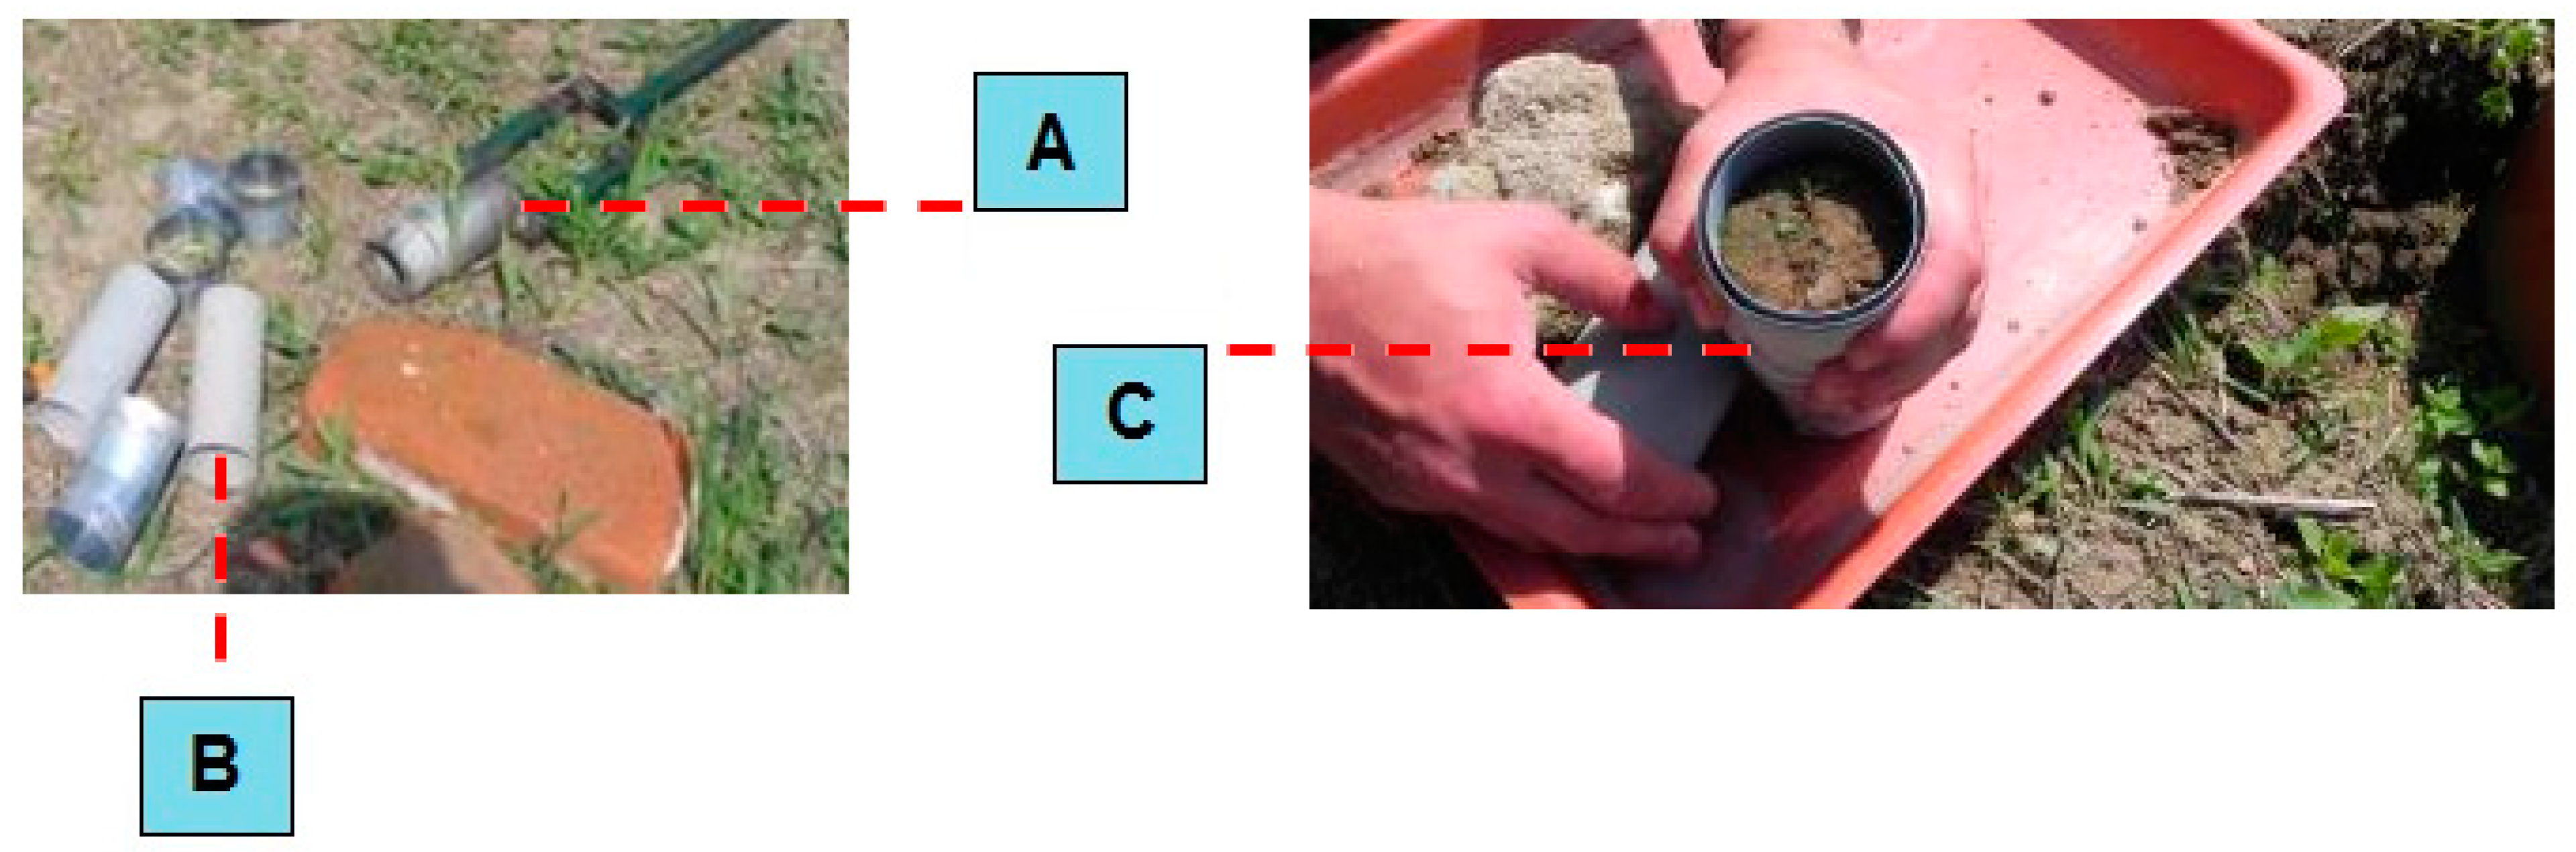
Appendix B. Measurement of Soil Water Repellence and Leaching of Nmin

| Variants | 2013 | 2014 | 2015 | |||
|---|---|---|---|---|---|---|
| Average | Sum | Average | Sum | Average | Sum | |
| (l) | (l) | (l) | (l) | (l) | (l) | |
| V1 | 10.0 | 30 | 6.4 | 19 | 9.9 | 30 |
| V2 | 10.8 | 32 | 6.2 | 19 | 9.8 | 29 |
| V3 | 6.2 | 19 | 6.5 | 20 | 9.6 | 29 |
| V4 | 7.3 | 22 | 5.4 | 16 | 8.7 | 26 |
| V5 | 8.6 | 26 | 6.3 | 19 | 9.1 | 27 |
| Variants | 2013 | 2014 | 2015 | |||
|---|---|---|---|---|---|---|
| Before Simulation | After Simulation | Before Simulation | AfterSimulation | Before Simulation | After Simulation | |
| w (%) | w (%) | w (%) | w (%) | w (%) | w (%) | |
| V1 | 14.21 | 12.35 | 15.48 | 6.38 | 8.11 | 9.36 |
| V2 | 15.39 | 11.03 | 13.71 | 10.19 | 10.65 | 7.24 |
| V3 | 12.47 | 1.57 | 14.85 | 2.44 | 7.83 | 2.66 |
| V4 | 13.95 | 2.42 | 12.47 | 3.73 | 9.25 | 2.33 |
| V5 | 8.14 | 3.86 | 11.81 | 2.38 | 6.81 | 1.93 |
References
- Gyurica, C.; Smutný, V.; Perzce, A.; Pósa, B.; Birkás, M. Soil condition threats in two seasons of extreme weather conditions. Plant Soil Environ. 2015, 61, 151–157. [Google Scholar] [CrossRef] [Green Version]
- Trnka, M.; Hlavinka, P.; Možný, M.; Semerádová, D.; Štěpánek, P.; Balek, J.; Bartošová, L.; Zahradníček, P.; Bláhová, M.; Skalák, P.; et al. Czech Drought Monitor System for monitoring and forecasting agricultural drought and drought impacts. Int. J. Climatol 2020, 40, 5941–5958. [Google Scholar] [CrossRef]
- Geng, S.; Yan, D.H.; Zhang, T.X.; Weng, B.S.; Zhang, Z.B.; Gang, W. Effects of extreme drought on agriculture soil and sustainability of different drought soil. Hydrol. Earth Syst. Sci. 2014, 11, 1–29. [Google Scholar]
- Menšík, L.; Kincl, D.; Nerušil, P.; Srbek, J.; Hlisnikovský, L.; Smutný, V. Water erosion reduction using different soil tillage approaches for maize (Zea mays L.) in the Czech Republic. Land 2020, 9, 358. [Google Scholar] [CrossRef]
- Smutný, V.; Neudert, L.; Dryšlová, T.; Lukas, V.; Handlířová, M.; Vrtílek, P.; Vach, M. Current arable farming systems in the Czech Republic—Agronomic measures adapted to soil protection and climate change. Agric. Conspec. Sci. 2018, 83, 11–16. [Google Scholar]
- Borken, W.; Savage, K.; Davidson, E.A.; Trumbore, S.E. Effects of experimental drought on soil respiration and radiocarbon efflux from a temperate forest soil. Glob. Change Biol. 2006, 12, 177–193. [Google Scholar] [CrossRef] [Green Version]
- Bimüller, C.M.; Dannenmann, J.; Tejedor, J.; Lützow, M.; Buegger, F.; Meier, R.; Haug, S.; Schroll, R.; Kögel-Knabner, I. Prolonged summer droughts retard soil N processing and stabilization in organo-mineral fractions. Soil Biol. Biochem. 2014, 68, 241–251. [Google Scholar] [CrossRef]
- Mukerji, K.G.; Manoharachary, C.; Singh, J. Microbial Activity in the Rhizosphere; Springer: Berlin, Germany, 2006; 350p. [Google Scholar]
- Li, Z.; Zu, C.; Wang, C.; Yang, J.; Yu, H.; Wu, H. Different responses of rhizosphere and non-rhizosphere soil microbial communities to consecutive Piper nigrum L. monoculture. Sci. Rep. 2016, 6, 35825. [Google Scholar] [CrossRef] [PubMed] [Green Version]
- Xia, L.; Zhao, B.Q.; Luo, T.; Xu, W.; Guo, T.; Xia, D. Microbial functional diversity in rhizosphere and non-rhizosphere soil of different dominant species in a vegetation concrete slope. Biotechnol. Biotechnol. Equip. 2022, 36, 379–388. [Google Scholar] [CrossRef]
- Sanaullah, M.; Blagodatskaya, E.; Chabbi, A.; Rumpel, C.; Kuzyakov, Y. Drought effects on microbial biomass and enzyme activities in the rhizosphere of grasses depend on plant community composition. Appl. Soil Ecol. 2011, 48, 38–44. [Google Scholar] [CrossRef]
- Bloem, J.; Hopkins, D.W.; Benedetti, A. Microbiological Methods for Assessing Soil Quality; CABI Publishing: Wallingford, UK, 2006; 320p. [Google Scholar]
- Zhang, F.; Quan, Q.; Ma, F.; Tian, D.; Hoover, D.L.; Zhou, Q.; Niu, S. When does extreme drought elicit extreme ecological responses? J. Ecol. 2019, 107, 2553–2563. [Google Scholar] [CrossRef]
- Liu, Z.F.; Fu, B.J.; Zheng, X.X. Plant biomass, soil water content and soil N:P ratio regulating soil microbial functional diversity in a temperate steppe: A regional scale study. Soil Biol. Biochem. 2010, 42, 445–450. [Google Scholar] [CrossRef]
- Coats, V.S.; Rumpho, M.E. The rhizosphere microbiota of plant invaders: An overview of recent advances in the microbiomics of invasive plants. Front. Microbiol. 2014, 23, 368–378. [Google Scholar] [CrossRef] [Green Version]
- Sutton, M.A. (Ed.) The European Nitrogen Assessment: Sources, Effects and Policy Perspectives; Cambridge University Press: New York, NY, USA, 2011; 612p. [Google Scholar]
- Aika, K. Environmental concerns about fuel ammonia. In CO2 Free Ammonia as an Energy Carrier, 1st ed.; Aika, K., Kobayashi, H., Eds.; Springer: Singapore, 2023; pp. 681–692. [Google Scholar]
- Elbl, J.; Vaverková, M.; Adamcová, D.; Plošek, L.; Kintl, A.; Lošák, T.; Hynšt, J.; Kotovicová, J. Influence of fertilization on microbial activities, soil hydrophobicity and mineral nitrogen leaching. Ecol. Chem. Eng. S 2014, 21, 661–675. [Google Scholar] [CrossRef] [Green Version]
- Rennenberg, H.; Dannenmann, M.; Gessler, A.; Kreuzwieser, J.; Simon, J.; Papen, H. Nitrogen balance in forest soils: Nutritional limitation of plants under climate change stresses. Plant Biol. 2009, 11, 4–23. [Google Scholar] [CrossRef] [PubMed]
- Nyman, P.; Sheridan, G.J.; Smith, H.G.; Lane, P.N.J. Modelling the effects of surface storage, macropore flow and water repellency on infiltration after wildfire. J. Hydrol 2014, 513, 301–313. [Google Scholar] [CrossRef]
- Cerda, A.; Robichaud, P.R. (Eds.) Fire Effects on Soils and Restoration Strategies; Science Publisher: Enfield, NH, USA, 2009; 605p. [Google Scholar]
- Schreiner, O.; Shoery, E.C. Chemical Nature of Soil Organic Matter; Bureau of soils Bulletin; US Department of Agriculture: Washington, DC, USA, 1910; 48p. [Google Scholar]
- Buczko, U.; Bens, O.; Hüttl, R.F. Variability of soil water repellency in sandy forest soils with different stand structure under Scots pine (Pinus sylvestris) and beech (Fagus sylvatica). Geoderma 2005, 126, 317–336. [Google Scholar] [CrossRef]
- Goobel, M.O.; Bachmann, J.; Reichstein, M.; Janssens, I.A.; Guggenberger, G. Soil water repellency and its implications for organic matter decomposition—Is there a link to extreme climatic events? Glob. Change Biol. 2011, 17, 2640–2656. [Google Scholar] [CrossRef]
- Mataix-Solera, J.; Doerr, S.H. Hydrophobicity and aggregate stability in calcareous topsoils from fire-affected pine forests in southeastern Spain. Geoderma 2004, 118, 77–88. [Google Scholar] [CrossRef]
- Doerr, S.H.; Shakesby, R.A.; MacDonald, L.H. Soil water repellency: A key factor in post-fire erosion. In Fire Effects on Soils and Restoration Strategies; Cerda, A., Robichaud, P.R., Eds.; Science Publisher: Enfield, NH, USA, 2009; pp. 197–223. [Google Scholar]
- Lichner, L.; Hallet, P.; Feeney, D.S.; Ďugová, O.; Šír, M.; Tesař, M. Field measurement of soil water repellency and its impact on water flow under different vegetation. Biologia 2007, 62, 537–541. [Google Scholar] [CrossRef]
- Robichaud, P.R.; Lewis, S.A.; Ashmun, L.E. New Procedure for Sampling Infiltration to Assess Post-Fire Soil Water Repellency. Res. Note. RMRS-RN-33; USDA, Forest Service, Rocky Mountain Re-search Station: Fort Collins, CO, USA, 2008; 14p. [Google Scholar]
- Cosentino, D.; Hallet, P.D.; Michel, J.C.; Chenu, C. Do different methods for measuring the hydrophobicity of soil aggregates give the same trends in soil amended with residue? Geoderma 2010, 15, 221–227. [Google Scholar] [CrossRef]
- ISO 10381-6:2009; Soil quality—Sampling—Part 6: Guidance on the Collection, Handling and Storage of Soil under Aerobic Conditions for the Assessment of Microbiological Processes, Biomass and Diversity in the Laboratory. International Organization for Standardization: Geneva, Switzerland, 2009; 6p.
- Elbl, J.; Plošek, L.; Kintl, A.; Přichystalová, J.; Záhora, J.; Friedel, J.K. The effect of increased doses of compost on leaching of mineral nitrogen from arable land. Pol. J. Environ. Stud. 2014, 23, 697–703. [Google Scholar]
- Kintl, A.; Elbl, J.; Lošák, T.; Vaverková, M.D.; Nědělník, J. Mixed intercropping of wheat and white clover to enhance the sustainability of the conventional cropping system: Effects on biomass production and leaching of mineral nitrogen. Sustainability 2018, 10, 3367. [Google Scholar] [CrossRef] [Green Version]
- Mehlich, A. Mehlich III soil test extractant. Commun. Soil Sci. Plant Anal. 1984, 15, 1409–1416. [Google Scholar] [CrossRef]
- Keith, H.; Wong, S.C. Measurement of soil CO2 efflux using soda lime absorption: Both quantitative and reliable. Soil Biol. Biochem. 2006, 38, 1121–1131. [Google Scholar] [CrossRef]
- Casida, L.E.; Klein, D.A.; Santoro, T. Soil dehydrogenase activity. Soil Sci. 1964, 98, 371–376. [Google Scholar] [CrossRef]
- Peoples, M.B.; Faizah, A.W.; Rerkasem, B.; Herridge, D.F. Methods for Evaluating Nitrogen Fixation by Modulated Legumes in the Field; Australian Centre for International Agricultural Research: Canberra, Australia, 1989. [Google Scholar]
- Elbl, J.; Sláma, P.; Vaverková, M.D.; Plošek, L.; Adamcová, D.; Škarpa, P.; Kynický, J.; Havlíček, Z.; Dvořáčková, H.; Brtnický, M.; et al. Jatropha seed cake and organic waste compost: The potential for improvement of soil fertility. Ecol. Chem. Eng. S 2016, 23, 131–141. [Google Scholar] [CrossRef] [Green Version]
- Zhang, R. Determination of soil sorptivity and hydraulic conductivity from the disk infiltrometer. Soil Sci. Soc. Am. J. 1997, 61, 1024–1030. [Google Scholar] [CrossRef]
- Lichner, L.; Orfánus, T.; Nováková, K.; Šír, M.; Tesař, M. The Impact of vegetation on hydraulic conductivity of sandy soil. Soil Water Res. 2007, 2, 59–66. [Google Scholar] [CrossRef] [Green Version]
- Greimler, J.; Temsch, E.M.; Xue, Z.; Weiss-Schneeweiss, H.; Volkova, P.; Peintinger, M.; Wasowicz, P.; Shang, H.; Schanzer, I.; Chiapella, J.O. Genome size variation in Deschampsia cespitosa sensu lato (Poaceae) in Eurasia. Plant Syst. Evol. 2022, 308, 9. [Google Scholar] [CrossRef]
- Chiapella, J. The Deschampsia cespitosa complex in central and northern Europe: A morphological analysis. Bot. J. 2008, 134, 495–512. [Google Scholar] [CrossRef]
- Davy, A.J.; Taylor, K. Water Characteristics of Contrasting Soils in the Chiltern Hills and their Significance for Deschampsia Caespitosa (L.) Beauv. J. Ecol. 1974, 62, 367–378. [Google Scholar] [CrossRef]
- Kanapeckas, J.; Lemežiené, N.; Stukonis, V.; Tarakanovas, P. Drought tolerance of turfgrass genetic resources. Biologija 2008, 54, 121–124. [Google Scholar] [CrossRef]
- Deelstra, J.; Øygarden, L.; Blankenberg, A.-G.B.; Eggestad, H.O. Climate change and runoff from agricultural catchments in Norway. Int. J. Clim. 2011, 3, 345–360. [Google Scholar]
- Waldrop, M.P.; Firestone, M.K. Seasonal dynamics of microbial community composition and function in oak canopy and open grassland soils. Microb 2006, 52, 470–479. [Google Scholar] [CrossRef]
- Blagodatskaya, E.; Kuzyakov, Y. Active microorganisms in soil: Critical review of estimation criteria and approaches. Soil Biol. Biochem. 2013, 67, 192–211. [Google Scholar] [CrossRef]
- Schimel, J.P. Life in Dry Soils: Effects of Drought on Soil Microbial Communities and Processes. Annu. Rev. Ecol. Evol. Syst. 2018, 49, 409–432. [Google Scholar] [CrossRef]
- Bogati, K.; Walczak, M. The Impact of Drought Stress on Soil Microbial Community, Enzyme Activities and Plants. Agronomy 2022, 12, 189. [Google Scholar] [CrossRef]
- Habekost, M.; Eisenhauer, N.; Scheu, S.; Stenbeis, S.; Weigelt, A.; Gleixner, G. Seasonal changes in the soil microbial community in a grassland plant diversity gradient four years after establishment. Soil Biol. Biochem. 2008, 40, 2588–2595. [Google Scholar] [CrossRef]
- Engelhardt, I.C.; Welty, A.; Blazewicz, S.J.; Bru, D.; Rouard, N.; Breuil, M.C.; Gessler, A.; Galiano, L.; Miranda, J.C.; Spor, A.; et al. Depth matters: Effects of precipitation regime on soil microbial activity upon rewetting of a plant-soil system. ISME J. 2018, 12, 1061–1071. [Google Scholar] [CrossRef]
- Rivest, D.; Lorente, M.; Olivier, A.; Messier, C. Soil biochemical properties and microbial resilience in agroforestry systems: Effects on wheat growth under controlled drought and flooding conditions. Sci. Total Environ. 2013, 463, 51–60. [Google Scholar] [CrossRef] [PubMed]
- Chen, Q.; Niu, B.; Liu, B.; Hu, Y.; Luo, T.; Zhang, G. Warming and increased precipitation indirectly affect the composition and turnover of labile-fraction soil organic matter by directly affecting vegetation and microorganisms. Sci. Total Environ. 2020, 714, 136787. [Google Scholar] [CrossRef] [PubMed]
- Hueso, S.; García, C.; Hermández, T. Severe drought conditions modify the microbial community structure, size and activity in amended and unamended soils. Soil Biol. Biochem. 2012, 50, 167–173. [Google Scholar] [CrossRef]
- Elbl, J.; Záhora, J. The comparison of microbial activity in rhizosphere and non-rhizosphere soil stressed by drought. In 21st International PhD Students Conference; Polak, O., Cerkal, R., Skarpa, P., Eds.; Mendel Univ, Fac Agron: Brno, Czech Republic, 2014; pp. 240–243. [Google Scholar]
- Maková, J.; Javoreková, S.; Elbl, J.; Medo, J.; Hricáková, N.; Kováčik, P. Impact of vermicompost on biological indicators of the quality of soil under maize in a greenhouse experiment. J. Elem. 2019, 24, 319–330. [Google Scholar] [CrossRef]
- Liang, Q.; Chen, H.; Gong, Y.; Yang, H.; Fan, M.; Kuzyakov, Y. Effects of 15 years of manure and miner-al fertilizers on enzyme activities in particle-size fractions in a North China Plain soil. Eur. J. Soil Biol. 2014, 60, 112–119. [Google Scholar] [CrossRef]
- Luo, P.; Han, X.; Wang, Y.; Han, M.; Shi, H.; Liu, N.; Bai, H. Influence of long-term fertilization on soil microbial biomass, dehydrogenase activity, and bacterial and fungal community structure in a brown soil of northeast China. Ann. Microbiol. 2015, 65, 533–542. [Google Scholar] [CrossRef] [Green Version]
- Chu, H.; Lin, X.; Fujii, T.; Morimoto, S.; Yagi, K.; Hu, J.; Zhang, J. Soil microbial biomass, dehydrogenase activity, bacterial community structure in response to long-term fertilizer management. Soil Biol. Biochem. 2007, 39, 2971–2976. [Google Scholar] [CrossRef]
- Jahangir, M.M.R.; Nitu, T.T.; Uddin, S.; Siddaka, A.; Sarker, P.; Khan, S.; Jahiruddin, M.; Müller, C. Carbon and nitrogen accumulation in soils under conservation agriculture practices decreases with nitrogen application rates. Appl. Soil Ecol. 2021, 168, 104178. [Google Scholar] [CrossRef]
- Nikaeen, M.; Nafez, A.H.; Bina, B.; Nabavi, B.F.; Hassnzadeh, A. Respiration and enzymatic activities as indicators of stabilization of sewage sludge composting. J. Waste Manag. 2015, 39, 104–110. [Google Scholar] [CrossRef]
- Nielsen, K.; Ros, C.L.; Hoffmann, M.; Muskolus, A.; Ellmer, F.; Kautz, T. The chemical composition of biogas digestates determines their effect on soil microbial activity. Agriculture 2020, 10, 244. [Google Scholar] [CrossRef]
- Nendel, C.; Reuter, S.; Kersebaum, K.C.; Kubiak, R.; Nieder, R. Nitrogen mineralization from mature bio-waste compost in vineyard soils II. Test of N-mineralization parameters in a long-term in situ incubation experiment. J. Plant. Nutr. Soil Sci. 2005, 168, 219–227. [Google Scholar] [CrossRef]
- Zsolnay, Á. Dissolved organic matter: Artefacts, definitions, and functions. Geoderma 2003, 113, 187–209. [Google Scholar] [CrossRef]
- Pozdnyakov, L.A.; Stepanov, A.L.; Gasanov, M.E.; Semenov, M.V.; Yakimenko, O.S.; Suada, I.K.; Rai, I.N.; Shegolkova, N.M. Effect of Lignohumate on Soil Biological Activity on the Bali Island, Indonesia. Euroasian Soil Sci. 2020, 53, 653–660. [Google Scholar] [CrossRef]
- Wang, Z.; Wu, Q.J.; Wu, L.; Ritsema, C.J.; Dekker, L.W.; Feyen, J. Effects of water repellency on infiltration rate and flow instability. J. Hydrol 2000, 231–232, 265–276. [Google Scholar] [CrossRef]
- Robichaud, P.R. Infiltration rates after prescribed fire in Northern Rocky Mountain Forest. In Soil Water Repellency: Occurrence, Consequences, and Amelioration; Ritsema, C.J., Dekker, L.W., Eds.; Elsevier Science B. V.: Amsterdam, The Netherlands, 2003; pp. 203–215. [Google Scholar]
- Diamantopoulos, E.; Durner, W.; Reszkowska, A.; Bachmann, J. Effect of soil water repellency on soil hydraulic properties estimated under dynamic conditions. J. Hydrol 2013, 486, 175–186. [Google Scholar] [CrossRef]
- Mao, J.; Nierop, K.G.J.; Dekker, S.C.; Dekker, L.W.; Chen, B. Understanding the mechanisms of soil water repellency from nanoscale to ecosystem scale: A review. J. Soils Sediments 2019, 19, 171–185. [Google Scholar] [CrossRef]
- Bodí, M.B.; Doerr, S.H.; Cerda, A.; Mataix-Solera, J. Hydrological effects of a layer of vegetation ash on underlying wettable and water repellent soil. Geoderma 2012, 191, 14–23. [Google Scholar] [CrossRef]
- Schrama, M.; Bardgett, R.D. Grassland invasibility varies with drought ef-fects on soil functioning. J. Ecol. 2016, 104, 1250–1258. [Google Scholar] [CrossRef] [Green Version]
- Sándor, R.; Lovino, M.; Lichner, L.; Alagna, V.; Forster, D.; Fraser, M.; Kollár, J.; Šurda, P.; Nagy, V.; Szabó, A.; et al. Impact of climate, soil properties and grassland cover on soil water repellency. Geoderma 2021, 383, 114780. [Google Scholar] [CrossRef]
- ISO 11465:1993; Soil Quality—Determination of Dry Matter and Water Content on a Mass Basis—Gravimetric Method. International Organization for Standardization: Geneva, Switzerland, 1993; 3p.


| Soil Sample | mg/kg | K:Mg | pH (H2O) | pH (H2O) | |||
|---|---|---|---|---|---|---|---|
| P | K | Ca | Mg | ||||
| Topsoil (0–0.25 m) | 148 | 343 | 3596 | 192 | 1.78 | 5.75 | 6.3 |
| Subsoil (0.25–0.40 m) | 225 | 98 | 2843 | 71 | 1.38 | 6.15 | 6.7 |
| Variants | Group | Characteristic |
|---|---|---|
| V1 | No roof—without simulation of drought | Control |
| V2 | No roof—without simulation of drought | 84 kg N/ha |
| V3 | Roof—simulation of drought | Control |
| V4 | Roof—simulation of drought | 84 kg N/ha |
| V5 | Roof—simulation of drought | 84 kg N/ha + 1.25 LG B/ha |
| Measurement | 2013 | 2014 | 2015 | |||
|---|---|---|---|---|---|---|
| Application | Weighing | Application | Weighing | Application | Weighing | |
| First cycle | 21 May | 23 April | 29 April | |||
| 28 May | 5 May | 6 May | ||||
| 5 June | 12 May | 12 May | ||||
| 12 June | 18 June | 19 May | 21 May | 26 May | 29 May | |
| Second cycle | 3 July | 26 May | 9 June | |||
| 10 July | 5 June | 16 June | ||||
| 16 July | - | 24 June | ||||
| 31 July | 3 Aug | - | 11 June | 29 June | 8 July | |
| Third cycle | 28 August | 23 June | 13 July | |||
| 4 September | 1 July | 22 July | ||||
| 10 September | 8 July | - | ||||
| 25 September | 3 Oct | 14 July | 5 Aug | - | 7 Aug | |
| Variants | 2013 | 2014 | 2015 | ||||||
|---|---|---|---|---|---|---|---|---|---|
| Dry Matter (g) | ± SD | HSD | Dry Matter (g) | ± SD | HSD | Dry Matter (g) | ±SD | HSD | |
| V1 | 73.31 * | 1.52 | AC | 33.53 | 1.71 | AC | 45.12 | 2.69 | A |
| V2 | 76.72 * | 1.63 | A | 59.93 | 2.26 | B | 47.53 | 1.06 | A |
| V3 | 57.70 * | 1.57 | B | 29.56 | 2.08 | C | 29.47 | 1.04 | B |
| V4 | 68.93 * | 1.06 | C | 41.80 | 2.37 | A | 33.14 | 0.95 | B |
| V5 | 66.81 * | 2.20 | C | 41.34 | 1.18 | A | 29.62 | 1.22 | B |
| Variants | 2013 | 2014 | 2015 | |||||||||
|---|---|---|---|---|---|---|---|---|---|---|---|---|
| Before Simulation of Drought | After Simulation of Drought | Before Simulation of Drought | After Simulation of Drought | Before Simulation of Drought | After Simulation of Drought | |||||||
| BR | ±SD | BR | ±SD | BR | ±SD | BR | ±SD | BR | ±SD | BR | ±SD | |
| V1(R) | 5.40 | 0.66 a | 3.02 | 0.92 a | 4.01 | 0.42 abc | 2.07 | 0.12 ab | 4.42 | 0.82 a | 1.67 | 0.47 a |
| V2(R) | 6.20 | 0.38 a | 2.65 | 0.29 abc | 4.40 | 0.30 abc | 2.95 | 0.41 ab | 5.25 | 0.78 a | 1.29 | 0.49 a |
| V3(R) | 4.53 | 0.31 a | 1.32 | 0.03 b | 2.59 | 0.17 b | 2.01 | 0.25 ab | 4.26 | 0.17 a | 1.01 | 0.09 a |
| V4(R) | 5.14 | 0.19 a | 1.63 | 0.13 abcd | 1.66 | 0.11 b | 1.73 | 0.28 b | 4.69 | 0.25 a | 0.30 | 0.16 a |
| V5(R) | 6.32 | 0.71 a | 2.24 | 0.11 abcd | 1.83 | 0.12 b | 2.32 | 0.19 ab | 4.31 | 0.07 a | 1.02 | 0.13 a |
| V1(NR) | 4.59 | 0.54 a* | 1.41 | 0.22 abcd | 6.60 | 1.98 a* | 3.83 | 0.16 a | 6.06 | 0.54 a* | 2.26 | 0.25 a |
| V2(NR) | 4.58 | 0.41 a | 1.40 | 0.19 abcd | 4.71 | 0.48 abc | 3.68 | 0.80 a | 5.92 | 0.8 8a | 1.62 | 0.29 a |
| V3(NR) | 4.84 | 0.54 a | 0.91 | 0.15 c | 3.22 | 0.17 c | 3.56 | 0.35 a | 5.63 | 0.37 a | 1.68 | 0.42 a |
| V4(NR) | 4.27 | 0.05 a | 1.10 | 0.09 d | 1.77 | 0.04 c | 2.46 | 0.40 a | 4.95 | 0.48 a | 1.03 | 0.47 a |
| V5(NR) | 4.13 | 0.03 a | 1.50 | 0.10 abcd | 1.84 | 0.20 c | 3.07 | 0.33 a | 5.07 | 0.60 a | 1.00 | 0.39 a |
| Variants | 2013 | 2014 | 2015 | ||||||
|---|---|---|---|---|---|---|---|---|---|
| Across Groups Among All Variants (R + NR) | Between Periods “Before and After” in One Variant (R|NR) | Across Groups Among All Variants (R + NR) | Between Periods “Before and After” in One Variant (R|NR) | Across Groups Among All Variants (R + NR) | Between Periods “Before and After” in One Variant (R|NR) | ||||
| Before | After | Before | Before | Before | After | ||||
| V1(R) | A | A | * | ABC | AB | * | A | AB | * |
| V2(R) | A | ABD | * | ABC | AB | * | A | AB | * |
| V3(R) | A | BC | * | B | AB | - | A | AB | * |
| V4(R) | A | ABCD | * | B | B | - | A | B | * |
| V5(R) | A | ABCD | * | B | AB | - | A | AB | * |
| V1(NR) | A | ABCD | * | A | A | - | A | A | * |
| V2(NR) | A | ABCD | * | ABC | A | - | A | AB | * |
| V3(NR) | A | C | * | C | AB | - | A | AB | * |
| V4(NR) | A | D | * | C | AB | - | A | AB | * |
| V5(NR) | A | ABCD | * | C | AB | - | A | AB | * |
| Variants | 2014 | 2015 | ||||
|---|---|---|---|---|---|---|
| Before | After | Difference | Before | After | Difference | |
| V1(R) | A | A | - | A | A | |
| V2(R) | A | A | - | A | A | |
| V3(R) | B | B | - | B | B | * |
| V4(R) | B | B | - | B | B | * |
| V5(R) | B | B | - | A | B | * |
| V1(NR) | B | B | - | BC | BC | |
| V2(NR) | B | B | - | B | B | * |
| V3(NR) | B | B | - | BC | BC | * |
| V4(NR) | B | B | - | C | BC | |
| V5(NR) | B | B | - | BC | C | * |
| Variants | 2013 | 2014 | 2015 | ||||||
|---|---|---|---|---|---|---|---|---|---|
| Before | After | Diff. | Before | After | Diff. | Before | After | Diff. | |
| V1 | A | A | * | A | AC | * | AB | A | * |
| V2 | A | B | * | A | BCD | * | AB | B | * |
| V3 | A | C | * | A | C | * | A | C | * |
| V4 | A | D | * | A | D | * | B | D | * |
| V5 | A | C | * | A | C | * | AB | C | * |
| Variants | Range of Values Compared | R | SD from R | SD of Estimate | p-Value |
|---|---|---|---|---|---|
| Leaching of Nmin 2013 | 15 | −0.67 | 0.2051 | 0.9523 | 0.0002 |
| Leaching of Nmin 2014 | 15 | −0.06 | 0.2768 | 0.8963 | 0.8245 |
| Leaching of Nmin 2015 | 15 | −0.69 | 0.2034 | 0.4181 | 0.0001 |
| Variants | 2013 | 2014 | 2015 | |||||||||
|---|---|---|---|---|---|---|---|---|---|---|---|---|
| Before Simulation of Drought | After Simulation of Drought | Before Simulation of Drought | After Simulation of Drought | Before Simulation of Drought | After Simulation of Drought | |||||||
| Kr ± SD (×10−4) | HSD | Kr ± SD (×10−4) | HSD | Kr ± SD (×10−4) | HSD | Kr ± SD (×10−4) | HSD | Kr ± SD (×10−4) | HSD | Kr ± SD (×10−4) | HSD | |
| V1(R) | 1.44 ± 0.45 | A | 1.94 ± 0.38 | A | 1.57 ± 0.26 | A | 2.29 ± 0.24 | ABC | 2.01 ± 0.62 | AB | 2.59 ± 0.31 | AB |
| V2(R) | 2.46 ± 0.41 | A | 0.72 ± 0.33 | A | 2.05 ± 0.47 | A | 2.07 ± 0.56 | ABC | 0.24 ± 0.05 * | A | 2.67 ± 0.25 | AB |
| V3(R) | 2.34 ± 0.29 | A | 2.10 ± 0.49 | A | 2.33 ± 0.23 | A | 1.11 ± 0.49 | A | 1.44 ± 0.17 | AB | 0.88 ± 0.11 | A |
| V4(R) | 2.18 ± 0.62 | A | 1.81 ± 0.18 | A | 2.17 ± 0.20 | A | 1.40 ± 0.32 | AB | 1.51 ± 0.69 | AB | 1.48 ± 0.40 | AB |
| V5(R) | 1.59 ± 0.27 | A | 1.17 ± 0.35 | A | 1.82 ± 0.05 | A | 1.91 ± 0.19 | ABC | 2.03 ± 0.10 | AB | 1.97 ± 0.49 | AB |
| V1(NR) | - | - | - | - | 1.58 ± 0.23 | A | 2.08 ± 0.46 | ABC | 2.65 ± 0.31 | B | 3.68 ± 0.87 | B |
| V2(NR) | - | - | - | - | 2.37 ± 0.32 | A | 3.43 ± 0.86 | B | 0.59 ± 0.12 | A | 1.70 ± 0.54 | AB |
| V3(NR) | - | - | - | - | 2.10 ± 0.59 | A | 2.46 ± 0.66 | ABC | 1.84 ± 0.28 | AB | 1.41 ± 0.13 | AB |
| V4(NR) | - | - | - | - | 2.12 ± 0.21 | A | 3.31 ± 0.13 | ABC | 2.12 ± 0.51 | AB | 3.01 ± 1.06 | AB |
| V5(NR) | - | - | - | - | 2.96 ± 0.37 | A | 4.14 ± 0.09 | C | 2.95 ± 0.26 | B | 1.77 ± 0.66 | AB |
Disclaimer/Publisher’s Note: The statements, opinions and data contained in all publications are solely those of the individual author(s) and contributor(s) and not of MDPI and/or the editor(s). MDPI and/or the editor(s) disclaim responsibility for any injury to people or property resulting from any ideas, methods, instructions or products referred to in the content. |
© 2023 by the authors. Licensee MDPI, Basel, Switzerland. This article is an open access article distributed under the terms and conditions of the Creative Commons Attribution (CC BY) license (https://creativecommons.org/licenses/by/4.0/).
Share and Cite
Elbl, J.; Lukas, V.; Sobotková, J.; Huňady, I.; Kintl, A. Effect of Drought on the Development of Deschampsia caespitosa (L.) and Selected Soil Parameters during a Three-Year Lysimetric Experiment. Life 2023, 13, 745. https://doi.org/10.3390/life13030745
Elbl J, Lukas V, Sobotková J, Huňady I, Kintl A. Effect of Drought on the Development of Deschampsia caespitosa (L.) and Selected Soil Parameters during a Three-Year Lysimetric Experiment. Life. 2023; 13(3):745. https://doi.org/10.3390/life13030745
Chicago/Turabian StyleElbl, Jakub, Vojtěch Lukas, Julie Sobotková, Igor Huňady, and Antonín Kintl. 2023. "Effect of Drought on the Development of Deschampsia caespitosa (L.) and Selected Soil Parameters during a Three-Year Lysimetric Experiment" Life 13, no. 3: 745. https://doi.org/10.3390/life13030745