
Malnutrition Patterns in Children with Chronic Kidney Disease


Abstract
:1. Introduction
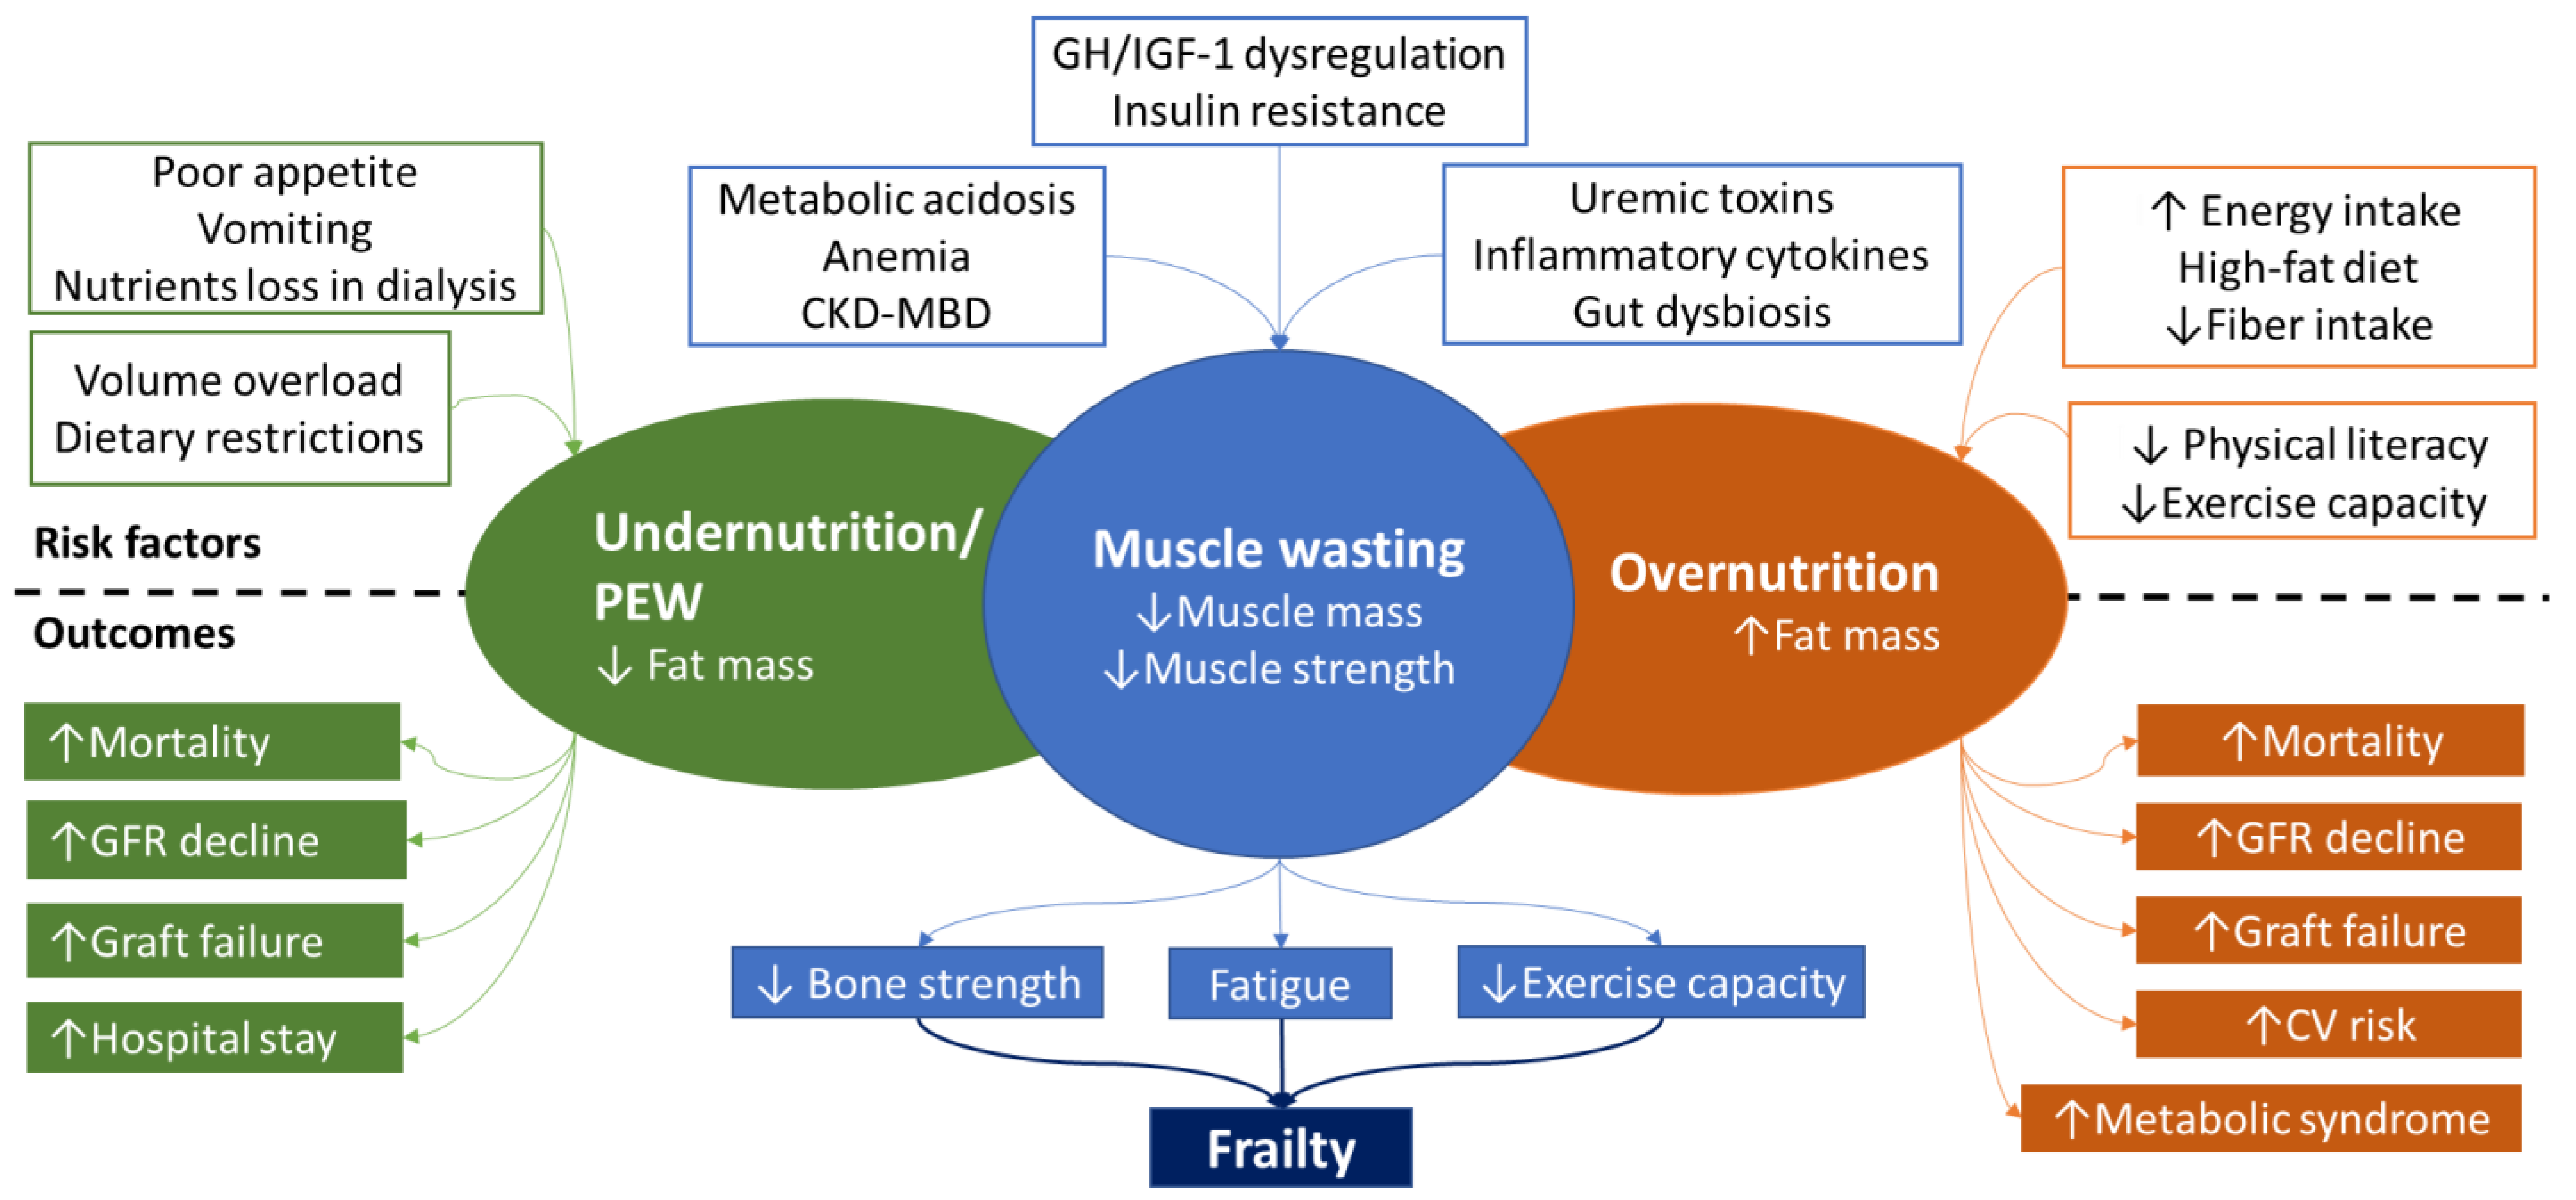
2. Malnutrition Patterns and Outcomes in Children with CKD
3. Trends in Malnutrition Patterns and Risk Factors
4. Muscle Wasting and Outcomes in Children with CKD
5. Undernutrition/PEW and Muscle Wasting in Children with CKD
6. Obesity and Muscle Wasting
6.1. General Population
6.2. Children with CKD
7. Body Composition Assessment
- WtHr seems to be a promising marker of abdominal adiposity and related cardiovascular risk in large-scale CKD pediatric studies. However, the cut-off for high WtHr in children with CKD is not defined. Moreover, abdominal adipose tissue consists of both subcutaneous and visceral fat deposits. In adult CKD patients, visceral fat was strongly correlated to WtHr in CKD patients [99], but similar studies are lacking in pediatric populations [86]. In addition, WtHr may overestimate body fat in children with clinical edema and may be unsuitable in children on peritoneal dialysis [100].
- Mid-arm circumference (MAC) and mid-arm muscle circumference (MAMC) are applied for the measurement of mid-arm muscle mass. Specifically, MAMC is calculated based on SFT and MAC levels, based on the following equation: MAMC = MAC − (3.1415 × triceps SFT). In adult CKD studies, higher MAMC and MAC were significantly associated with better survival rates in patients on chronic hemodialysis [102,103]. In pediatric patients, MAC was suggested as a marker of PEW [8,9]. Nevertheless, these anthropometric techniques are currently not recommended by KDOQI guidelines for routine nutritional evaluation of pediatric CKD patients [104]. Firstly, their levels vary according to patient hydration status and the high intra-observer and inter-observer variability limits their accuracy. In addition, the lack of MAC to differentiate between mid-arm subcutaneous fat and muscle mass, further reduces its value for estimation of the actual patient muscle mass status. In the general pediatric population, MAC was more useful for predicting regional fat rather than muscle mass [105]. Moreover, possible abnormal muscle regional distribution limits their precision for estimation of total body muscle mass [106].
- DXA is quick method, based on a three-compartment model, and estimates the amount of total body fat, bone mineral and bone-free fat-free mass, according to tissue density properties [59,107]. It is widely considered as a precise method for body composition measurement in the general pediatric population [59,107] and it is validated by the EWGSOP for muscle quantity evaluation [6]. Another advantage of DXA is that it provides segmental body composition assessment, including the measurement of appendicular skeletal muscle and trunk-to-leg fat mass ratio. Nevertheless, the small dose of ionizing radiation limits its application in clinical practice for regular body composition evaluation. Furthermore, possible altered tissue density and hydration status in CKD patients may decrease the accuracy of its results [59,100,106].
- Air-displacement plethysmography (ADP) is a quick, non-invasive method, based on a two-compartment model, and uses tissue volume to calculate tissue density properties and estimate fat and fat-free mass [59,107]. It is equal to DXA in terms of accuracy for body composition assessment [59]. The disadvantage of this technique is that is expensive and not easily available in clinical practice and, as with DXA, it is less suitable for individuals with excess fluid retention and under-mineralization [59,100,106].
- Bioimpedance analysis (BIA) is a convenient, easy to perform, bedside tool, which indirectly calculates a two-compartment model, including fat mass and fat-free mass, according to tissue electrical impedance (resistance and reactance) properties. Although its accuracy on an individual level is reduced compared to DXA and ADP [59], it is approved by the EWGSOP for determination of muscle quantity [6]. Moreover, its affordability, portability and relatively low cost make it the most appealing method for nutritional evaluation monitoring [6]. Nevertheless, since total body water (TBW) measurement is used to estimate lean body mass, patient overhydration may lead to overestimation of fat-free mass and underestimation of fat mass [106]. Moreover, BIA-derived results are influenced by the total level of body fat mass, given that the extracellular water (ECW)-to-TBW ratio is greater in obese individuals and lower in lean individuals [59,107]. The multifrequency BIS distinguishes TBW into intracellular water (ICW) and ECW compartments and provides a three-compartment model, including lean mass, adipose tissue mass and overhydration compartment [107]. Moreover, it estimates body cell mass (BCM), consisting of lean and intracellular lean water masses [107]. This method has been recently validated for hydration status assessment and provides an excellent intra- and inter-rater reproducibility in the pediatric population [111], while it seems to be a valuable prognostic tool, at least at a population level, in CKD adult patients [112]. Further studies are needed to determine its utility in CKD pediatric populations.
- Whole body potassium scanning (TBK) measures BCM, since total body potassium is proportional to BCM, and subsequently provides an estimation of lean mass [106]. Nevertheless, this technique is not widely available and the increased tissue K concentration possibly observed in CKD limits its accuracy [106].
- Isotope dilution measures TBW and subsequently estimates fat-free mass. Although this technique is easily applied in pediatric patients, it is not accessible in most centers and hydration variability may skew its results in CKD pediatric patients [106].
8. Assessment of Muscle Strength and Physical Performance
9. Recombinant Growth Hormone Therapy
10. Physical Activity
11. Conclusions
Funding
Institutional Review Board Statement
Informed Consent Statement
Data Availability Statement
Conflicts of Interest
References
- Nittari, G.; Scuri, S.; Sagaro, G.G.; Petrelli, F.; Grappasonni, I. Epidemiology of Obesity in Children and Adolescents. In Teamwork in Healthcare; Intechopen: London, UK, 2021. [Google Scholar] [CrossRef]
- Williams, J.; Buoncristiano, M.; Nardone, P.; Rito, A.I.; Spinelli, A.; Hejgaard, T.; Kierkegaard, L.; Nurk, E.; Kunešová, M.; Milanović, S.M.; et al. A Snapshot of European Children’s Eating Habits: Results from the Fourth Round of the WHO European Childhood Obesity Surveillance Initiative (COSI). Nutrients 2020, 12, 2481. [Google Scholar] [CrossRef]
- Zembura, M.; Matusik, P. Sarcopenic Obesity in Children and Adolescents: A Systematic Review. Front. Endocrinol. 2022, 13, 914740. [Google Scholar] [CrossRef] [PubMed]
- Rees, L. Protein energy wasting; what is it and what can we do to prevent it? Pediatr. Nephrol. 2021, 36, 287–294. [Google Scholar] [CrossRef] [PubMed] [Green Version]
- Bonthuis, M.; Van Stralen, K.J.; Verrina, E.E.; Groothoff, J.W.; Melgar, Á.A.; Edefonti, A.; Fischbach, M.; Mendes, P.; Molchanova, E.A.; Paripović, D.; et al. Underweight, overweight and obesity in paediatric dialysis and renal transplant patients. Nephrol. Dial. Transplant. 2013, 28, iv195–iv204. [Google Scholar] [CrossRef] [PubMed] [Green Version]
- Cruz-Jentoft, A.J.; Bahat, G.; Bauer, J.; Boirie, Y.; Bruyère, O.; Cederholm, T.; Cooper, C.; Landi, F.; Rolland, Y.; Sayer, A.A.; et al. Sarcopenia: Revised European consensus on definition and diagnosis. Age Ageing 2019, 48, 16–31. [Google Scholar] [CrossRef] [PubMed] [Green Version]
- Fouque, D.; Kalantar-Zadeh, K.; Kopple, J.; Cano, N.; Chauveau, P.; Cuppari, L.; Franch, H.; Guarnieri, G.; Ikizler, T.A.; Kaysen, G.; et al. A proposed nomenclature and diagnostic criteria for protein–energy wasting in acute and chronic kidney disease. Kidney Int. 2008, 73, 391–398. [Google Scholar] [CrossRef] [Green Version]
- Oliveira, E.A.; Cheung, W.W.; Toma, K.G.; Mak, R.H. Muscle wasting in chronic kidney disease. Pediatr. Nephrol. 2017, 33, 789–798. [Google Scholar] [CrossRef]
- Abraham, A.G.; Mak, R.H.; Mitsnefes, M.; White, C.; Moxey-Mims, M.; Warady, B.; Furth, S.L. Protein energy wasting in children with chronic kidney disease. Pediatr. Nephrol. 2014, 29, 1231–1238. [Google Scholar] [CrossRef] [Green Version]
- Sgambat, K.; Matheson, M.B.; Hooper, S.R.; Warady, B.; Furth, S.; Moudgil, A. Prevalence and outcomes of fragility: A frailty-inflammation phenotype in children with chronic kidney disease. Pediatr. Nephrol. 2019, 34, 2563–2569. [Google Scholar] [CrossRef]
- Worthen, G.; Tennankore, K. Frailty Screening in Chronic Kidney Disease: Current Perspectives. Int. J. Nephrol. Renov. Dis. 2019, 12, 229–239. [Google Scholar] [CrossRef] [Green Version]
- Rees, L.; Mak, R.H. Nutrition and growth in children with chronic kidney disease. Nat. Rev. Nephrol. 2011, 7, 615–623. [Google Scholar] [CrossRef] [PubMed]
- Olson, B.; Marks, D.L.; Grossberg, A.J. Diverging metabolic programmes and behaviours during states of starvation, protein malnutrition, and cachexia. J. Cachex-Sarcopenia Muscle 2020, 11, 1429–1446. [Google Scholar] [CrossRef] [PubMed]
- Cederholm, T.; Bosaeus, I.; Barazzoni, R.; Bauer, J.; Van Gossum, A.; Klek, S.; Muscaritoli, M.; Nyulasi, I.; Ockenga, J.; Schneider, S.; et al. Diagnostic criteria for malnutrition—An ESPEN Consensus Statement. Clin. Nutr. 2015, 34, 335–340. [Google Scholar] [CrossRef] [PubMed]
- Ku, E.; Kopple, J.D.; McCulloch, C.E.; Warady, B.A.; Furth, S.L.; Mak, R.H.; Grimes, B.A.; Mitsnefes, M. Associations Between Weight Loss, Kidney Function Decline, and Risk of ESRD in the Chronic Kidney Disease in Children (CKiD) Cohort Study. Am. J. Kidney Dis. 2018, 71, 648–656. [Google Scholar] [CrossRef]
- Rodig, N.M.; Roem, J.; Schneider, M.F.; Seo-Mayer, P.W.; Reidy, K.J.; Kaskel, F.J.; Kogon, A.J.; Furth, S.L.; Warady, B.A. Longitudinal outcomes of body mass index in overweight and obese children with chronic kidney disease. Pediatr. Nephrol. 2021, 36, 1851–1860. [Google Scholar] [CrossRef]
- Kogon, A.J.; Roem, J.; Schneider, M.F.; Mitsnefes, M.M.; Zemel, B.S.; Warady, B.A.; Furth, S.L.; Rodig, N.M. Associations of body mass index (BMI) and BMI change with progression of chronic kidney disease in children. Pediatr. Nephrol. 2022, 38, 1257–1266. [Google Scholar] [CrossRef] [PubMed]
- Wong, C.S.; Gipson, D.S.; Gillen, D.L.; Emerson, S.; Koepsell, T.; Sherrard, D.J.; Watkins, S.L.; Stehman-Breen, C. Anthropometric measures and risk of death in children with end-stage renal disease. Am. J. Kidney Dis. 2000, 36, 811–819. [Google Scholar] [CrossRef] [PubMed]
- Furth, S.L.; Stablein, D.; Fine, R.N.; Powe, N.R.; Fivush, B.A. Adverse Clinical Outcomes Associated With Short Stature at Dialysis Initiation: A Report of the North American Pediatric Renal Transplant Cooperative Study. Pediatrics 2002, 109, 909–913. [Google Scholar] [CrossRef]
- Furth, S.L.; Hwang, W.; Yang, C.; Neu, A.M.; Fivush, B.A.; Powe, N.R. Growth failure, risk of hospitalization and death for children with end-stage renal disease. Pediatr. Nephrol. 2002, 17, 450–455. [Google Scholar] [CrossRef]
- Schaefer, F.; Benner, L.; Borzych-Dużałka, D.; Zaritsky, J.; Xu, H.; Rees, L.; Antonio, Z.L.; Serdaroglu, E.; Hooman, N.; Patel, H.; et al. Global Variation of Nutritional Status in Children Undergoing Chronic Peritoneal Dialysis: A Longitudinal Study of the International Pediatric Peritoneal Dialysis Network. Sci. Rep. 2019, 9, 4886. [Google Scholar] [CrossRef] [Green Version]
- Ku, E.; Fine, R.N.; Hsu, C.-Y.; McCulloch, C.; Glidden, D.V.; Grimes, B.; Johansen, K.L. Height at First RRT and Mortality in Children. Clin. J. Am. Soc. Nephrol. 2016, 11, 832–839. [Google Scholar] [CrossRef] [PubMed] [Green Version]
- Kaur, K.; Jun, D.; Grodstein, E.; Singer, P.; Castellanos, L.; Teperman, L.; Molmenti, E.; Fahmy, A.; Frank, R.; Infante, L.; et al. Outcomes of underweight, overweight, and obese pediatric kidney transplant recipients. Pediatr. Nephrol. 2018, 33, 2353–2362. [Google Scholar] [CrossRef] [PubMed]
- Hanevold, C.D.; Ho, P.-L.; Talley, L.; Mitsnefes, M.M. Obesity and Renal Transplant Outcome: A Report of the North American Pediatric Renal Transplant Cooperative Study. Pediatrics 2005, 115, 352–356. [Google Scholar] [CrossRef]
- Winnicki, E.; Dharmar, M.; Tancredi, D.J.; Nguyen, S.; Butani, L. Effect of BMI on allograft function and survival in pediatric renal transplant recipients. Pediatr. Nephrol. 2018, 33, 1429–1435. [Google Scholar] [CrossRef] [PubMed]
- Ku, E.; Glidden, D.V.; Hsu, C.-Y.; Portale, A.A.; Grimes, B.; Johansen, K.L. Association of Body Mass Index with Patient-Centered Outcomes in Children with ESRD. J. Am. Soc. Nephrol. 2016, 27, 551–558. [Google Scholar] [CrossRef] [Green Version]
- Brady, T.M.; Roem, J.; Cox, C.; Schneider, M.F.; Wilson, A.C.; Furth, S.L.; Warady, B.A.; Mitsnefes, M. Adiposity, Sex, and Cardiovascular Disease Risk in Children With CKD: A Longitudinal Study of Youth Enrolled in the Chronic Kidney Disease in Children (CKiD) Study. Am. J. Kidney Dis. 2020, 76, 166–173. [Google Scholar] [CrossRef]
- Karava, V.; Printza, N.; Dotis, J.; Demertzi, D.; Antza, C.; Kotsis, V.; Papachristou, F.; Stabouli, S. Body composition and arterial stiffness in pediatric patients with chronic kidney disease. Pediatr. Nephrol. 2019, 34, 1253–1260. [Google Scholar] [CrossRef]
- Patel, H.P.; Saland, J.M.; Ng, D.K.; Jiang, S.; Warady, B.A.; Furth, S.L.; Flynn, J.T. Waist Circumference and Body Mass Index in Children with Chronic Kidney Disease and Metabolic, Cardiovascular, and Renal Outcomes. J. Pediatr. 2017, 191, 133–139. [Google Scholar] [CrossRef]
- Karava, V.; Dotis, J.; Kondou, A.; Christoforidis, A.; Liakopoulos, V.; Tsioni, K.; Kollios, K.; Papachristou, F.; Printza, N. Association between relative fat mass, uric acid, and insulin resistance in children with chronic kidney disease. Pediatr. Nephrol. 2020, 36, 425–434. [Google Scholar] [CrossRef]
- Canpolat, N.; Caliskan, S.; Sever, L.; Tasdemir, M.; Ekmekci, O.B.; Pehlivan, G.; Shroff, R. Malnutrition and its association with inflammation and vascular disease in children on maintenance dialysis. Pediatr. Nephrol. 2013, 28, 2149–2156. [Google Scholar] [CrossRef]
- Karava, V.; Christoforidis, A.; Kondou, A.; Dotis, J.; Printza, N. Update on the Crosstalk Between Adipose Tissue and Mineral Balance in General Population and Chronic Kidney Disease. Front. Pediatr. 2021, 9, 696942. [Google Scholar] [CrossRef] [PubMed]
- Karava, V.; Kondou, A.; Dotis, J.; Christoforidis, A.; Taparkou, A.; Tsioni, K.; Farmaki, E.; Kollios, K.; Siomou, E.; Liakopoulos, V.; et al. Association Between Secondary Hyperparathyroidism and Body Composition in Pediatric Patients With Moderate and Advanced Chronic Kidney Disease. Front. Pediatr. 2021, 9, 702778. [Google Scholar] [CrossRef] [PubMed]
- Kovesdy, C.P.; Ahmadzadeh, S.; Anderson, J.E.; Kalantar-Zadeh, K. Obesity Is Associated with Secondary Hyperparathyroidism in Men with Moderate and Severe Chronic Kidney Disease. Clin. J. Am. Soc. Nephrol. 2007, 2, 1024–1029. [Google Scholar] [CrossRef] [PubMed] [Green Version]
- Vanderstraeten, K.; De Pauw, R.; Knops, N.; Bouts, A.; Cransberg, K.; El Amouri, A.; Raes, A.; Prytuła, A. Body mass index is associated with hyperparathyroidism in pediatric kidney transplant recipients. Pediatr. Nephrol. 2020, 36, 977–986. [Google Scholar] [CrossRef] [PubMed]
- Behnisch, R.; Kirchner, M.; Anarat, A.; Bacchetta, J.; Shroff, R.; Bilginer, Y.; Mir, S.; Çalışkan, S.; Paripovic, D.; Harambat, J.; et al. Determinants of Statural Growth in European Children With Chronic Kidney Disease: Findings From the Cardiovascular Comorbidity in Children With Chronic Kidney Disease (4C) Study. Front. Pediatr. 2019, 7, 278. [Google Scholar] [CrossRef] [Green Version]
- Rees, L.; Jones, H. Nutritional management and growth in children with chronic kidney disease. Pediatr. Nephrol. 2012, 28, 527–536. [Google Scholar] [CrossRef]
- Van Arendonk, K.J.; Boyarsky, B.J.; Orandi, B.J.; James, N.T.; Smith, J.M.; Colombani, P.M.; Segev, D.L. National Trends Over 25 Years in Pediatric Kidney Transplant Outcomes. Pediatrics 2014, 133, 594–601. [Google Scholar] [CrossRef] [Green Version]
- Sienna, J.L.; Saqan, R.; Teh, J.C.; Frieling, M.L.; Secker, D.; Cornelius, V.; Geary, D.F. Body size in children with chronic kidney disease after gastrostomy tube feeding. Pediatr. Nephrol. 2010, 25, 2115–2121. [Google Scholar] [CrossRef]
- Filler, G.; Payne, R.P.; Orrbine, E.; Clifford, T.; Drukker, A.; McLaine, P.N. Changing trends in the referral patterns of pediatric nephrology patients. Pediatr. Nephrol. 2005, 20, 603–608. [Google Scholar] [CrossRef]
- Rashid, R.; Neill, E.; Smith, W.; King, D.; Beattie, T.J.; Murphy, A.; Ramage, I.J.; Maxwell, H.; Ahmed, S.F. Body composition and nutritional intake in children with chronic kidney disease. Pediatr. Nephrol. 2006, 21, 1730–1738. [Google Scholar] [CrossRef]
- Melhuish, E.; Lindeback, R.; Lambert, K. Scoping review of the dietary intake of children with chronic kidney disease. Pediatr. Nephrol. 2022, 37, 1995–2012. [Google Scholar] [CrossRef]
- Rätsch, I.M.; Catassi, C.; Verrina, E.E.; Gusmano, R.; Appiani, A.; Bettinelli, A.; Picca, S.; Rizzoni, G.; Fabian-Bach, C.; Wingen, A.M.; et al. Energy and nutrient intake of patients with mild-to-moderate chronic renal failure compared with healthy children: An Italian multicentre study. Eur. J. Pediatr. 1992, 151, 701–705. [Google Scholar] [CrossRef] [PubMed]
- Foreman, J.W.; Abitbol, C.L.; Trachtman, H.; Garin, E.H.; Feld, L.G.; Strife, C.F.; Massie, M.D.; Boyle, R.M.; Chan, J.C. Nutritional intake in children with renal insufficiency: A report of the growth failure in children with renal diseases study. J. Am. Coll. Nutr. 1996, 15, 579–585. [Google Scholar] [CrossRef]
- Hui, W.F.; Betoko, A.; Savant, J.D.; Abraham, A.G.; Greenbaum, L.A.; Warady, B.; Moxey-Mims, M.M.; Furth, S.L. Assessment of dietary intake of children with chronic kidney disease. Pediatr. Nephrol. 2017, 32, 485–494. [Google Scholar] [CrossRef] [PubMed] [Green Version]
- Chen, W.; Ducharme-Smith, K.; Davis, L.; Hui, W.F.; Warady, B.A.; Furth, S.L.; Abraham, A.G.; Betoko, A. Dietary sources of energy and nutrient intake among children and adolescents with chronic kidney disease. Pediatr. Nephrol. 2017, 32, 1233–1241. [Google Scholar] [CrossRef]
- El Amouri, A.; Snauwaert, E.; Foulon, A.; Moortel, C.V.; Van Dyck, M.; Van Hoeck, K.; Godefroid, N.; Glorieux, G.; Van Biesen, W.; Walle, J.V.; et al. Dietary fibre intake is low in paediatric chronic kidney disease patients but its impact on levels of gut-derived uraemic toxins remains uncertain. Pediatr. Nephrol. 2021, 36, 1589–1595. [Google Scholar] [CrossRef]
- Armstrong, J.E.; Laing, D.G.; Wilkes, F.J.; Kainer, G. Smell and taste function in children with chronic kidney disease. Pediatr. Nephrol. 2010, 25, 1497–1504. [Google Scholar] [CrossRef] [PubMed]
- Clark, S.L.; Denburg, M.R.; Furth, S.L. Physical activity and screen time in adolescents in the chronic kidney disease in children (CKiD) cohort. Pediatr. Nephrol. 2016, 31, 801–808. [Google Scholar] [CrossRef] [PubMed] [Green Version]
- Hamiwka, L.A.; Cantell, M.; Crawford, S.; Clark, C.G. Physical activity and health related quality of life in children following kidney transplantation. Pediatr. Transplant. 2009, 13, 861–867. [Google Scholar] [CrossRef] [PubMed]
- El-Gamasy, M.A.; Eldeeb, M.M. Assessment of physical and psychosocial status of children with ESRD under regular hemodialysis, a single centre experience. Int. J. Pediatr. Adolesc. Med. 2017, 4, 81–86. [Google Scholar] [CrossRef]
- Wilkinson, T.J.; O’Mahoney, L.L.; Highton, P.; Viana, J.L.; Ribeiro, H.S.; Lightfoot, C.J.; Curtis, F.; Khunti, K. Physical activity and the ‘pediatric inactivity triad’ in children living with chronic kidney disease: A narrative review. Ther. Adv. Chronic Dis. 2022, 13, 20406223221109971. [Google Scholar] [CrossRef] [PubMed]
- Patel, D.R.; Sankar Raj, V.M.; Torres, A. Chronic kidney disease, exercise, and sports in children, adolescents, and adults. Phys. Sportsmed. 2009, 37, 11–19. [Google Scholar] [CrossRef] [PubMed]
- Karava, V.; Goutou, S.; Dotis, J.; Kondou, A.; Charela, E.; Dadoudi, O.; Eleftheriadis, T.; Stefanidis, I.; Printza, N. Fatigue and Quality of Life in Children with Chronic Kidney Disease. Children 2022, 9, 1414. [Google Scholar] [CrossRef] [PubMed]
- Sabatino, A.; Cuppari, L.; Stenvinkel, P.; Lindholm, B.; Avesani, C.M. Sarcopenia in chronic kidney disease: What have we learned so far? J. Nephrol. 2021, 34, 1347–1372. [Google Scholar] [CrossRef] [PubMed]
- Karava, V.; Dotis, J.; Christoforidis, A.; Kondou, A.; Printza, N. Muscle-bone axis in children with chronic kidney disease: Current knowledge and future perspectives. Pediatr. Nephrol. 2021, 36, 3813–3827. [Google Scholar] [CrossRef]
- Hogan, J.; Schneider, M.F.; Pai, R.; Denburg, M.R.; Kogon, A.; Brooks, E.R.; Kaskel, F.J.; Reidy, K.J.; Saland, J.M.; Warady, B.A.; et al. Grip strength in children with chronic kidney disease. Pediatr. Nephrol. 2020, 35, 891–899. [Google Scholar] [CrossRef]
- Silva, M.I.B.; Picard, K.; Klein, M.R.S.T. Sarcopenia and sarcopenic obesity in chronic kidney disease: Update on prevalence, outcomes, risk factors and nutrition treatment. Curr. Opin. Clin. Nutr. Metab. Care 2022, 25, 371–377. [Google Scholar] [CrossRef]
- Ooi, P.H.; Thompson-Hodgetts, S.; Pritchard-Wiart, L.; Gilmour, S.M.; Mager, D.R. Pediatric Sarcopenia: A Paradigm in the Overall Definition of Malnutrition in Children? J. Parenter. Enter. Nutr. 2020, 44, 407–418. [Google Scholar] [CrossRef]
- Mckirdy, S.; Nichols, B.; Williamson, S.; Gerasimidis, K. Handgrip strength as a surrogate marker of lean mass and risk of malnutrition in paediatric patients. Clin. Nutr. 2021, 40, 5189–5195. [Google Scholar] [CrossRef]
- Lee, D.Y.; Wetzsteon, R.J.; Zemel, B.S.; Shults, J.; Organ, J.M.; Foster, B.J.; Herskovitz, R.M.; Foerster, D.L.; Leonard, M.B. Muscle torque relative to cross-sectional area and the functional muscle-bone unit in children and adolescents with chronic disease. J. Bone Miner. Res. 2014, 30, 575–583. [Google Scholar] [CrossRef] [Green Version]
- Painter, P.; Krasnoff, J.; Mathias, R. Exercise capacity and physical fitness in pediatric dialysis and kidney transplant patients. Pediatr. Nephrol. 2007, 22, 1030–1039. [Google Scholar] [CrossRef] [PubMed]
- Alaylı, G.; Özkaya, O.; Bek, K.; Çalmaşur, A.; Diren, H.B.; Bek, Y.; Cantürk, F. Physical function, muscle strength and muscle mass in children on peritoneal dialysis. Pediatr. Nephrol. 2008, 23, 639–644. [Google Scholar] [CrossRef]
- Karava, V.; Dotis, J.; Christoforidis, A.; Liakopoulos, V.; Kondou, A.; Tsigaras, G.; Tsioni, K.; Kollios, K.; Printza, N. Association between insulin growth factor-1, bone mineral density, and frailty phenotype in children with chronic kidney disease. Pediatr. Nephrol. 2021, 36, 1861–1870. [Google Scholar] [CrossRef] [PubMed]
- Tenbrock, K.; Kruppa, S.; Mokov, E.; Querfeld, U.; Michalk, D.; Schoenau, E. Analysis of muscle strength and bone structure in children with renal disease. Pediatr. Nephrol. 2000, 14, 669–672. [Google Scholar] [CrossRef]
- Souweine, J.S.; Pasquier, G.; Kuster, N.; Rodriguez, A.; Patrier, L.; Morena, M. Dynapaenia and sarcopaenia in chronic haemodialysis patients: Do muscle weakness and atrophy similarly influence poor outcome? Nephrol. Dial. Transplant. 2021, 36, 1908–1918. [Google Scholar] [CrossRef] [PubMed]
- Hayashi, H.; Izumiya, Y.; Hayashi, O.; Ichii, M.; Tsujimoto, Y.; Yoshiyama, M. Dynapenia is an independent predictor of cardio-cerebrovascular events in patients undergoing hemodialysis. Heart Vessels 2022, 37, 1066–1074. [Google Scholar] [CrossRef] [PubMed]
- Chang, Y.-T.; Wu, H.-L.; Guo, H.-R.; Cheng, Y.-Y.; Tseng, C.-C.; Wang, M.-C.; Lin, C.-Y.; Sung, J.-M. Handgrip strength is an independent predictor of renal outcomes in patients with chronic kidney diseases. Nephrol. Dial. Transplant. 2011, 26, 3588–3595. [Google Scholar] [CrossRef] [Green Version]
- Evans, W.J.; Morley, J.E.; Argilés, J.; Bales, C.; Baracos, V.; Guttridge, D.; Jatoi, A.; Kalantar-Zadeh, K.; Lochs, H.; Mantovani, G.; et al. Cachexia: A new definition. Clin. Nutr. 2008, 27, 793–799. [Google Scholar] [CrossRef]
- Wilkinson, T.J.; Gould, D.W.; Nixon, D.G.D.; Watson, E.L.; Smith, A.C. Quality over quantity? Association of skeletal muscle myosteatosis and myofibrosis on physical function in chronic kidney disease. Nephrol. Dial. Transplant. 2019, 34, 1344–1353. [Google Scholar] [CrossRef]
- Zhao, H.-L.; Sui, Y.; Guan, J.; He, L.; Zhu, X.; Fan, R.-R.; Xu, G.; Kong, A.P.; Ho, C.S.; Lai, F.M.; et al. Fat redistribution and adipocyte transformation in uninephrectomized rats. Kidney Int. 2008, 74, 467–477. [Google Scholar] [CrossRef] [Green Version]
- Keddar, M.; Muylle, T.; Carrie, E.; Trefois, P.; Nachit, M.; Crott, R.; Christiaens, C.; Bammens, B.; Jadoul, M.; Goffin, E.; et al. Non-invasive Quantification of Fat Deposits in Skeletal Muscle Predicts Cardiovascular Outcome in Kidney Failure. Front. Physiol. 2020, 11, 130. [Google Scholar] [CrossRef] [PubMed]
- Iyengar, A.; Kuriyan, R.; Kurpad, A.; Vasudevan, A. Body fat in children with chronic kidney disease—A comparative study of bio-impedance analysis with dual energy X-ray absorptiometry. Indian J. Nephrol. 2021, 31, 39–42. [Google Scholar] [CrossRef] [PubMed]
- Okorodudu, D.O.; Jumean, M.F.; Montori, V.M.; Romero-Corral, A.; Somers, V.K.; Erwin, P.J.; Lopez-Jimenez, F. Diagnostic performance of body mass index to identify obesity as defined by body adiposity: A systematic review and meta-analysis. Int. J. Obes. 2010, 34, 791–799. [Google Scholar] [CrossRef] [PubMed] [Green Version]
- Franco, L.P.; Morais, C.C.; Cominetti, C. Normal-weight obesity syndrome: Diagnosis, prevalence, and clinical implications. Nutr. Rev. 2016, 74, 558–570. [Google Scholar] [CrossRef]
- García-Hermoso, A.; Agostinis-Sobrinho, C.; Camargo-Villalba, G.E.; González-Jiménez, N.M.; Izquierdo, M.; Correa-Bautista, J.E.; Ramírez-Vélez, R. Normal-Weight Obesity Is Associated with Poorer Cardiometabolic Profile and Lower Physical Fitness Levels in Children and Adolescents. Nutrients 2020, 12, 1171. [Google Scholar] [CrossRef] [PubMed]
- Musálek, M.; Clark, C.C.T.; Kokštejn, J.; Vokounova, Š.; Hnízdil, J.; Mess, F. Impaired Cardiorespiratory Fitness and Muscle Strength in Children with Normal-Weight Obesity. Int. J. Environ. Res. Public Health 2020, 17, 9198. [Google Scholar] [CrossRef] [PubMed]
- Wiklund, P.; Törmäkangas, T.; Shi, Y.; Wu, N.; Vainionpää, A.; Alen, M.; Cheng, S. Normal-weight obesity and cardiometabolic risk: A 7-year longitudinal study in girls from prepuberty to early adulthood. Obesity 2017, 25, 1077–1082. [Google Scholar] [CrossRef] [Green Version]
- Musalek, M.; Kokstejn, J.; Papez, P.; Scheffler, C.; Mumm, R.; Czernitzki, A.-F.; Koziel, S. Impact of normal weight obesity on fundamental motor skills in pre-school children aged 3 to 6 years. Anthr. Anz. 2017, 74, 203–212. [Google Scholar] [CrossRef]
- Tomlinson, D.J.; Erskine, R.; Morse, C.; Winwood, K.; Onambélé-Pearson, G. The impact of obesity on skeletal muscle strength and structure through adolescence to old age. Biogerontology 2015, 17, 467–483. [Google Scholar] [CrossRef] [Green Version]
- Tallis, J.; James, R.S.; Seebacher, F. The effects of obesity on skeletal muscle contractile function. J. Exp. Biol. 2018, 221 Pt 13, jeb163840. [Google Scholar] [CrossRef] [Green Version]
- Daily, J.W.; Park, S. Sarcopenia Is a Cause and Consequence of Metabolic Dysregulation in Aging Humans: Effects of Gut Dysbiosis, Glucose Dysregulation, Diet and Lifestyle. Cells 2022, 11, 338. [Google Scholar] [CrossRef] [PubMed]
- Dhawan, D.; Sharma, S. Abdominal Obesity, Adipokines and Non-communicable Diseases. J. Steroid Biochem. Mol. Biol. 2020, 203, 105737. [Google Scholar] [CrossRef] [PubMed]
- Yoo, E.-G. Waist-to-height ratio as a screening tool for obesity and cardiometabolic risk. Korean J. Pediatr. 2016, 59, 425–431. [Google Scholar] [CrossRef] [PubMed]
- Brambilla, P.; Bedogni, G.; Heo, M.; Pietrobelli, A. Waist circumference-to-height ratio predicts adiposity better than body mass index in children and adolescents. Int. J. Obes. 2013, 37, 943–946. [Google Scholar] [CrossRef] [Green Version]
- Katzmarzyk, P.T.; Bouchard, C. Where is the beef? Waist circumference is more highly correlated with BMI and total body fat than with abdominal visceral fat in children. Int. J. Obes. 2014, 38, 753–754. [Google Scholar] [CrossRef] [Green Version]
- Martin-Calvo, N.; Moreno-Galarraga, L.; Martinez-Gonzalez, M.A. Association between Body Mass Index, Waist-to-Height Ratio and Adiposity in Children: A Systematic Review and Meta-Analysis. Nutrients 2016, 8, 512. [Google Scholar] [CrossRef] [Green Version]
- Graves, L.; Garnett, S.P.; Cowell, C.T.; Baur, L.A.; Ness, A.; Sattar, N.; Lawlor, D.A.A. Waist-to-height ratio and cardiometabolic risk factors in adolescence: Findings from a prospective birth cohort. Pediatr. Obes. 2014, 9, 327–338. [Google Scholar] [CrossRef] [Green Version]
- Khoury, M.; Manlhiot, C.; McCrindle, B.W. Role of the Waist/Height Ratio in the Cardiometabolic Risk Assessment of Children Classified by Body Mass Index. J. Am. Coll. Cardiol. 2013, 62, 742–751. [Google Scholar] [CrossRef] [Green Version]
- Maffeis, C.; Banzato, C.; Talamini, G.; Obesity Study Group of the Italian Society of Pediatric Endocrinology and Diabetology. Waist–to–Height Ratio, a Useful Index to Identify High Metabolic Risk in Overweight Children. J. Pediatr. 2008, 152, 207–213.e2. [Google Scholar] [CrossRef]
- Sgambat, K.; Roem, J.; Mitsnefes, M.; Portale, A.A.; Furth, S.; Warady, B.; Moudgil, A. Waist-to-height ratio, body mass index, and cardiovascular risk profile in children with chronic kidney disease. Pediatr. Nephrol. 2018, 33, 1577–1583. [Google Scholar] [CrossRef]
- Foster, B.J.; Kalkwarf, H.J.; Shults, J.; Zemel, B.S.; Wetzsteon, R.J.; Thayu, M.; Foerster, D.L.; Leonard, M.B. Association of Chronic Kidney Disease with Muscle Deficits in Children. J. Am. Soc. Nephrol. 2011, 22, 377–386. [Google Scholar] [CrossRef] [PubMed] [Green Version]
- Ladfors, S.W.; Bergdahl, E.; Hermannsson, O.; Kristjansson, J.; Linnér, T.; Brandström, P.; Hansson, S.; Dangardt, F. Longitudinal Follow-Up on Cardiopulmonary Exercise Capacity Related to Cardio-Metabolic Risk Factors in Children with Renal Transplants. Front. Sports Act. Living 2021, 3, 688383. [Google Scholar] [CrossRef] [PubMed]
- Aguilera, A.; Codoceo, R.; Bajo, M.A.; Iglesias, P.; Diéz, J.J.; Barril, G.; Cigarrán, S.; Álvarez, V.; Celadilla, O.; Fernández-Perpén, A.; et al. Eating Behavior Disorders in Uremia: A Question of Balance in Appetite Regulation. Semin. Dial. 2004, 17, 44–52. [Google Scholar] [CrossRef]
- Sgambat, K.; Clauss, S.; Moudgil, A. Comparison of BMI, waist circumference, and waist-to-height ratio for identification of subclinical cardiovascular risk in pediatric kidney transplant recipients. Pediatr. Transplant. 2018, 22, e13300. [Google Scholar] [CrossRef] [PubMed]
- Hsu, C.-N.; Lu, P.-C.; Tain, Y.-L. Fat Mass Index Associated with Blood Pressure Abnormalities in Children with Chronic Kidney Disease. Children 2021, 8, 621. [Google Scholar] [CrossRef] [PubMed]
- Lalan, S.; Jiang, S.; Ng, D.K.; Kupferman, F.; Warady, B.A.; Furth, S.; Mitsnefes, M.M. Cardiometabolic Risk Factors, Metabolic Syndrome, and Chronic Kidney Disease Progression in Children. J. Pediatr. 2018, 202, 163–170. [Google Scholar] [CrossRef] [Green Version]
- Nelms, C.L.; Shaw, V.; Greenbaum, L.A.; Anderson, C.; Desloovere, A.; Haffner, D.; Oosterveld, M.J.S.; Paglialonga, F.; Polderman, N.; Qizalbash, L.; et al. Assessment of nutritional status in children with kidney diseases—Clinical practice recommendations from the Pediatric Renal Nutrition Taskforce. Pediatr. Nephrol. 2020, 36, 995–1010. [Google Scholar] [CrossRef]
- Sanches, F.M.; Avesani, C.M.; Kamimura, M.A.; Lemos, M.M.; Axelsson, J.; Vasselai, P.; Draibe, S.A.; Cuppari, L. Waist Circumference and Visceral Fat in CKD: A Cross-sectional Study. Am. J. Kidney Dis. 2008, 52, 66–73. [Google Scholar] [CrossRef]
- Wells, J.C.K.; Fewtrell, M.S. Measuring body composition. Arch. Dis. Child. 2006, 91, 612–617. [Google Scholar] [CrossRef] [Green Version]
- Freedman, D.S.; Ogden, C.L.; Kit, B.K. Interrelationships between BMI, skinfold thicknesses, percent body fat, and cardiovascular disease risk factors among U.S. children and adolescents. BMC Pediatr. 2015, 15, 1–9. [Google Scholar] [CrossRef] [Green Version]
- Van Duong, T.; Wu, P.Y.; Wong, T.C.; Chen, H.H.; Chen, T.H.; Hsu, Y.H.; Peng, S.J.; Kuo, K.L.; Liu, H.C.; Lin, E.T.; et al. Mid-arm circumference, body fat, nutritional and inflammatory biomarkers, blood glucose, dialysis adequacy influence all-cause mortality in hemodialysis patients: A prospective cohort study. Medicine 2019, 98, e14930. [Google Scholar] [CrossRef] [PubMed]
- Noori, N.; Kopple, J.D.; Kovesdy, C.P.; Feroze, U.; Sim, J.J.; Murali, S.B.; Luna, A.; Gomez, M.; Luna, C.; Bross, R.; et al. Mid-Arm Muscle Circumference and Quality of Life and Survival in Maintenance Hemodialysis Patients. Clin. J. Am. Soc. Nephrol. 2010, 5, 2258–2268. [Google Scholar] [CrossRef] [PubMed] [Green Version]
- KDOQI Work Group. KDOQI Clinical Practice Guideline for Nutrition in Children with CKD: 2008 update. Executive summary. Am. J. Kidney Dis. 2009, 53 (Suppl. S2), S11–S104. [Google Scholar] [CrossRef] [PubMed] [Green Version]
- Chomtho, S.; Fewtrell, M.S.; Jaffe, A.; Williams, J.E.; Wells, J.C.K. Evaluation of Arm Anthropometry for Assessing Pediatric Body Composition: Evidence from Healthy and Sick Children. Pediatr. Res. 2006, 59, 860–865. [Google Scholar] [CrossRef] [PubMed]
- Foster, B.J.; Leonard, M.B. Measuring nutritional status in children with chronic kidney disease. Am. J. Clin. Nutr. 2004, 80, 801–814. [Google Scholar] [CrossRef] [Green Version]
- Lee, S.Y.; Gallagher, D. Assessment methods in human body composition. Curr. Opin. Clin. Nutr. Metab. Care 2008, 11, 566–572. [Google Scholar] [CrossRef] [Green Version]
- Milani, G.P.; Groothoff, J.W.; Vianello, F.A.; Fossali, E.F.; Paglialonga, F.; Edefonti, A.; Agostoni, C.; Consonni, D.; van Harskamp, D.; van Goudoever, J.B.; et al. Bioimpedance and Fluid Status in Children and Adolescents Treated With Dialysis. Am. J. Kidney Dis. 2017, 69, 428–435. [Google Scholar] [CrossRef]
- Milani, G.P.; Groothoff, J.W.; Vianello, F.A.; Fossali, E.F.; Paglialonga, F.; Consolo, S.; Edefonti, A.; Consonni, D.; van Harskamp, D.; van Goudoever, J.B.; et al. Bioimpedance Spectroscopy Imprecisely Assesses Lean Body Mass in Pediatric Dialysis Patients. J. Craniofacial Surg. 2018, 67, 533–537. [Google Scholar] [CrossRef]
- Vega, M.W.; Srivaths, P.R. Air Displacement Plethysmography Versus Bioelectrical Impedance to Determine Body Composition in Pediatric Hemodialysis Patients. J. Ren. Nutr. 2017, 27, 439–444. [Google Scholar] [CrossRef]
- Dasgupta, I.; Keane, D.; Lindley, E.; Shaheen, I.; Tyerman, K.; Schaefer, F.; Wühl, E.; Müller, M.J.; Bosy-Westphal, A.; Fors, H.; et al. Validating the use of bioimpedance spectroscopy for assessment of fluid status in children. Pediatr. Nephrol. 2018, 33, 1601–1607. [Google Scholar] [CrossRef] [Green Version]
- Broers, N.J.; Canaud, B.; Dekker, M.J.; van der Sande, F.M.; Stuard, S.; Wabel, P.; Kooman, J.P. Three compartment bioimpedance spectroscopy in the nutritional assessment and the outcome of patients with advanced or end stage kidney disease: What have we learned so far? Hemodial. Int. 2020, 24, 148–161. [Google Scholar] [CrossRef] [PubMed] [Green Version]
- Wind, A.E.; Takken, T.; Helders, P.J.M.; Engelbert, R.H.H. Is grip strength a predictor for total muscle strength in healthy children, adolescents, and young adults? Eur. J. Pediatr. 2009, 169, 281–287. [Google Scholar] [CrossRef] [PubMed]
- Li, S.; Zhang, R.; Pan, G.; Zheng, L.; Li, C. Handgrip strength is associated with insulin resistance and glucose metabolism in adolescents: Evidence from National Health and Nutrition Examination Survey 2011 to 2014. Pediatr. Diabetes 2017, 19, 375–380. [Google Scholar] [CrossRef] [PubMed]
- Dong, B.; Wang, Z.; Arnold, L.; Song, Y.; Wang, H.J.; Ma, J. The association between blood pressure and grip strength in adolescents: Does body mass index matter? Hypertens. Res. 2016, 39, 919–925. [Google Scholar] [CrossRef]
- Garcia-Hermoso, A.; Tordecilla-Sanders, A.; Correa-Bautista, J.E.; Peterson, M.D.; Izquierdo, M.; Prieto-Benavides, D.; Sandoval-Cuellar, C.; González-Ruíz, K.; Ramírez-Vélez, R. Handgrip strength attenuates the adverse effects of overweight on cardiometabolic risk factors among collegiate students but not in individuals with higher fat levels. Sci. Rep. 2019, 9, 6986. [Google Scholar] [CrossRef] [Green Version]
- Šteffl, M.; Chrudimský, J.; Tufano, J.J. Using relative handgrip strength to identify children at risk of sarcopenic obesity. PLoS ONE 2017, 12, e0177006. [Google Scholar] [CrossRef]
- Takken, T.; Engelbert, R.; van Bergen, M.; Groothoff, J.; Nauta, J.; van Hoeck, K.; Lilien, M.; Helders, P. Six-minute walking test in children with ESRD: Discrimination validity and construct validity. Pediatr. Nephrol. 2009, 24, 2217–2223. [Google Scholar] [CrossRef] [Green Version]
- Eijsermans, R.M.; Creemers, D.G.; Helders, P.J.; Schröder, C.H. Motor performance, exercise tolerance, and health-related quality of life in children on dialysis. Pediatr. Nephrol. 2004, 19, 1262–1266. [Google Scholar] [CrossRef]
- Drube, J.; Wan, M.; Bonthuis, M.; Wühl, E.; Bacchetta, J.; Santos, F.; Grenda, R.; Edefonti, A.; Harambat, J.; Shroff, R.; et al. Clinical practice recommendations for growth hormone treatment in children with chronic kidney disease. Nat. Rev. Nephrol. 2019, 15, 577–589. [Google Scholar] [CrossRef] [Green Version]
- Johnson, V.L.; Wang, J.; Kaskel, F.J.; Pierson, R.N. Changes in body composition of children with chronic renal failure on growth hormone. Pediatr. Nephrol. 2000, 14, 695–700. [Google Scholar] [CrossRef]
- Van Der Sluis, I.M.; Boot, A.M.; Nauta, J.; Hop, W.C.J.; De Jong, M.C.J.W.; Lilien, M.R.; Groothoff, J.W.; Van Wijk, A.E.; Pols, H.A.P.; Hokken-Koelega, A.C.S.; et al. Bone density and body composition in chronic renal failure: Effects of growth hormone treatment. Pediatr. Nephrol. 2000, 15, 221–228. [Google Scholar] [CrossRef] [PubMed]
- Boot, A.M.; Nauta, J.; De Jong, M.C.W.; Groothoff, J.W.; Lilien, M.R.; Van Wijk, J.A.E.; Kist-van Holthe, J.E.; SHokken-Koelega, A.C.; Pols, H.A.; De Muinck Keizer-Schrama, S.M. Bone mineral density, bone metabolism and body composition of children with chronic renal failure, with and without growth hormone treatment. Clin. Endocrinol. 1998, 49, 665–672. [Google Scholar] [CrossRef] [PubMed]
- Vaisman, N.; Zadik, Z.; Duchan, R.; Voet, H.; Lotan, D.; Drukker, A. Changes in body composition of children with chronic renal failure during growth hormone treatment. Pediatr. Nephrol. 1994, 8, 201–204. [Google Scholar] [CrossRef]
- Rennie, M.J. Claims for the anabolic effects of growth hormone: A case of the Emperor’s new clothes? Br. J. Sports Med. 2003, 37, 100–105. [Google Scholar] [CrossRef] [PubMed] [Green Version]
- Chikani, V.; Ho, K.K. Action of GH on skeletal muscle function: Molecular and metabolic mechanisms. J. Mol. Endocrinol. 2013, 52, R107–R123. [Google Scholar] [CrossRef] [Green Version]
- Carrel, A.L.; Allen, D.B. Effects of growth hormone on adipose tissue. J. Pediatr. Endocrinol. Metab. 2000, 13 (Suppl. S2), 1003–1009. [Google Scholar]
- Kopple, J.D.; Wang, H.; Casaburi, R.; Fournier, M.; Lewis, M.I.; Taylor, W.; Storer, T.W. Exercise in Maintenance Hemodialysis Patients Induces Transcriptional Changes in Genes Favoring Anabolic Muscle. J. Am. Soc. Nephrol. 2007, 18, 2975–2986. [Google Scholar] [CrossRef] [Green Version]
- Schaar, B.; Thys, S.; Hoppe, B. Endurance training during maintenance hemodialysis in pediatric and adolescent patients—Theory and best practice suggestions. Pediatr. Nephrol. 2020, 35, 595–602. [Google Scholar] [CrossRef]


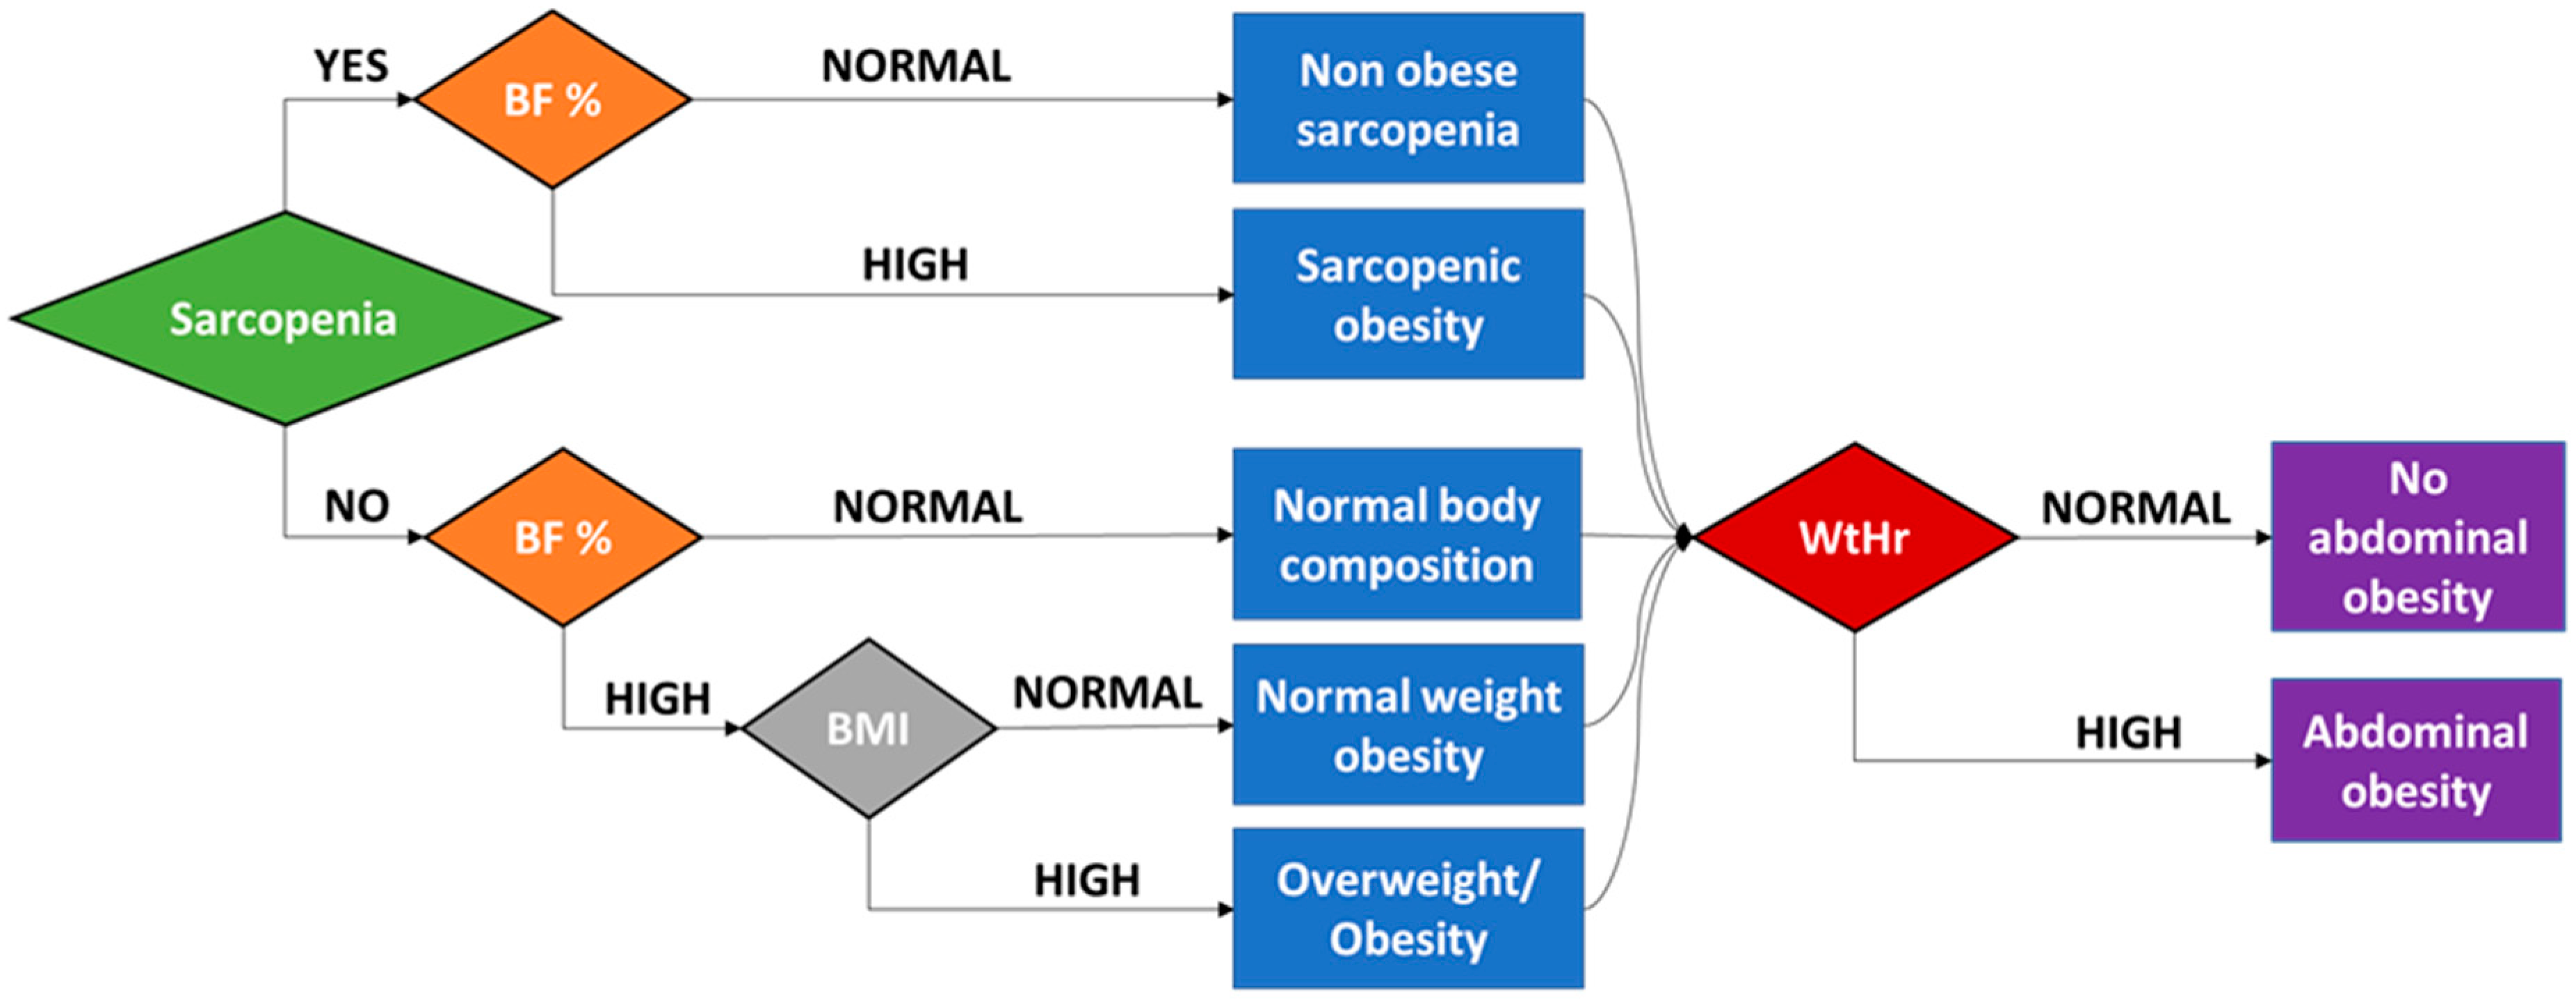
| Pediatric Population | Adult Population | |
|---|---|---|
| Short stature | Height < 3rd perc for age and sex | |
| Growth failure | Height < 3rd perc for age and sex Height velocity < 25th perc for age and sex | |
| Underweight | BMI * < 5th perc for age and sex | BMI < 18.5 |
| Overweight | 85th perc < BMI * ≤ 95th perc for age and sex | 25 ≤ BMI < 30 |
| Obesity | BMI * > 95th perc for age and sex | BMI ≥ 30 |
| High body adiposity | BF% > 80–90th perc for age and sex | BF% > 25% in men and >30% in women |
| Sarcopenia [6] | Muscle mass * < 5th perc for age and sex Severe sarcopenia: low physical performance | Low muscle strength and low muscle quantity or quality Severe sarcopenia: low physical performance |
| Normal weight obesity | High body adiposity and BMI * ≤ 85th perc for age and sex | High body adiposity and BMI < 25 |
| Sarcopenic obesity | High body adiposity or overweight/obesity and sarcopenia | High body adiposity or overweight/obesity and sarcopenia |
| Abdominal obesity | WtHr > 0.5 | WtHr > 0.5 |
| Protein energy wasting [7,8,9] | Anthropometric parameters
Abnormal biochemical parameters levels (serum albumin, cholesterol and transferrin) | Anthropometric parameters
|
| Low dietary intake Abnormal biochemical parameters levels (serum albumin, prealbumin, cholesterol) | ||
| Frailty phenotype [10,11] | Anthropometric parameters
High CRP level | Criteria:
|
| Author | No. of Patients | Technique | Results | Conclusions |
|---|---|---|---|---|
| Sgambat K et al. [91] | 593 CKD patients | WtHr | Overweight patients based on both WtHr and BMI presented higher SBP z-scores (p < 0.001), LVMI (p < 0.001), glucose (p = 0.003), and triglyceride (p < 0.001) levels and lower HDL-C (p < 0.001) levels compared to lean patients Cardiovascular markers levels did not significantly differ between overweight patients and lean patients based on BMI only | WtHr should be used for cardiovascular risk screening in children with CKD |
| Sgambat K et al. [95] | 42 kidney transplant recipients | WtHr | Area under the ROC curve to detect cardiovascular outcomes was higher for WtHr-obese (0.77) compared to BMI-obese (0.47) and WC-obese (0.48) Adverse cardiovascular outcomes were associated with WtHr obesity (p = 0.0001) but not with BMI or WC obesity | WtHr is more sensitive than BMI or WC to detect cardiovascular risk in pediatric kidney transplant recipients |
| Karava V et al. [30] | 41 CKD patients | RFM | RFM, which corresponds to BF%, was a stronger predictor of high HOMA-IR compared to BMI height–age z-score in both total (AUC = 0.785 and AUC = 0.709, respectively) and normal-weight (AUC = 0.783 and AUC = 0.686, respectively) patients RFM was associated with high HOMA-IR in both total (OR 1.168, 95% CI 1.022–1.334, p = 0.022) and normal-weight (OR 1.285, 95% CI 1.021–1.619, p = 0.033) patients | Children with high RFM, including those with NWO, are at risk for insulin resistance |
| Karava V et al. [28] | 26 CKD patients | FFTI/FTI | Among normal weight patients, FFTI/FTI ratio, calculated with the following equation: fat free mass (kg)/height (m)2/fat mass (kg)/height(m)2, ≥2.5 was significantly associated with lower PWV z-scores (p = 0.013) | Targeting FFTI/FTI ≥ 2.5 could be protective against cardiovascular disease in normal weight children |
| Hsu CN et al. [96] | 63 CKD patients | FMI | FMI z-score, calculated with the following equation: fat mass (kg)/height (m)2, was independently associated with abnormal ABPM in multivariate logistic regression analysis (p = 0.037) | FMI may help discriminating cardiovascular risk in children and adolescents CKD |
| Patel HP et al. [29] | 737 CKD patients | WC | BMI was more strongly associated with LVMI compared to WC (8.54%, 95% CI 6.47–10.65 vs. 5.79%, 95% CI 3.33–8.32) in the nonglomerular CKD group but both had significant associations | WC added limited information to BMI in terms of cardiometabolic risk prediction |
| Author | No. of Patients | Techniques | Parameter | Results | Conclusions |
|---|---|---|---|---|---|
| Milani GP et al. [108] | 16 CKD 5D | BIS vs. Deuterium and Bromide dilution | Total Body Water, Extracellular Water | TBW Bland–Altman analysis: mean difference between the two methods −0.09 L (95% CI −2.1–1.9) ECW Bland–Altman analysis: mean difference between the two methods +0.6 L (95% CI −2.3–3.5) | BIS measurements were imprecise compared to dilution techniques |
| Milani GP et al. [109] | 15 CKD 5D | BIS vs. Deuterium dilution | Body Lean Mass | Bland–Altman analysis: mean difference (+/−SD) between the two methods 0.25 ± 2.30 kg (95% CI −4.80–4.25) | Wide limits of agreement between the two techniques |
| Wong Vega M et al. [110] | 15 CKD 5D | BIA vs. ADP | Body Fat Mass | BIA-derived BFM was lower in males with Tanner ≥4 (p = 0.0004) and in obese subjects (p = 0.005) and higher in malnourished patients (p = 0.02) compared to ADP | BIA underestimated BFM in males with Tanner ≥4 and in obese patients and overestimated FM in malnourished patients |
| Iyengar A et al. [73] | 33 CKD 2-5D | BIA vs. DXA | Body Fat Mass | FMI: good degree of reliability in CKD 2–5 (ICC 0.76 CI [0.48,0.9]), poor reliability in CKD 5D (ICC 0.58 CI [0.1,0.84]) BF%: poor to fair reliability in CKD 2–5 (ICC 0.64 [0.28,0.84]) and CKD 5D (ICC 0.53 [0.02,0.82]) | BIA-derived FMI did not compare well with DXA-derived FMI in CKD 5D patients while FMI was comparable with a lower bias |
| Dasgupta I et al. [111] | 6 CKD 5D 45 measurements | BIS vs. UKM | Total Body Water | Good TBW_BIS and TBW_UKM agreement (mean difference − 0.4 L, 2SD = ± 3.0 L) | BCM can be used in children with CKD to assess fluid status |
| Anthropometric parameters pros: simple, quick, non-invasive cons: high intra-/inter-observer variability | WtHr | pros: marker of abdominal adiposity cons: unsuitable in children with clinical edema or on PD |
| Skinfold thickness | pros: marker of subcutaneous adiposity cons: cannot measure visceral adiposity, unsuitable in children with clinical edema | |
| MAC | pros: marker of muscle and fat mass, marker of PEW cons: limited precision for body muscle mass measurements, unsuitable in children with clinical edema | |
| MAMC | pros: marker of muscle mass, marker of PEW cons: unsuitable in children with clinical edema | |
| Technological tools pros: high intra- and inter-rater reproducibility pros: not easily available in clinical practice | DXA | pros: quick, precise, measurement of body bone, fat-free and fat mass, measurement of segmental body composition (appendicular skeletal muscle, trunk/leg fat ratio) cons: ionizing radiation, high dependency on hydration and tissue density status |
| ADP | pros: quick, precise, measurement of body fat-free and fat mass cons: expensive, high dependency on hydration and tissue density status | |
| BIA/BIS | pros: bedside tool, measurement of body fat and fat-free mass (BIA) or adipose, lean tissue mass and overhydration (BIS), measurement of BCM (BIS) cons: imprecise compared to DXA and ADP, high dependency on hydration status | |
| TBK | pros: measurement of BCM cons: imprecise for lean body mass estimation, unsuitable in cases of increased tissue K concentrations | |
| Isotope dilution | pros: measurement of TBW cons: imprecise for lean body mass estimation, high dependency on hydration status |
| No. of Patients | Duration | Methods | Results | Conclusion | |
|---|---|---|---|---|---|
| Johnson VL et al. [121] | 14 | 6 months | DXA | Increase in LBM (kg): 17.9+/−3.0 vs. 20.7+/−3.6, p = 0.04 Decrease in FBM (kg): 4.4 +/−1.4 vs. 3.−1.2), p = 0.002 Decrease in BF (%): 18.6+/−3.9 vs. 14.5+/−3.4, p = 0.04 | rGH therapy enhances repletion of LBM |
| van der Sluis IM [122] | 18 vs. 15 controls | 24 years | DXA | rGH therapy patient group:
| LBM increased only in the rGH therapy patient group |
| Boot AM et al. [123] | 17 vs. 19 controls | 12 months | DXA | rGH therapy patient group:
| LBM increased and BF% decreased only in the rGH therapy patient group |
| Vaisman N et al. [124] | 8 | 12 months | DXA TBK MAMC | FBM (kg): 2.9 +−1.1 vs. 2.8+/−0.9, p = NSTBK (mEq): 1099+/−311 vs. 1078+/−220, p = NS MAMC (cm): 158.7+/−19.4 vs. 165.9 +/−23.3, p = 0.01 | rGH therapy had a positive effect on MAMC, but not on LBM (as reflected by TBK) and FBM |
Disclaimer/Publisher’s Note: The statements, opinions and data contained in all publications are solely those of the individual author(s) and contributor(s) and not of MDPI and/or the editor(s). MDPI and/or the editor(s) disclaim responsibility for any injury to people or property resulting from any ideas, methods, instructions or products referred to in the content. |
© 2023 by the authors. Licensee MDPI, Basel, Switzerland. This article is an open access article distributed under the terms and conditions of the Creative Commons Attribution (CC BY) license (https://creativecommons.org/licenses/by/4.0/).
Share and Cite
Karava, V.; Dotis, J.; Kondou, A.; Printza, N. Malnutrition Patterns in Children with Chronic Kidney Disease. Life 2023, 13, 713. https://doi.org/10.3390/life13030713
Karava V, Dotis J, Kondou A, Printza N. Malnutrition Patterns in Children with Chronic Kidney Disease. Life. 2023; 13(3):713. https://doi.org/10.3390/life13030713
Chicago/Turabian StyleKarava, Vasiliki, John Dotis, Antonia Kondou, and Nikoleta Printza. 2023. "Malnutrition Patterns in Children with Chronic Kidney Disease" Life 13, no. 3: 713. https://doi.org/10.3390/life13030713