
Progressive Vertical and Horizontal Phytocompound Changes during Agarwood Formation in Aquilaria sinensis after Geotrichum candidum Injection

Abstract
:1. Introduction
2. Materials and Methods
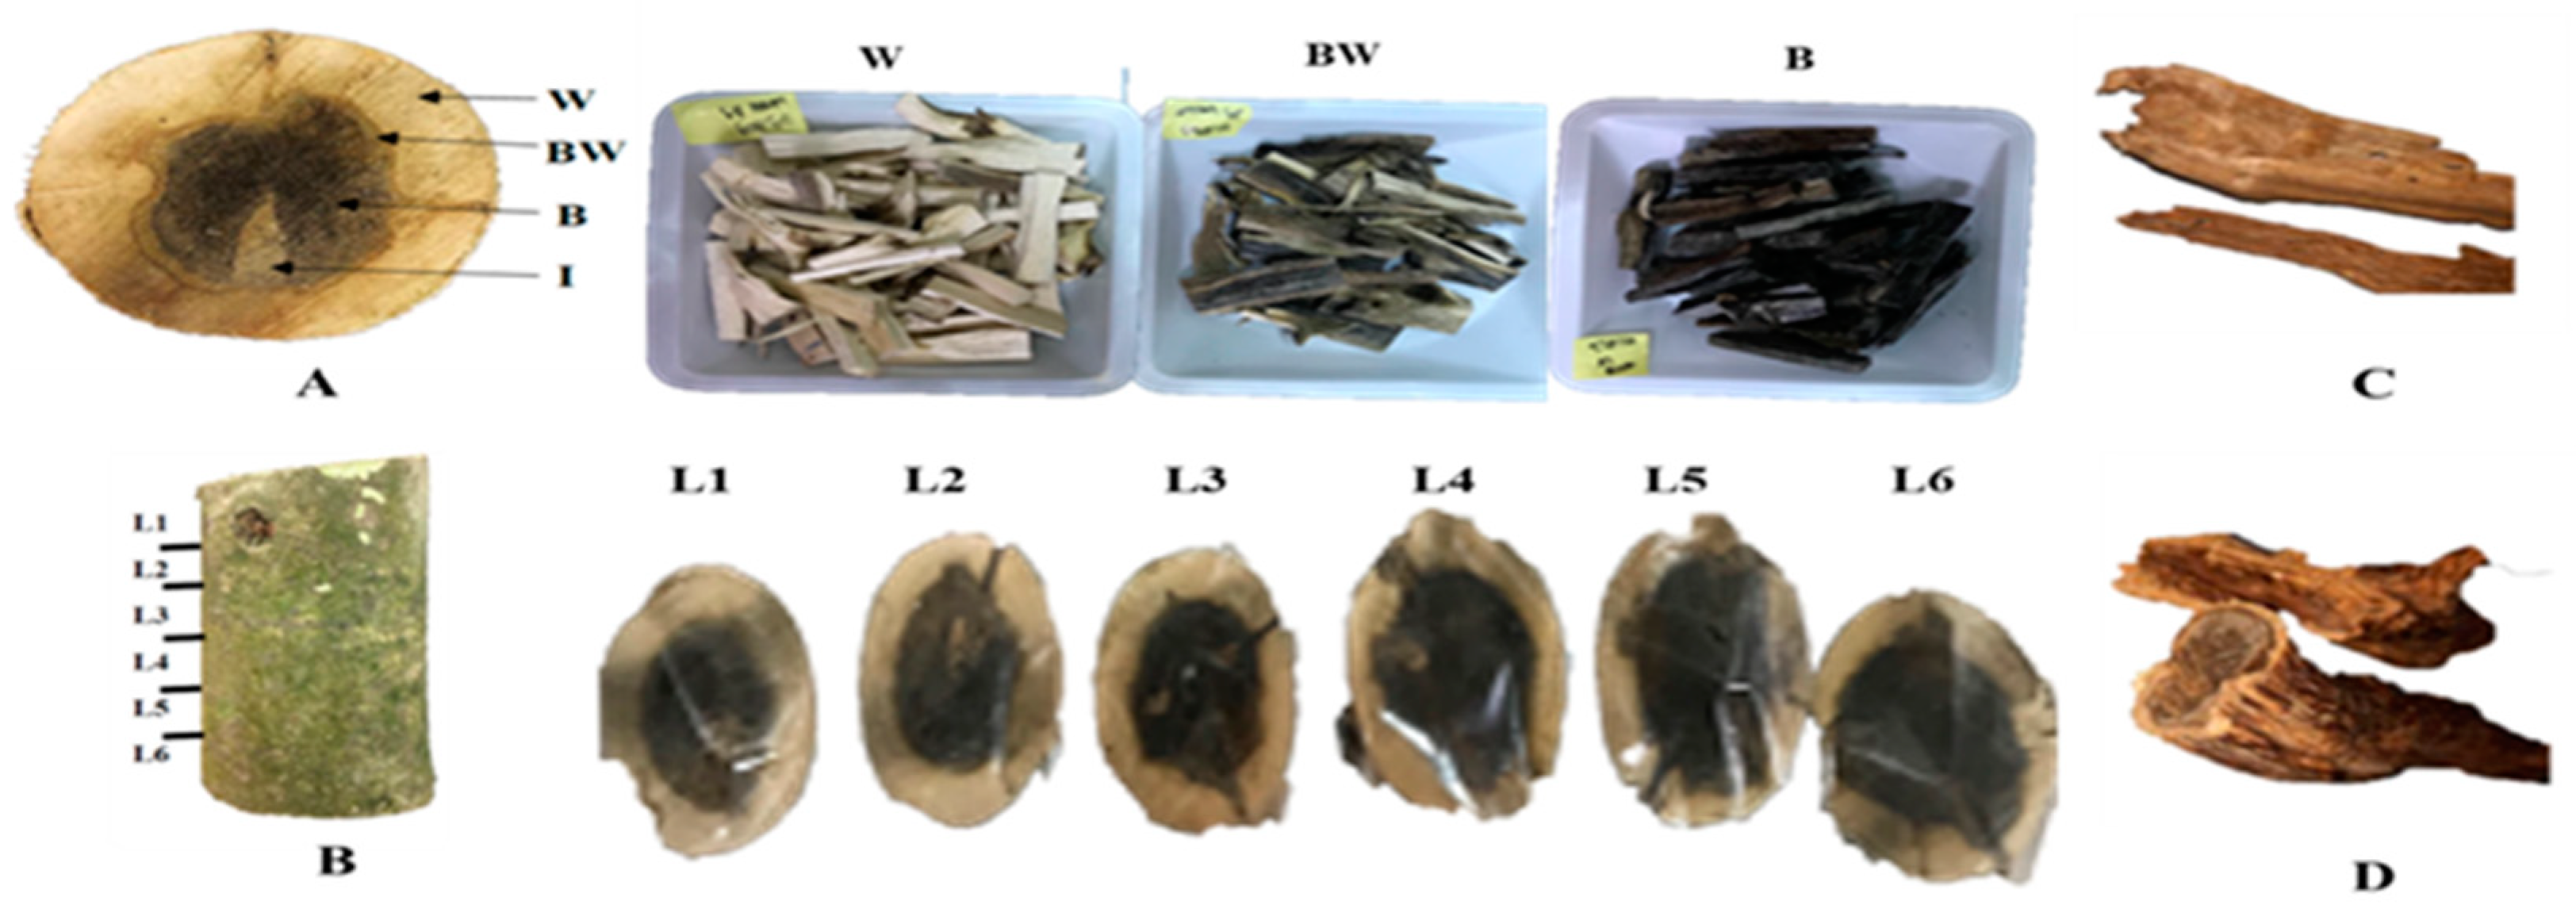
2.1. Sample Preparation
2.2. Methanol Extraction of Polar Compounds
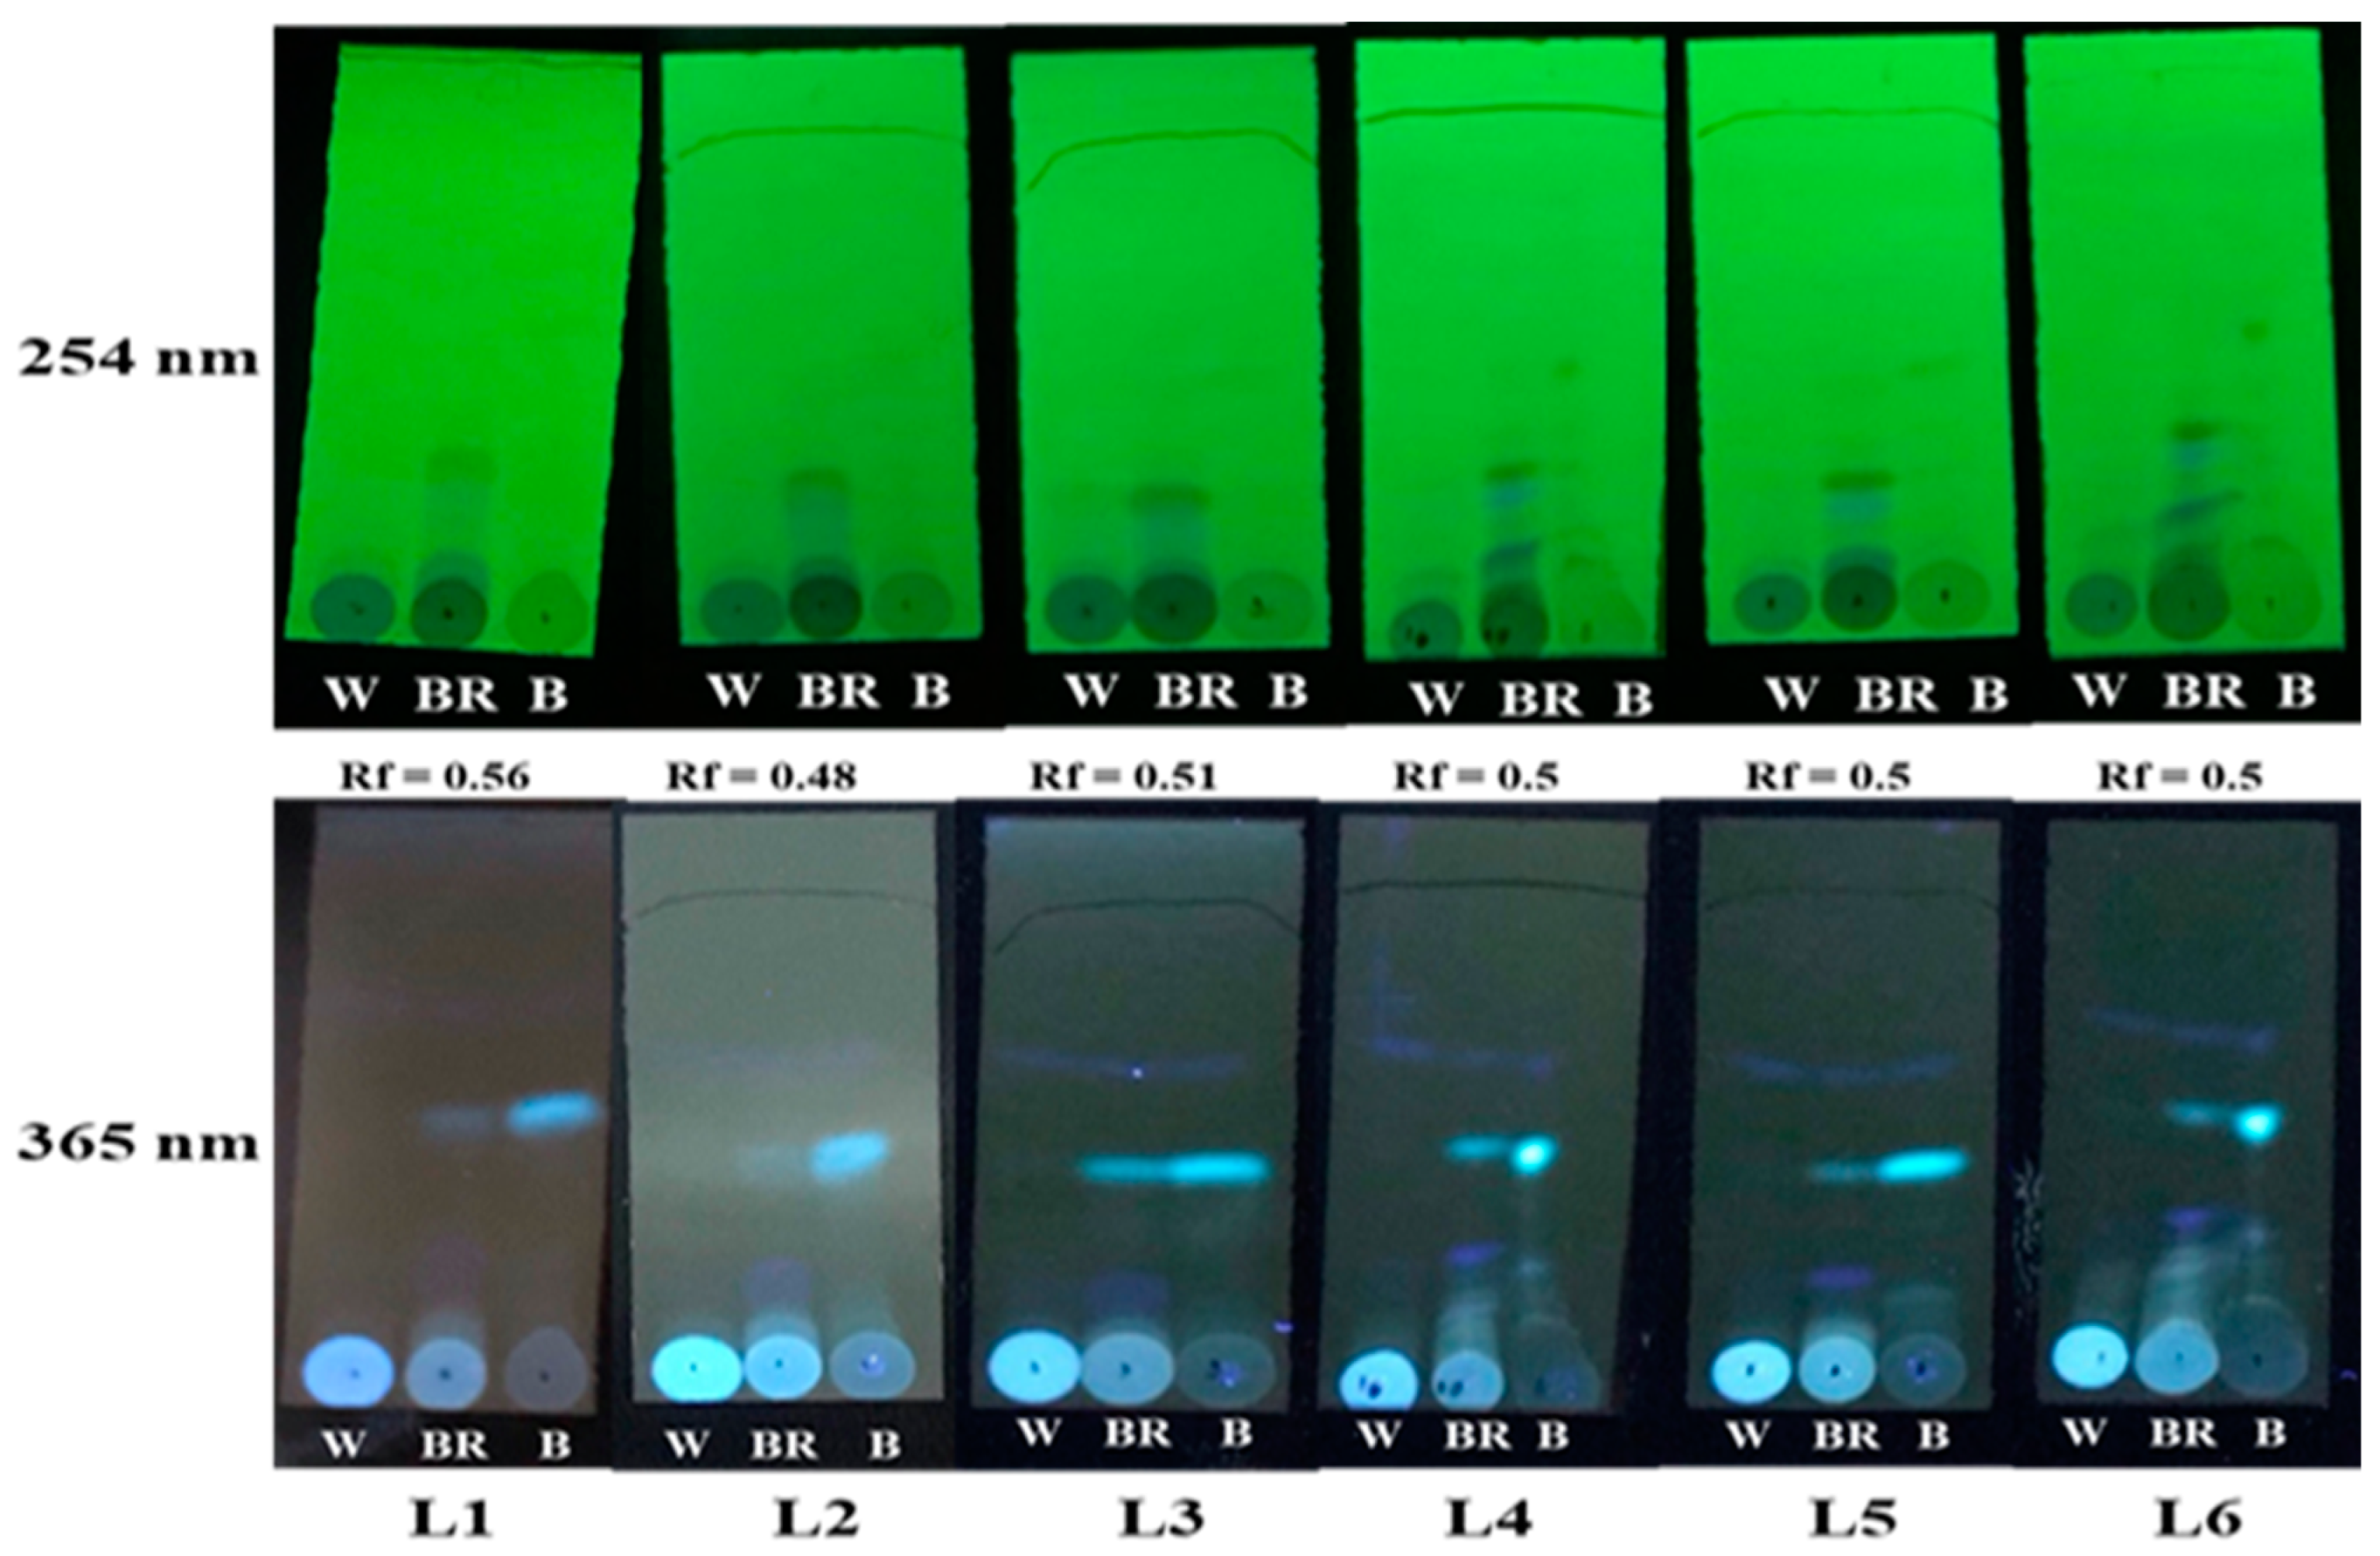
2.3. Thin-Layer Chromatography (TLC) Analysis of Vertical Layers
2.4. Reversed-Phase High-Performance Liquid Chromatography (Rp-Hplc) Analysis
2.5. Gas Chromatography/Mass Spectrometry (Gc/Ms) Analysis
3. Results
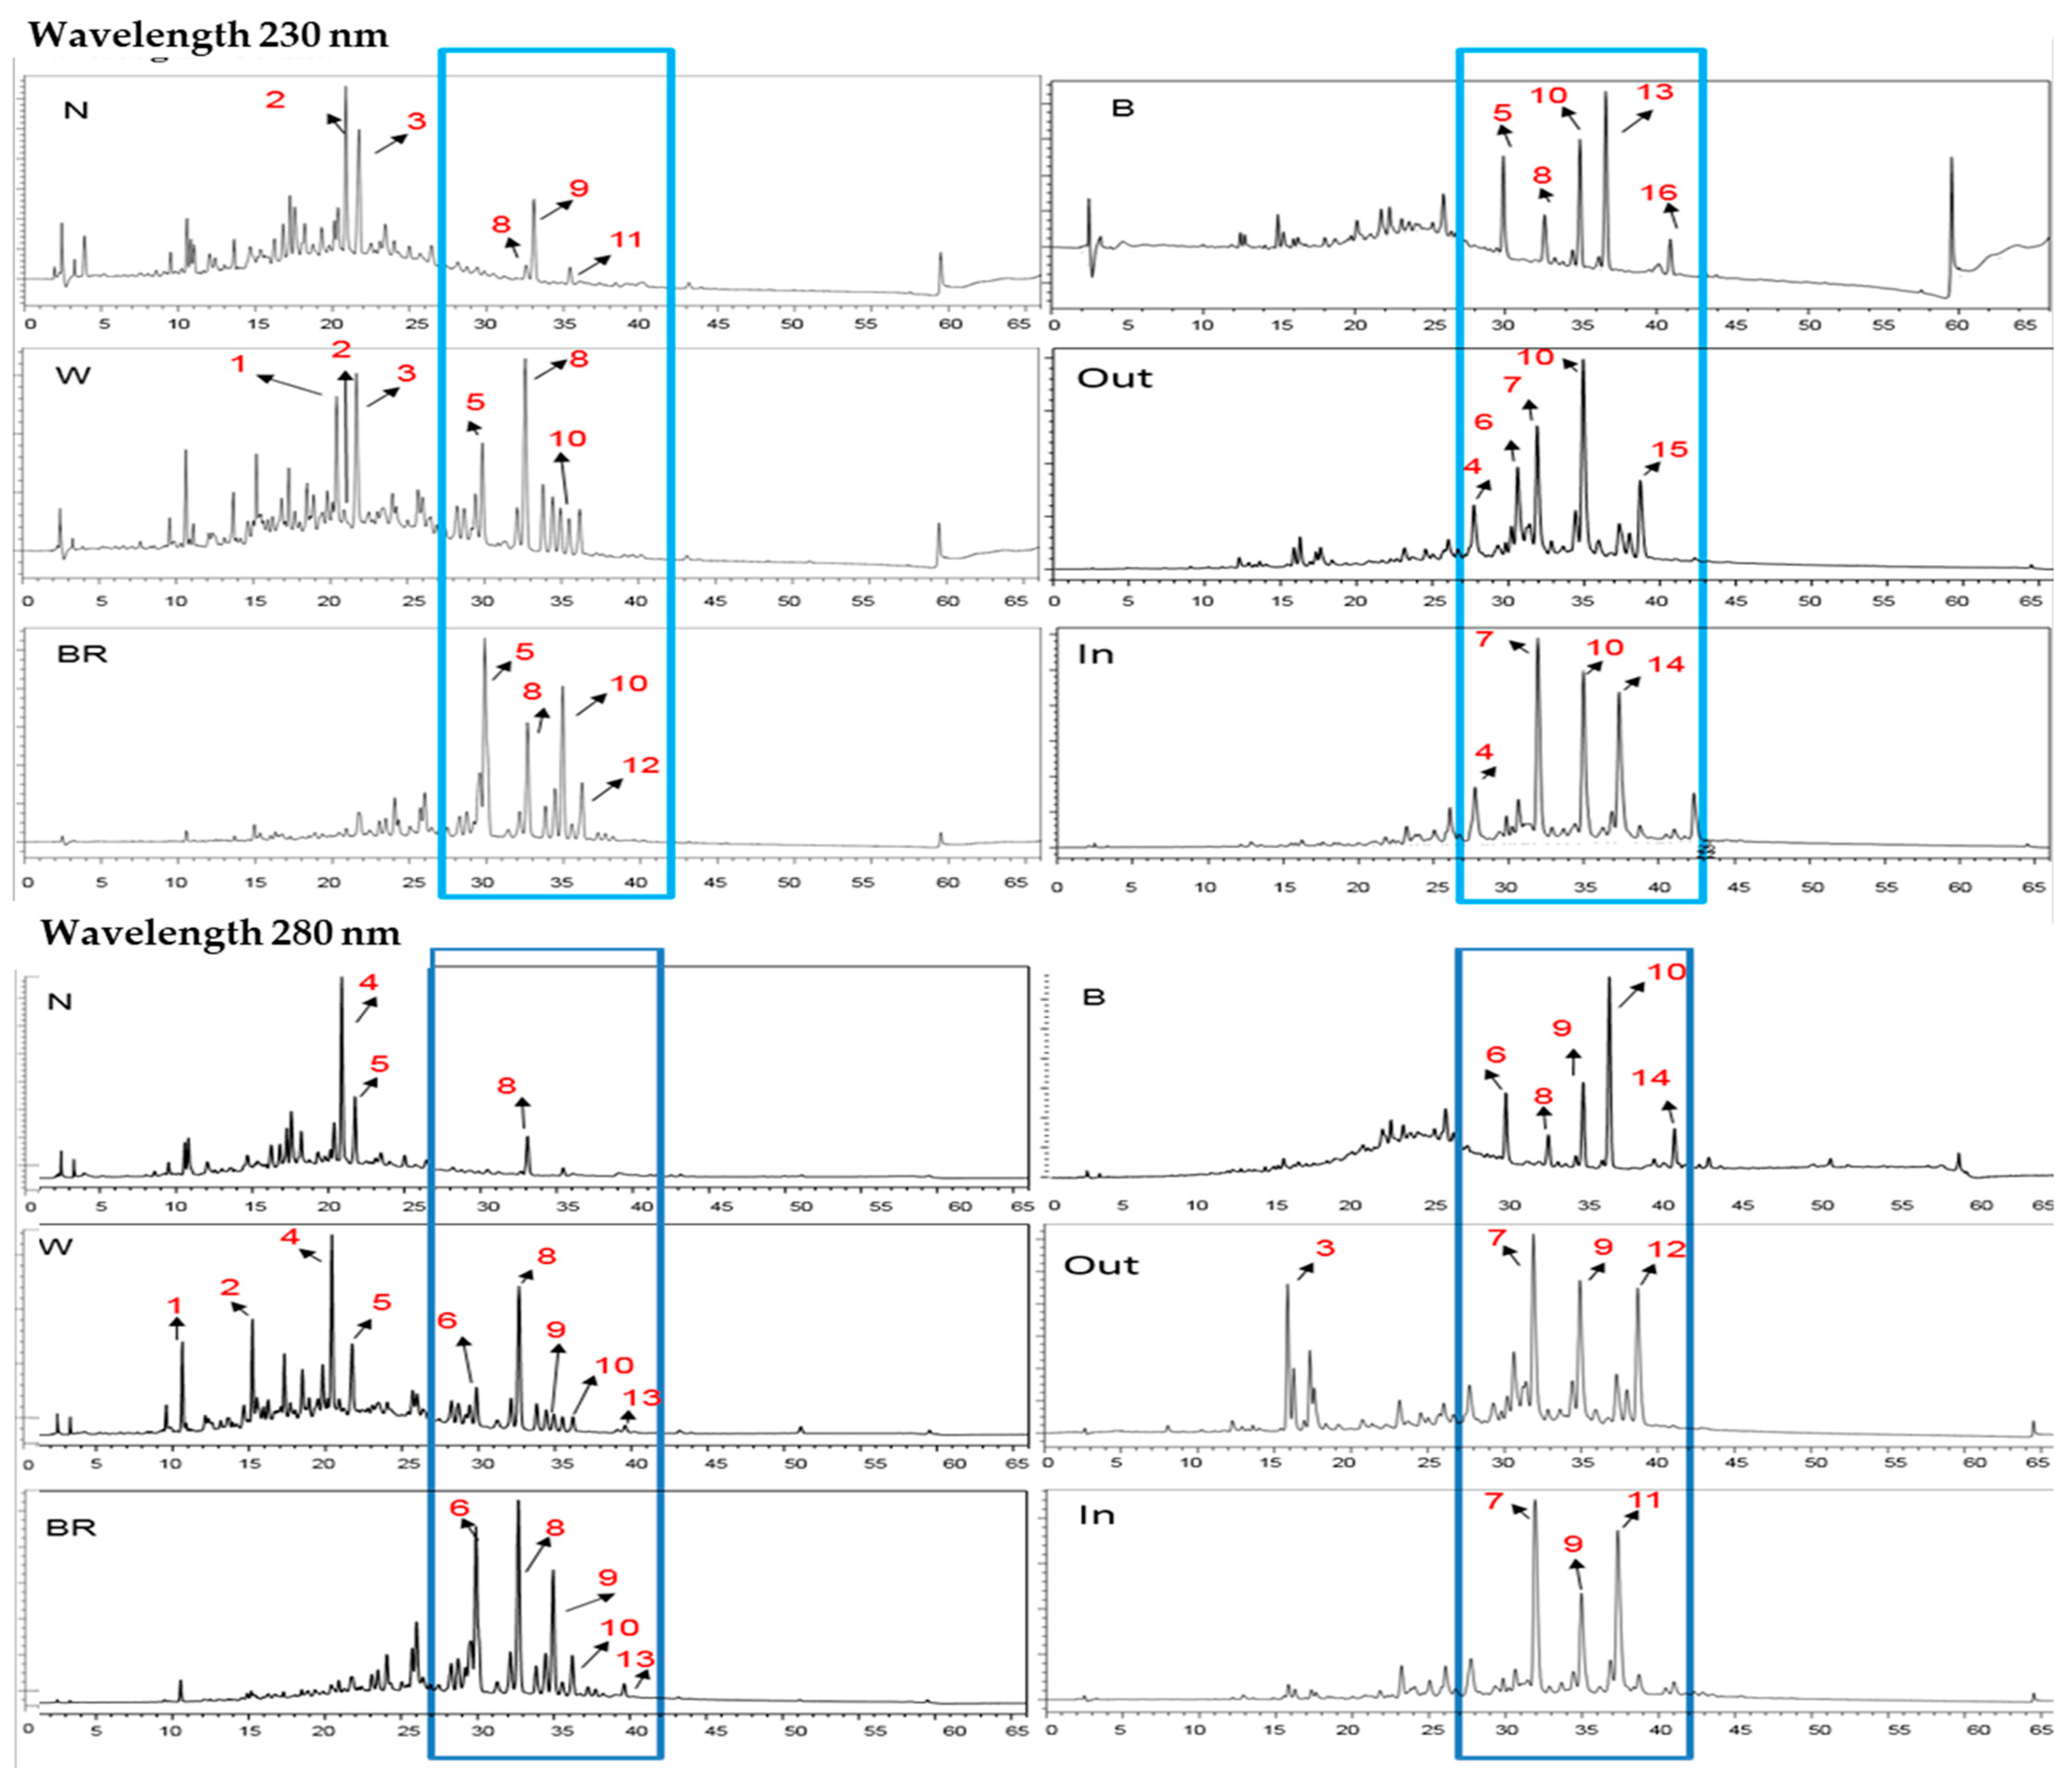
3.1. RP-HPLC Analysis of Compound Changes during Agarwood Formation
3.1.1. Compound Changes among Three Color Parts Horizontally
3.1.2. The Compound Changes Vertically among the Three Color Parts in the Upper Branch
3.2. TLC Analysis of the Compound Changes among Three Color Parts Vertically
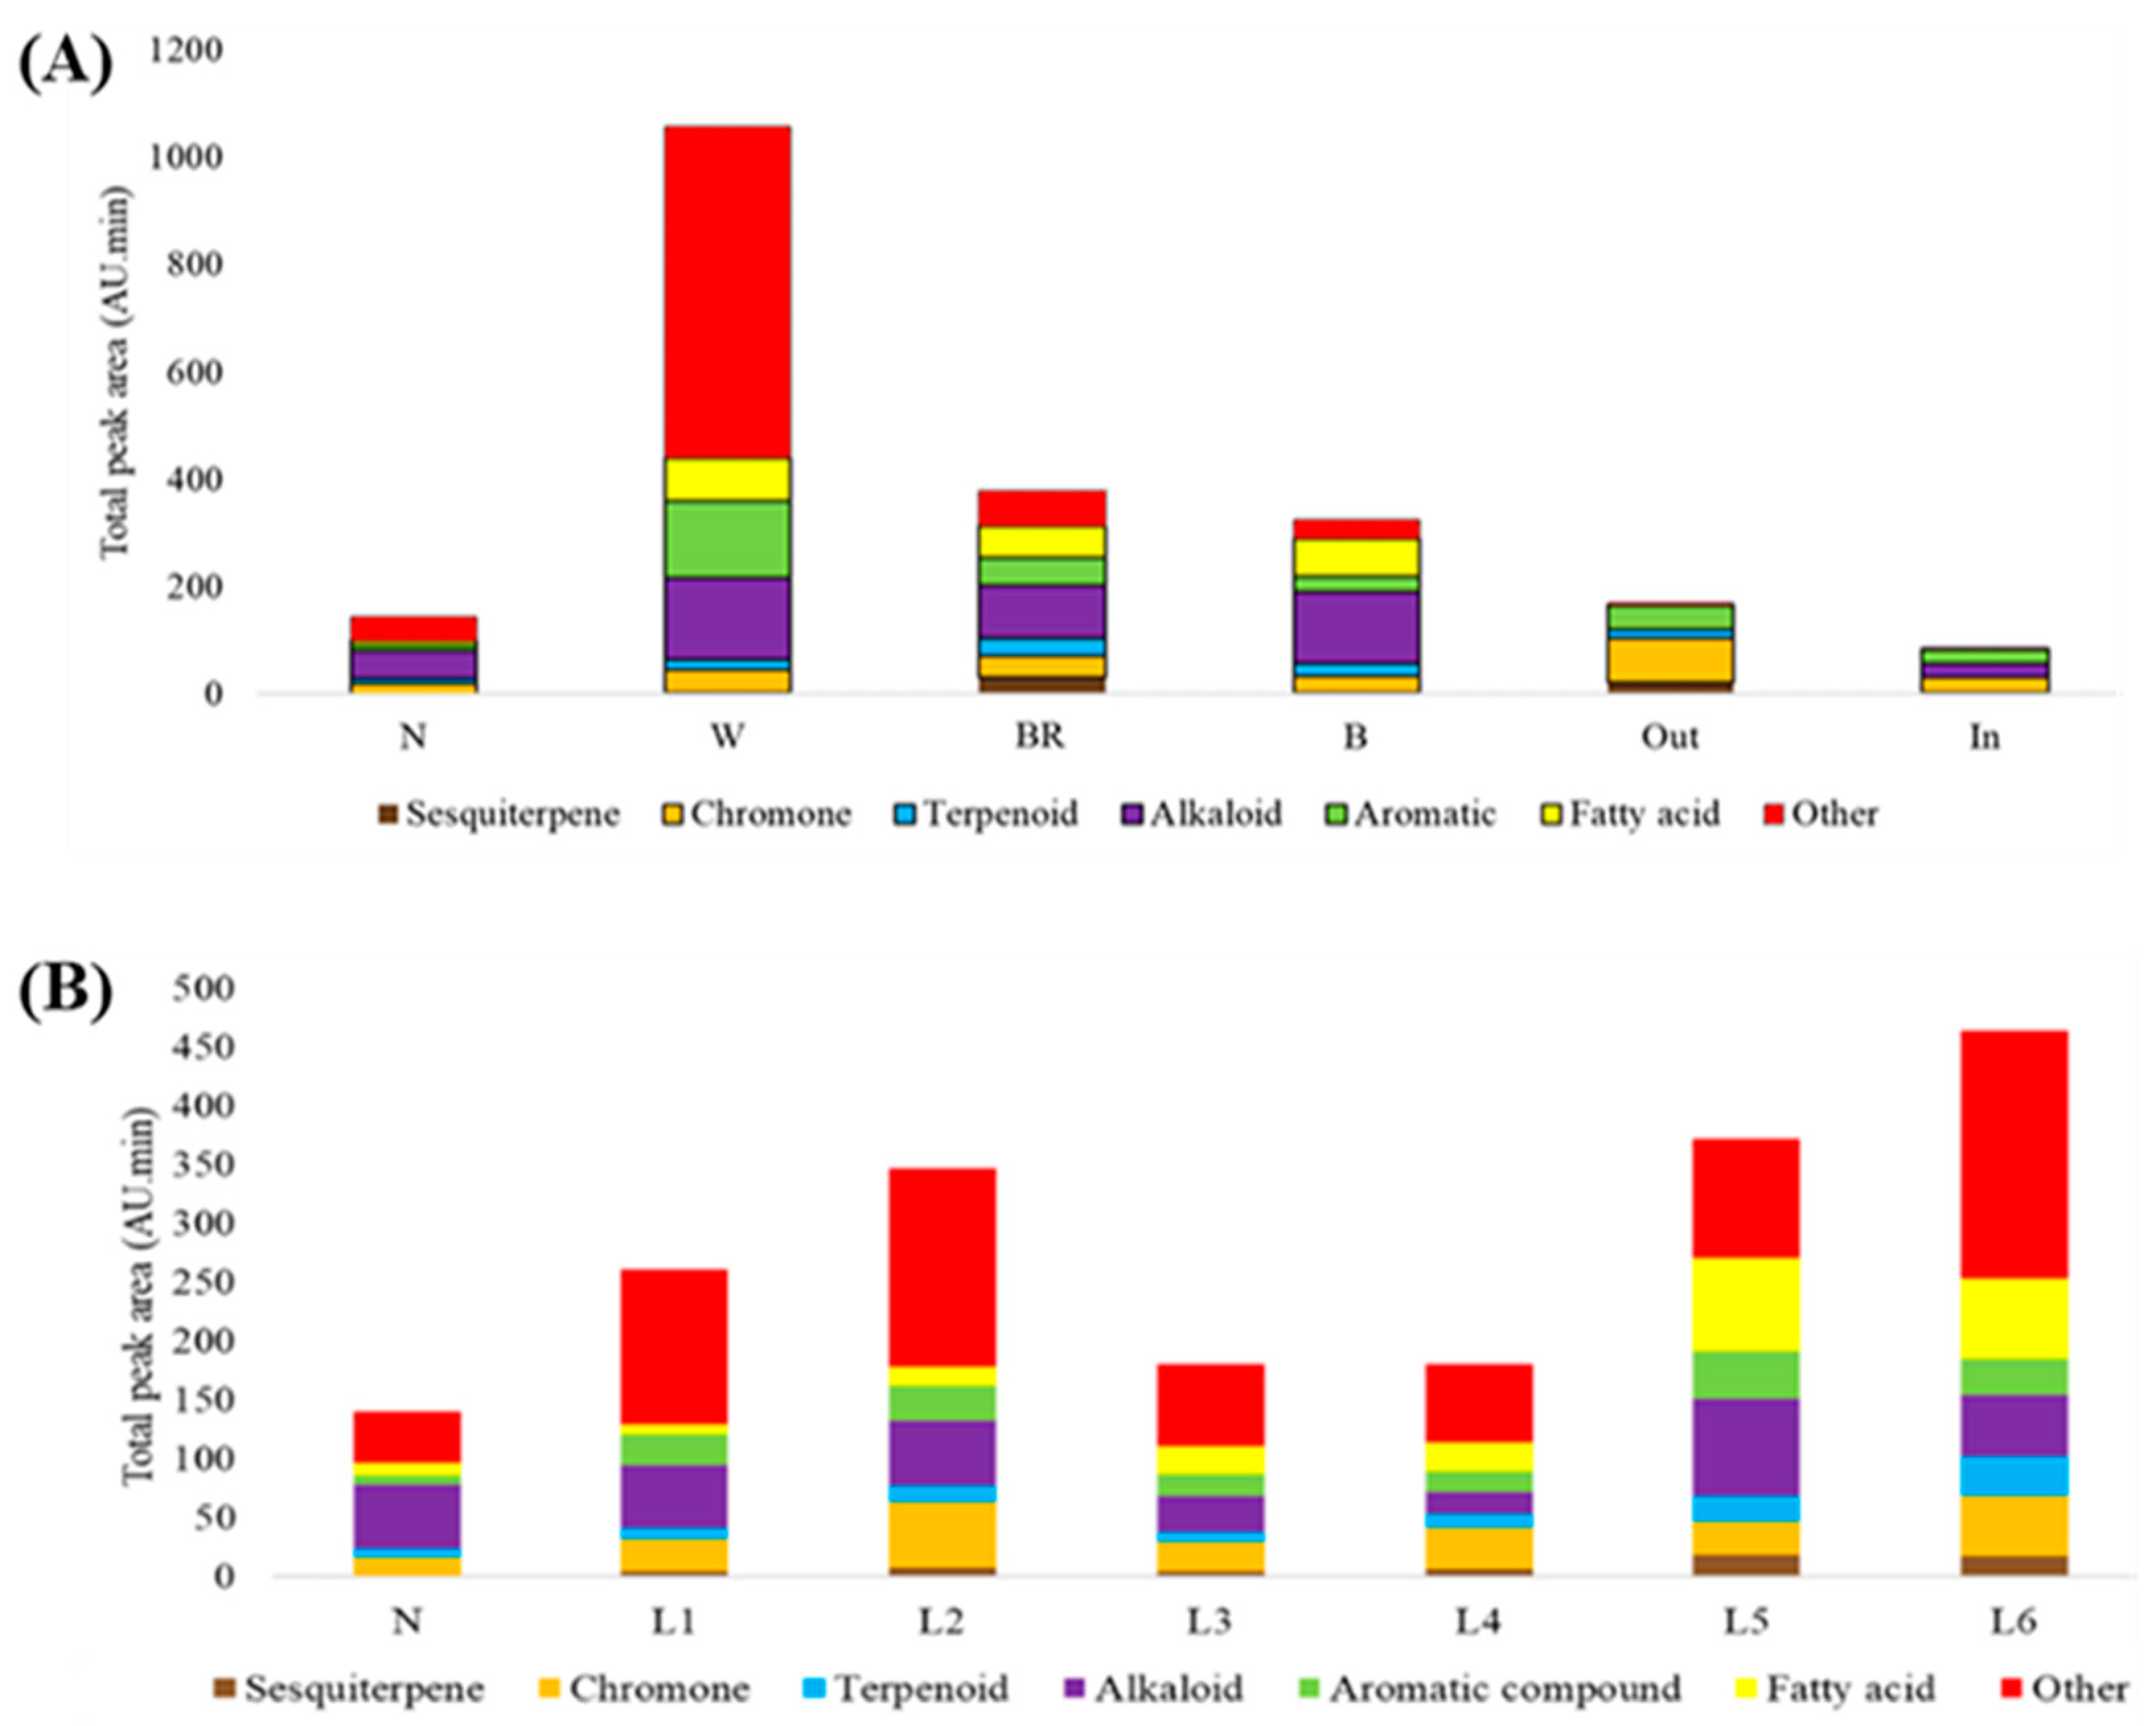
3.3. GC/MS Analysis
3.3.1. Changes in Compound Groups
3.3.2. Changes in Main Compounds in Different Compound Groups
4. Discussion
5. Conclusions
Supplementary Materials
Author Contributions
Funding
Institutional Review Board Statement
Informed Consent Statement
Data Availability Statement
Conflicts of Interest
References
- Mo, Q.; Fan, C.; Zhou, G.; Fu, H.; Wang, Y. Composition variation of agar-wood-associated microbial communities from Aquilaria sinensis. bioRxiv 2019. [Google Scholar] [CrossRef]
- Gunn, B.; Stevens, P.; Singadan, M.; Sunari, L.; Chatterton, P. Eaglewood in Papua New Guinea; Resource Management in Asia-Pacific Working Paper No. 51; The Australian National University: Canberra, Australia, 2004. [Google Scholar]
- Kalra, R.; Kaushik, N. A review of chemistry, quality and analysis of infected agar-wood tree (Aquilaria sp.). Phytochem. Rev. 2017, 16, 1045–1079. [Google Scholar] [CrossRef]
- Lee, S.Y.; Turjaman, M.; Mohamed, R. Phylogenetic relatedness of several agar-wood-producing taxa (Thymelaeaceae) from Indonesia. Trop. Life Sci. Res. 2018, 29, 13. [Google Scholar] [CrossRef] [PubMed]
- Dwianto, W.; Kusumah, S.; Darmawan, T.; Amin, Y.; Bahanawan, A.; Pramasari, D.; Lestari, E.; Himmi, S.; Hermiati, E.; Fatriasari, W. Anatomical observation and characteri-zation on basic properties of agarwood (Gaharu) as an Appendix II CITES. In IOP Conference Series: Earth and Environmental Science; IOP Publishing: Bristol, UK, 2019; p. 012062. [Google Scholar]
- Tan, C.S.; Isa, N.M.; Ismail, I.; Zainal, Z. Agarwood induction: Current developments and future perspectives. Front. Plant Sci. 2019, 10, 122. [Google Scholar] [CrossRef]
- Naziz, P.S.; Das, R.; Sen, S. The scent of stress: Evidence from the unique fragrance of agarwood. Front. Plant Sci. 2019, 10, 840. [Google Scholar] [CrossRef]
- Ahmed, D.T.; Mohammed, M.; Masaad, A.M.; Tajuddin, S.N. Investigation of agarwood compounds in Aquilaria malaccensis & Aquilaria rostrata chipwood by using solid phase microextraction. Biomed. J. Sci. Tech. Res. 2017, 1, 1609–1616. [Google Scholar]
- Novriyanti, E.; Santosa, E.; Syafii, W.; Turjaman, M.; Sitepu, I.R. Anti fungal activity of wood extract of Aquilaria crassna Pierre ex Lecomte against agarwood-inducing fungi, Fusarium solani. Indon. J. For. Res. 2010, 7, 155–165. [Google Scholar] [CrossRef]
- Modzelewska, A.; Sur, S.; Kumar, S.K.; Khan, S.R. Sesquiterpenes: Natural products that decrease cancer growth. Curr. Med. Chem. Anticancer Agents 2005, 5, 477–499. [Google Scholar] [CrossRef]
- Amirkia, V.; Heinrich, M. Alkaloids as drug leads–A predictive structural and biodiversity-based analysis. Phytochem. Lett. 2014, 10, xlviii–liii. [Google Scholar] [CrossRef]
- Khan, H. Berberine: As a therapeutic target for treating obese diabetes. J. Diabetes Res. Therap. 2016, 2, e101. [Google Scholar]
- Chhipa, H.; Kaushik, N. Fungal and bacterial diversity isolated from Aquilaria malaccensis tree and soil, induces agarospirol formation within 3 months after artificial in-fection. Front. Microbiol. 2017, 8, 1286. [Google Scholar] [CrossRef] [PubMed]
- Ocampo, L.Q.; Stahr, M. Geotrichum Sour Rot of Sweetpotato Vegetable Pathology Factsheets; NC State Extension: Raleigh, NC, USA, 2018. [Google Scholar]
- Liu, J.; Zhang, X.; Yang, J.; Zhou, J.; Yuan, Y.; Jiang, C.; Chi, X.; Huang, L. Agarwood wound locations provide insight into the association between fungal diversity and volatile compounds in Aquilaria sinensis. R. Soc. Open Sci. 2019, 6, 190211. [Google Scholar] [CrossRef]
- Wang, M.-R.; Li, W.; Luo, S.; Zhao, X.; Ma, C.-H.; Liu, S.-X. GC-MS Study of the chemical components of different Aquilaria sinensis (Lour.) Gilgorgans and Agarwood from different Asian countries. Molecules 2018, 23, 2168. [Google Scholar] [CrossRef] [PubMed]
- Siriangkhawut, W.; Kaewboo, I. Ultrasonic extraction method for alizarin from roots of Morinda citrifolia. Anal. Chem. Indian J. 2013, 12, 65–69. [Google Scholar]
- Hendra, H.; Moeljopawiro, S.; Nuringtyas, T.R. Antioxidant and antibacterial activi-ties of agarwood (Aquilaria malaccensis Lamk.) leaves. In AIP Conference Proceedings; AIP Publishing: Melville, NY, USA, 2016; p. 140004. [Google Scholar]
- Negi, J.S.; Singh, P.; Pant, G.J.N.; Rawat, M. High-performance liquid chromatography analysis of plant saponins: An update 2005–2010. Pharmacogn. Rev. 2011, 5, 155. [Google Scholar] [CrossRef] [PubMed]
- Cole, M.D. The Analysis of Controlled Substances; John Wiley and Sons: Hoboken, NJ, USA, 2003; Volume 9. [Google Scholar]
- Zhang, A.; Wan, L.; Wu, C.; Fang, Y.; Han, G.; Li, H.; Zhang, Z.; Wang, H. Simultaneous determination of 14 phenolic compounds in grape canes by HPLC-DAD-UV using wavelength switching detection. Molecules 2013, 18, 14241–14257. [Google Scholar] [CrossRef] [PubMed]
- Weaver, L.M.; Herrmann, K.M. Dynamics of the shikimate pathway in plants. Trends Plant Sci. 1997, 2, 346–351. [Google Scholar] [CrossRef]
- Hashim, Y.Z.H.-Y.; Ismail, N.I.; Abbas, P. Analysis of chemical compounds of agar-wood oil from different species by gas chromatography mass spectrometry (GCMS). IIUM Eng. J. 2014, 15, 55–60. [Google Scholar] [CrossRef]
- Jones, F.R. Development of the bacteria causing wilt in the Alfalfa plant as influenced by growth and winter injury. J. Agric. Res. 1928, 37, 545–569. [Google Scholar]
- Blanchette, R. Anatomical responses of xylem to injury and invasion by fungi. In Defense Mechanisms of Woody Plants against Fungi; Springer: Berlin/Heidelberg, Germany, 1992; pp. 76–95. [Google Scholar]
- Zhang, Z.; Han, X.M.; Wei, J.H.; Xue, J.; Yang, Y.; Liang, L.; Li, X.J.; Guo, Q.M.; Xu, Y.H.; Gao, Z.H. Compositions and antifungal activities of essential oils from agarwood of Aquilaria sinensis (Lour.) Gilg induced by Lasiodiplodia theobromae (Pat.) Griffon. & Maubl. J. Braz. Chem. Soc. 2014, 25, 20–26. [Google Scholar]
- Lin, D.; Xiao, M.; Zhao, J.; Li, Z.; Xing, B.; Li, X.; Kong, M.; Li, L.; Zhang, Q.; Liu, Y. An overview of plant phenolic compounds and their importance in human nutrition and management of type 2 diabetes. Molecules 2016, 21, 1374. [Google Scholar] [CrossRef] [PubMed]
- Mandal, S.M.; Chakraborty, D.; Dey, S. Phenolic acids act as signaling molecules in plant-microbe symbioses. Plant Signal. Behav. 2010, 5, 359–368. [Google Scholar] [CrossRef] [PubMed]
- Novriyanti, E.; Santosa, E. The role of phenolics in agarwood formation of Aquilaria crassna Pierre ex Lecomte and Aquilaria microcarpa Baill Trees. Indon. J. For. Res. 2011, 8, 101–113. [Google Scholar] [CrossRef]
- López-Sampson, A.; Page, T. History of use and trade of agarwood. Econ. Bot. 2018, 72, 107–129. [Google Scholar] [CrossRef]
- Ismail, N.; Ali, N.A.M.; Jamil, M.; Rahiman, M.H.F.; Tajuddin, S.N.; Taib, M.N. A review study of agarwood oil and its quality analysis. J. Teknol. 2014, 68, 1. [Google Scholar] [CrossRef]
- Liu, Y.; Chen, H.; Yang, Y.; Zhang, Z.; Wei, J.; Meng, H.; Chen, W.; Feng, J.; Gan, B.; Chen, X. Whole-tree agarwood-inducing technique: An efficient novel technique for producing high-quality agarwood in cultivated Aquilaria sinensis trees. Molecules 2013, 18, 3086–3106. [Google Scholar] [CrossRef]
- Mohamed, R.; Lee, S.Y. Keeping up appearances: Agarwood grades and quality. In Agarwood; Springer: Berlin/Heidelberg, Germany, 2016; pp. 149–167. [Google Scholar]
- Singh, B.; Sharma, R.A. Plant terpenes: Defense responses, phylogenetic analysis, regulation and clinical applications. 3 Biotech 2015, 5, 129–151. [Google Scholar] [CrossRef]
- Faizal, A.; Esyanti, R.R.; Aulianisa, E.N.; Santoso, E.; Turjaman, M. Formation of agarwood from Aquilaria malaccensis in response to inoculation of local strains of Fusarium solani. Trees 2017, 31, 189–197. [Google Scholar] [CrossRef]
- Sinha, S.; Sandhu, K.; Bisht, N.; Naliwal, T.; Saini, I.; Kaushik, P. Ascertaining the paradigm of secondary metabolism enhancement through gene level modification in therapeutic plants. J. Young Pharm. 2019, 11, 337. [Google Scholar] [CrossRef]
- Setyorini, S.; Yusnawan, E. The increase of secondary metabolite in legumes as a response of biotic stress. Iptek Tanam. Pangan 2016, 11, 167–174. [Google Scholar]
- Ye, W.; He, X.; Wu, H.; Wang, L.; Zhang, W.; Fan, Y.; Li, H.; Liu, T.; Gao, X. Identification and characterization of a novel sesquiterpene synthase from Aquilaria sinensis: An important gene for agarwood formation. Int. J. Biol. Macromol. 2018, 108, 884–892. [Google Scholar] [CrossRef] [PubMed]
- Nasution, R.; Muhabbah, N.; Helwati, H.; Bahi, M.; Marianne, M.; Amna, U. Isolation of lupeol acetate from fruit peels of Artocarpus camansi. J. Adv. Pharm. Technol. Res. 2020, 11, 148. [Google Scholar] [CrossRef] [PubMed]
- Yang, J.; Duan, G.; Li, C.; Liu, L.; Han, G.; Zhang, Y.; Wang, C. The crosstalks between jasmonic acid and other plant hormone signaling highlight the involvement of jasmonic acid as a core component in plant response to biotic and abiotic stresses. Front. Plant Sci. 2019, 10, 1349. [Google Scholar] [CrossRef] [PubMed]
- Xu, Y.; Zhang, Z.; Wang, M.; Wei, J.; Chen, H.; Gao, Z.; Sui, C.; Luo, H.; Zhang, X.; Yang, Y. Identification of genes related to agarwood formation: Transcriptome analysis of healthy and wounded tissues of Aquilaria sinensis. BMC Genom. 2013, 14, 227. [Google Scholar] [CrossRef]
- Chen, X.; Zhu, X.; Feng, M.; Zhong, Z.; Zhou, X.; Chen, X.; Ye, W.; Zhang, W.; Gao, X. Relationship between expression of chalcone synthase genes and chromones in artificial agarwood induced by formic acid stimulation combined with Fusarium sp. A2 inoculation. Molecules 2017, 22, 686. [Google Scholar] [CrossRef]
- Aung, K.; Jiang, Y.; He, S.Y. The role of water in plant–microbe interactions. Plant J. 2018, 93, 771–780. [Google Scholar] [CrossRef] [PubMed]
- Rasool, S.; Mohamed, R. Understanding agarwood formation and its challenges. In Agarwood; Springer: Berlin/Heidelberg, Germany, 2016; pp. 39–56. [Google Scholar]
- Yan, T.; Yang, S.; Chen, Y.; Wang, Q.; Li, G. Chemical profiles of cultivated Agarwood induced by different techniques. Molecules 2019, 24, 1990. [Google Scholar] [CrossRef]
- Yin, Y.; Jiao, L.; Dong, M.; Jiang, X.; Zhang, S. Wood resources, identification, and utilization of agarwood in China. In Agarwood; Springer: Berlin/Heidelberg, Germany, 2016; pp. 21–38. [Google Scholar]
- Naef, R. The volatile and semi-volatile constituents of agarwood, the infected heart-wood of Aquilaria species: A review. Flavour Fragr. J. 2011, 26, 73–87. [Google Scholar] [CrossRef]
- Hishamuddin, M.S.; Lee, S.Y.; Isa, N.M.; Lamasudin, D.U.; Abidin, S.A.Z.; Mohamed, R. Time-based LC-MS/MS analysis provides insights into early responses to mechanical wounding, a major trigger to agarwood formation in Aquilaria malaccensis Lam. RSC Adv. 2019, 9, 18383–18393. [Google Scholar] [CrossRef]
- Adibah, K.Z.M.; Azzreena, M.A. Plant toxins: Alkaloids and their toxicities. GSC Biol. Pharmaceut. Sci. 2019, 6, 21–29. [Google Scholar]
- Sen, S.; Dehingia, M.; Talukdar, N.C.; Khan, M. Chemometric analysis reveals links in the formation of fragrant bio-molecules during agarwood (Aquilaria malaccensis) and fungal interactions. Sci. Rep. 2017, 7, 44406. [Google Scholar] [CrossRef] [PubMed]


| Peak No. | Retention Time | N | W | BR | B | Out | In | ||||||
|---|---|---|---|---|---|---|---|---|---|---|---|---|---|
| Area | Ratio | Area | Ratio | Area | Ratio | rea | Ratio | Area | Ratio | Area | Ratio | ||
| 230 nm | |||||||||||||
| 1 | 20.4 | 1,716,574 | 1 | 3,887,660 | 2.26 | 887,171 | 0.52 | ||||||
| 2 | 20.9 | 4,822,401 | 1 | 2,674,558 | 0.55 | 1,118,204 | 0.23 | 139,832 | 0.03 | 240,109 | 0.05 | ||
| 3 | 21.7 | 4,277,978 | 1 | 5,298,952 | 1.24 | 3,332,879 | 0.78 | 248,852 | 0.06 | 86,746 | 0.02 | 429,904 | 0.1 |
| 4 | 27.8 | 2,318,365 | 1 | 4,203,646 | 1.81 | ||||||||
| 5 | 29.9 | 318,670 | 1 | 3,092,236 | 9.7 | 17,082,604 | 53.6 | 2,666,687 | 8.36 | 465,954 | 1.46 | 1,125,677 | 3.53 |
| 6 | 30.6 | 298,343 | 1 | 385,297 | 1.29 | 542,284 | 1.82 | 3,548,927 | 11.9 | 2,310,060 | 7.74 | ||
| 7 | 31.9 | 1,559,666 | 1 | 2,939,320 | 1.88 | 4,841,456 | 3.1 | 10,412,672 | 6.68 | ||||
| 8 | 32.7 | 311,156 | 1 | 4,838,049 | 15.54 | 9,104,716 | 29.26 | 390,431 | 1.25 | 815,019 | 2.62 | ||
| 9 | 33.1 | 1,639,098 | 1 | 1,142,464 | 0.7 | ||||||||
| 10 | 34.9 | 1,186,293 | 1 | 10,139,084 | 8.54 | 854,797 | 0.72 | 7,357,199 | 6.2 | 9,698,256 | 8.18 | ||
| 11 | 35.5 | 344,849 | 1 | 936,099 | 2.71 | 1,437,922 | 4.17 | ||||||
| 12 | 36.2 | 139,672 | 1 | 1,183,052 | 8.47 | 4,712,759 | 33.74 | 101,586 | 0.73 | 1,019,686 | 7.3 | 1,355,914 | 9.71 |
| 13 | 36.6 | 165,573 | 1 | 339,462 | 2.05 | 1,237,104 | 7.47 | 441,221 | 2.66 | 1,808,474 | 10.92 | ||
| 14 | 37.3 | 56,884 | 1 | 150,481 | 2.65 | 713,838 | 12.55 | 1,698,236 | 29.85 | 9,463,337 | 166.36 | ||
| 15 | 38.7 | 2,835,240 | 1 | ||||||||||
| 16 | 40.9 | 249,206 | 1 | 98,974 | 0.4 | 910,604 | 3.65 | ||||||
| 280 nm | |||||||||||||
| 1 | 10.6 | 362,536 | 1 | 607,812 | 1.68 | 214,106 | 0.59 | ||||||
| 2 | 15.2 | 92,002 | 1 | 814,216 | 8.85 | 117,564 | 1.28 | 72,532 | 0.79 | ||||
| 3 | 15.9 | 128,253 | 1 | 206,993 | 1.61 | 72,779 | 0.57 | 10,475,534 | 81.68 | 2,039,704 | 15.9 | ||
| 4 | 20.9 | 3,001,496 | 1 | 287,607 | 0.1 | 356,796 | 0.12 | 1,657,796 | 0.55 | 1,083,141 | 0.36 | ||
| 5 | 21.7 | 1,279,119 | 1 | 959,945 | 0.75 | 737,287 | 0.58 | 505,291 | 0.4 | 1,554,411 | 1.22 | ||
| 6 | 29.9 | 434,630 | 1 | 3,476,545 | 8 | 135,586 | 0.32 | 1,832,742 | 4.22 | 3,431,303 | 7.89 | ||
| 7 | 32.1 | 388,427 | 1 | 985,399 | 2.54 | 23,089,768 | 59.44 | 43,793,661 | 112.75 | ||||
| 8 | 32.7 | 79,164 | 1 | 1,646,544 | 20.8 | 3,568,234 | 45.07 | 68,782 | 0.87 | 3,108,963 | 39.27 | 3,489,338 | 44.08 |
| 9 | 34.9 | 211,275 | 1 | 2,149,618 | 10.17 | 170,786 | 0.81 | 19,210,528 | 90.92 | 24,649,599 | 116.67 | ||
| 10 | 36.2 | 8167 | 1 | 190,458 | 23.32 | 763,980 | 93.54 | ||||||
| 11 | 37.2 | 198,330 | 1 | 7,361,700 | 37.12 | 40,679,299 | 205.11 | ||||||
| 12 | 38.7 | 16,685,800 | 1 | 20,670,580 | 1.24 | ||||||||
| 13 | 39.6 | 108,675 | 1 | 217,618 | 2 | 1,145,656 | 10.54 | ||||||
| 14 | 40.9 | 83,378 | 1 | ||||||||||
| RT | W | BR | B | |||||||||||||||
|---|---|---|---|---|---|---|---|---|---|---|---|---|---|---|---|---|---|---|
| L1 | L2 | L3 | L4 | L5 | L6 | L1 | L2 | L3 | L4 | L5 | L6 | L1 | L2 | L3 | L4 | L5 | L6 | |
| 230 nm | ||||||||||||||||||
| 14.9 | 0.8 | 0.8 | 0.8 | 1.1 | 1.1 | 1.2 | 2.0 | 1.1 | 1.2 | 1.9 | 2.2 | 2.5 | ||||||
| 20.4 | 3.8 | 3.5 | 3.2 | 3.6 | 3.7 | 4.6 | ||||||||||||
| 20.9 | 2.6 | 2.9 | 2.2 | 2.4 | 2.4 | 2.5 | ||||||||||||
| 21.7 | 5.1 | 5.2 | 5.1 | 4.4 | 4.7 | 5.5 | 3.1 | 4.8 | 5.0 | 5.2 | 5.2 | 6.0 | ||||||
| 22.3 | 2.8 | 3.4 | 4.4 | 4.2 | 2.7 | 2.9 | ||||||||||||
| 23.1 | 1.3 | 2.6 | 3.2 | 2.7 | 3.1 | 3.7 | ||||||||||||
| 25.9 | 4.2 | 4.1 | 4.9 | 4.4 | 4.4 | 4.0 | ||||||||||||
| 29.9 | 3.0 | 4.4 | 7.2 | 3.8 | 3.8 | 3.5 | 15.1 | 16.2 | 17.8 | 15.3 | 13.2 | 15.4 | 8.2 | 9.7 | 8.0 | 8.7 | 8.7 | 5.9 |
| 32.6 | 4.7 | 5.2 | 6.1 | 5.0 | 5.4 | 5.3 | 8.1 | 7.7 | 6.8 | 8.9 | 8.8 | 8.4 | 4.8 | 4.1 | 2.4 | 2.9 | 3.3 | 3.1 |
| 33.8 | 1.6 | 1.9 | 1.6 | 1.3 | 1.3 | 1.6 | ||||||||||||
| 34.4 | 1.4 | 1.9 | 2.1 | 1.5 | 1.5 | 1.7 | ||||||||||||
| 34.9 | 1.2 | 2.1 | 4.6 | 1.8 | 1.8 | 1.3 | 9.0 | 10.5 | 14.0 | 9.3 | 10.0 | 9.7 | 10.5 | 8.8 | 9.0 | 8.8 | 8.0 | 4.6 |
| 35.4 | 0.9 | 1.2 | 1.0 | 1.0 | 1.0 | 1.0 | ||||||||||||
| 36.2 | 1.1 | 0.3 | 2.3 | 1.5 | 1.4 | 1.4 | 4.2 | 4.7 | 0.3 | 5.3 | 5.2 | 4.6 | ||||||
| 36.6 | 15.2 | 4.0 | 3.6 | 2.3 | 3.4 | 4.2 | ||||||||||||
| 40.9 | 3.1 | 2.1 | 1.4 | 2.6 | 2.3 | 2.8 | ||||||||||||
| 280 nm | ||||||||||||||||||
| 3.2 | 4.4 | 1.0 | 1.3 | 1.5 | 1.1 | |||||||||||||
| 14.7 | 1.5 | 1.2 | 2.7 | 1.2 | 1.5 | 1.2 | ||||||||||||
| 15.2 | 4.5 | 2.6 | 3.5 | 3.5 | 3.4 | 2.9 | ||||||||||||
| 15.5 | 2.5 | 1.8 | 2.2 | 2.2 | 2.1 | 2.0 | ||||||||||||
| 16.2 | 1.7 | 1.6 | 1.5 | 1.9 | 1.7 | 1.1 | ||||||||||||
| 17.3 | 3.4 | 1.8 | 2.2 | 1.1 | 2.2 | 1.5 | ||||||||||||
| 17.7 | 1.7 | 1.6 | 1.3 | 2.3 | 1.4 | 2.5 | ||||||||||||
| 18.5 | 3.1 | 2.1 | 3.0 | 1.3 | 2.6 | 1.6 | ||||||||||||
| 18.9 | 1.6 | 1.56 | 1.6 | 2.7 | 1.6 | 2.1 | ||||||||||||
| 19.5 | 2.4 | 2.3 | 2.4 | 1.6 | 2.8 | 2.8 | ||||||||||||
| 20.4 | 1.5 | 1.3 | 1.2 | 1.6 | 1.6 | 1.6 | 1.5 | 1.3 | 1.2 | 1.6 | 1.6 | 1.6 | 1.5 | 2.9 | 3.6 | 1.6 | 2.5 | 2.1 |
| 20.9 | 1.6 | 2.6 | 1.7 | 1.7 | 1.6 | 1.7 | ||||||||||||
| 21.2 | 1.1 | 1.3 | 1.4 | 1.5 | 4.4 | 1.5 | 1.1 | 2.4 | 2.4 | 2.3 | 2.6 | |||||||
| 21.7 | 5.3 | 4.3 | 4.7 | 4.7 | 1.5 | 4.4 | 3.1 | 4.8 | 5.0 | 5.2 | 5.2 | 6 | ||||||
| 22.3 | 2.8 | 23.4 | 4.4 | 4.2 | 2.7 | 2.9 | ||||||||||||
| 23.1 | 1.3 | 2.6 | 3.2 | 2.7 | 3.1 | |||||||||||||
| 23.5 | 1.8 | 2.7 | 2.6 | 28 | 2.6 | 2.8 | 2.3 | 2.0 | 1.8 | 1.8 | 1.8 | 2.0 | ||||||
| 24.0 | 1.2 | 1.9 | 1.7 | 1.8 | 1.8 | 1.8 | 2.6 | 2.1 | 1.9 | 1.8 | 1.8 | 2.2 | ||||||
| 24.3 | 1.4 | 1.2 | 1.6 | 1.8 | 1.3 | 1.7 | ||||||||||||
| 25.0 | 1.4 | 2.8 | 3.2 | 2.7 | 2.7 | 2.4 | 5.2 | 4.9 | 2.2 | 2.4 | 2.1 | |||||||
| 25.7 | 1.7 | 1.9 | 1.8 | 1.7 | 1.8 | 1.9 | 2.7 | 2 | 1.9 | 2.0 | 2.0 | 2.4 | 3.7 | 1.8 | 6.9 | 1.5 | 1.7 | 1.8 |
| 26.0 | 1.7 | 2.2 | 2.5 | 2.4 | 2.2 | 2.1 | 4.6 | 4.2 | 4.3 | 4.0 | 3.8 | 4.9 | 4.1 | 2.4 | 4.4 | 4.4 | 4.0 | |
| 26.4 | 1.1 | 2.0 | 1.7 | 1.7 | 1.8 | 1.9 | 2.1 | 2.1 | 1.5 | 2.1 | 2 | 2.3 | ||||||
| 28.2 | 1.6 | 2.3 | 1.8 | 1.7 | 2.0 | 2.1 | ||||||||||||
| 28.7 | 1.6 | 1.8 | 1.7 | 1.6 | 1.7 | 1.7 | ||||||||||||
| 29.2 | 2.0 | 1.7 | 1.7 | 1.9 | 1.9 | 1.9 | ||||||||||||
| 29.4 | 1.4 | 1.5 | 1.6 | 1.1 | 1.3 | 1.4 | 4.8 | 4.7 | 4.6 | 4.2 | 4.2 | 5.1 | ||||||
| 29.9 | 2.4 | 3.1 | 5.0 | 2.8 | 3.0 | 2.2 | 11.4 | 13.3 | 16.2 | 12.1 | 12.6 | 15.3 | 8.2 | 9.7 | 8.0 | 8.7 | 8.7 | 5.9 |
| 32.1 | 2.2 | 2.0 | 1.7 | 1.6 | 1.7 | 1.8 | 3.2 | 3.3 | 3.2 | 3.4 | 3.3 | 3.2 | ||||||
| 32.6 | 9.2 | 6.3 | 8.1 | 8.4 | 7.6 | 6.1 | 11.7 | 11.3 | 11.5 | 13.4 | 13.7 | 15.8 | 4.8 | 4.1 | 1.9 | 1.4 | 3.3 | 3.1 |
| 33.8 | 1.7 | 1.5 | 1.2 | 1.1 | 1.1 | 1.2 | 2.2 | 1.7 | 1.4 | 1.9 | 1.8 | 1.5 | ||||||
| 34.4 | 1.4 | 1.2 | 1.5 | 1.2 | 1.08 | 1.06 | 1.4 | 1.8 | 9.0 | 8.8 | 1.4 | 1.1 | ||||||
| 34.9 | 7.0 | 8.9 | 12.9 | 7.5 | 8.9 | 10.2 | 10.5 | 8.8 | 1.3 | 1.8 | 8.0 | 4.6 | ||||||
| 35.5 | 1.1 | 1.3 | 1.3 | 1.5 | 1.5 | 1.4 | ||||||||||||
| 36.2 | 2.5 | 3.0 | 3.6 | 3.4 | 3.2 | 3.6 | 1.3 | 2.3 | 2.3 | 1.9 | 1.2 | |||||||
| 36.6 | 15.2 | 4.0 | 3.6 | 3.4 | 4.2 | |||||||||||||
| 40.9 | 3.1 | 2.1 | 1.2 | 2.6 | 2.3 | 2.8 | ||||||||||||
| Wavelength | N | W | BR | B | Out | In |
|---|---|---|---|---|---|---|
| 230 nm | 72,846,065 | 121,603,884 | 138,175,507 | 32,277,741 | 40,448,346 | 66,619,765 |
| 80.33%/1 | 77.86%/1.7 | 80.0%/1.9 | 88.77%/0.44 | 15.59%/0.56 | 31.14%/0.91 | |
| 280 nm | 17,826,203 | 34,570,769 | 34,542,961 | 4,083,881 | 218,965,220 | 147,339,123 |
| 19.65%/1 | 22.14%/1.9 | 20.0%/1.9 | 11.23%/0.23 | 84.41%/12.3 | 68.86%/8.27 | |
| Total | 90,672,268 | 156,174,653 | 172,718,468 | 36,361,622 | 259,413,566 | 213,958,888 |
| 9.76%/1 | 16.81%/1.59 | 18.59%/1.9 | 3.91%/0.4 | 27.91%/2.86 | 23.02%/2.36 | |
| Wavelength | L6-BR | L5-BR | L4-BR | L3-BR | L2-BR | L1-BR |
| 230 nm | 93,637,794 | 143,705,044 | 94,324,220 | 52,084,536 | 124,390,618 | 74,809,914 |
| 78.09%/1 | 80.31%/1.53 | 81.19%/1.0 | 81.69%/0.56 | 78.02%/1.33 | 81.93%/0.78 | |
| 280 nm | 26,267,900 | 35,241,665 | 21,856,278 | 11,672,573 | 35,034,461 | 16,497,150 |
| 21.91%/1 | 19.69%/1.34 | 18.81%/0.83 | 18.31%/0.44 | 21.98%/1.33 | 18.07%/0.63 | |
| Total | 119,905,694 | 17,8946,709 | 116,180,498 | 63,757,109 | 159,425,079 | 91,307,064 |
| 16.4%/1 | 24.5%/1.49 | 15.9%/0.97 | 8.7%/0.53 | 21.85%/1.33 | 12.52%/0.76 |
| Category | Retention Time | Formulas | Horizontal Trunk (%) | Upper Branch BR Part (%) | ||||||||
|---|---|---|---|---|---|---|---|---|---|---|---|---|
| N | White | BR | B | L6 | L5 | L4 | L3 | L2 | L1 | |||
| Sequiterpenes | 12.27 | C15H26O | 0.01 | 0.31 | 0.72 | 0.70 | 0.32 | 0.25 | 0.39 | 0.25 | ||
| 13.86 | C15H28O2 | (0.12)1 | 0.05 | (0.30) | (0.22) | (0.10) | (0.11) | (0.13) | 0.12 | |||
| 15.74 | C15H26O | 0.23 | 0.56 | 0.48 | 0.22 | 0.25 | 0.33 | 0.15 | ||||
| 16.94 | C15H24 | 0.17 | 0.01 | |||||||||
| 17.11 | C15H24 | 0.73 | 0.68 | |||||||||
| 17.57 | C15H29O2 | (0.11) | 0.12 | 0.11 | ||||||||
| 18.13 | C15H22O2 | (0.35) | 0.30 | |||||||||
| Chromones | 10.9 | C10H8O2 | 0.13 | 0.09 | 0.06 | 0.07 | 0.06 | |||||
| 20.74 | C11H10O3 | 0.22 | ||||||||||
| 22.82 | C17H24O4 | 0.04 | 0.74 | 0.32 | 0.05 | |||||||
| 23.48 | C16H14O4 | 0.11 | (0.02) | 1.27 | 1.98 | 1.51 | 1.53 | |||||
| 24.01 | C18H16O3 | 0.74 | (0.08) | |||||||||
| 24.38 | C18H18O3 | 0.48 | 1.26 | 0.5 | 1.00 | 1.29 | 3.40 | 0.42 | 1.90 | 2.68 | ||
| 26.34 | C17H14O5 | 0.62 | 1.41 | 0.16 | ||||||||
| 27.02 | C16H12O5 | 0.42 | ||||||||||
| Terpenoids | 8 | C10H12O | 0.04 | 0.41 | 1.13 | 0.83 | 0.37 | 0.40 | 0.49 | 0.29 | ||
| 8.27 | C10H16O2 | 0.48 | ||||||||||
| 8.33 | C10H12O2 | (0.16) | (0.16) | (0.07) | 0.06 | 0.09 | ||||||
| 8.77 | C9H10O2 | 0.05 | ||||||||||
| 10.55 | C10H18O3 | 0.51 | ||||||||||
| 13.12 | C10H12O3 | 0.43 | 0.90 | 0.26 | 0.13 | 0.8 | 0.52 | 0.26 | 0.15 | 0.25 | 0.27 | |
| 14.3 | C20H28O2 | (0.23) | 0.24 | |||||||||
| 16.98 | C20H28O6 | 0.68 | 0.96 | |||||||||
| Alkaloids | 9.33 | C6H9NO3 | 0.08 | |||||||||
| 11.16 | C13H21NO2 | 0.10 | 0.05 | |||||||||
| 17.28 | C8H16N2O7 | 1.28 | 1.79 | 1.83 | ||||||||
| 23.58 | C18H27NO3 | 2.29 | ||||||||||
| 23.97 | C14H14C12N2 | 1.19 | 0.54 | 0.74 | 1.73 | 2.59 | ||||||
| 24.73 | C20H25NO | 0.04 | 1.16 | 1 | 4.57 | 0.38 | 0.42 | 3.45 | ||||
| 25.66 | C23H23NO | 1.16 | ||||||||||
| 25.83 | C17H14N2O4 | 2.20 | 1.07 | |||||||||
| 35.68 | C23H23NO | 1.23 | ||||||||||
| Aromatic compounds | 4.59 | C7H6O | (0.04) | 0.27 | (0.06) | 0.70 | 0.51 | 0.28 | 0.30 | 0.31 | 0.22 | |
| 8.91 | C9H10O2 | (0.48) | (0.41) | 0.11 | ||||||||
| 9.13 | C8H10O3 | 0.06 | (0.09) | |||||||||
| 10.56 | C11H14O2 | (0.21) | (0.15) | (0.06) | (0.05) | 0.08 | 0.05 | |||||
| 10.63 | C14H22O | 0.09 | (0.09) | (0.08) | (0.11) | |||||||
| 11.5 | C9H12O4 | 0.13 | (0.15) | |||||||||
| 19.15 | C18H27NO3 | 2.28 | ||||||||||
| 19.29 | C17H16O | 0.79 | 0.23 | 0.31 | 0.17 | |||||||
| 20.42 | C15H13IO2 | (0.20) | 0.20 | 0.28 | ||||||||
| 20.43 | C17H18O | 0.39 | 0.23 | 0.69 | 0.63 | 0.34 | ||||||
| 21.54 | C17H14O2 | (0.68) | 0.71 | 0.79 | 1.01 | |||||||
| 24.72 | C20H25NO | 0.85 | ||||||||||
| 25.67 | C8H10S2 | 1.13 | ||||||||||
| Fatty acids | 16.02 | C17H34O2 | 0.13 | (0.12) | (0.25) | (0.18) | 0.55 | 0.34 | 0.19 | 0.21 | 0.14 | |
| 16.58 | C16H32O2 | 0.13 | 0.72 | 1.03 | 0.83 | 1.58 | 1.33 | |||||
| 17.93 | C22H34O2 | (0.51) | (0.20) | (0.29) | 0.19 | 0.23 | ||||||
| 18.33 | C19H36O2 | 0.13 | (0.25) | 0.43 | (0.35) | 1.20 | 1.02 | 0.50 | 0.31 | 0.34 | 0.29 | |
| 18.75 | C18H34O2 | (0.02) | 1.75 | (0.29) | 0.79 | |||||||
| 24.46 | C18H33ClO | 0.53 | ||||||||||
| 24.47 | C21H40O4 | (0.19) | 0.41 | |||||||||
| 24.52 | C21H34O2 | 0.59 | 0.58 | 0.58 | ||||||||
| Others | 10.06 | C4H9NO5 | 1.19 | (0.42) | ||||||||
| 11.67 | C6H12O4 | 0.25 | ||||||||||
| 11.85 | C8H16O6 | 4.57 | (0.08) | |||||||||
| 16.58 | C12H22O11 | 9.46 | 0.74 | 0.86 | 0.92 | 1.38 | ||||||
| 16.63 | C6H12O6 | 1.24 | 1.76 | |||||||||
Disclaimer/Publisher’s Note: The statements, opinions and data contained in all publications are solely those of the individual author(s) and contributor(s) and not of MDPI and/or the editor(s). MDPI and/or the editor(s) disclaim responsibility for any injury to people or property resulting from any ideas, methods, instructions or products referred to in the content. |
© 2023 by the authors. Licensee MDPI, Basel, Switzerland. This article is an open access article distributed under the terms and conditions of the Creative Commons Attribution (CC BY) license (https://creativecommons.org/licenses/by/4.0/).
Share and Cite
Chen, L.-G.; Arumsari, A.D.; Chu, C. Progressive Vertical and Horizontal Phytocompound Changes during Agarwood Formation in Aquilaria sinensis after Geotrichum candidum Injection. Life 2023, 13, 2147. https://doi.org/10.3390/life13112147
Chen L-G, Arumsari AD, Chu C. Progressive Vertical and Horizontal Phytocompound Changes during Agarwood Formation in Aquilaria sinensis after Geotrichum candidum Injection. Life. 2023; 13(11):2147. https://doi.org/10.3390/life13112147
Chicago/Turabian StyleChen, Lih-Geeng, Amalia Dyah Arumsari, and Chishih Chu. 2023. "Progressive Vertical and Horizontal Phytocompound Changes during Agarwood Formation in Aquilaria sinensis after Geotrichum candidum Injection" Life 13, no. 11: 2147. https://doi.org/10.3390/life13112147