Article

Natural and Technical Phytoremediation of Oil-Contaminated Soil

Institute of Biochemistry and Physiology of Plants and Microorganisms, Saratov Scientific Centre of the Russian Academy of Sciences (IBPPM RAS), 13 Prospekt Entuziastov, 410049 Saratov, Russia
*
Author to whom correspondence should be addressed.
Life 2023, 13(1), 177; https://doi.org/10.3390/life13010177
Submission received: 30 November 2022 / Revised: 28 December 2022 / Accepted: 30 December 2022 / Published: 7 January 2023
(This article belongs to the Special Issue Novel Insights into Phytoremediation of Pollutants)

Abstract

:
Natural and technical phytoremediation approaches were compared for their efficacy in decontaminating oil-polluted soil. We examined 20 oil-contaminated sites of 800 to 12,000 m2 each, with different contamination types (fresh or aged) and levels (4.2–27.4 g/kg). The study was conducted on a field scale in the industrial and adjacent areas of a petroleum refinery. Technical remediation with alfalfa (Medicago sativa L.), ryegrass (Lolium perenne L.), nitrogen fertilizer, and soil agrotechnical treatment was used to clean up 10 sites contaminated by oil hydrocarbons (average concentration, 13.7 g/kg). In technical phytoremediation, the per-year decontamination of soil was as high as 72–90%, whereas in natural phytoremediation (natural attenuation with native vegetation) at 10 other oil-contaminated sites, per-year decontamination was as high as that only after 5 years. Rhizodegradation is supposed as the principal mechanisms of both phytoremediation approaches.

1. Introduction

After nearly three decades of close study and application, phytoremediation has proven a sustainable, cost-effective, environmentally benign, and highly socially acceptable technology [1,2,3,4]. The range of pollutants treated by phytoremediation is wide and includes organic (petroleum hydrocarbons, pesticides, and antibiotics) and inorganic (heavy metals and radionuclides) pollutants [3,4]. Despite its limitations, such as the long processing time and the dependence on climatic conditions and plant competence toward certain pollutants [5,6,7], phytoremediation has undoubted advantages, such as low cost and the possibility of restoring large areas in situ [4,7,8]. For these reasons, phytoremediation is used widely in the eco-management of petrochemical enterprises. In some countries, including Russia and the USA, the use of plants and associated microorganisms for the cleanup of oil-contaminated areas is regulated by specific documents [9,10].
Phytoremediation is based on the natural recycling and utilization of pollutants present in the plant root zone. These processes are affected by root exudates and the metabolic activity of the soil microbiota. In response to environmental pollution by petroleum hydrocarbons, plants activate antioxidant enzymes [11,12,13]. Some of these enzymes (e.g., peroxidases, which have a wide substrate range) are present in root exudates and are implicated in the degradation of organic pollutants both in planta and ex planta [14,15,16,17]. Other root exudate components, such as organic acids, carbohydrates, and flavonoids, function as inducers of microbial metabolic activity or substrates for microbial growth in the plant root zone [18,19]. The plant promotion of soil microbial growth and the pollutant induction of microbial degradative activity constitute the main pathway for the soil degradation of petroleum hydrocarbons, rhizodegradation, which is the key mechanism of the phytoremediation of oil-contaminated soils [20,21,22].
The knowledge that has accumulated on the fundamentals of phytoremediation leads to the following question: Is natural vegetation in a contaminated area sufficient for soil rehabilitation, or is it necessary to resort to agrotechnical measures such as fertilization or special plant growing? Obviously, the duration of remediation will be different in either case. The decision in favor of natural or technical phytoremediation would be influenced by considerations such as the level of pollution (severe pollution hinders the growth of native vegetation), the period needed to make soil suitable for recultivation, and the suitability of other techniques (depending on the characteristics of the economic exploitation of the contaminated area). In this context, it is important to understand the difference between natural and technical phytoremediation, so that recultivation results could be predicted.
We compared the efficacy of natural versus technical phytoremediation of oil-contaminated soil in the industrial and adjacent areas of a petroleum refinery. In this study, the term “natural phytoremediation” means natural processes resulting in the cleanup or attenuation of oil pollution of soil covered with natural vegetation. The term “technical phytoremediation” means special agrotechnical remediation measures, such as soil tilling, soil fertilization, and the planting and watering of remediating plants. The progress of phytoremediation was assessed by measuring the vegetation cover, the oil concentration, the available nitrogen content, and the soil microbial content.

2. Materials and Methods

2.1. Monitoring of Oil-Contaminated Areas

The areas of study are located in the steppe zone of Russia’s Middle Volga region. The industrial and adjacent areas of the local petroleum refinery were monitored for 5 years. The total inspected area was about 340 ha and was divided into 297 sites. The soils of the surveyed area were based on shallow chernozems (WRB: Mollic Vertisols Eutric or FAO: Mollic Vertisols). The soils had a pH of 7.0–7.8, and their buffering capacity was high. The content of total organic carbon ranged from 1.5 to 6%; that of NO3, from 4 to 16 mg/kg; that of NH4, from 14 to 30 mg/kg; and that of P2O5, from 84 to 120 mg/kg.
During inspection, 20 oil-contaminated sites were identified. The predominant plant inhabitants, the foliage projective cover, and the soil content of total petroleum hydrocarbons (TPHs) were determined. The foliage projective cover (percentage of ground area occupied by the vertical projection of foliage) was determined by using the Ramenskiy mesh, as described [23]. Ramenskiy mesh is a small plate in which a rectangular 2 × 5-cm hole is made and is divided into 10 square cells of 1 cm2 each by using a thin wire. By looking at the herbage through the mesh hole, we determined how many 1 cm2 cells could be attributed to the foliage projection and how many to the uncovered soil surface, seen through the herbage. The plant species were counted and identified, as reported earlier [24].

2.2. Phytoremediation Approaches

As a result of monitoring, we chose 10 oil-contaminated sites that had a satisfactory (>20%) foliage projective cover. These were observed for a few years to evaluate the rate of natural phytoremediation. Once a year, we determined the soil content of TPHs, N-NO3, and N-NH4; the number of microorganisms; and the number of plants inhabiting the sites.
The other 10 sites were used for technical phytoremediation, which included soil tilling, soil fertilization, and planting and watering of remediating plants (Table 1). We used a mixture of legume and cereal plants. The principal remediating plants were alfalfa (Medicago sativa L.) and ryegrass (Lolium perenne L.). Preliminary laboratory and pot experiments had led us to find that both species were effective at reducing the content of all hydrocarbon fractions in oil-sludge-contaminated soil [25]. Watering and soil rotary cultivation are trivial soil-remediation approaches.
Soil was sampled before plant sowing, after 3 and 12 months, and then annually. Samples were taken at several local points from a depth of 5–15 cm by using the envelope method. Mixed samples (~1.0 kg), combined from 5–8 local point samples from each site, were divided into replications (n ≥ 3) to measure the soil content of TPHs, N-NO3, N-NH4, and the number of microorganisms.

2.3. Soil Chemical Analysis

The soil content of TPHs was measured by gravimetric analysis, as described in the federal regulatory document [26]. The method is based on the extraction of oil products with chloroform from air-dried soil, separation of polar compounds by liquid chromatography after solvent replacement with hexane, and measurement by gravimetric analysis. A soil sample (~30 g dry weight) was placed into a 150 mL flask, and 10–15 mL of chloroform was added. For extraction, the flask was shaken for 5 min, and the chloroform extract was decanted and filtered through ashless paper (pore diameter, 8–12 µm) into a beaker. The procedure was repeated 3–4 times until the extract was decolorized. The extracts were combined and evaporated. The residue was redissolved in 5–10 mL of hexane and was passed through a column (120–150 mm × 10 mm) containing 6–8 g of activated alumina. The eluate was collected in preweighed beakers. After the solvent evaporated, the beakers were reweighed, and the TPH content was calculated. All soil samples were analyzed in triplicate. The tentative allowable concentration of TPHs in nonindustrial soil, as recommended at the regional level, is 1.0 g/kg [27].
Soil nitrates and water-soluble ammonium were measured by standard photocolorimetric methods [28,29]. The determination of nitrates included the following steps: extraction of nitrates from soil with a potassium chloride solution, reduction of nitrates to nitrites with hydrazine in the presence of copper as a catalyst, and photometric measurement of the colored diazo compound formed. The determination of exchangeable ammonium included the following steps: extraction of exchangeable ammonium from soil with a potassium chloride solution, generation of a colored indophenol compound formed by the interaction of ammonium with hypochlorite and sodium salicylate in an alkaline medium, and photometry of the colored solution.

2.4. Soil Microbiological Analysis

Total cultivable heterotrophic microorganisms (THMs) were enumerated by the plating dilution technique by using a beef extract agar medium. The membrane filter technique and Bushnell and Haas’s medium [30] with sterilized crude oil were used to enumerate hydrocarbon-oxidizing microorganisms (HOMs), as described previously [25].

2.5. Statistics

Data were processed by calculating the means of at least three replicates. Standard deviations (SD) and confidence intervals were used at p ≤ 0.05. Spearman’s rank correlation analysis was used to find the relations between the measured parameters. Statistica 13 (TIBCO Software Inc. 2017, Statsoft Russia, Palo Alto, CA, USA) and Microsoft Excel 2007 (Microsoft, Redmond, WA, USA) software were used for analysis.

3. Results

3.1. Monitoring of Oil-Contaminated Areas

Table 2 lists the principal characteristics of the oil-contaminated sites. The average TPH content in the soil of the sites was 13.7 g/kg, ranging from 4.2 to 27.4 g/kg in the mixed samples taken from five locations at each site. The foliage projective cover at sites S-1–S-10 was about 20–70%. With the allowance for the economic purpose of these sites, they were considered suitable for natural attenuation (natural phytoremediation). The foliage projective cover at sites S-11–S-20 was too low, and the contaminated areas were not too large. These sites were considered suitable for remediation by the planting of effective remediating plants (technical phytoremediation).

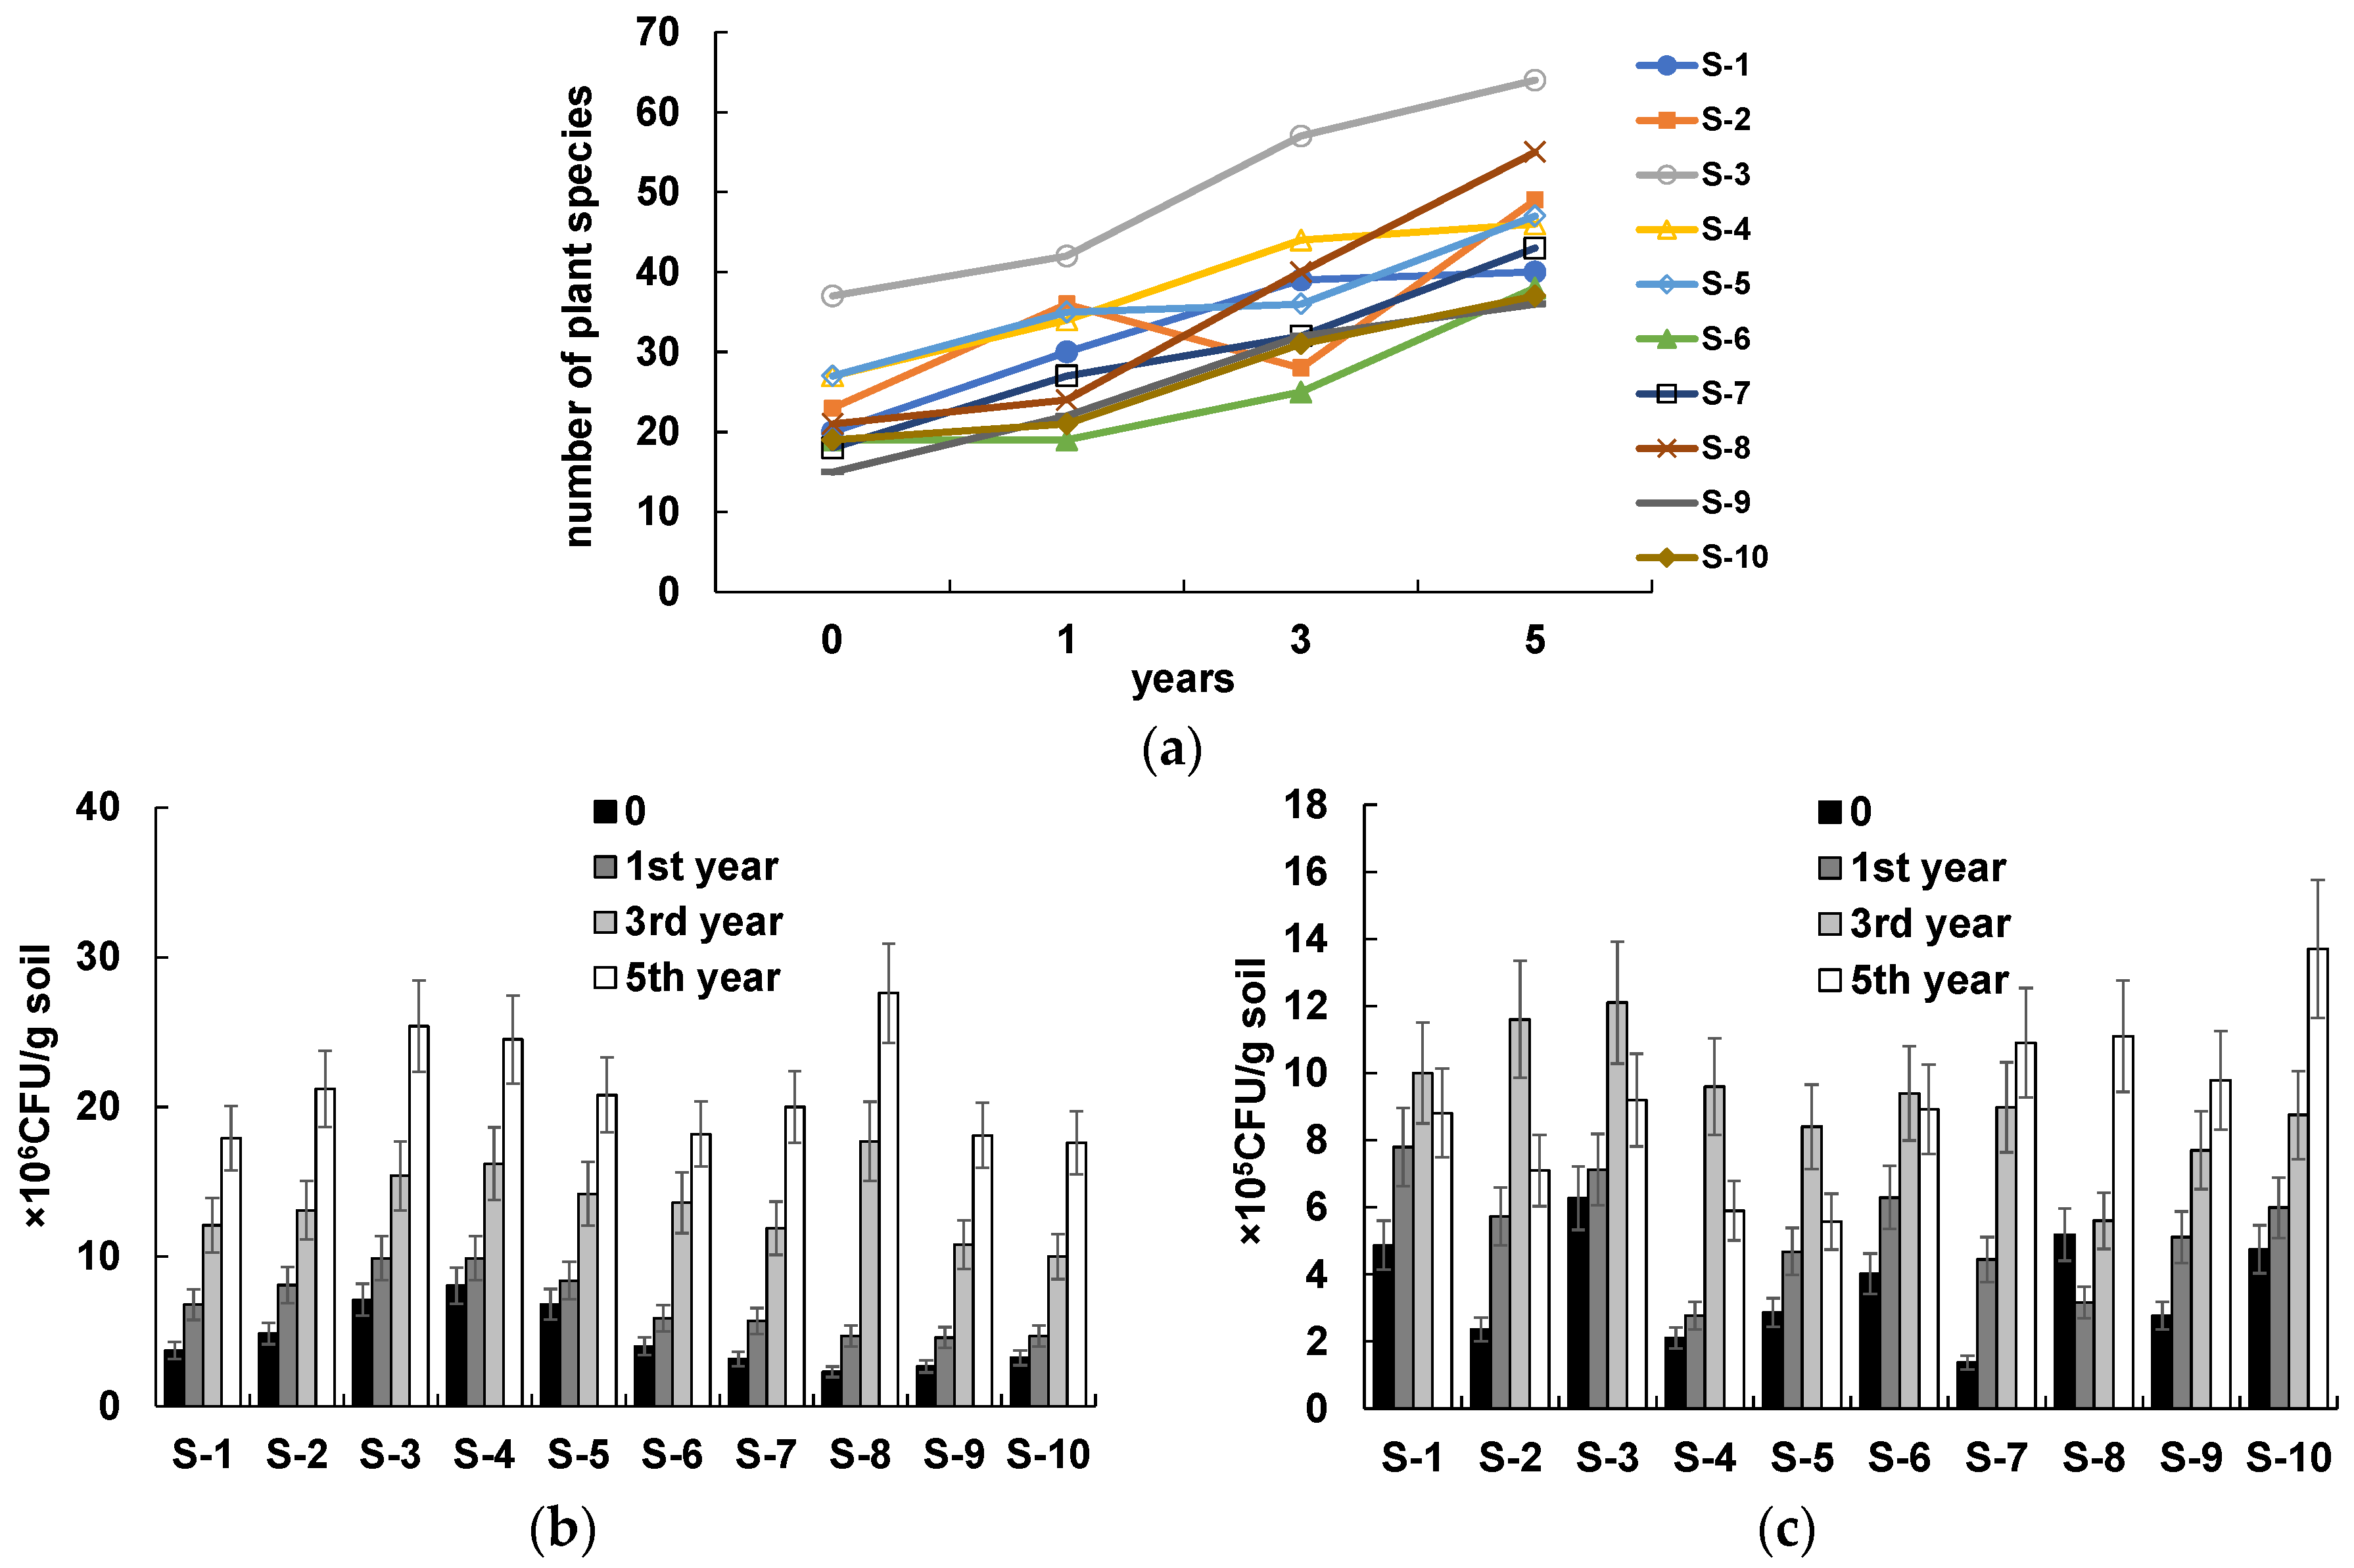
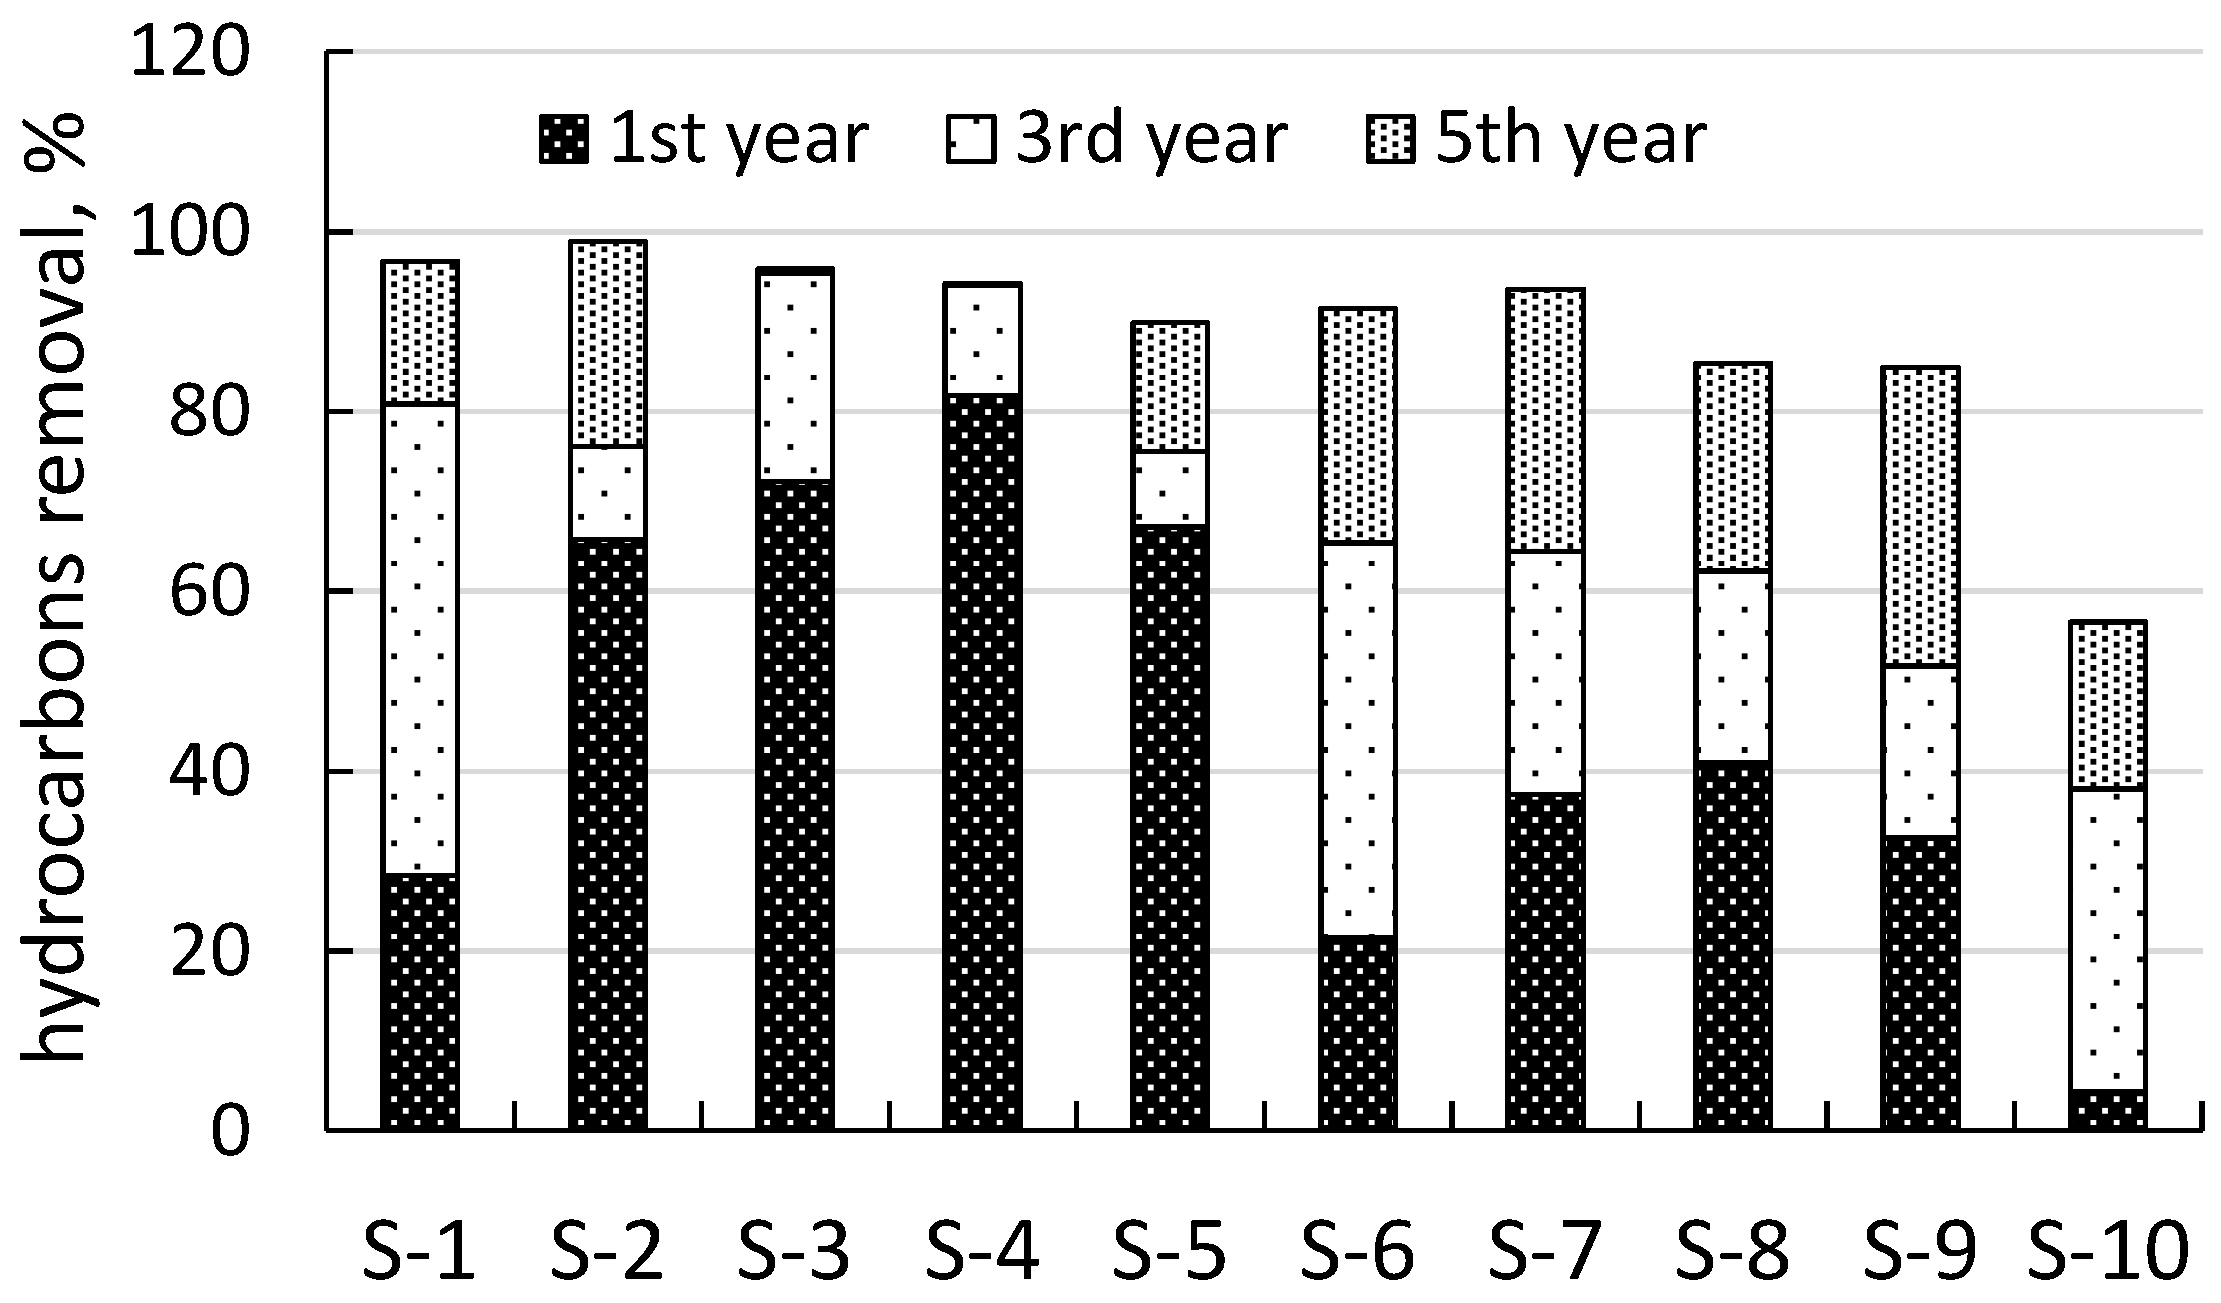
3.2. Natural Phytoremediation

As a result of monitoring, oil-contaminated sites S-1–S-10, which had a satisfactory foliage projective cover, were observed for a few years to evaluate the rate of natural phytoremediation. Once a year, we determined the soil content of TPHs and available nitrogen; the numbers of THMs and HOMs; and the number of plants inhabiting the sites. Figure 1 shows the time course of changes in the diversity of plant species and in the abundance of culturable microorganisms in the soil subjected to natural phytoremediation. As can be seen, within 5 years, the diversity of plant species increased at all sites surveyed (Figure 1a). In total, 203 species were identified, with the predominant species being Elytrigia repens, Bromus squarrosus, Calmagrostis epigeios, Poa pratensis, Polygonum aviculare, Euphorbia virgata, Medicago falcata, Cichorium intybus, and Artemisia austriaca and absinthium.
The increases in plant species diversity and the vegetation cover in plots S-1–S-10 were accompanied by increases in the numbers of soil microorganisms (Figure 1b,c). At all sites, the THM number increased steadily for 5 years (Figure 1b). The HOM number peaked in the third year, after which it decreased at the sites at which the TPH content decreased to less than 1.0 g/kg (sites S-1–S-6; Figure 1c). By contrast, the HOM number at sites S-7–S-10 continued to increase.
With increased foliage projective cover and species diversity, the content of ammonium nitrogen gradually increased from 12 to 28 mg/kg at the beginning of the observation period to 26–38 mg/kg after 5 years (Table 3). The nitrate content also increased from 2 to 4 mg/kg to 3–6 mg/kg in the same period. No unidirectional dynamics were found in the phosphorus content (data not shown), which ranged from 29 to 123 mg/kg throughout the observation period. The soil pH remained close to neutral, with a gradual increase of 6.8 to 7.3 within 5 years.
The increase in plant diversity was accompanied by a reduction in the soil TPH content. The average initial content of TPHs at sites S-1–S-10 was about 13.0 g/kg. Natural phytoremediation decreased the average TPH content to 7.8, 4.8, and 1.8 g/kg in the first, third, and fifth years, respectively.
The phytoremediation rate differed markedly between sites (Figure 2), possibly because of the nature of oil pollution (Table 2). In the first year, the phytoremediation rate was highest at freshly polluted sites (S-2–S-5) and minimal at the sites with a history of oil pollution (S-1, S-6, and S-10). The decontamination of these latter sites was more effective in the subsequent years. Notably, during the first year, the phytoremediation efficiency ranged widely from 4% (at S-10) to 82% (at S-4).
In the third year, the TPH content at sites S-3 and S-4 already was within the maximum permissible limits (<1000 mg/kg [27], Table 3). In the fifth year, the same picture emerged at four more sites (S-1, S-2, S-5, and S-6). Among these sites, S-2 had a high initial TPH content (about 19 g/kg) and eventually showed the highest phytoremediation rate (98.9%).

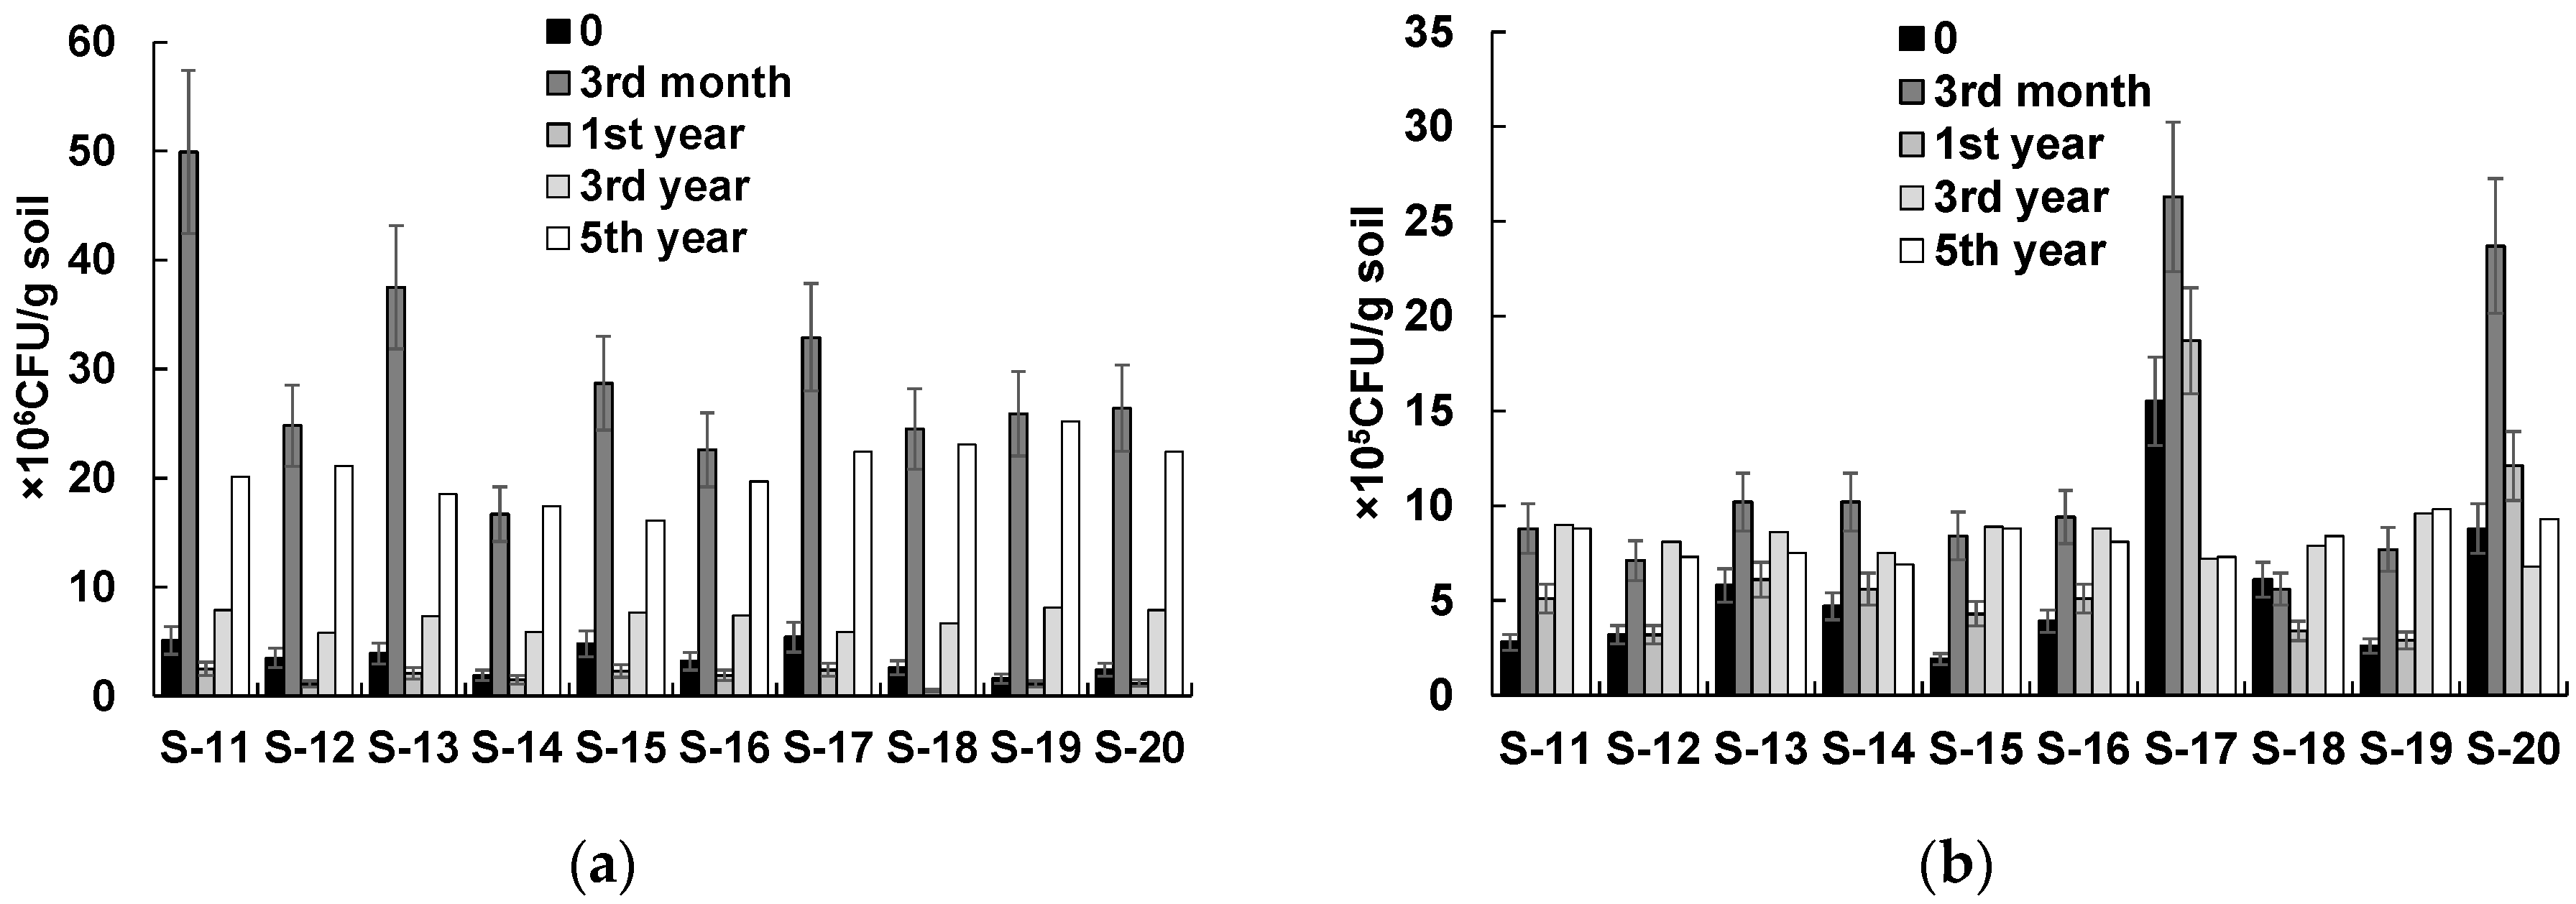
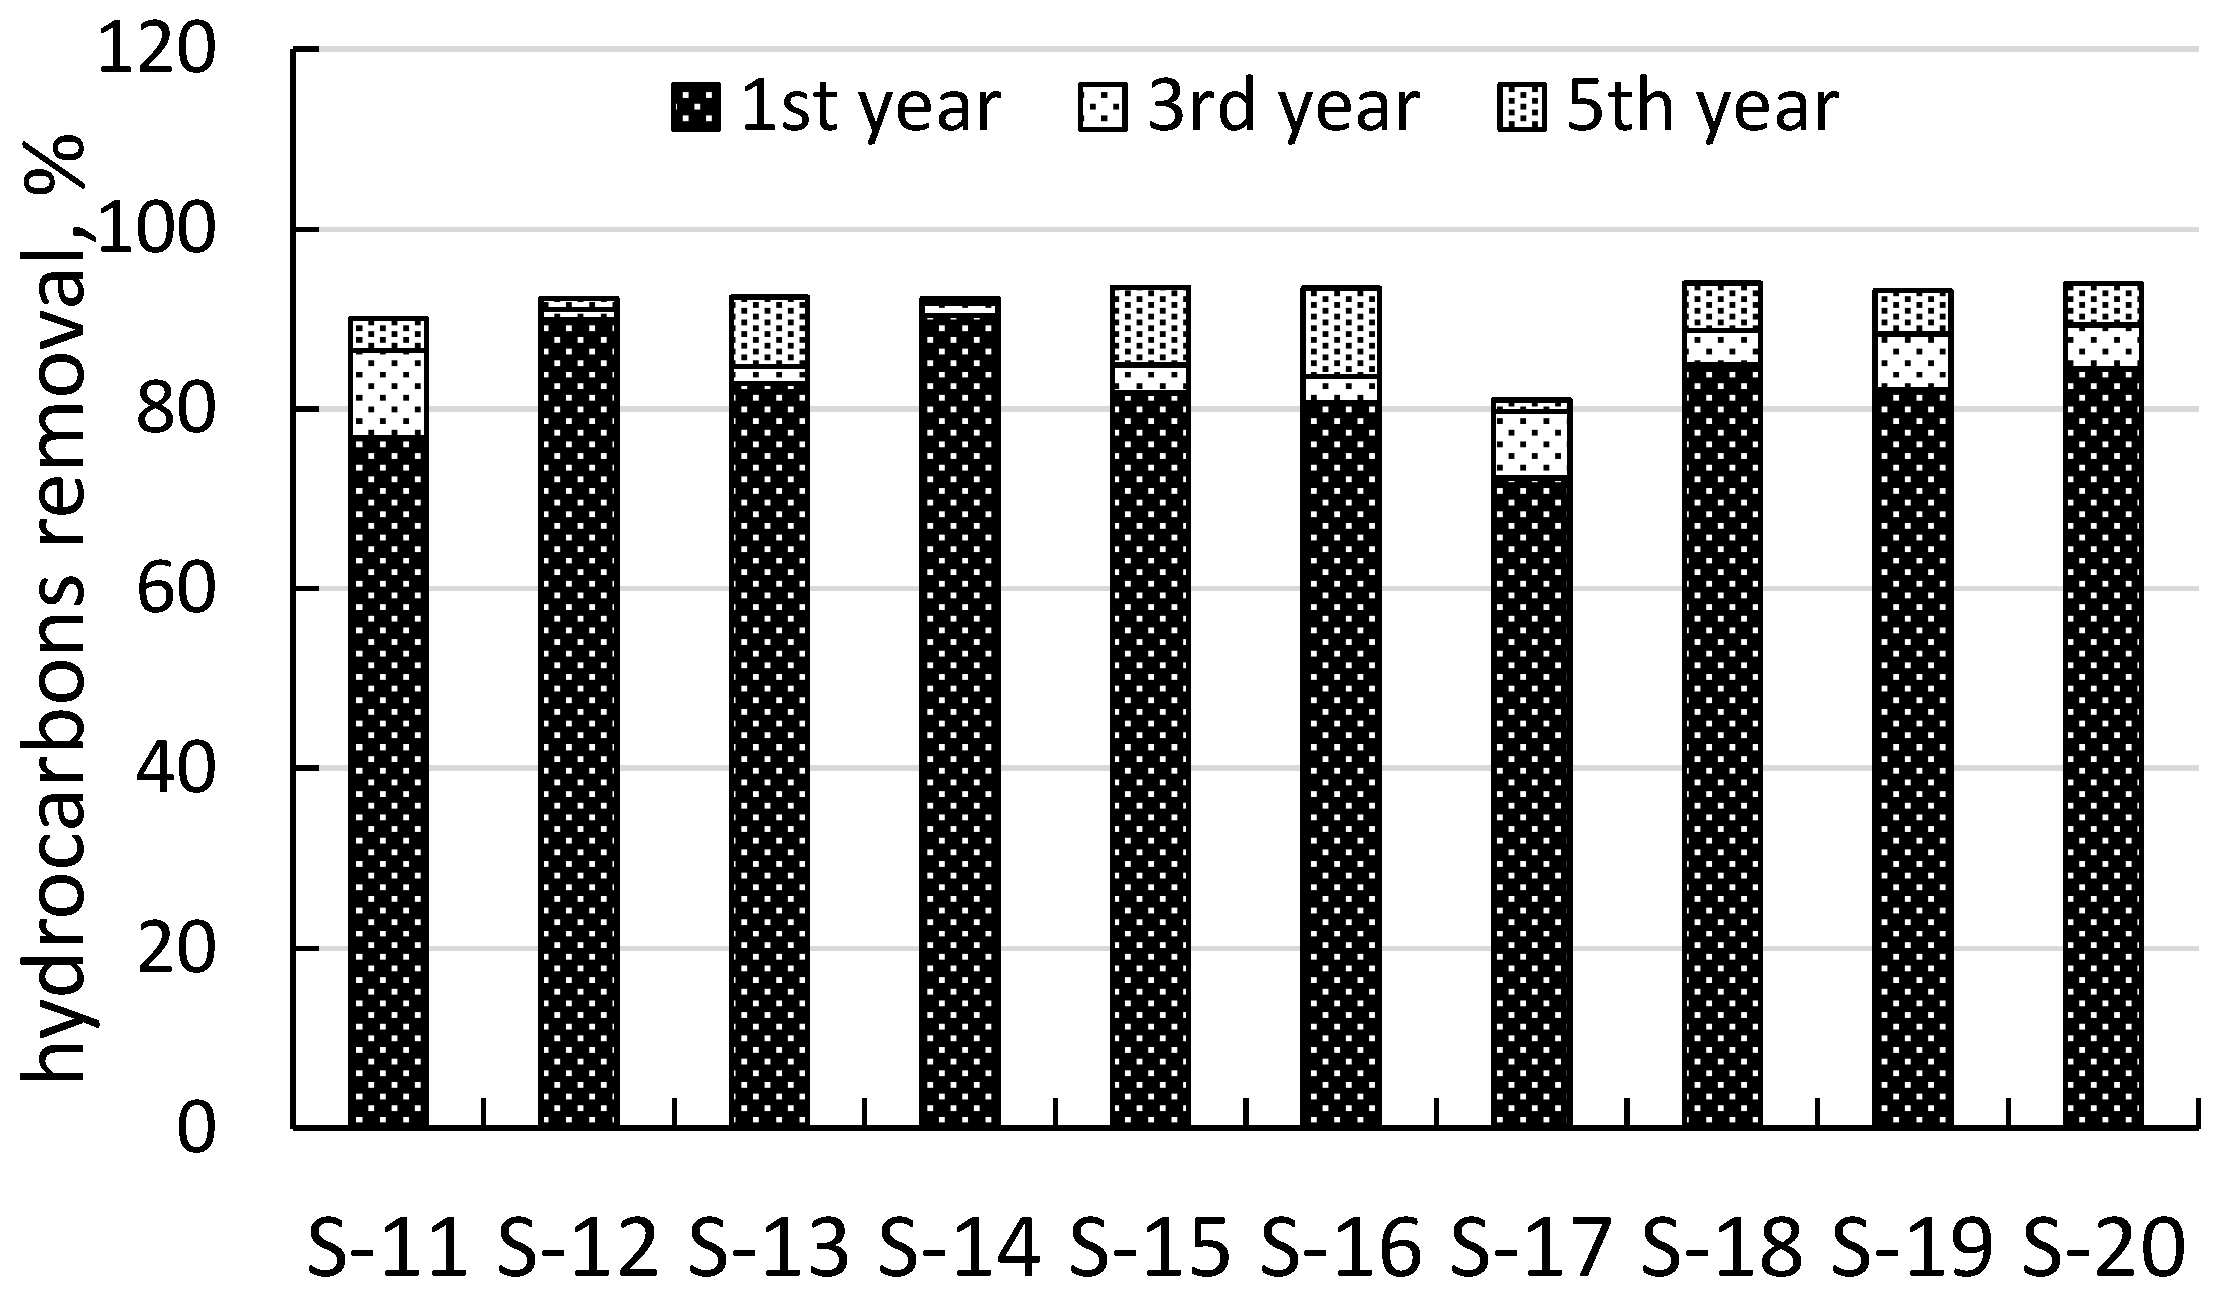
3.3. Technical Phytoremediation

The technical phytoremediation efficiency was evaluated after three months and then after one, three, and five years of treatment. During technical phytoremediation, the foliage projective cover at the worst polluted sites increased from 20 to 40% in the first year. As early as next year, sites S-11–S-20 had native plants such as Melilotus officinalis and Agropyron cristatum, as well as cultivated plants such as Medicago sativa and Lolium perenne. In the third year, the vegetation cover included both introduced and native plant species, and the number of the latter was much larger than that of the former.
Figure 3 and Table 4 show the results of the soil microbial and chemical analyses for technically remediated sites S-11–S-20. One can see that in the first three months of treatment, soil microorganisms were activated (Figure 3). The number of THMs increased by 10 times in response to nitrogen fertilization. The number of HOMs increased as well. A year later, however, the number of THMs dropped sharply. The soil content of available nitrogen also decreased (Table 4). The increased content of available nitrogen in the third month of treatment was associated with the application of nitrogen fertilizer.
The average initial content of TPHs at sites S-10–S-20 was about 14.4 g/kg. Technical phytoremediation decreased the average TPH content to 2.5, 1.9, and 1.1 g/kg in the first, third, and fifth years, respectively.
At all sites, technical phytoremediation was noticeably effective as early as after a year of treatment, regardless of the history and level of oil pollution (Figure 4).
The average phytoremediation rate was 82%, ranging from 72 to 90% at different sites.

4. Discussion

Which method is chosen for the recultivation of oil-contaminated soil is primarily determined by the type and properties of the soil, the kind and concentration of the pollutant, the area of the land, the natural conditions, and the economic purpose of the contaminated area. All these factors may limit the period and scale of use of the chosen technology. Comparative studies of bioremediation techniques such as natural attenuation, biostimulation, bioaugmentation, mycoaugmentation, and phytoremediation have been conducted mainly in the laboratory [31,32,33], and few have been conducted in the field [34,35]. Many researchers agree that although phytoremediation is inferior to other bioremediation methods in terms of the decontamination rate [7,31], it is sustainable, cheap, and effective in terms of the completeness of decontamination [7,31,32]. Actual large-scale field phytoremediation trials are few [36,37,38,39,40,41], and we did not find comparisons of the efficacy of natural versus introduced vegetation in the restoration of oil-contaminated soils. In this sense, our results may be of some interest.
In this five-year study, the establishment of a vegetation cover was a fundamental component of phytoremediation. The oil-contaminated areas were naturally revegetated. The increase in species diversity at the sites with a history of oil pollution was higher (219% on average, 10 sites) than at the freshly polluted sites (194% on average, 10 sites) (Figure 2), possibly owing to the toxicity of not yet volatilized light oil hydrocarbons [42].
Correlation analysis confirmed that as the contaminated areas developed a vegetation cover, the total number of microorganisms, including oil degraders, increased (rs = 0.77; p < 0.05). This dependence can be explained by the rhizosphere effect, i.e., stimulation by plant root exudates of the abundance and activity of the root zone microorganisms [19,43]. Soil microorganisms, particularly oil-degrading bacteria, are major actors involved in the removal of petroleum hydrocarbons from the environment [20,21,44].
The numbers of THMs and HOMs changed differently between natural and technical phytoremediation treatments. In natural phytoremediation, the microbial numbers increased gradually from 4.2 to 21.1 × 10⁶ CFU/g soil (THMs) and from 3.3 to 9.1 × 10⁵ CFU/g soil (HOMs) (average figures for 10 sites). The THM and HOM numbers peaked in the fifth year of study as the contaminated sites developed a vegetation cover. Technical phytoremediation, including soil agrotechnical treatment, stimulated the development of a soil indigenous microflora and accelerated the natural revegetation of the sites, ultimately leading to the cleaning and ecological restoration of the soil. The microbial numbers at the sites subjected to technical phytoremediation increased by 10 times (from 3.1 to 29.0 × 10⁶ CFU/g of soil (THMs) and from 5.0 to 11.7 × 10⁵ CFU/g of soil (HOMs) (average values for 10 sites)), and they were highest after nitrogen fertilizer had been applied. However, as early as a year after the start of remediation, the microbial numbers decreased to the initial level (to 1.7 × 10⁶ CFU/g of soil (THMs) and to 6.8 × 10⁵ CFU/g of soil (HOMs) (average values for 10 sites)). A significant inverse correlation was found between the THM number and the pollutant content in the soil (rs = −0.59; p < 0.05). Gradually, the number of THMs at the sites subjected to technical phytoremediation increased as the ecosystem was restored, and in the fifth year of study, it was comparable to the microbial number in the soil of the sites subjected to natural phytoremediation.
It is known that soil nitrogen fertilization causes a priming effect—an increase in the number and activity of microorganisms and an increase in the decomposition of organic matter [45]. This is what we observed during technical phytoremediation. Previous work has shown that the application of nitrogen fertilizer promotes the biodegradation of petroleum hydrocarbons in soil [46,47]. Our study revealed a close correlation between the content of ammonium nitrogen and the efficiency of phytoremediation at each stage (first year, rs = 0.57; third year, rs = 0.76; and fifth year, rs = 0.50; p < 0.05). The explosive growth in the number of microorganisms resulted in the high degradation of petroleum hydrocarbons in the same period, regardless of the concentration and age of the pollution. By the end of the first year, the utilization of organic matter and the depletion of nutrient nitrogen, intensified by competition for nitrogen from the introduced plants, led to a decrease in the number of soil microorganisms, but in this period, the soil had already been clean. We believe that this is how the events associated with technical phytoremediation occurred under the described conditions.
In natural phytoremediation, decontamination proceeded more slowly than in technical phytoremediation. However, it was stably supported by the developing vegetation. As a vegetation cover developed, the content of available nitrogen increased slowly. This was confirmed by the significant correlation found between the area of the foliage projective cover and the soil content of NO3 (rs = 0.60; p < 0.05). As plant roots grow, they change soil conditions, contributing to an increase in the number and activity of soil microorganisms and to the degradation of petroleum hydrocarbons [48]. Thus, the effectiveness of natural phytoremediation is largely determined by the state of the vegetation cover. According to Drugov and Rodin [27], the natural decontamination rates for oil-contaminated soils of different natural biomes but of the same oil-pollution level (5000 mg/kg) are evaluated for the following periods: up to 5 years (high natural decontamination rate), up to 10 years (medium natural decontamination rate), and up to 30 years and more (low natural decontamination). According to this classification, the rate of natural decontamination at the naturally vegetated sites included in this study is high, exceeding 90% in five years.
This research was conducted in the grounds of a petroleum refinery, and we were able to compare the economic costs of different phytoremediation approaches. On the basis of the cost of a year-long technical phytoremediation project, the reclamation of 1 ha was estimated to cost RUB 1 million (~$14,300/ha or $1.4/m2). Natural phytoremediation did not require costs other than annual costs, including those of mowing, the collection and utilization of plant biomass in both remediated and nonremediated areas around the refinery, and the monitoring of the refinery grounds to find contaminated sites. The cost of a year-long monitoring of the refinery grounds was RUB 140,000/ha (~$2000/ha or $0.2/m2).

5. Conclusions

The remediation efficiency for the oil-contaminated sites in the industrial and adjacent areas of the petroleum refinery was high enough in both technical and natural phytoremediation. However, the rate of technical phytoremediation was higher than that of natural phytoremediation, permitting an acceptable cleanup level to be attained in a shorter period. In technical phytoremediation, including the tilling of soil and the planting and watering of M. sativa and L. perenne, the per-year decontamination of soil from oil hydrocarbons was as high as 72–90%. The efficiency of natural phytoremediation (natural attenuation of soil with the native vegetation cover) was as high as that only after 5 years of treatment. Thus, the high rate and efficiency of technical phytoremediation as a soil rehabilitation approach was confirmed. However, the possibilities of natural phytoremediation, a cost-free process that takes more time than does technical phytoremediation but yields the same results, should not be underestimated. When time permits, the duration of natural phytoremediation may be no bar to its being chosen for the rehabilitation of contaminated areas.

Author Contributions

Conceptualization, L.P. and O.T.; methodology, A.M. and E.D.; software, L.P.; validation, L.P., A.M., E.D. and S.G.; formal analysis, S.G. and O.T.; investigation, A.M. and E.D.; resources, S.G.; data curation, L.P.; writing—original draft preparation, L.P. and A.M.; writing—review and editing, E.D. and O.T.; visualization, A.M.; supervision, L.P. and O.T.; project administration, O.T.; funding acquisition, L.P. All authors have read and agreed to the published version of the manuscript.

Funding

This work was carried out within research theme No. 121031700141-7.

Institutional Review Board Statement

Not applicable.

Informed Consent Statement

Not applicable.

Data Availability Statement

Not applicable.

Acknowledgments

We are very grateful to Maxim Khramov and Evgeny Malyavin from Proton-M Ltd. for their cooperation and technical assistance in the conduct of the field study.

Conflicts of Interest

The authors declare no conflict of interest. The funders had no role in the design of the study; in the collection, analyses, or interpretation of data; in the writing of the manuscript; or in the decision to publish the results.

References

  1. Weir, E.; Doty, S. Social acceptability of phytoremediation: The role of risk and values. Int. J. Phytoremediation 2016, 18, 1029–1036. [Google Scholar] [CrossRef] [PubMed]
  2. Burges, A.; Alkorta, I.; Epelde, L.; Garbisu, C. From phytoremediation of soil contaminants to phytomanagement of ecosystem services in metal contaminated Sites. Int. J. Phytoremediation 2018, 20, 384–397. [Google Scholar] [CrossRef] [PubMed]
  3. Asante-Badu, B.; Kgorutla, L.E.; Li, S.S.; Danso, P.O.; Xue, Z.; Qiang, G. Phytoremediation of organic and inorganic compounds in a natural and an agricultural environment: A review. Appl. Ecol. Environ. Res. 2020, 18, 6875–6904. [Google Scholar] [CrossRef]
  4. Kafle, A.; Timilsina, A.; Gautam, A.; Adhikari, K.; Bhattarai, A.; Aryal, N. Phytoremediation: Mechanisms, plant selection and enhancement by natural and synthetic agents. Environ. Adv. 2022, 8, 100203. [Google Scholar] [CrossRef]
  5. Kamath, R.; Rentz, J.A.; Schnoor, J.L.; Alvarez, P.J.J. Chapter 16. Phytoremediation of hydrocarbon-contaminated soils: Principles and applications. In Studies in Surface Science and Catalysis; Vazquez-Duhalt, R., Quintero-Ramirez, R., Eds.; Elsevier: Amsterdam, The Netherlands, 2004; Volume 151, pp. 447–478. [Google Scholar]
  6. Ruley, J.A.; Tumuhairwe, J.B.; Amoding, A.; Opolot, E.; Oryem-Origa, H.; Basamba, T. Assessment of plants for phytoremediation of hydrocarbon-contaminated soils in the Sudd Wetland of South Sudan. Plant Soil Environ. 2019, 65, 463–469. [Google Scholar] [CrossRef] [Green Version]
  7. Dehnavi, S.M.; Ebrahimipour, G. Comparative remediation rate of biostimulation, bioaugmentation, and phytoremediation in hydrocarbon contaminants. Int. J. Environ. Sci. Technol. 2022, 19, 11561–11586. [Google Scholar] [CrossRef]
  8. Parveen, S.; Ul Haq Bhat, I.; Khanam, Z.; Eh Rak, A.; Yusoff, H.M.; Akhter, M.S. Phytoremediation: In situ alternative for pollutant removal from contaminated natural media: A brief review. Biointerface Res. Appl. Chem. 2022, 12, 4945–4960. [Google Scholar]
  9. RD 39-00147105-006-97 Guidelines for the Remediation of Lands Disturbed and Contaminated during Emergency Repair and Overhaul of Petroleum Trunk Pipelines. Available online: http://meganorm.ru/Data2/1/4294846/4294846786.htm (accessed on 25 November 2022).
  10. US EPA (1999) Phytoremediation Resource Guide. EPA Document # 542-B-99-003, U.S. Environmental Protection Agency Solid Waste and Emergency Response. Available online: https://nepis.epa.gov/Exe/ZyPURL.cgi?Dockey=10002SEE.TXT (accessed on 29 November 2022).
  11. Martí, M.C.; Camejo, D.; Fernández-García, N.; Rellán-Álvarez, R.; Marques, S.; Sevilla, F.; Jiménez, A. Effect of oil refinery sludges on the growth and antioxidant system of alfalfa plants. J. Hazard. Mater. 2009, 171, 879–885. [Google Scholar] [CrossRef] [Green Version]
  12. Rusin, M.; Gospodarek, J.; Barczyk, G.; Nadgórska-Socha, A. Antioxidant responses of Triticum aestivum plants to petroleum-derived substances. Ecotoxicology 2018, 27, 1353–1367. [Google Scholar] [CrossRef] [Green Version]
  13. Lyubun, Y.; Muratova, A.; Dubrovskaya, E.; Sungurtseva, I.; Turkovskaya, O. Combined effects of cadmium and oil sludge on sorghum: Growth, physiology, and contaminant removal. Environ. Sci. Pollut. Res. 2020, 27, 22720–22734. [Google Scholar] [CrossRef]
  14. Criquet, S.; Joner, E.; Leglize, P.; Leyval, C. Anthracene and mycorrhiza affect the activity of oxidoreductases in the roots and the rhizosphere of lucerne (Medicago sativa L.). Biotechnol. Lett. 2000, 22, 1733–1737. [Google Scholar] [CrossRef]
  15. Chroma, L.; Mackova, M.; Kucerova, P.; Wiesche, C.; Burkhard, J.; Macek, T. Enzymes in plant metabolism of PCBs and PAHs. Acta Biotechnol. 2002, 22, 35–41. [Google Scholar] [CrossRef]
  16. Muratova, A.; Pozdnyakova, N.; Golubev, S.; Wittenmayer, L.; Makarov, O.; Merbach, W.; Turkovskaya, O. Oxidoreductase activity of sorghum root exudates in a phenanthrene-contaminated environment. Chemosphere 2009, 74, 1031–1036. [Google Scholar] [CrossRef]
  17. Dubrovskaya, E.; Pozdnyakova, N.; Golubev, S.; Muratova, A.; Grinev, V.; Bondarenkova, A.; Turkovskaya, O. Peroxidases from root exudates of Medicago sativa and Sorghum bicolor: Catalytic properties and involvement in PAH degradation. Chemosphere 2017, 169, 224–232. [Google Scholar] [CrossRef]
  18. Técher, D.; Laval-Gilly, P.; Henry, S.; Bennasroune, A.; Formanek, P.; Martinez-Chois, C.; D’Innocenzo, M.; Muanda, F.; Dicko, A.; Rejšek, K.; et al. Contribution of Miscanthus x giganteus root exudates to the biostimulation of PAH degradation: An in vitro study. Sci. Total Environ. 2011, 409, 4489–4495. [Google Scholar] [CrossRef] [PubMed]
  19. Jin, J.; Wang, M.; Lu, W.; Zhang, L.; Jiang, Q.; Jin, Y.; Lu, K.; Sun, S.; Cao, Q.; Wang, Y.; et al. Effect of plants and their root exudate on bacterial activities during rhizobacterium–plant remediation of phenol from water. Environ. Int. 2019, 127, 114–124. [Google Scholar] [CrossRef] [PubMed]
  20. Gaskin, S.E.; Bentham, R.H. Rhizoremediation of hydrocarbon contaminated soil using Australian native grasses. Sci. Total Environ. 2010, 408, 3683–3688. [Google Scholar] [CrossRef]
  21. Khan, S.; Afzal, M.; Iqbal, S.; Khan, Q.M. Plant–bacteria partnerships for the remediation of hydrocarbon contaminated soils. Chemosphere 2013, 90, 1317–1332. [Google Scholar] [CrossRef] [PubMed]
  22. Hussain, I.; Puschenreiter, M.; Gerhard, S.; Schöftner, P.; Yousaf, S.; Wang, A.; Syed, J.H.; Reichenauer, T.G. Rhizoremediation of petroleum hydrocarbon-contaminated soils: Improvement opportunities and field applications. Environ. Exp. Bot. 2018, 147, 202–219. [Google Scholar] [CrossRef]
  23. Ramenskiy, L.G. Uchet i Opisaniye Rastitel’nosti (na Osnove Proyektivnogo Metoda) (Accounting and Description of Vegetation [Based on the Projective Method]); VASHNIL: Moscow, Russia, 1937; 100p. (In Russian) [Google Scholar]
  24. Panchenko, L.; Muratova, A.; Dubrovskaya, E.; Golubev, S.; Turkovskaya, O. Dynamics of natural revegetation of hydrocarbon-contaminated soil and remediation potential of indige-nous plant species in the steppe zone of the southern Volga Uplands. Environ. Sci. Pollut. Res. 2018, 25, 3260–3274. [Google Scholar] [CrossRef] [PubMed]
  25. Muratova, A.Y.; Dmitrieva, T.V.; Panchenko, L.V.; Turkovskaya, O.V. Phytoremediation of oil-sludge-contaminated soil. Int. J. Phytoremediation 2008, 10, 486–502. [Google Scholar] [CrossRef]
  26. PND F 16.1:2:2.2:2.3:3.64-10. In Environmental Regulation Document at the Federal Level No. 16.1:2:2.2:2.3:3.64-10. Methods of Measurement of the Mass Fraction of Oil in the Samples of Soils, Sediments, Sludges, Sewage Sludge, Waste Production and Consumption by Gravimetric Method; Rostechnadzor: Moscow, Russia, 2010. (In Russian)
  27. Drugov, Y.; Rodin, A. Ekologicheskiye Analizy pri Razlivah nefti i Nefteproduktov. Prakticheskoye Rukovodstvo (Environmental Analyses in Oil and Oil-Product Spills: A Handbook); BINOM: Moscow, Russia, 2007; pp. 167–216. (In Russian) [Google Scholar]
  28. GOST 26489-85. Soils. Determination of Exchangeable Ammonium by CINAO Method. Available online: https://docs.cntd.ru/document/1200023496 (accessed on 1 October 2022).
  29. GOST 26488-85. Soils. Determination of Nitrates by CINAO Method. Available online: https://docs.cntd.ru/document/1200023495 (accessed on 1 October 2022).
  30. Bushnell, L.D.; Haas, H.F. The utilization of certain hydrocarbons by microorganisms. J. Bacteriol. 1941, 5, 653–674. [Google Scholar] [CrossRef] [Green Version]
  31. Cai, B.; Ma, J.; Yan, G.; Dai, X.; Li, M.; Guo, S. Comparison of phytoremediation, bioaugmentation and natural attenuation for remediating saline soil contaminated by heavy crude oil. Biochem. Eng. J. 2016, 112, 170–177. [Google Scholar] [CrossRef]
  32. García-Sánchez, M.; Košnář, Z.; Mercl, F.; Aranda, E.; Tlustoš, P. A comparative study to evaluate natural attenuation, mycoaugmentation, phytoremediation, and microbial-assisted phytoremediation strategies for the bioremediation of an aged PAH-polluted soil. Ecotoxicol. Environ. Saf. 2018, 147, 165–174. [Google Scholar] [CrossRef] [PubMed]
  33. González-Moscoso, M.; Rivera-Cruz, M.C.; Trujillo-Narcía, A. Decontamination of soil containing oil by natural attenuation, phytoremediation and chemical desorption. Int. J. Phytoremediation 2019, 21, 768–776. [Google Scholar] [CrossRef]
  34. Basumatary, B.; Bordoloi, S.; Sarma, H.P. Crude oil-contaminated soil phytoremediation by using Cyperus brevifolius (Rottb.) Hassk. Water Air Soil Pollut. 2012, 223, 3373–3383. [Google Scholar] [CrossRef]
  35. Gift, U.N.; Wegwu, M.O.; Belonwu, C.D. Comparison of the efficacy of remediation by enhanced natural attenuation with phytoremediation in the recovery of crude-oil polluted soils. J. Environ. Earth Sci. 2015, 5, 156–163. [Google Scholar]
  36. Olson, P.E.; Fletcher, J.S. Ecological recovery of vegetation at a former industrial sludge basin and its implications to phytoremediation. Environ. Sci. Pol. Res. 2000, 7, 195–204. [Google Scholar] [CrossRef]
  37. Robson, D.B.; Knight, J.D.; Farrell, R.E.; Germida, J.J. Natural revegetation of hydrocarbon-contaminated soil in semi-arid grassland. Can. J. Bot. 2004, 82, 22–30. [Google Scholar] [CrossRef]
  38. Phillips, L.A.; Greer, C.W.; Farrell, R.E.; Germida, J.J. Field-scale assessment of weathered hydrocarbon degradation by mixed and single plant treatments. Appl. Soil Ecol. 2009, 42, 9–17. [Google Scholar] [CrossRef] [Green Version]
  39. Gurska, J.; Wang, W.; Gerhardt, K.E.; Khalid, A.M.; Isherwood, D.M.; Huang, X.D.; Glick, B.R.; Greenberg, B.M. Three year field test of a plant growth promoting rhizobacteria enhanced phytoremediation system at a land farm for treatment of hydrocarbon waste. Environ. Sci. Technol. 2009, 43, 4472–4479. [Google Scholar] [CrossRef]
  40. Al-Ateeqi, S.; Al-Musawi, L.I.; Sharma, V.K.; Abdullah, M.; Ma, X. Plant communities and potential native phytoremediator species in petroleum hydrocarbon-polluted desert systems. Land Degrad. Dev. 2022, 33, 1745–1757. [Google Scholar] [CrossRef]
  41. Franchi, E.; Cardaci, A.; Pietrini, I.; Fusini, D.; Conte, A.; De Folly D’Auris, A.; Grifoni, M.; Pedron, F.; Barbafieri, M.; Petruzzelli, G.; et al. Nature-based solutions for restoring an agricultural area contaminated by an oil spill. Plants 2022, 11, 2250. [Google Scholar] [CrossRef]
  42. Sivkov, Y.; Nikiforov, A. Study of oil-contaminated soils phytotoxicity during bioremediation activities. J. Ecol. Eng. 2021, 22, 67–72. [Google Scholar] [CrossRef]
  43. Hou, J.; Wang, Q.; Liu, W.; Zhong, D.; Ge, Y.; Christie, P.; Luo, Y. Soil microbial community and association network shift induced by several tall fescue cultivars during the phytoremediation of a petroleum hydrocarbon-contaminated soil. Sci. Total Environ. 2021, 792, 148411. [Google Scholar] [CrossRef] [PubMed]
  44. Dados, A.; Omirou, M.; Demetriou, K.; Papastephanou, C.; Ioannides, I.M. Rapid remediation of soil heavily contaminated with hydrocarbons: A comparison of different approaches. Ann. Microbiol. 2015, 65, 241–251. [Google Scholar] [CrossRef]
  45. Jiang, Z.; Liu, Y.; Yang, J.; Gunina, A. Effects of nitrogen fertilization on the rhizosphere priming. Plant Soil 2021, 462, 489–503. [Google Scholar] [CrossRef]
  46. Hutchinson, S.L.; Banks, M.K.; Schwab, A.P. Phytoremediation of aged petroleum sludge: Effect of inorganic fertilizer. J. Environ. Qual. 2001, 30, 395–403. [Google Scholar] [CrossRef]
  47. Pleshakova, E.; Dubrovskaya, E.; Turkovskaya, O. Stimulation of the activity of oil oxidizing microorganisms in contaminated soil. In New Research on the Environment and Biotechnology; Kuznetsov, A., Zaikov, G., Eds.; Nova Science Publishers, Inc.: New York, NY, USA, 2006; pp. 37–49. [Google Scholar]
  48. Abdel Ghany, T.M.; Al Abboud, M.A.; Negm, M.E.; Shater, A.R.M. Rhizosphere microorganisms as inducers for phytoremediation. Int. J. Bioinform. Res. Appl. 2015, 1, 7–15. [Google Scholar]
Figure 1. Numbers of plant species and culturable microorganisms in the oil-contaminated soil subjected to natural phytoremediation: (a) numbers of plant species; (b) THM number; and (c) HOM number.
Life 13 00177 g001
Figure 2. Natural phytoremediation rates recorded for the five years of treatment.
Life 13 00177 g002
Figure 3. Numbers of culturable microorganisms in the oil-contaminated soil subjected to technical phytoremediation: (a) THM number; (b) HOM number.
Life 13 00177 g003
Figure 4. Technical phytoremediation rates recorded for the five years of treatment.
Life 13 00177 g004
Table 1. Procedures used for technical phytoremediation.
ProcedureQuantityPeriod
Soil millingWM1100BE walk-behind tractor
(Weima China)
Processing depth, 25–30 cm
Before remediation
Fertilization:
Azophoska mineral
fertilizer
(NPK, 22:11:11)
3 kg/100 m2 × 2Before and 1.5 months after sowing
Watering30 L/m2One day before sowing
Sowing: Medicago sativa
Lolium perenne
0.4 kg/100 m2
0.5 kg/100 m2
April–May
Rolling seedlings After sowing
Soil samplingOne mixed sample was made from five to eight local point samples taken from a depth of 5–15 cm at each siteBefore sowing, after 3, 12 months, then annually
Watering20 L/m2 × 2Before sowing, and 3 weeks after seedling appearance
Table 2. Characterization of the oil-contaminated sites.
Site No.CharacterizationArea (m2)Foliage Projective Cover (%)TPHs (g/kg)
S-1Former oil sludge pit (aged oil pollution)12,000 *25–305.3 ± 0.3
S-2Fresh and aged oil spills near oil pipelines280065–7018.8 ± 2.6
S-3Fresh and aged oil spills near oil pipelines500050–554.2 ± 0.2
S-4Fresh and aged oil spills near oil pipelines480060–656.6 ± 0.5
S-5Fresh and aged oil spills near oil pipelines140050–556.8 ± 0.4
S-6Aged subsurface oil pollution near oil pipelines and tanks210025–306.1 ± 0.3
S-7Fresh and aged oil spills near oil pipelines16,20040–4524.5 ± 2.3
S-8Aged subsurface oil pollution near oil pipelines and tanks510035–4012.6 ± 0.7
S-9Aged subsurface oil pollution near oil pipelines180040–4527.4 ± 2.5
S-10Former oil sludge pit (subsurface aged oil pollution)10,0002018.2 ± 1.0
S-11Fresh and aged oil spills near oil pipelines and tanks800<2010.8 ± 0.5
S-12Fresh and aged oil spills near oil pipelines and tanks850<208.4 ± 0.8
S-13Fresh and aged oil spills near oil pipelines and tanks820<2016.6 ± 1.8
S-14Fresh and aged oil spills near oil pipelines and tanks860<209.4 ± 0.5
S-15Fresh and aged oil spills near oil pipelines and tanks920<2015.6 ± 1.4
S-16Fresh and aged oil spills near oil pipelines and tanks800<2014.8 ± 0.8
S-17Former oil sludge pit (aged oil pollution)1200<205.5 ± 0.3
S-18Former oil sludge pit (aged oil pollution)1200<2019.4 ± 0.9
S-19Former oil sludge pit (aged oil pollution)1100<2027.1 ± 1.4
S-20Former oil sludge pit (aged oil pollution)800<2016.3 ± 0.7
* Values are means ± SD (p ≤ 0.05) of at least three samples.
Table 3. Time course of the content of available nitrogen and TPHs in the oil-contaminated soil subjected to natural phytoremediation.
Site No.N-NH4+ (mg/kg)N-NO3 (mg/kg)TPHs (g/kg)
Initial1st Year3rd Year5th YearInitial1st Year3rd Year5th YearInitial1st Year3rd Year5th Year
S-112.1 ± 0.6 *18.2 ± 1.026.1 ± 1.727.9 ± 1.32.4 ± 0.22.3 ± 0.13.5 ± 0.23.5 ± 0.15.3 ± 0.33.8 ± 0.31.0 ± 0.10.2 ± 0.0
S-225.0 ± 0.129.3 ± 1.331.7 ± 1.537.3 ± 1.84.5 ± 1.95.2 ± 0.36.3 ± 0.36.5 ± 0.318.8 ± 2.66.4 ± 0.44.5 ± 0.30.2 ± 0.0
S-328.2 ± 1.530.9 ± 1.432.3 ± 1.436.7 ± 2.06.1 ± 0.35.4 ± 0.25.6 ± 0.26.1 ± 0.44.2 ± 0.21.2 ± 0.00.2 ± 0.00.2 ± 0.0
S-426.1 ± 1.231.3 ± 1.534.3 ± 1.535.9 ± 1.45.9 ± 0.46.2 ± 0.36.1 ± 0.46.1 ± 0.36.6 ± 0.51.2 ± 0.10.4 ± 0.00.4 ± 0.0
S-518.3 ± 1.026.2 ± 1.425.4 ± 1.629.1 ± 1.62.2 ± 0.14.8 ± 0.24.4 ± 0.35.2 ± 0.36.8 ± 0.42.2 ± 0.11.7 ± 0.10.7 ± 0.1
S-618.2 ± 0.926.8 ± 1.526.2 ± 1.231.3 ± 1.53.1 ± 0.15.3 ± 0.35.2 ± 0.35.1 ± 0.36.2 ± 0.34.8 ± 0.32.1 ± 0.10.5 ± 0.1
S-716.4 ± 0.723.8 ± 1.125.1 ± 1.232.2 ± 1.52.5 ± 0.13.6 ± 0.44.8 ± 0.25.5 ± 0.524.5 ± 2.315.3 ± 0.98.7 ± 0.61.6 ± 0.1
S-815.0 ± 0.720.3 ± 0.921.9 ± 1.431.4 ± 1.75.1 ± 0.25.2 ± 0.25.4 ± 0.36.3 ± 0.312.6 ± 0.77.4 ± 0.34.7 ± 0.31.8 ± 0.1
S-914.2 ± 0.8181 ± 1.121.7 ± 1.026.1 ± 1.85.3 ± 0.35.4 ± 0.35.7 ± 0.45.6 ± 0.327.4 ± 2.518.5 ± 1.513.2 ± 0.74.1 ± 0.3
S-101.3 ± 0.211.4 ± 0.524.4 ± 1.630.8 ± 1.42.6 ± 0.14.7 ± 0.25.5 ± 0.26.0 ± 0.518.2 ± 1.017.4 ± 0.911.3 ± 0.67.9 ± 0.6
* Values are means ± SD (p ≤ 0.05) of at least three samples.
Table 4. Time course of the content of available nitrogen and TPHs in the oil-contaminated soil subjected to technical phytoremediation.
Site No.N-NH4+ (mg/kg)N-NO3 (mg/kg)TPHs (g/kg)
Initial3rd Month1st YearInitial3rd Month1st YearInitial1st Year3rd Year5th Year
S-1123.5 ± 1.1 *37.2 ± 1.829.1 ± 1.71.8 ± 0.117.5 ± 0.85.4 ± 0.210.8 ± 0.52.5 ± 0.11.5 ± 0.11.1 ± 0.1
S-1224.1 ± 1.337.5 ± 2.028.5 ± 1.43.4 ± 0.220.2 ± 1.04.3 ± 0.38.4 ± 0.80.9 ± 0.10.8 ± 0.10.7 ± 0.1
S-1319.4 ± 0.938.4 ± 1.828.2 ± 1.42.7 ± 0.118.4 ± 1.15.2 ± 0.216.6 ± 1.82.9 ± 0.22.6 ± 0.11.3 ± 0.1
S-1424.5 ± 1.140.6 ± 2.027.4 ± 1.52.3 ± 0.124.0 ± 1.16.5 ± 0.39.4 ± 0.50.9 ± 0.10.8 ± 0.10.7 ± 0.1
S-1522.1 ± 1.437.1 ± 1.929.0 ± 1.31.6 ± 0.221.0 ± 0.96.1 ± 0.415.6 ± 1.42.9 ± 0.12.4 ± 0.11.0 ± 0.1
S-1620.3 ± 1.239.5 ± 1.626.2 ± 1.21.9 ± 0.225.4 ± 1.25.0 ± 0.214.8 ± 0.82.9 ± 0.22.4 ± 0.11.0 ± 0.1
S-1716.2 ± 0.722.5 ± 1.116.4 ± 1.13.7 ± 0.115.4 ± 0.91.7 ± 0.15.5 ± 0.31.5 ± 0.21.1 ± 0.11.1 ± 0.1
S-1815.5 ± 0.725.2 ± 1.516.3 ± 1.24.2 ± 0.215.5 ± 0.71.8 ± 0.219.4 ± 0.92.9 ± 0.12.2 ± 0.11.2 ± 0.1
S-1921.1 ± 1.535.1 ± 1.620.0 ± 0.91.6 ± 0.111.8 ± 0.62.4 ± 0.227.1 ± 1.44.9 ± 0.23.2 ± 0.21.9 ± 0.2
S-2028.4 ± 1.442.3 ± 2.119.5 ± 1.02.4 ± 0.116.5 ± 0.72.9 ± 0.216.3 ± 0.72.5 ± 0.11.8 ± 0.11.0 ± 0.1
* Values are means ± SD (p ≤ 0.05) of at least three samples.
Disclaimer/Publisher’s Note: The statements, opinions and data contained in all publications are solely those of the individual author(s) and contributor(s) and not of MDPI and/or the editor(s). MDPI and/or the editor(s) disclaim responsibility for any injury to people or property resulting from any ideas, methods, instructions or products referred to in the content.

