Article

Characterization of Bacterial Communities from the Surface and Adjacent Bottom Layers of Water in the Billings Reservoir

by
Marta Angela Marcondes
1,
Andrezza Nascimento
1,
Rodrigo Pessôa
1,
Jefferson Russo Victor
2,
Alberto José da Silva Duarte
2,
Patricia Bianca Clissa
3 and
Sabri Saeed Sanabani
2,4,*
1
Post-Graduation Program in Translational Medicine, Department of Medicine, Federal University of São Paulo, São Paulo 04039-002, Brazil
2
Laboratory of Medical Investigation LIM-56, Division of Clinical Dermatology, Medical School, University of São Paulo, São Paulo 17012-901, Brazil
3
Immunopathology Laboratory, Butantan Institute, São Paulo 05503-900, Brazil
4
Laboratory of Medical Investigation LIM-03, Hospital das Clínicas (HCFMU), School of Medicine, University of São Paulo, São Paulo 17012-901, Brazil
*
Author to whom correspondence should be addressed.
Life 2022, 12(8), 1280; https://doi.org/10.3390/life12081280
Submission received: 21 June 2022 / Revised: 4 August 2022 / Accepted: 16 August 2022 / Published: 22 August 2022
(This article belongs to the Section Diversity and Ecology)

Abstract

:
Here, we describe the bacterial diversity and physicochemical properties in freshwater samples from the surface and bottom layers of the Billings Reservoir, the largest open-air storage ecosystem in the São Paulo (Brazil) metropolitan area. Forty-four samples (22 from the surface and 22 from the bottom layers) were characterized based on 16S rRNA gene analysis using Illumina MiSeq. Taxonomical composition revealed an abundance of the Cyanobacteria phylum, followed by Proteobacteria, which were grouped into 1903 and 2689 different genera in the surface and the deep-water layers, respectively. Chroobacteria, Actinobacteria, Betaproteobacteria, and Alphaproteobacteria were the most dominant classes. The Shannon diversity index was in the range of 2.3–5.39 and 4.04–6.86 in the surface and bottom layers, respectively. Flavobacterium was the most predominant pathogenic genus. Temperature and phosphorus concentrations were among the most influential factors in shaping the microbial communities of both layers. Predictive functional analysis suggests that the reservoir is enriched in motility genes involved in flagellar assembly. The overall results provide new information on the diversity composition, ecological function, and health risks of the bacterial community detected in the Billings freshwater reservoir. The broad bacterial diversity indicates that the bacterioplankton communities in the reservoir were involved in multiple essential environmental processes.

1. Introduction

Access to safe, clean, and affordable water is one of the most basic humanitarian goals and is a major global challenge for the 21st century [1,2]. Both pollution from the outside and pollution from inside the reservoir worsen the water quality [3]. Exogenous contamination comes from sources such as industrial waste; sewage runoff; solid waste; meteoric water; and surface runoff from cities, farms, and forests [4,5,6]. Endogenous pollution comes from sediments, phytoplankton, aquatic plants, and aquaculture. Organic matter and biological and chemical oxygen demand (BOD and COD) in reservoirs can be either allochthonous or autochthonous. While the autochthonous organic matter is produced by phytoplankton and hydrophytes, allochthonous organic matter is introduced into aquatic systems by rainfall runoff [7]. BOD and COD levels indicate reservoir contamination, and rising nutrient levels cause reservoir BOD and COD levels to rise. Reservoirs are critical artificial aquatic bodies for many drinking water supply systems because they can maintain an equilibrium of storing or releasing water and play a central role in biogeochemical cycling, energy flows, and the recycling of nutrients. The functioning of these cycles is mainly maintained by the inhabiting microorganisms. Despite their potential importance, the structure and functioning of these ecosystems’ microbial communities have received less attention than other freshwater bodies, such as natural lakes and rivers [8].
Several studies have analyzed the structure and ecology of bacterial communities and have revealed the unexpected diversity of functional microbes in freshwater ecosystems [9,10,11,12,13,14,15,16]. For instance, a recent study by Shen et al. [17] has revealed the relationships between trophic status and planktonic microbial community structure and metabolic potential in freshwater lakes on the Yun-Gui Plateau, China. Wu K. et al. [18] showed that water depth was the most critical factor affecting the relative abundance of 11 dominant bacterial phyla, including Proteobacteria as the most dominant phylum in this lake, followed by Bacteroidetes, Chloroflexi, and Nitrospirae in the sediments of Lake Lugu in Southwest China. An earlier study by De Wever et al. [19] undertook a denaturing gradient gel electrophoresis analysis of PCR-amplified 16S RNA fragments approach to reveal the presence of pronounced vertical and latitudinal gradients in the bacterial community composition in Lake Tanganyika in East Africa. Actinobacteria and Gammaproteobacteria were found in the epilimnion, whereas Nitrospirae, green nonsulfur bacteria, Gammaproteobacteria, Actinobacteria, Deltaproteobacteria, and Firmicutes were found in the hypolimnion. The genetic diversity and activity of planktonic bacteria in freshwater systems are strongly shaped by the surrounding environmental conditions. Several studies have demonstrated that bacterial community structures depend on physical conditions and the availability of resources [20,21]. Moreover, it has been demonstrated that the extensive partitioning of water masses in such ecosystems may lead to progressively increased differences in both bacterial diversity [22] and water chemistry [23].
The Billings Reservoir in the Brazilian state of São Paulo is the largest freshwater storage aquatic body in the São Paulo Metropolitan Region, covering 127 km2. It has a total volume of 1228.7 × 106 m3 and a maximum depth of 18 m [24,25]. The reservoir is used for a variety of purposes, including hydropower generation, water supply for 4.5 million people and industries, irrigation, fisheries, and flood control. The basin has a 20-km-long narrow central body that is connected and fed by eight branches, namely the Rio Grande, Rio Pequeno, Capivari, Pedra Branca, Taquacetuba, Bororé, Cocaia, and Alvarenga rivers [26,27,28]. Since the 1940s, the reservoir properties have changed significantly. At that time, part of the polluted water from the Tiete River (São Paulo city) was allowed to flow into the reservoir, believing that it would raise the water level to generate electric power [29]. This process, along with uncontrolled urban growth, significantly contributed to considerable anthropogenic eutrophication and an algal bloom in the reservoir [30].
There are very few studies on the bacterial community structures and compositions of the surface water in Brazil [31,32]. Thus, the goals of this study were to (i) explore the bacterial communities in surface and bottom layer water along the Billings Reservoir using 16S rRNA gene-based Illumina MiSeq sequencing, (ii) evaluate the presence of potential pathogens in these water samples, and (iii) explore the predicted functional biomarkers of the obtained bacterial communities in the basin to determine their role in the ecosystem.

2. Material and Methods

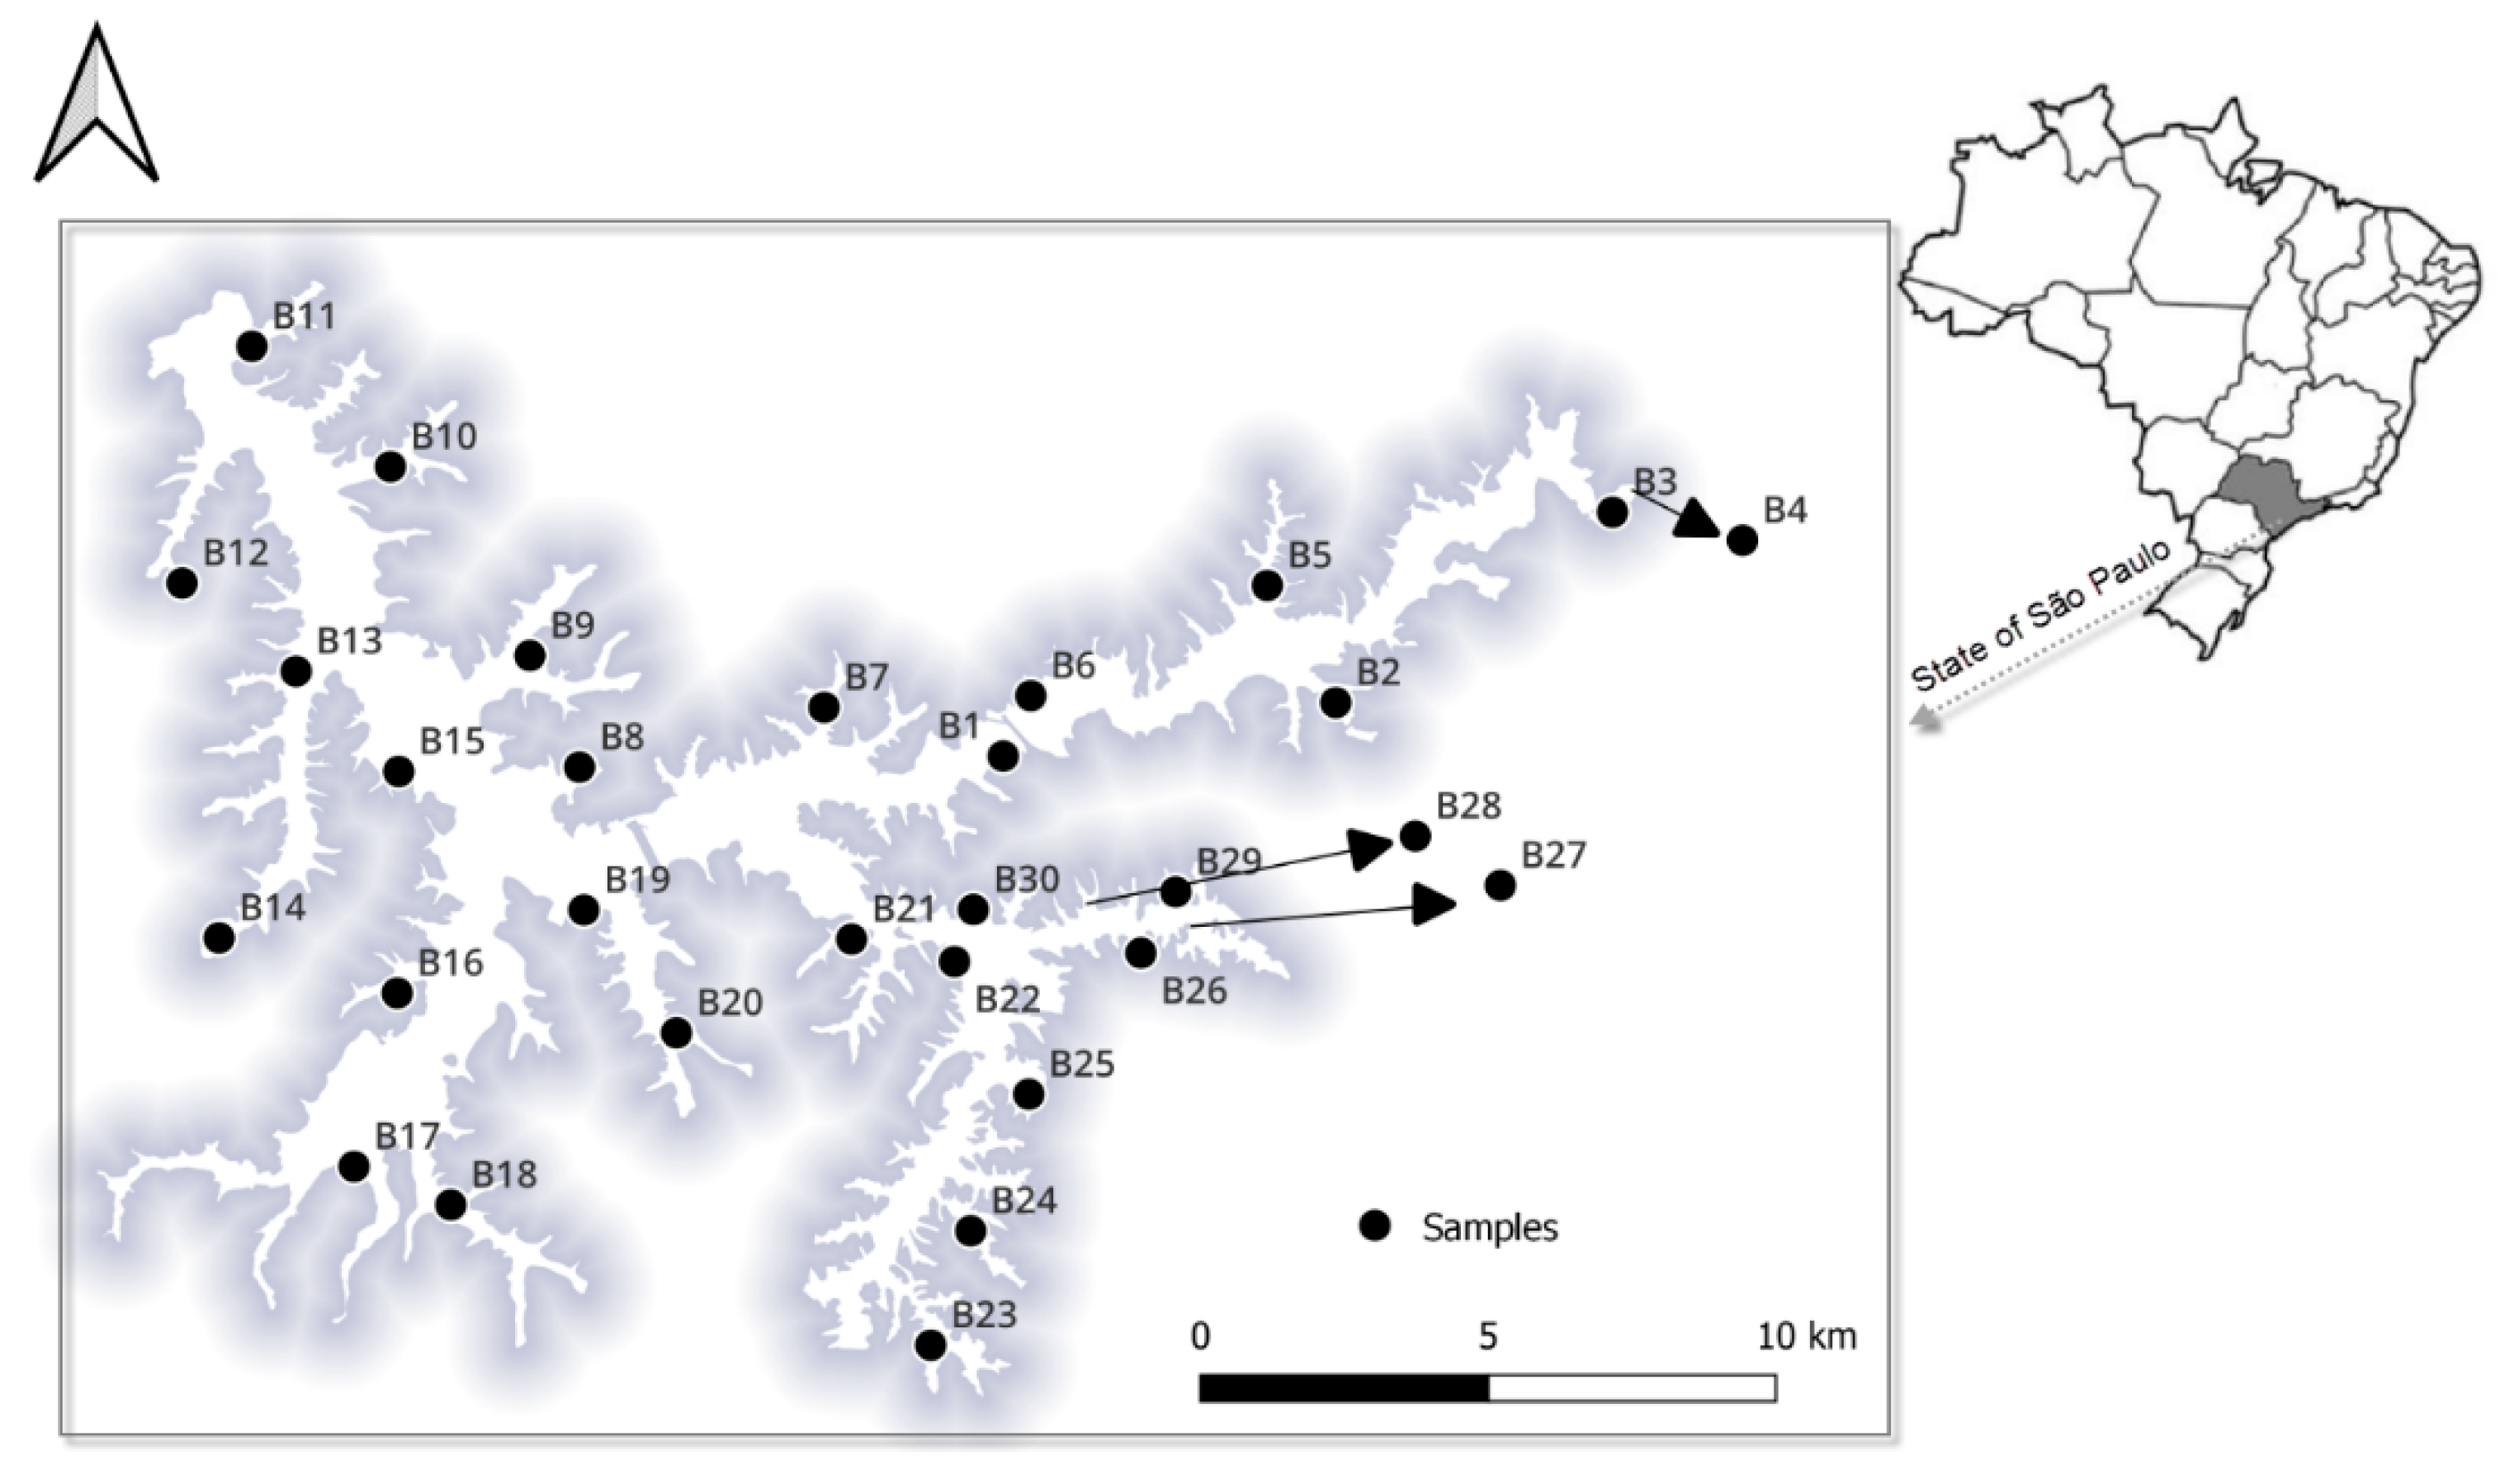
2.1. Study Sites and Sample Collection

The study area covered the entire 127 km2 of the Billings Reservoir, which is located west of the city of Sao Paulo at 23°47′ S, 46°40′ W, at an altitude of 746 m a.s.l. Surface and bottom layer water samples (250 mL each) were collected in July 2019 from 30 locations (approximately 17 km apart; Figure 1) in triplicate using a Van Dorn sampler as previously described [5]. Surface samples were collected from the side of a boat just below the water surface (10 cm) and the bottom water was collected at approximately 0.1 m above the sediment to avoid collecting soil material. Depending on the locations of the collected samples, the water depth of the study area from the reservoir ranged from 1.16 m to 13.6 m. A total of 180 samples were collected and transported to the laboratory on ice the same day they were collected. For the 16S rRNA gene analysis, duplicate samples from each point were combined in 500 mL sterile bottles and thoroughly mixed. Then, a subsample of 40 mL was transferred into a sterile 50-mL tube (BD Falcon, Schaffhausen, Switzerland) and centrifuged for 10 min at 5000× g at 4 °C, and the supernatant was discarded, leaving approximately 600 µL of residual liquid. The pellets were frozen at −80 °C until DNA extraction. Water temperature (Temp), pH, dissolved oxygen (DO), and pH were measured on site from each sample using a handheld multiparameter water quality sonde (YSI Inc., Yellow Springs, OH, USA/Xylem Inc., Washington, DC, USA). Other variables, including turbidity, nitrate (NO3), sulfate (SO42−), phosphorus (P), and ammonia (NH3), were determined from another subsample (250 mL) according to the Brazilian standard issued by the Environment National Council (CONAMA resolution 357/2005). Figure 1 provides the data of the sample sites.

2.2. DNA Isolation and Library Preparation

Total genomic DNA was extracted from 200 µL resuspended pellets using the PowerSoil DNA kit (MO BIO Laboratories, Carlsbad, CA, USA), according to the manufacturer’s instructions. To minimize potential bias during DNA extraction, each sample was extracted in duplicate and then pooled to quantify their DNA yield with a Qubit fluorometer (Invitrogen, Waltham, MA, USA). Sterile reagent grade type I water was used as a negative control for DNA extraction. The extracted DNA from each sample and the negative control was subjected to PCR amplification of the V3-V4 variable region of the 16S rRNA gene using the previously published primers Bakt_341F/Bakt_805R [33] and conditions previously described by our group [34,35]. A negative control containing all reagents except the template DNA was included with each set of reaction mixtures. Library preparation and massively parallel sequencing (MPS) were performed according to the manufacturer’s protocol for paired-end sequencing using MiSeq Reagent Kit v3, as previously reported [5,34,35].

2.3. Detection of Toxin-Producing Cyanobacterial Genes

Three regions of the microcystin synthetase (mcy) gene cluster were selected to search for potential microcystin (MC) producers in the Billings samples. Representative samples (n = 15) with cyanobacteria of >40% of their bacterial communities were selected for the investigation. A different set of specific published primers designed to detect mcyA (mcyA-Cd_1F; 5′-AAA ATT AAA AGC CGT ATC AAA-′3 and mcyA-Cd_1R; 5′-AAA AGT GTT TTA TTA GCG GCT CAT-′3) [36], mcyD (mcyDF; 5′-GAT CCG ATT GAA TTA GAA AG-′3 and mcyDR; 5′-GTA TTC CCC AAG ATT GCC-′3), and the mcyE gene (mcyE-F2; 5′-GAA ATT TGT GTA GAA GGT GC-′3 and mcyE-R4; 5′-AAT TCT AAA GCC CAA AGA CG-′3) [37] were used. Amplification of these fragments was conducted using a 50–100 ng DNA template, 2 mM MgCl2, 0.1 mM dNTPs, 0.5 μM of each primer, and 2.5 U high-fidelity Taq platinum DNA polymerase (Invitrogen, Carlsbad, CA, USA) in a MgSO4 reaction buffer. After an initial denaturation of 5 min at 94 °C, 35 cycles of 30 s at 94 °C, 30 s at 55 °C, 60 s at 72 °C, and a final extension at 72 °C for 5 min were performed. Each PCR included a known cyanobacterial DNA positive control and an interspersed no DNA template negative control. The amplified product was electrophoresed through 1% (wt/vol) agarose gels containing 0.5× Tris Borate EDTA, followed by ethidium bromide staining.

2.4. Bioinformatics and Statistical Analysis

Base-calling and data quality were initially assessed on an MiSeq instrument using RTA v1.18.54 and MiSeq Reporter v2.6.2.3 software (Illumina Inc., San Diego, CA, USA). The sequences were analyzed by a pipeline of the 16S Microbiome Taxonomic Profiling (MTP) of the EzBioCloud (https://www.ezbiocloud.net/ (accessed on 19 March 2020)) application update 2019.04.09. Briefly, the processing of raw reads started with quality checking and filtering of low quality (<Q25) reads by Trimmomatic version 0.32 [38]. After QC pass, paired-end sequence data were merged together using the fastq_mergepairs command of VSEARCH version 2.13.4 [39] with default parameters. Primers were then trimmed with the alignment algorithm of Myers and Miller [40] at a similarity cut off of 0.8. Nonspecific amplicons that do not encode 16S rRNA were detected by Nhmmer [41] in the HMMER software package version 3.2.1 with hmm profiles. Unique reads were extracted, and redundant reads were clustered with the unique reads by the derep_fulllength command of VSEARCH [39]. The EzBioCloud 16S rRNA database [42] was used for taxonomic assignment using the usearch_global command of VSEARCH [39], followed by more precise pairwise alignment [40]. Chimeric reads were filtered on reads with <97% similarity by reference-based chimeric detection using the UCHIME algorithm [43] and the nonchimeric 16S rRNA database from EzBioCloud. Following chimeric filtering, reads that could not be identified to the species level (with <97% similarity) in the EzBioCloud database were compiled, and the cluster_fast command [39] was used to perform de novo clustering to generate additional OTUs. Finally, OTUs with single reads (singletons) were omitted from further analysis. All analyses of molecular data were performed on both nonrarefied and rarefied data to 15,766 sequences (the size of the smallest library). Our initial analysis revealed that the most predominant bacterioplankton taxa and their abundances in the rarefied data were very similar to those in the nonrarefied data. To avoid discarding data, we decided to run our analysis on nonrarefied data. The ACE [44], Chao1 [45], and jackknife [46] α-diversity indices were used to calculate the bacterial richness, and the Shannon [47], Simpson function [47], and NPShannon [48] indices were used to estimate the bacterial evenness in each group using the Wilcoxon rank-sum test. β-diversity was calculated using the Bray–Curtis dissimilarity distance [49] to reveal differences between surface and bottom layer bacteriomes based on their OTU data. The predicted profiles were categorized into clusters of Kyoto Encyclopedia of Genes and Genomes (KEGG) orthology and pathways. To determine whether the reservoir bacterial compositions are affected by depth status, we performed a principal coordinate analysis (PCoA) at the genus level using the Bray–Curtis dissimilarity distance. A pairwise permutational multivariate analysis of variance (PERMANOVA) test was computed to determine whether there were differences in the bacterial communities between the two layers. The enrichment in the assigned taxonomic and functional profiles of the two groups was defined by linear discriminant analysis (LDA) of the effect size (LEfSe) algorithm. All of the above analyses were carried out in ChunLab’s bioinformatics cloud platform, EzBioCloud 16S-based MTP. Statistically significant differences in physicochemical characteristics between both layers were determined by using Student’s t tests and visualized in GraphPad Prism software V8. The correlations between bacterial community diversity (richness, evenness, and OTUs) and water properties were assessed using bootstrap-based confidence limits (100 iterations) and the Pearson correlation coefficient in a principal component analysis (PCA) implemented in the Past 4.07B package [50]. Uncorrected and corrected p values of≤ 0.05 were used for all statistical analyses.
For the detection of bacterial pathogens, we considered any bacteria potentially pathogenic if at least one species with a minimum abundance of 10 strains of any genus was categorized as biosafety level 2 or 3 by the American Biological Safety Association (https://my.absa.org (accessed on 7 May 2020)). The analyses were performed based on uncultivated microorganisms.

3. Results

3.1. Physicochemical Characteristics of Water Samples

The physicochemical properties of water samples collected from the surface and bottom layers of the Billings Reservoir at 30 different locations are demonstrated in Table 1 and Table 2. The samples were collected in July 2019 when the temperature was above 20 °C and the season was mildly dry. The temperature from both layers ranged from 18.8 °C to 22.1 °C, and DO ranged from 3.5 to 9.5 mg/L. The higher DO levels at some sampling locations are most likely due to wind and aeration. Both temperature and DO parameters were significantly higher (p < 0.05) in surface water than in the bottom layers (average temperature: 21.1 °C vs. 20.7 °C, averaged DO: 9.5 mg/L vs. 8.4 mg/L), whereas phosphorus concentrations showed the opposite pattern. The concentrations of ammonia and nitrate along the reservoir showed no obvious difference between the surface and bottom layers. PC1 explained a large proportion of the total variance (29.6%), and the proportion increased to 46.3% when PC2 was added (Figure 2). The variables contributing most to the PC1 were CHAO (r  =  0.50) and NO3 (r  =  0.41), while those contributing most to the PC2 were DO (r  =  −0.6) and PH (r  =  −0.52). The bacterial diversity and OTU relative abundance in the Billings Reservoir were positively correlated with the NO3− concentration.

3.2. Bacterial Community Structure

Of the 30 locations, 22 paired water samples from the surface and bottom layers were successfully amplified, sequenced, and submitted for 16S rRNA analysis. Up to 100,000 MPS reads from each sample were uploaded, quality controlled, and profiled by the EzBioCloud tool. The trimming-based quality control removed 30,778 and 24,323 low quality amplicons from the surface and bottom layer samples, respectively. The taxonomic approach detected and removed 79,629 and 101,093 nontarget amplicons in the surface and bottom layer samples, respectively. A total of 392,135 and 51,426 chimeric amplicons were identified and removed from the surface and bottom layer samples, respectively. The overall quality assessment and trimming steps resulted in 1,468,033 (Min: 15,766 in B7S; Max: 87,913 in B21S) and 1,861,126 (Min: 35,189 in B22F; Max: 96,434 in B12F) valid reads in surface and bottom layers water, respectively. The distribution of sequence lengths produced agreed with the amplicon length (average 427 bp) of the 16S rRNA. The Good’s coverage estimator of the OTUs in the surface and bottom layer samples ranged from 99.4 to 99.9% and 99 to 99.8%, respectively (Supplementary Tables S1 and S2). Rarefaction curves reached stable values, indicating that the diversity of bacterial populations in both groups was sufficiently covered by the generated sequences (data not shown). The number of OTUs per sample ranged from 1063 to 5919 and from 305 to 2150 in the surface and bottom layer samples, respectively. The α diversity of bacteria in the surface and bottom layers of the reservoir was compared by both richness (i.e., the observed OTUs, ACE, Chao1, and jackknife index) and evenness indices (i.e., the NPShannon, Shannon, Simpson, and phylogenetic diversity index). The results showed that, with the exception of the phylogenetic diversity index, no α indices differed significantly between the bacterial communities from both layers. The phylogenetic diversity index was significantly higher in the bottom layers than in the surface layers (Wilcoxon rank-sum test; p < 0.005) (Figure 3). The principal coordinate analysis of the β-diversity d results revealed no significant (Wilcoxon rank-sum test; p = 0.131) similarities between the bacterial communities from the reservoir’s surface and bottom layers.

3.3. Identification of the Billings Bacteriome in Surface and Bottom Layer Samples

Seven phyla (Cyanobacteria, Proteobacteria, Actinobacteria, Bacteroidetes, Verrucomicrobia, Planctomycetes, and Chlorobi) were found to be abundant in samples from both layers. The relative abundance of taxa fluctuated among surface and bottom layer samples at the phylum level, as shown in Supplementary Figures S1 and S2. Cyanobacteria predominated the bacteriome of the water in the Billings Reservoir, but the individual composition datasets showed a significant amount of variation. The proportion of cyanobacteria ranged from 1.4% (B04S) to 71.1% (B09S) in the surface layer, and from 0.4% (B04F) to 44.6% (B09S) in the bottom layer. The proportion of the phylum Proteobacteria ranged from 10.2% (B09S) to 47% (B04S) in the surface layers and from 18.9% (B09S) to 56% (B04S) in the bottom layers. Proteobacteria and Bacteroidetes were less abundant in the surface layers compared to the bottom layer of the samples (Figure 4). The most common classes in all samples were Chroobacteria, Actinobacteria, Betaproteobacteria, Alphaproteobacteria, Sphingobacteria, and Acidimicrobiia (Supplementary Tables S3 and S4). At the order level, 21.9% and 16.9% of OTUs were assigned to Oscillatoriales in the surface and bottom layers, respectively. The order Planktophila accounted for >12% of all detected OTUs from Billings cyanobacterial sources, followed by the order Burkholderiales, which accounted for >24%. At the genus level, 20.2% and 14.5% of OTUs were assigned to the Planktothrix genus within the Microcoleaceae family in the surface and bottom layers, respectively, and >8% OTUs were assigned to the Nanopelagicus genus within the family Nanopelagicaceae in both layers (Figure 5). Among the Cyanobacteria, Chroobacteria were the most abundant group in the reservoir, with a median relative abundance of 18.96% and 18.08% of all OTUs in the surface and bottom layer samples, respectively. Differentially abundant taxa between the two water samples were identified using the LEfSe algorithm with a minimum LDA score of 2.0 [51]. This analysis revealed 126 taxa, which included 11 classes, 24 families, 29 genera, 24 orders, 6 phyla, and 32 species. Of these, two families, four genera, one order, and nine species were significantly abundant and discriminative between the groups (FDR-adjusted p value < 0.02. Supplementary Table S5). The relative abundance of bacteria from the genera Stenotrophomonas, Achromobacter, Comamonas, Pseudomonas, Acinetobacter, and Schlesneria was significantly higher in the bottom layers than in the surface samples (FDR-adjusted p-value < 0.05).

3.4. Prediction of Functional Biomarkers

An LEfSe analysis was conducted to predict the most pertinent functional pathways that shape the Billings bacteriome between both layers. The software package PICRUSt2, implemented in the EzBiocloud online tool, was used to infer the content of bacterial genes from the 16S rRNA data and aggregate the relative abundance of functional genes into metabolic pathways. From all OTUs detected in matched samples, 83 KEGG orthology (KO) terms were predicted. Of these, four differentially abundant (FDR-adjusted p < 0.05) KO terms between surface and bottom layer water were identified (Supplementary Table S6), and all had LDA effect sizes <3. Most of the differentially abundant predicted KO terms, including protein metabolism, signaling and cellular processes, and cell motility were most abundant in bottom layer samples. The pathway of the flagellar assembly was also enriched in the bottom water layer group, based on the cutoff of uncorrected p < 0.02 instead of FDR corrected <0.89, implying that the growth environment for the bacterial communities in the bottom layer water was much higher than that of the surface layer water (LDA = 2.24). PICRUSt module analysis demonstrated that the microbiota in the bottom layers exhibits increased biosynthesis of tetrahydrofolate (M00841) and C21-steroid hormone (M00109), while the surface microbiota showed an increased use of the Mce transport system (M00670).

3.5. Search for Predefined Bacterial Groups, Pathogens, and Cyanotoxin Genes

Screening for pre-defined bacterial groups in the surface and bottom layers of the Billings Reservoir revealed important taxa associated with the human gut, including the phylum Proteobacteria (surface; median relative abundance value, 24.7%, bottom layer; median relative abundance value, 27.7%). The search for bacterial pathogens in both layers identified several bacterial genera known to be human, animal, and/or plant pathogens, including Flavobacterium, Legionella, Staphylococcus, Pseudomonas, Aeromonas, Acidovorax, and Acinetobacter. Flavobacterium (surface; median relative abundance value, 0.65%, bottom layer; median relative abundance value, 0.94%) and Legionella (surface; median relative abundance value, 0.21%, bottom layers; median relative abundance value, 0.19%) were the predominant genera.
The DNA of the three selected genes involved in the biosynthesis of mcy (mcyA, mcyE, and mcyD) was successfully amplified in all analyzed samples, confirming the genetic potential of the strains in the reservoir to produce microcystin (data not shown).

4. Discussion

4.1. Distribution and Diversities of Bacterial Communities along the Billings Reservoir

The bacterial diversity in surface water from the Billings Reservoir has recently been studied, with an emphasis on bacterial structure; nonetheless, detailed local bacterial heterogeneity remains unknown. In this study, we investigated the distribution of bacterial communities in the surface and bottom layers of the Billings Reservoir, as well as the environmental conditions that influence their composition. Our results demonstrated that the overall α bacterial diversity represented by the Shannon index was relatively higher in the Billings Reservoir than in other studied freshwater systems: Itupararanga Reservoir, State of São Paulo, Brazil [52], in Pavin Lake [53], and Mayinghai, Pipahai, and Gonghai Lakes in China [54]. Perhaps the greatest value of biodiversity is attributed to intensive anthropogenic disturbance in the reservoir, which may have resulted in increased nutrient discharges, resulting in greater nitrogen and phosphorus concentrations, as indicated in this study. Dias et al. [55] demonstrated that the influence of surrounding human activities, as measured by the human footprint index, had a significant impact on the functional diversity and trait composition of fish assemblages in the Billings Reservoir. It is possible that other variables not included in our study could have contributed to the variability of the bacterial community in the Billings Reservoir.
The observed bacterial community structure and diversity indices in this study were comparable to those in other reservoirs [56]. The taxonomical composition revealed that the Cyanobacteria phylum was the most abundant in the community, followed by Proteobacteria and Actinobacteria. These results are consistent with other Brazilian studies that describe bacterial communities in the Amazon basin [57,58,59] and Tocantins River [60], but are somewhat different from those previously described for reservoirs in China. For instance, Qu J et al. [56] used the 16S rDNA Illumina approach to show that Firmicutes, Proteobacteria, Cyanobacteria, and Bacteroidetes were the dominant bacterial phyla in the Miyun Reservoir, which is considered the largest man-made reservoir in North China. These differences in dominating phyla may be due to a variety of environmental factors, such as air, soil, and water pollution, rainfall-induced nutrient fluctuations, and changes in local conditions. The difference may also be attributed to the use of distinct DNA extraction methods and/or primer selection [61] or different 16S rDNA gene bioinformatic pipelines. Although the bacterial richness indices varied little between the surface and bottom layer samples in this study, some specific bacterial groups showed a clear difference. For instance, members of the β-Proteobacteria and γ-proteobacteria, Acidobacteria, Bacteroidetes, and Sphingobacteriales were significantly more abundant in the bottom layer than in the surface water. Because the water flow within certain layers could contribute significantly to the displacement of bacterial populations, it is reasonable to assume that the latter could constitute a contribution to the observed bacterial community differences between the layers. It is also conceivable that the phosphorus availability in the bottom layers compared to the surface water could positively influence the growth rates of these bacterial groups [62].
In addition to the seven dominant phyla in the Billings Reservoir, there were approximately 3.5% and 4.4% of unclassified taxa in the surface and bottom layers water, respectively, indicating that as-yet-unidentified bacterial populations with unknown metabolic functions are an important part of the reservoir bacteriome. These findings warrant further metagenomics analysis.

4.2. Dominant Taxonomic Groups in the Bacterioplankton Community of the Reservoir

Members of Cyanobacteria were detected as the most dominant genus, and all Cyanobacteria blooms tested here were toxic. These results lend further support to previous studies that found cyanobacterial communities in Brazilian semiarid reservoirs [32,63,64,65,66,67]. The presence of these bacteria in high relative abundance in the reservoir can be linked to uploading nutrients such as ammonia and an increase in water temperature (20.7 °C) at the time of sampling. The OTUs of these bacteria have been shown to outcompete other planktonic microbes for nutrients in eutrophic systems [68]. A previous study on the Neuse River, North Carolina, conducted by Paerl, recommended that a reduction of 30–40% of NO3 had the optimum power of minimizing M. aeruginosa as a dominant phytoplankter [69]. Concerning temperature, there is a consensus among researchers that water temperatures below 20 °C are generally considered unfavorable for the development of common water bloom-forming genera such as Dolichospermum and Microcystis. In contrast to this, our findings showed widespread Microcystis and Planktothrix in the reservoir. The presence of more Cyanobacteria in freshwater systems has a variety of impacts, including oxygen depletion, fish mortality, and toxicity, which offer a variety of health risks [70]. Because the Cyanobacteria detected in this study are capable of producing toxins, their presence in the reservoir poses a huge threat to animal and human health.
In this study, Proteobacteria constituted a sizable fraction of the bacterial community in the reservoir, which is consistent with previous reports [71,72]. Despite the dominance of Proteobacteria in both layers, a significant difference in the composition of these members was observed, as detailed in the taxonomic analysis. Betaproteobacteria were the most frequently detected Proteobacteria group in this work, which agrees with other studies [73,74]. Microorganisms belonging to the Betaproteobacteria class have been associated with anthropogenic activities [75]. The alpha and Gammaproteobacteria found in both layers probably indicate an increase in organic and inorganic inputs, as well as phytoplankton production [62,73].
The Actinobacteria phylum was the reservoir’s third most abundant OTU phylum. Members of this phylum are among the most abundant groups in freshwater habitats [73,76]. The relative abundance of these microbes is inversely correlated to that of Cyanobacteria, which cause prolonged and irretrievable ecological disturbances to freshwater ecosystems and serve as sentinels of impending ecological damage [77,78]. The OTUs of Actinobacteria were less abundant than those of Proteobacteria, which comprised 23.7% and 28.5% of the total bacterial relative abundance in the surface and bottom layer water of the Billings Reservoir, respectively. Actinobacteria, which are well-recognized soil bacteria [79], are frequently detected in oligotrophic freshwater habitats [80] and are often associated with oligotrophic ecosystems [81]. They have long been known to produce pigments that protect them from UV radiation, which may easily penetrate deep into a freshwater habitat [73].

4.3. Bacterioplankton Community Diversity between the Surface and Bottom Layers

The alpha diversity analysis conducted between the surface and bottom layers revealed high phylogenetic diversity indices of the bacteriome inhabiting the bottom layers. This result may indicate that bacterial communities in the bottom layers have experienced high diversification rates or the successful immigration of multiple lineages. One factor that may promote higher bacterial diversification in the bottom layers is that this habitat is possibly less extreme than that of the surface layers and permits easier radiation [82]. An examination of Billings water did not reveal significant differences in bacterial community β-diversity between the two layers, suggesting that a core bacteriome exists between both layers of the reservoir.

4.4. Potential Functions and Pathways of Bacterial Communities in the Reservoir

Application of the LEfSe method demonstrated the presence of Stenotrophomonas species as the most significant specific biomarkers in the bottom layers. These species play an important ecological role in the nitrogen and sulfur cycles, and several Stenotrophomonas species can engage in beneficial interactions with plants, promoting growth and protecting plants from attack [83]. Because the reservoir contains a large number of Cyanobacteria, the death of many of these bacteria could result in the release of a high contents of sulfur-containing amino acids from their cells [84], resulting in sulfur-rich water and thus explaining the detection of Stenotrophomonas species. However, these conclusions must be interpreted with caution given the serious limitations of deducing the biofunctions of the reservoir bacteria from 16S rRNA gene sequencing and the potential risk of bias.
In addition to taxonomic compositions, we identified a pathway containing genes encoding for flagellar assembly that were abundant in the Billings 16S metagenome. The occurrence of flagellar assembly genes within the bottom layers indicates that the reservoir contains bacterial communities that utilize flagella for locomotion. It is possible that the adhesion process of these bacteria was influenced by environmental factors such as pH and higher levels of metals introduced into the reservoir because of the rapid expansion of industry and intense domestic activities.

4.5. Occurrence of Pathogenic Bacteria

Many developing countries are suffering widespread contamination of their freshwater supplies by bacterial pathogens, which have been linked to epidemics of numerous waterborne diseases [85]. In the current study, we found that pathogenic bacteria were ubiquitous across all the sampled waters in the Billings Reservoir. Among these pathogens, the Flavobacterium and Legionella genera were the most prevalent in both layers. Although most Flavobacteria are harmless, some are opportunistic or true pathogens that cause diseases in animals, plants, and humans [86,87,88]. The majority of Legionella species are considered pathogenic and have been reported as one of the leading bacterial etiological pathogens of waterborne outbreaks in the United States between 2007 and 2009 [89].

5. Limitations and Conclusions

The main limitation of this study is that we restricted the analysis to samples at a single point in time because water samples from the bottom layers were collected only once. While the spatiotemporal data from surface water are still incomplete, the analysis of the data that is now available is well underway. In addition, we used bacterial DNA genomics for this investigation, which would have revealed the presence of bacterial populations regardless of whether they were dead or alive, culturable cells, or nonculturable cells. Another limitation, inherent in 16S rRNA diversity surveillance by the Illumina MiSeq platform, is the fact that the taxonomic and ecological resolution of the 16S rRNA gene V3-V4 region is insufficient for accurately identifying pathogenic bacteria and strains with flagella genes to species levels, as revealed in functional analysis. These results should be amenable to robust metagenomic data, RNA sequencing, and cultivable fractions to expand our understanding of the bacterial strains associated with the reservoir, their genes, and metabolic pathways. That being said, our findings do reveal the extent of bacterial diversity in the reservoir, the health hazards for household drinking water, and the effects of the direct use of water by residents of the reservoir communities.
To summarize, the toxin-producing Cyanobacteria phylum was found to be the most abundant in the community, followed by Proteobacteria and Actinobacteria. Ammonia and high water temperature are two potential contributors to the abundance of Cyanobacteria in the reservoir. According to functional prediction analyses, genes associated with cell motility, such as flagellar assembly, were abundant in the Billings bacteriome.
In conclusion, this study provides important information about the numerous bacteria inhabiting the Billings Reservoir and the combination of environmental factors that shape their structure. These results may help pave the way for future studies devoted to controlling and improving the water quality in the Billings Reservoir, which is facing rapid urban development and urbanization.

Supplementary Materials

The following supporting information can be downloaded at: https://www.mdpi.com/article/10.3390/life12081280/s1, Figure S1: The relative abundance of dominant taxa at the phylum level in surface water samples. Figure S2: The relative abundance of dominant taxa at the phylum level in bottom-layer samples. Table S1: Valid reads sequenced for each matched sample from the surface layer and alpha diversity indices at the 97% OTU level of 16S rRNA gene fragments. Table S2: Valid reads sequenced for each matched sample from the bottom layer and alpha diversity indices at the 97% OTU level of 16S rRNA gene fragments. Table S3: Count of the individual surface layer bacterial microbiota of Billings reservoir on a phylum, class, order, family, and genus levels. Table S4: Count of the individual bottom layer bacterial microbiota of Billings reservoir on a phylum, class, order, family, and genus levels. Table S5: Differentially abundant taxa between surface and bottom layer water samples identified using LEfSe analysis (minimum LDA score: 2.0). Table S6: Functional biomarkers computed by the LEfSe analysis.

Author Contributions

M.A.M.: data curation, visualization, investigation, methodology; A.N.: investigation, data curation, visualization; R.P.: formal analysis, visualization; J.R.V.: writing—review and editing, visualization; A.J.d.S.D.: writing—review and editing, visualization; P.B.C.: formal analysis, visualization, writing—review and editing; S.S.S.: conceptualization, supervision, project administration, funding acquisition. All authors have read and agreed to the published version of the manuscript.

Funding

This work was supported by grant 2018/08631–3 from the Fundação de Amparo à Pesquisa do Estado de São Paulo (FAPESP).

Institutional Review Board Statement

Not applicable.

Informed Consent Statement

Not applicable.

Data Availability Statement

All sequence data described here are available in the online Zenodo repository: https://doi.org/10.5281/zenodo.4751698 (accessed on 12 May 2021).

Acknowledgments

The authors would like to thank the Fundação de Amparo à Pesquisa do Estado de São Paulo for financial support.

Conflicts of Interest

The authors declare no conflict of interest.

References

  1. Connor, R. The United Nations World Water Development Report 2015: Water for a Sustainable World; WWAP-United Nations World Water Assessment Programme; United Nations Educational, Scientific and Cultural Organization: Paris, France, 2015; ISBN 978-92-3-100071-3.2. [Google Scholar]
  2. Mishra, A.K.E. (Ed.) Application of Nanotechnology in Water Research; John Wiley & Sons: Hoboken, NJ, USA, 2014; ISBN 978-1-118-49630-5. [Google Scholar]
  3. Shi, X.; Ma, W.; Li, X.; Cheng, Y.; Huang, T. Typical Reservoir Pollution Source Analysis. In Water Pollution and Water Quality Control of Selected Chinese Reservoir Basins; Huang, T., Ed.; Springer International Publishing: Cham, Switzerland, 2016; pp. 95–130. [Google Scholar]
  4. Gonçalves, S.P.; Lucheta, F.; Souza, V.K.D.; Terra, N.R. The influence of xenobiotics in river sediment on the reproduction and survival of Daphnia magna, 1820, Straus. Acta Limnol. Bras. 2012, 24, 220–234. [Google Scholar] [CrossRef] [Green Version]
  5. Godoy, R.G.; Marcondes, M.A.; Pessoa, R.; Nascimento, A.; Victor, J.R.; Duarte, A.; Clissa, P.B.; Sanabani, S.S. Bacterial community composition and potential pathogens along the Pinheiros River in the southeast of Brazil. Sci. Rep. 2020, 10, 9331. [Google Scholar] [CrossRef] [PubMed]
  6. Edokpayi, J.N.; Odiyo, J.O.; Durowoju, O.S. Impact of Wastewater on Surface Water Quality in Developing Countries: A Case Study of South Africa. In Water Quality; INTECH: Vienna, Austria, 2017; pp. 401–416. [Google Scholar]
  7. Park, H.-K.; Byeon, M.-S.; Shin, Y.-N.; Jung, D.-I. Sources and spatial and temporal characteristics of organic carbon in two large reservoirs with contrasting hydrologic characteristics. Water Resour. Res. 2009, 45. [Google Scholar] [CrossRef]
  8. Simek, K.; Hornák, K.; Jezbera, J.; Nedoma, J.; Znachor, P.; Hejzlar, J.; Sed’a, J. Spatio-temporal patterns of bacterioplankton production and community composition related to phytoplankton composition and protistan bacterivory in a dam reservoir. Aquat. Microb. Ecol. 2008, 51, 249–262. [Google Scholar] [CrossRef] [Green Version]
  9. Preheim, S.P.; Olesen, S.W.; Spencer, S.J.; Materna, A.; Varadharajan, C.; Blackburn, M.; Friedman, J.; Rodriguez, J.; Hemond, H.; Alm, E.J. Surveys, simulation and single-cell assays relate function and phylogeny in a lake ecosystem. Nat. Microbiol. 2016, 1, 16130. [Google Scholar] [CrossRef]
  10. Yan, M.; Chen, S.; Huang, T.; Li, B.; Li, N.; Liu, K.; Zong, R.; Miao, Y.; Huang, X. Community Compositions of Phytoplankton and Eukaryotes during the Mixing Periods of a Drinking Water Reservoir: Dynamics and Interactions. Int. J. Environ. Res. Public Health 2020, 17, 1128. [Google Scholar] [CrossRef] [Green Version]
  11. Xue, Y.; Chen, H.; Yang, J.R.; Liu, M.; Huang, B.; Yang, J. Distinct patterns and processes of abundant and rare eukaryotic plankton communities following a reservoir cyanobacterial bloom. ISME J. 2018, 12, 2263–2277. [Google Scholar] [CrossRef] [Green Version]
  12. Vila-Costa, M.; Barberan, A.; Auguet, J.C.; Sharma, S.; Moran, M.A.; Casamayor, E.O. Bacterial and archaeal community structure in the surface microlayer of high mountain lakes examined under two atmospheric aerosol loading scenarios. FEMS Microbiol. Ecol. 2013, 84, 387–397. [Google Scholar] [CrossRef] [Green Version]
  13. Aguirre-Garrido, J.F.; Ramirez-Saad, H.C.; Toro, N.; Martinez-Abarca, F. Bacterial Diversity in the Soda Saline Crater Lake from Isabel Island, Mexico. Microb. Ecol. 2016, 71, 68–77. [Google Scholar] [CrossRef]
  14. Baricz, A.; Chiriac, C.M.; Andrei, A.S.; Bulzu, P.A.; Levei, E.A.; Cadar, O.; Battes, K.P.; Cimpean, M.; Senila, M.; Cristea, A.; et al. Spatio-temporal insights into microbiology of the freshwater-to-hypersaline, oxic-hypoxic-euxinic waters of Ursu Lake. Environ. Microbiol. 2021, 23, 3523–3540. [Google Scholar] [CrossRef] [Green Version]
  15. dos Anjos, F.M.; Bittencourt-Oliveira Mdo, C.; Zajac, M.P.; Hiller, S.; Christian, B.; Erler, K.; Luckas, B.; Pinto, E. Detection of harmful cyanobacteria and their toxins by both PCR amplification and LC-MS during a bloom event. Toxicon 2006, 48, 239–245. [Google Scholar] [CrossRef] [PubMed]
  16. Jin, D.; Kong, X.; Cui, B.; Jin, S.; Xie, Y.; Wang, X.; Deng, Y. Bacterial communities and potential waterborne pathogens within the typical urban surface waters. Sci. Rep. 2018, 8, 13368. [Google Scholar] [CrossRef] [PubMed]
  17. Shen, M.; Li, Q.; Ren, M.; Lin, Y.; Wang, J.; Chen, L.; Li, T.; Zhao, J. Trophic Status Is Associated With Community Structure and Metabolic Potential of Planktonic Microbiota in Plateau Lakes. Front. Microbiol. 2019, 10, 2560. [Google Scholar] [CrossRef] [PubMed] [Green Version]
  18. Wu, K.; Zhao, W.; Wang, Q.; Yang, X.; Zhu, L.; Shen, J.; Cheng, X.; Wang, J. The Relative Abundance of Benthic Bacterial Phyla Along a Water-Depth Gradient in a Plateau Lake: Physical, Chemical, and Biotic Drivers. Front. Microbiol. 2019, 10, 1521. [Google Scholar] [CrossRef]
  19. De Wever, A.; Muylaert, K.; Van der Gucht, K.; Pirlot, S.; Cocquyt, C.; Descy, J.P.; Plisnier, P.D.; Vyverman, W. Bacterial community composition in Lake Tanganyika: Vertical and horizontal heterogeneity. Appl. Environ. Microbiol. 2005, 71, 5029–5037. [Google Scholar] [CrossRef] [Green Version]
  20. Gilbert, J.A.; Steele, J.A.; Caporaso, J.G.; Steinbruck, L.; Reeder, J.; Temperton, B.; Huse, S.; McHardy, A.C.; Knight, R.; Joint, I.; et al. Defining seasonal marine microbial community dynamics. ISME J. 2012, 6, 298–308. [Google Scholar] [CrossRef] [Green Version]
  21. Yung, C.M.; Vereen, M.K.; Herbert, A.; Davis, K.M.; Yang, J.; Kantorowska, A.; Ward, C.S.; Wernegreen, J.J.; Johnson, Z.I.; Hunt, D.E. Thermally adaptive tradeoffs in closely related marine bacterial strains. Environ. Microbiol. 2015, 17, 2421–2429. [Google Scholar] [CrossRef]
  22. Shade, A.; Jones, S.E.; McMahon, K.D. The influence of habitat heterogeneity on freshwater bacterial community composition and dynamics. Environ. Microbiol. 2008, 10, 1057–1067. [Google Scholar] [CrossRef]
  23. Wetzel, R.G. lake and river ecosystems. In Limnology, 3rd ed.; Elsevier Academic Press: San Diego, CA, USA, 2001. [Google Scholar]
  24. Petrere, M., Jr.; Walter, T.; Minte-Vera, C.V. Income evaluation of small—Scale fishers in two Brazilian urban reservoirs: Represa Billings (SP) and Lago Paranoa (DF). Braz. J. Biol. Rev. Brasleira De Biol. 2006, 66, 817–828. [Google Scholar] [CrossRef] [Green Version]
  25. Rezende, K.F.; Santos, R.M.; Borges, J.C.; Salvo, L.M.; da Silva, J.R. Histopathological and genotoxic effects of pollution on Nile Tilapia (Oreochromis niloticus, Linnaeus, 1758) in the Billings Reservoir (Brazil). Toxicol. Mech. Methods 2014, 24, 404–411. [Google Scholar] [CrossRef]
  26. Wengrat, S.; Bicudo, D.D.C. Spatial evaluation of water quality in an urban reservoir (Billings Complex, southeastern Brazil). Acta Limnol. Bras. 2011, 23, 200–216. [Google Scholar] [CrossRef] [Green Version]
  27. Mariani, C.F.; Moschini-Carlos, V.; Brandimarte, A.L.; Nishimura, P.Y.; Tófoli, C.F.d.; Duran, D.S.; Lourenço, E.M.; Braidotti, J.C.; Almeida, L.P.; Fidalgo, V.H.; et al. Biota and water quality in the Riacho grande reservoir, Billings complex (São Paulo, Brazil). Acta Limnol. Bras. 2006, 18, 267–280. [Google Scholar]
  28. Leme, E.; Silva, E.P.; Rodrigues, P.S.; Silva, I.R.; Martins, M.F.M.; Bondan, E.F.; Bernardi, M.M.; Kirsten, T.B. Billings reservoir water used for human consumption presents microbiological contaminants and induces both behavior impairments and astrogliosis in zebrafish. Ecotoxicol. Environ. Saf. 2018, 161, 364–373. [Google Scholar] [CrossRef]
  29. Moschini-Carlos, V.; Bortoli, S.; Pinto, E.; Nishimura, P.Y.; Freitas, L.G.; Pompêo, M.L.M.; Dörr, F. Cyanobacteria and cyanotoxin in the Billings reservoir (São Paulo, SP, Brazil). Limnetica 2009, 28, 273–282. [Google Scholar] [CrossRef]
  30. de Carvalho, L.R.; Sant’Anna, C.L.; Gemelgo, M.C.P.; de P. Azevedo, M.T. Cyanobacterial occurrence and detection of microcystin by planar chromatography in surface water of Billings and Guarapiranga Reservoirs, SP, Brazil. Braz. J. Bot. 2007, 30, 141–148. [Google Scholar] [CrossRef] [Green Version]
  31. Paulino, G.V.B.; Felix, C.R.; Silvan, C.G.; Andersen, G.L.; Landell, M.F. Bacterial community and environmental factors associated to rivers runoff and their possible impacts on coral reef conservation. Mar. Pollut. Bull. 2020, 156, 111233. [Google Scholar] [CrossRef]
  32. Lorenzi, A.S.; Chia, M.A.; Lopes, F.A.C.; Silva, G.G.Z.; Edwards, R.A.; Bittencourt-Oliveira, M.D.C. Cyanobacterial biodiversity of semiarid public drinking water supply reservoirs assessed via next-generation DNA sequencing technology. J. Microbiol. 2019, 57, 450–460. [Google Scholar] [CrossRef]
  33. Herlemann, D.P.; Labrenz, M.; Jurgens, K.; Bertilsson, S.; Waniek, J.J.; Andersson, A.F. Transitions in bacterial communities along the 2000 km salinity gradient of the Baltic Sea. ISME J. 2011, 5, 1571–1579. [Google Scholar] [CrossRef] [Green Version]
  34. da Pereira Fonseca, T.A.; Pessoa, R.; Felix, A.C.; Sanabani, S.S. Diversity of Bacterial Communities on Four Frequently Used Surfaces in a Large Brazilian Teaching Hospital. Int. J. Environ. Res. Public Health 2016, 13, 152. [Google Scholar] [CrossRef] [Green Version]
  35. da Pereira Fonseca, T.A.; Pessoa, R.; Sanabani, S.S. Molecular Analysis of Bacterial Microbiota on Brazilian Currency Note Surfaces. Int. J. Environ. Res. Public Health 2015, 12, 13276–13288. [Google Scholar] [CrossRef] [Green Version]
  36. Hisbergues, M.; Christiansen, G.; Rouhiainen, L.; Sivonen, K.; Borner, T. PCR-based identification of microcystin-producing genotypes of different cyanobacterial genera. Arch. Microbiol. 2003, 180, 402–410. [Google Scholar] [CrossRef] [PubMed]
  37. Rantala, A.; Fewer, D.P.; Hisbergues, M.; Rouhiainen, L.; Vaitomaa, J.; Borner, T.; Sivonen, K. Phylogenetic evidence for the early evolution of microcystin synthesis. Proc. Natl. Acad. Sci. USA 2004, 101, 568–573. [Google Scholar] [CrossRef] [PubMed] [Green Version]
  38. Bolger, A.M.; Lohse, M.; Usadel, B. Trimmomatic: A flexible trimmer for Illumina sequence data. Bioinformatics 2014, 30, 2114–2120. [Google Scholar] [CrossRef] [Green Version]
  39. Rognes, T.; Flouri, T.; Nichols, B.; Quince, C.; Mahe, F. VSEARCH: A versatile open source tool for metagenomics. PeerJ 2016, 4, e2584. [Google Scholar] [CrossRef] [PubMed]
  40. Myers, E.W.; Miller, W. Optimal alignments in linear space. Comput. Appl. Biosci. CABIOS 1988, 4, 11–17. [Google Scholar] [CrossRef]
  41. Wheeler, T.J.; Eddy, S.R. nhmmer: DNA homology search with profile HMMs. Bioinformatics 2013, 29, 2487–2489. [Google Scholar] [CrossRef] [PubMed] [Green Version]
  42. Yoon, S.H.; Ha, S.M.; Kwon, S.; Lim, J.; Kim, Y.; Seo, H.; Chun, J. Introducing EzBioCloud: A taxonomically united database of 16S rRNA gene sequences and whole-genome assemblies. Int. J. Syst. Evol. Microbiol. 2017, 67, 1613–1617. [Google Scholar] [CrossRef]
  43. Edgar, R.C.; Haas, B.J.; Clemente, J.C.; Quince, C.; Knight, R. UCHIME improves sensitivity and speed of chimera detection. Bioinformatics 2011, 27, 2194–2200. [Google Scholar] [CrossRef] [Green Version]
  44. Chao, A.; Lee, S.-M. Estimating the Number of Classes via Sample Coverage. J. Am. Stat. Assoc. 1992, 87, 210–217. [Google Scholar] [CrossRef]
  45. Chao, A. Estimating the population size for capture-recapture data with unequal catchability. Biometrics 1987, 43, 783–791. [Google Scholar] [CrossRef]
  46. Burnham, K.P.; Overton, W.S. Robust Estimation of Population Size When Capture Probabilities Vary Among Animals. Ecology 1979, 60, 927–936. [Google Scholar] [CrossRef]
  47. Magurran, A.E. Measuring Biological Diversity; Elsevier: Amsterdam, The Netherlands, 2013. [Google Scholar]
  48. Chao, A.; Shen, T.-J. Nonparametric estimation of Shannon’s index of diversity when there are unseen species in sample. Environ. Ecol. Stat. 2003, 10, 429–443. [Google Scholar] [CrossRef]
  49. Beals, E.W. Bray-Curtis Ordination: An Effective Strategy for Analysis of Multivariate Ecological Data. In Advances in Ecological Research; MacFadyen, A., Ford, E.D., Eds.; Academic Press: Cambridge, MA, USA, 1984; Volume 14, pp. 1–55. [Google Scholar]
  50. Hammer, Ø.; Harper, D.A.T.; Ryan, P.D. PAST: Paleontological Statistics Software Package for Education and Data Analysis. Palaeontol. Electron. 2001, 4, 1–9. [Google Scholar]
  51. Segata, N.; Izard, J.; Waldron, L.; Gevers, D.; Miropolsky, L.; Garrett, W.S.; Huttenhower, C. Metagenomic biomarker discovery and explanation. Genome Biol. 2011, 12, R60. [Google Scholar] [CrossRef] [PubMed] [Green Version]
  52. Soares, L.A.; Santos, A.C.A.D.; Duarte, I.C.S.; Romagnoli, E.M.; Calijuri, M.d.C. Distribution of Archaeal and Bacterial communities in a subtropical reservoir. Acta Limnol. Bras. 2015, 27, 411–420. [Google Scholar] [CrossRef] [Green Version]
  53. Lehours, A.C.; Evans, P.; Bardot, C.; Joblin, K.; Gerard, F. Phylogenetic diversity of archaea and bacteria in the anoxic zone of a meromictic lake (Lake Pavin, France). Appl. Environ. Microbiol. 2007, 73, 2016–2019. [Google Scholar] [CrossRef] [Green Version]
  54. Liu, J.; Su, J.; Zhang, M.; Luo, Z.; Li, X.; Chai, B. Bacterial Community Spacing Is Mainly Shaped by Unique Species in the Subalpine Natural Lakes of China. Front. Microbiol. 2021, 12, 669131. [Google Scholar] [CrossRef]
  55. Dias, R.M.; de Oliveira, A.G.; Baumgartner, M.T.; Angulo-Valencia, M.A.; Agostinho, A.A. Functional erosion and trait loss in fish assemblages from Neotropical reservoirs: The man beyond the environment. Fish Fish. 2021, 22, 377–390. [Google Scholar] [CrossRef]
  56. Qu, J.; Jia, C.; Liu, Q.; Li, Z.; Liu, P.; Yang, M.; Zhao, M.; Li, W.; Zhu, H.; Zhang, Q. Dynamics of Bacterial Community Diversity and Structure in the Terminal Reservoir of the South-To-North Water Diversion Project in China. Water 2018, 10, 709. [Google Scholar] [CrossRef] [Green Version]
  57. Toyama, D.; Kishi, L.T.; Santos-Junior, C.D.; Soares-Costa, A.; de Oliveira, T.C.; de Miranda, F.P.; Henrique-Silva, F. Metagenomics Analysis of Microorganisms in Freshwater Lakes of the Amazon Basin. Genome Announc. 2016, 4, e01440-16. [Google Scholar] [CrossRef] [Green Version]
  58. Santos-Junior, C.D.; Kishi, L.T.; Toyama, D.; Soares-Costa, A.; Oliveira, T.C.; de Miranda, F.P.; Henrique-Silva, F. Metagenome Sequencing of Prokaryotic Microbiota Collected from Rivers in the Upper Amazon Basin. Genome Announc. 2017, 5, e01450-16. [Google Scholar] [CrossRef] [PubMed] [Green Version]
  59. Cabral, B.C.A.; Hoffmann, L.; Budowle, B.; Urmenyi, T.P.; Moura-Neto, R.S.; Azevedo, S.; Silva, R. Planktonic microbial profiling in water samples from a Brazilian Amazonian reservoir. MicrobiologyOpen 2018, 7, e00523. [Google Scholar] [CrossRef] [PubMed] [Green Version]
  60. Gracas, D.A.; Miranda, P.R.; Barauna, R.A.; McCulloch, J.A.; Ghilardi, R., Jr.; Schneider, M.P.; Silva, A. Microbial diversity of an anoxic zone of a hydroelectric power station reservoir in Brazilian Amazonia. Microb. Ecol. 2011, 62, 853–861. [Google Scholar] [CrossRef] [PubMed]
  61. Albertsen, M.; Karst, S.M.; Ziegler, A.S.; Kirkegaard, R.H.; Nielsen, P.H. Back to Basics—The Influence of DNA Extraction and Primer Choice on Phylogenetic Analysis of Activated Sludge Communities. PLoS ONE 2015, 10, e0132783. [Google Scholar] [CrossRef] [PubMed]
  62. Simek, K.; Hornak, K.; Jezbera, J.; Nedoma, J.; Vrba, J.; Straskrabova, V.; Macek, M.; Dolan, J.R.; Hahn, M.W. Maximum growth rates and possible life strategies of different bacterioplankton groups in relation to phosphorus availability in a freshwater reservoir. Environ. Microbiol. 2006, 8, 1613–1624. [Google Scholar] [CrossRef]
  63. Bouvy, M.; Nascimento, S.M.; Molica, R.J.R.; Ferreira, A.; Huszar, V.; Azevedo, S.M.F.O. Limnological features in Tapacurá reservoir (northeast Brazil) during a severe drought. Hydrobiologia 2003, 493, 115–130. [Google Scholar] [CrossRef]
  64. do Carmo Bittencourt-Oliveira, M. Detection of potential microcystin-producing cyanobacteria in Brazilian reservoirs with a mcyB molecular marker. Harmful Algae 2003, 2, 51–60. [Google Scholar] [CrossRef]
  65. Bittencourt-Oliveira Mdo, C.; Piccin-Santos, V.; Moura, A.N.; Aragao-Tavares, N.K.; Cordeiro-Araujo, M.K. Cyanobacteria, microcystins and cylindrospermopsin in public drinking supply reservoirs of Brazil. An. Da Acad. Bras. De Cienc. 2014, 86, 297–310. [Google Scholar] [CrossRef] [Green Version]
  66. Dantas, E.W.; Moura, A.N.; Bittencourt-Oliveira Mdo, C. Cyanobacterial blooms in stratified and destratified eutrophic reservoirs in semi-arid region of Brazil. An. Da Acad. Bras. De Cienc. 2011, 83, 1327–1338. [Google Scholar] [CrossRef] [Green Version]
  67. Moura, A.N.; Dantas, E.W.; Oliveira, H.S.; Bittencourt-Oliveira, M.C. Vertical and temporal dynamics of cyanobacteria in the Carpina potable water reservoir in northeastern Brazil. Braz. J. Biol. Rev. Brasleira De Biol. 2011, 71, 451–459. [Google Scholar] [CrossRef]
  68. McMahon, K.D.; Read, E.K. Microbial contributions to phosphorus cycling in eutrophic lakes and wastewater. Annu. Rev. Microbiol. 2013, 67, 199–219. [Google Scholar] [CrossRef] [PubMed]
  69. Paerl, H.W. Dynamics of Blue-Green Algal (’Microcystis aeruginosa’) Blooms in the Lower Neuse River, North Carolina: Causative Factors and Potential Controls Raleigh; Report No. 229; University of North Carolina Water Resources Research Institute: Raleigh, NC, USA, 1987. [Google Scholar]
  70. Paerl, H.W.; Huisman, J. Climate change: A catalyst for global expansion of harmful cyanobacterial blooms. Environ. Microbiol. Rep. 2009, 1, 27–37. [Google Scholar] [CrossRef] [PubMed]
  71. Pope, P.B.; Patel, B.K. Metagenomic analysis of a freshwater toxic cyanobacteria bloom. FEMS Microbiol. Ecol. 2008, 64, 9–27. [Google Scholar] [CrossRef] [PubMed] [Green Version]
  72. Parulekar, N.N.; Kolekar, P.; Jenkins, A.; Kleiven, S.; Utkilen, H.; Johansen, A.; Sawant, S.; Kulkarni-Kale, U.; Kale, M.; Saebo, M. Characterization of bacterial community associated with phytoplankton bloom in a eutrophic lake in South Norway using 16S rRNA gene amplicon sequence analysis. PLoS ONE 2017, 12, e0173408. [Google Scholar] [CrossRef] [PubMed]
  73. Newton, R.J.; Jones, S.E.; Eiler, A.; McMahon, K.D.; Bertilsson, S. A guide to the natural history of freshwater lake bacteria. Microbiol. Mol. Biol. Rev. MMBR 2011, 75, 14–49. [Google Scholar] [CrossRef] [Green Version]
  74. Walter, Z.; Natascha, S.; Meinhard, S. Seasonal patterns of the bacterioplankton community composition in a large mesotrophic lake. Aquat. Microb. Ecol. 2003, 31, 211–225. [Google Scholar]
  75. Patel, V.; Munot, H.; Shouche, Y.S.; Madamwar, D. Response of bacterial community structure to seasonal fluctuation and anthropogenic pollution on coastal water of Alang-Sosiya ship breaking yard, Bhavnagar, India. Bioresour. Technol. 2014, 161, 362–370. [Google Scholar] [CrossRef]
  76. Ghai, R.; Rodriguez-Valera, F.; McMahon, K.D.; Toyama, D.; Rinke, R.; Cristina Souza de Oliveira, T.; Wagner Garcia, J.; Pellon de Miranda, F.; Henrique-Silva, F. Metagenomics of the water column in the pristine upper course of the Amazon river. PLoS ONE 2011, 6, e23785. [Google Scholar] [CrossRef]
  77. Paerl, H.W.; Otten, T.G. Harmful cyanobacterial blooms: Causes, consequences, and controls. Microb. Ecol. 2013, 65, 995–1010. [Google Scholar] [CrossRef]
  78. Ghai, R.; Mizuno, C.M.; Picazo, A.; Camacho, A.; Rodriguez-Valera, F. Key roles for freshwater Actinobacteria revealed by deep metagenomic sequencing. Mol. Ecol. 2014, 23, 6073–6090. [Google Scholar] [CrossRef]
  79. Goodfellow, M.; Williams, S.T. Ecology of actinomycetes. Annu. Rev. Microbiol. 1983, 37, 189–216. [Google Scholar] [CrossRef] [PubMed]
  80. Zwirglmaier, K.; Keiz, K.; Engel, M.; Geist, J.; Raeder, U. Seasonal and spatial patterns of microbial diversity along a trophic gradient in the interconnected lakes of the Osterseen Lake District, Bavaria. Front. Microbiol. 2015, 6, 1168. [Google Scholar] [CrossRef] [PubMed]
  81. Warnecke, F.; Sommaruga, R.; Sekar, R.; Hofer, J.S.; Pernthaler, J. Abundances, identity, and growth state of actinobacteria in mountain lakes of different UV transparency. Appl. Environ. Microbiol. 2005, 71, 5551–5559. [Google Scholar] [CrossRef] [Green Version]
  82. Buckling, A.; Wills, M.A.; Colegrave, N. Adaptation limits diversification of experimental bacterial populations. Science 2003, 302, 2107–2109. [Google Scholar] [CrossRef] [PubMed] [Green Version]
  83. Ryan, R.P.; Monchy, S.; Cardinale, M.; Taghavi, S.; Crossman, L.; Avison, M.B.; Berg, G.; van der Lelie, D.; Dow, J.M. The versatility and adaptation of bacteria from the genus Stenotrophomonas. Nat. Rev. Microbiol. 2009, 7, 514–525. [Google Scholar] [CrossRef]
  84. Lu, X.; Fan, C.; He, W.; Deng, J.; Yin, H. Sulfur-containing amino acid methionine as the precursor of volatile organic sulfur compounds in algea-induced black bloom. J. Environ. Sci. 2013, 25, 33–43. [Google Scholar] [CrossRef]
  85. Patel, C.B.; Shanker, R.; Gupta, V.K.; Upadhyay, R.S. Q-PCR Based Culture-Independent Enumeration and Detection of Enterobacter: An Emerging Environmental Human Pathogen in Riverine Systems and Potable Water. Front. Microbiol. 2016, 7, 172. [Google Scholar] [CrossRef] [Green Version]
  86. Bernardet, J.F.; Vancanneyt, M.; Matte-Tailliez, O.; Grisez, L.; Tailliez, P.; Bizet, C.; Nowakowski, M.; Kerouault, B.; Swings, J. Polyphasic study of Chryseobacterium strains isolated from diseased aquatic animals. Syst. Appl. Microbiol. 2005, 28, 640–660. [Google Scholar] [CrossRef]
  87. Zamora, L.; Fernandez-Garayzabal, J.F.; Sanchez-Porro, C.; Palacios, M.A.; Moore, E.R.; Dominguez, L.; Ventosa, A.; Vela, A.I. Flavobacterium plurextorum sp. nov. Isolated from Farmed Rainbow Trout (Oncorhynchus mykiss). PLoS ONE 2013, 8, e67741. [Google Scholar] [CrossRef]
  88. Zamora, L.; Fernandez-Garayzabal, J.F.; Svensson-Stadler, L.A.; Palacios, M.A.; Dominguez, L.; Moore, E.R.; Vela, A.I. Flavobacterium oncorhynchi sp. nov., a new species isolated from rainbow trout (Oncorhynchus mykiss). Syst. Appl. Microbiol. 2012, 35, 86–91. [Google Scholar] [CrossRef]
  89. Hlavsa, M.C.; Roberts, V.A.; Anderson, A.R.; Hill, V.R.; Kahler, A.M.; Orr, M.; Garrison, L.E.; Hicks, L.A.; Newton, A.; Hilborn, E.D.; et al. Surveillance for waterborne disease outbreaks and other health events associated with recreational water—United States, 2007–2008. MMWR Surveill Summ 2011, 60, 1–32. [Google Scholar] [PubMed]
Figure 1. Map showing sampling site locations in the Billings Reservoir in São Paulo. The map was generated using QGIS 3.22.0 (Redlands, CA, USA).
Life 12 01280 g001
Figure 2. Bootstrap observation biplots derived from the principal component analysis (PCA) of the Billings water physicochemical properties and α bacterial diversities represented by the chao1 and Shannon indices based on 100 resamples of the data. The two principal components (PC1 and PC2) explained 46.3% of the total variation in the environmental data. Temperature (Temp), dissolved oxygen (DO), phosphorus (P), ammonia (NH3+), and nitrate (NO3-). Green lines represent the correlation coefficient between the PC scores and each environmental parameter. Black dots represent sampling points from the bottom layers, and blue squares represent sampling points from the surface water.
Life 12 01280 g002
Figure 3. Bacterial community alpha diversity as calculated by the phylogenetic diversity index of water samples from the surface and bottom layers. The error bars indicate the mean with standard error.
Life 12 01280 g003
Figure 4. The relative abundance of (A) Proteobacteria and (B) Bacteroidetes, and (C) relative abundance of bacterial composition at the phylum level of the surface and bottom layers.
Life 12 01280 g004
Figure 5. Relative abundance of bacterial composition at the genus level of the surface and bottom layers.
Life 12 01280 g005
Table 1. Physicochemical characteristics of water samples from the surface of the Billings Reservoir.
Sample IDDO * mg/LTemppHAverage Water Depth (km)Turbidity (NTU)Sulfate mg/LPhosphorus mg/LAmmonia mg/LNitrate mg/L
B1S420.57.39.53.10.40.12.40.9
B2S7.121.28.35.53.10.50.22.81.1
B3S5.721.27.53.22.50.40.12.82.2
B4S5.522.17.02.11.90.60.02.77.4
B5S7.421.58.16.92.50.40.22.70.9
B6S8.321.68.712.84.30.30.32.21.2
B7S7.521.28.212.46.90.30.12.60.9
B8S7.321.17.910.115.00.40.32.51.2
B9S7.221.27.6911.50.70.32.51
B10S7.921.57.97.618.50.30.82.92.2
B11S5.821.57.65.912.00.60.131.8
B12S4.321.27.58.114.10.50.02.61.4
B13S6.720.87.810.410.00.50.12.71.9
B14S9.520.98.53.912.00.540.13.31.8
B15S4.720.97.513.66.20.560.02.71.7
B16S9.2218.610.112.90.40.12.81.3
B17S7.920.67.76.911.80.60.12.72.3
B18S6.520.57.58.918.00.40.22.72.65
B19S6.320.57.66.17.80.50.12.11.3
B20S6.520.97.34.510.50.30.12.62.9
B21S7.720.97.6712.00.50.22.82.2
B22S9.420.68.35.411.00.50.22.11.1
B23S9217.35.86.50.40.22.41.8
B24S7.921.38.05.58.10.50.02.91.02
B25S5.821.87.66.95.10.50.13.41.98
B26S7.621.68.06.86.50.40.13.20.9
B27S9.220.87.43.25.30.30.12.40.8
B28S9.320.67.97.14.80.40.12.80.9
B29S9.321.68.98.75.30.50.12.91.2
B30S8.120.97.810.28.30.40.22.32.8
* Dissolved oxygen.
Table 2. Physiochemical characteristics of water samples from the bottom layer of Billings reservoir.
Sample IDDO * mg/LTemppHAverage Water Depth (km)Turbidity (NTU)Sulfate mg/LPhosphorus mg/LAmmonia mg/LNitrate mg/L
B1F3.720.67.49.54.10.40.12.51.1
B2F6.420.88.35.53.00.50.22.31.2
B3F5.119.87.23.23.90.40.22.81.5
B4F418.872.11.20.10.12.41.2
B5F7.121.18.26.93.00.60.12.30.05
B6F7.121.78.312.84.40.40.13.20.09
B7F5.621.28.112.46.30.50.12.81.2
B8F4.621.17.910.18.10.20.12.21.1
B9F4.520.97.299.80.40.02.40.9
B10F4.821.27.67.613.60.50.13.70.8
B11F3.521.27.65.910.30.20.03.11.1
B12F3.520.97.48.16.70.30.02.80.8
B13F4.920.87.710.410.30.50.03.11.2
B14F8.3218.33.931.90.30.02.50.9
B15F4.320.87.513.66.10.50.12.71.2
B16F8.420.68.510.111.50.41.22.30.09
B17F6.320.57.86.916.50.41.12.61.1
B18F620.37.68.913.10.40.12.70.09
B19F5.920.57.66.19.90.81.12.61
B20F5.520.47.54.59.90.62.12.42.7
B21F6.620.57.778.40.30.92.81.1
B22F7.820.58.45.410.20.61.22.71.6
B23F6.920.98.15.88.20.51.32.31.8
B24F7.120.785.56.80.40.932.1
B25F6.620.97.96.96.20.51.23.51.9
B26F7.621.386.87.80.51.92.92.3
B27F8.320.57.83.23.40.62.13.11.9
B28F7.620.57.97.17.20.41.92.91.6
B29F8.220.68.68.77.70.52.12.41.1
B30F7.720.5810.27.60.50.92.31.3
* Dissolved oxygen.
Publisher’s Note: MDPI stays neutral with regard to jurisdictional claims in published maps and institutional affiliations.

