
Self-Reported Long COVID in the General Population: Sociodemographic and Health Correlates in a Cross-National Sample

 ,
,  , , , and
Abstract
:1. Introduction
Aim of the Study
2. Materials and Methods
2.1. Design
2.2. Sample
2.3. Measures
2.3.1. COVID-19 Infection and Self-Reported Long COVID
2.3.2. Sociodemographic Characteristics
2.3.3. Psychological Distress
2.3.4. Fatigue
2.3.5. Perceived Stress
2.4. Statistical Analysis
2.5. Ethics
3. Results
3.1. Long COVID in Sample Subgroups
3.2. Associations between Sociodemographic Factors and Long COVID Status
3.3. Effect of Long COVID on Health Outcomes
4. Discussion
4.1. Summary of Findings
4.2. Prevalence of Long COVID
4.3. Sociodemographic Variables Associated with Long COVID
4.4. Health Outcomes Associated with Long COVID
4.5. Study Limitations
5. Conclusions and Implications
Author Contributions
Funding
Institutional Review Board Statement
Informed Consent Statement
Data Availability Statement
Acknowledgments
Conflicts of Interest
References
- World Health Organization. WHO Coronavirus Disease (COVID-19) Dashboard. Available online: https://covid19.who.int (accessed on 8 March 2022).
- Samadizadeh, S.; Masoudi, M.; Rastegar, M.; Salimi, V.; Shahbaz, M.B.; Tahamtan, A. COVID-19: Why does disease severity vary among individuals? Respir. Med. 2021, 180, 106356. [Google Scholar] [CrossRef] [PubMed]
- Centers for Disease Control and Prevention Symptoms of COVID-19. Available online: https://www.cdc.gov/coronavirus/2019-ncov/symptoms-testing/symptoms.html (accessed on 8 March 2022).
- Carfì, A.; Bernabei, R.; Landi, F. Persistent Symptoms in Patients After Acute COVID. JAMA 2020, 324, 603–605. [Google Scholar] [CrossRef] [PubMed]
- Tenforde, M.W.; Kim, S.S.; Lindsell, C.J.; Rose, E.B.; Shapiro, N.I.; Files, D.C.; Gibbs, K.W.; Erickson, H.L.; Steingrub, J.S.; Smithline, H.A.; et al. Symptom Duration and Risk Factors for Delayed Return to Usual Health Among Outpatients with COVID-19 in a Multistate Health Care Systems Network—United States, March–June. MMWR Morb. Mortal. Wkly. Rep. 2020, 69, 993–998. [Google Scholar] [CrossRef] [PubMed]
- Ebinger, J.E.; Achamallah, N.; Ji, H.; Claggett, B.L.; Sun, N.; Botting, P.; Nguyen, T.-T.; Luong, E.; Kim, E.H.; Park, E.; et al. Pre-existing traits associated with COVID-19 illness severity. PLoS ONE 2020, 15, e0236240. [Google Scholar] [CrossRef]
- Yanez, N.D.; Weiss, N.S.; Romand, J.-A.; Treggiari, M.M. COVID-19 mortality risk for older men and women. BMC Public Health 2020, 20, 1742. [Google Scholar] [CrossRef]
- Gebhard, C.; Regitz-Zagrosek, V.; Neuhauser, H.K.; Morgan, R.; Klein, S.L. Impact of sex and gender on COVID-19 outcomes in Europe. Biol. Sex Differ. 2020, 11, 1–13. [Google Scholar] [CrossRef]
- Scully, E.P.; Haverfield, J.; Ursin, R.L.; Tannenbaum, C.; Klein, S.L. Considering how biological sex impacts immune responses and COVID-19 outcomes. Nat. Rev. Immunol. 2020, 20, 442–447. [Google Scholar] [CrossRef]
- National Institute for Health and Care Excellence. COVID-19 Rapid Guideline: Managing the Long-Term Effects of COVID-19; NICE: London, UK, 2020. [Google Scholar]
- Sigfrid, L.; Drake, T.M.; Pauley, E.; Jesudason, E.C.; Olliaro, P.; Lim, W.S.; Gillesen, A.; Berry, C.; Lowe, D.J.; McPeake, J.; et al. Long Covid in adults discharged from UK hospitals after COVID-19: A prospective, multicentre cohort study using the ISARIC WHO Clinical Characterisation Protocol. Lancet Reg. Health-Eur. 2021, 8, 100186. [Google Scholar] [CrossRef]
- Ayoubkhani, D.; Khunti, K.; Nafilyan, V.; Maddox, T.; Humberstone, B.; Diamond, I.; Banerjee, A. Post-COVID syndrome in individuals admitted to hospital with COVID-19: Retrospective cohort study. BMJ 2021, 372, n693. [Google Scholar] [CrossRef]
- Munblit, D.; Bobkova, P.; Spiridonova, E.; Shikhaleva, A.; Gamirova, A.; Blyuss, O.; Nekliudov, N.; Bugaeva, P.; Andreeva, M.; DunnGalvin, A.; et al. Incidence and risk factors for persistent symptoms in adults previously hospitalized for COVID-19. Clin. Exp. Allergy 2021, 51, 1107–1120. [Google Scholar] [CrossRef]
- Groff, D.; Sun, A.; Ssentongo, A.E.; Ba, D.M.; Parsons, N.; Poudel, G.R.; Lekoubou, A.; Oh, J.S.; Ericson, J.E.; Ssentongo, P. Short-term and long-term rates of postacute sequelae of SARS-CoV-2 infection: A systematic review. JAMA Netw. Open 2021, 4, e2128568. [Google Scholar] [CrossRef] [PubMed]
- Fainardi, V.; Meoli, A.; Chiopris, G.; Motta, M.; Skenderaj, K.; Grandinetti, R.; Bergomi, A.; Antodaro, F.; Zona, S.; Esposito, S. Long COVID in Children and Adolescents. Life 2022, 12, 285. [Google Scholar] [CrossRef] [PubMed]
- Pavli, A.; Theodoridou, M.; Maltezou, H.C. Post-COVID Syndrome: Incidence, Clinical Spectrum, and Challenges for Primary Healthcare Professionals. Arch. Med. Res. 2021, 52, 575–581. [Google Scholar] [CrossRef] [PubMed]
- Van Herck, M.; Goërtz, Y.M.J.; Houben-Wilke, S.; Machado, F.V.C.; Meys, R.; Delbressine, J.M.; Vaes, A.W.; Burtin, C.; Posthuma, R.; Franssen, F.M.E.; et al. Severe Fatigue in Long COVID: Web-Based Quantitative Follow-up Study in Members of Online Long COVID Support Groups. J. Med. Internet Res. 2021, 23, e30274. [Google Scholar] [CrossRef] [PubMed]
- Geirdal, A.; Price, D.; Schoultz, M.; Thygesen, H.; Ruffolo, M.; Leung, J.; Bonsaksen, T. The Significance of Demographic Variables on Psychosocial Health from the Early Stage and Nine Months after the COVID-19 Pandemic Outbreak. A Cross-National Study. Int. J. Environ. Res. Public Health 2021, 18, 4345. [Google Scholar] [CrossRef]
- Ruffolo, M.; Price, D.; Schoultz, M.; Leung, J.; Bonsaksen, T.; Thygesen, H.; Geirdal, A.Ø. Employment Uncertainty and Mental Health During the COVID-19 Pandemic Initial Social Distancing Implementation: A Cross-national Study. Glob. Soc. Welf. 2021, 8, 141–150. [Google Scholar] [CrossRef]
- Bonsaksen, T.; Heir, T.; Schou-Bredal, I.; Ekeberg, Ø.; Skogstad, L.; Grimholt, T.K. Post-Traumatic Stress Disorder and Associated Factors during the Early Stage of the COVID-19 Pandemic in Norway. Int. J. Environ. Res. Public Health 2020, 17, 9210. [Google Scholar] [CrossRef]
- Schou-Bredal, I.; Grimholt, T.K.; Bonsaksen, T.; Skogstad, L.; Heir, T.; Ekeberg, Ø. Psychological responses and associated factors during the initial lockdown due to the corona disease epidemic (COVID-19) among Norwegian citizens. J. Ment. Health 2021, 1–8. [Google Scholar] [CrossRef]
- Goldberg, D.P.; Gater, R.; Sartorius, N.; Ustun, T.B.; Piccinelli, M.; Gureje, O.; Rutter, C. The validity of two versions of the GHQ in the WHO study of mental illness in general health care. Psychol. Med. 1997, 27, 191–197. [Google Scholar] [CrossRef]
- Goodwin, L.; Ben-Zion, I.; Fear, N.; Hotopf, M.; Stansfeld, S.A.; Wessely, S.C. Are Reports of Psychological Stress Higher in Occupational Studies? A Systematic Review across Occupational and Population Based Studies. PLoS ONE 2013, 8, e78693. [Google Scholar] [CrossRef]
- Adlaf, E.M.; Gliksman, L.; Demers, A.; Ma, B.N.-T. The Prevalence of Elevated Psychological Distress Among Canadian Undergraduates: Findings from the 1998 Canadian Campus Survey. J. Am. Coll. Health 2001, 50, 67–72. [Google Scholar] [CrossRef] [PubMed]
- Firth, J. Levels and sources of stress in medical students. BMJ 1986, 292, 1177–1180. [Google Scholar] [CrossRef] [PubMed] [Green Version]
- Gorter, R.; Freeman, R.; Hammen, S.; Murtomaa, H.; Blinkhorn, A.; Humphris, G. Psychological stress and health in undergraduate dental students: Fifth year outcomes compared with first year baseline results from five European dental schools. Eur. J. Dent. Educ. 2008, 12, 61–68. [Google Scholar] [CrossRef] [PubMed]
- Aalto, A.-M.; Elovainio, M.; Kivimaki, M.; Uutela, A.; Pirkola, S. The Beck Depression Inventory and General Health Questionnaire as measures of depression in the general population: A validation study using the Composite International Diagnostic Interview as the gold standard. Psychiatry Res. 2012, 197, 163–171. [Google Scholar] [CrossRef] [PubMed]
- Hystad, S.W.; Johnsen, B.H. The Dimensionality of the 12-Item General Health Questionnaire (GHQ-12): Comparisons of Factor Structures and Invariance Across Samples and Time. Front. Psychol. 2020, 11, 1300. [Google Scholar] [CrossRef]
- Chalder, T.; Berelowitz, G.; Pawlikowska, T.; Watts, L.; Wessely, S.; Wright, D.; Wallace, E.P. Development of a fatigue scale. J. Psychosom. Res. 1993, 37, 147–153. [Google Scholar] [CrossRef] [Green Version]
- Morriss, R.; Wearden, A.; Mullis, R. Exploring the validity of the chalder fatigue scale in chronic fatigue syndrome. J. Psychosom. Res. 1998, 45, 411–417. [Google Scholar] [CrossRef]
- Tanaka, M.; Fukuda, S.; Mizuno, K.; Imai-Matsumura, K.; Jodoi, T.; Kawatani, J.; Takano, M.; Miike, T.; Tomoda, A.; Watanabe, Y. Reliability and Validity of the Japanese Version of the Chalder Fatigue Scale among Youth in Japan. Psychol. Rep. 2008, 103, 682–690. [Google Scholar] [CrossRef]
- Fong, T.C.T.; Chan, J.S.M.; Chan, C.L.W.; Ho, R.T.H.; Ziea, E.T.C.; Wong, V.C.W.; Ng, B.F.L.; Ng, S.M. Psychometric properties of the Chalder Fatigue Scale revisited: An exploratory structural equation modeling approach. Qual. Life Res. 2015, 24, 2273–2278. [Google Scholar] [CrossRef] [Green Version]
- Chilcot, J.; Norton, S.; Kelly, M.E.; Moss-Morris, R. The Chalder Fatigue Questionnaire is a valid and reliable measure of perceived fatigue severity in multiple sclerosis. Mult. Scler. J. 2015, 22, 677–684. [Google Scholar] [CrossRef]
- Cohen, S.; Kamarck, T.; Mermelstein, R. A global measure of perceived stress. J. Health Soc. Behav. 1983, 24, 385–396. [Google Scholar] [CrossRef] [PubMed]
- Cohen, S.; Williamson, G. Perceived stress in a probability sample of the United States. In The Social Psychology of Health; Spacapan, S., Oskamp, S., Eds.; Sage: Newbury Park, CA, USA, 1988. [Google Scholar]
- Vallejo, M.A.; Vallejo-Slocker, L.; Fernández-Abascal, E.G.; Mañanes, G. Determining Factors for Stress Perception Assessed with the Perceived Stress Scale (PSS-4) in Spanish and Other European Samples. Front. Psychol. 2018, 9, 37. [Google Scholar] [CrossRef] [PubMed]
- Leung, D.Y.; Lam, T.H.; Chan, S.S. Three versions of Perceived Stress Scale: Validation in a sample of Chinese cardiac patients who smoke. BMC Public Health 2010, 10, 513. [Google Scholar] [CrossRef] [PubMed] [Green Version]
- Gjerdingen, D.; Crow, S.; McGovern, P.; Miner, M.H.; Center, B. Stepped Care Treatment of Postpartum Depression: Impact on Treatment, Health, and Work Outcomes. J. Am. Board Fam. Med. 2009, 22, 473–482. [Google Scholar] [CrossRef] [Green Version]
- Bonsaksen, T.; Leung, J.; Schoultz, M.; Thygesen, H.; Price, D.; Ruffolo, M.; Geirdal, A.Ø. Cross-National Study of Worrying, Loneliness, and Mental Health during the COVID-19 Pandemic: A Comparison between Individuals with and without Infection in the Family. Healthcare 2021, 9, 903. [Google Scholar] [CrossRef]
- Rossi, R.; Socci, V.; Talevi, D.; Mensi, S.; Niolu, C.; Pacitti, F.; Di Marco, A.; Rossi, A.; Siracusano, A.; Di Lorenzo, G. COVID-19 Pandemic and Lockdown Measures Impact on Mental Health Among the General Population in Italy. Front. Psychiatry 2020, 11, 790. [Google Scholar] [CrossRef]
- Salari, N.; Hosseinian-Far, A.; Jalali, R.; Vaisi-Raygani, A.; Rasoulpoor, S.; Mohammadi, M.; Rasoulpoor, S.; Khaledi-Paveh, B. Prevalence of stress, anxiety, depression among the general population during the COVID-19 pandemic: A systematic review and meta-analysis. Glob. Health 2020, 16, 57. [Google Scholar] [CrossRef]
- Loades, M.E.; Chatburn, E.; Higson-Sweeney, N.; Reynolds, S.; Shafran, R.; Brigden, A.; Linney, C.; McManus, M.N.; Borwick, C.; Crawley, E. Rapid Systematic Review: The Impact of Social Isolation and Loneliness on the Mental Health of Children and Adolescents in the Context of COVID-19. J. Am. Acad. Child Adolesc. Psychiatry 2020, 59, 1218–1239.e3. [Google Scholar] [CrossRef]
- Sue, K. The science behind “man flu”. BMJ 2017, 359, j5560. [Google Scholar] [CrossRef] [Green Version]
- Wang, X.-L.; Yang, L.; Chan, K.-H.; Chan, K.-P.; Cao, P.-H.; Lau, E.H.-Y.; Peiris, J.S.M.; Wong, C.-M. Age and Sex Differences in Rates of Influenza-Associated Hospitalizations in Hong Kong. Am. J. Epidemiol. 2015, 182, 335–344. [Google Scholar] [CrossRef] [Green Version]
- Quandelacy, T.M.; Viboud, C.; Charu, V.; Lipsitch, M.; Goldstein, E. Age- and Sex-related Risk Factors for Influenza-associated Mortality in the United States Between 1997–2007. Am. J. Epidemiol. 2013, 179, 156–167. [Google Scholar] [CrossRef] [PubMed] [Green Version]
- Furman, D.; Hejblum, B.P.; Simon, N.; Jojic, V.; Dekker, C.L.; Thiébaut, R.; Tibshirani, R.J.; Davis, M.M. Systems analysis of sex differences reveals an immunosuppressive role for testosterone in the response to influenza vaccination. Proc. Natl. Acad. Sci. USA 2014, 111, 869–874. [Google Scholar] [CrossRef] [PubMed] [Green Version]
- Wendt, D.; Shafer, K. Gender and Attitudes about Mental Health Help Seeking: Results from National Data. Health Soc. Work 2015, 41, e20–e28. [Google Scholar] [CrossRef]


| Country | Participants (% a) | COVID-19 Infection (% b) | Long COVID (% c) |
|---|---|---|---|
| Total sample | 1649 (100.0) | 310 (18.8) | 87 (28.1) |
| Norway | 242 (14.7) | 13 (5.4) | 7 (53.8) |
| UK | 255 (15.5) | 74 (29.0) | 29 (40.3) |
| USA | 915 (55.5) | 220 (24.0) | 49 (22.8) |
| Australia | 237 (14.4) | 3 (1.3) | 2 (66.7) |
| p d | <0.001 | 0.002 |
| Subgroups | Long COVID n (%) | Not Long COVID n (%) | p |
|---|---|---|---|
| Age group | 0.07 | ||
| 18–29 years | 20 (37.7) | 33 (62.3) | |
| 30–39 years | 18 (21.2) | 67 (78.8) | |
| 40–49 years | 30 (29.1) | 73 (70.9) | |
| 50–59 years | 16 (40.0) | 24 (60.0) | |
| 60–69 years | 3 (18.8) | 13 (81.3) | |
| 70 years and over | 0 (0.0) | 6 (100.0) | |
| Gendera | 0.05 | ||
| Male | 19 (21.6) | 69 (78.4) | |
| Female | 65 (32.8) | 133 (67.2) | |
| Education level | 0.23 | ||
| Lower education | 21 (23.9) | 67 (76.1) | |
| Higher education (bachelor’s degree or higher) | 66 (30.7) | 149 (69.3) | |
| Spouse/partner | 0.28 | ||
| No | 30 (33.0) | 61 (67.0) | |
| Yes | 57 (26.9) | 155 (73.1) | |
| Employment | 0.51 | ||
| No | 22 (31.9) | 47 (68.1) | |
| Yes | 65 (27.8) | 169 (72.2) |
| Independent Variables | Unadjusted | Adjusted | ||||
|---|---|---|---|---|---|---|
| OR | 95% CI | p | OR | 95% CI | p | |
| Higher age group | 0.92 | 0.74–1.14 | 0.45 | 0.96 | 0.76–1.20 | 0.70 |
| Female gender | 1.78 | 0.99–3.20 | 0.06 | 1.75 | 0.97–3.17 | 0.07 |
| Higher education | 1.41 | 0.80–2.50 | 0.23 | 1.38 | 0.76–2.50 | 0.29 |
| Spouse/partner | 0.75 | 0.44–1.27 | 0.28 | 0.86 | 0.49–1.52 | 0.60 |
| Employment | 0.82 | 0.46–1.47 | 0.51 | 0.86 | 0.47–1.57 | 0.62 |
| Cox–Snell R2 | 0.019 | 0.35 | ||||
| Nagelkerke R2 | 0.028 | |||||
| Independent Variables | Psychological Distress | Fatigue | Perceived Stress | ||||||
|---|---|---|---|---|---|---|---|---|---|
| F (df) | p | ES | F (df) | p | ES | F (df) | p | ES | |
| Age group | 4.53 (1) | <0.05 | 0.02 | 3.49 (1) | 0.06 | 0.01 | 13.3 (1) | <0.001 | 0.05 |
| Gender | 0.62 (1) | 0.43 | 0.00 | 0.02 (1) | 0.88 | 0.00 | 1.83 (1) | 0.18 | 0.01 |
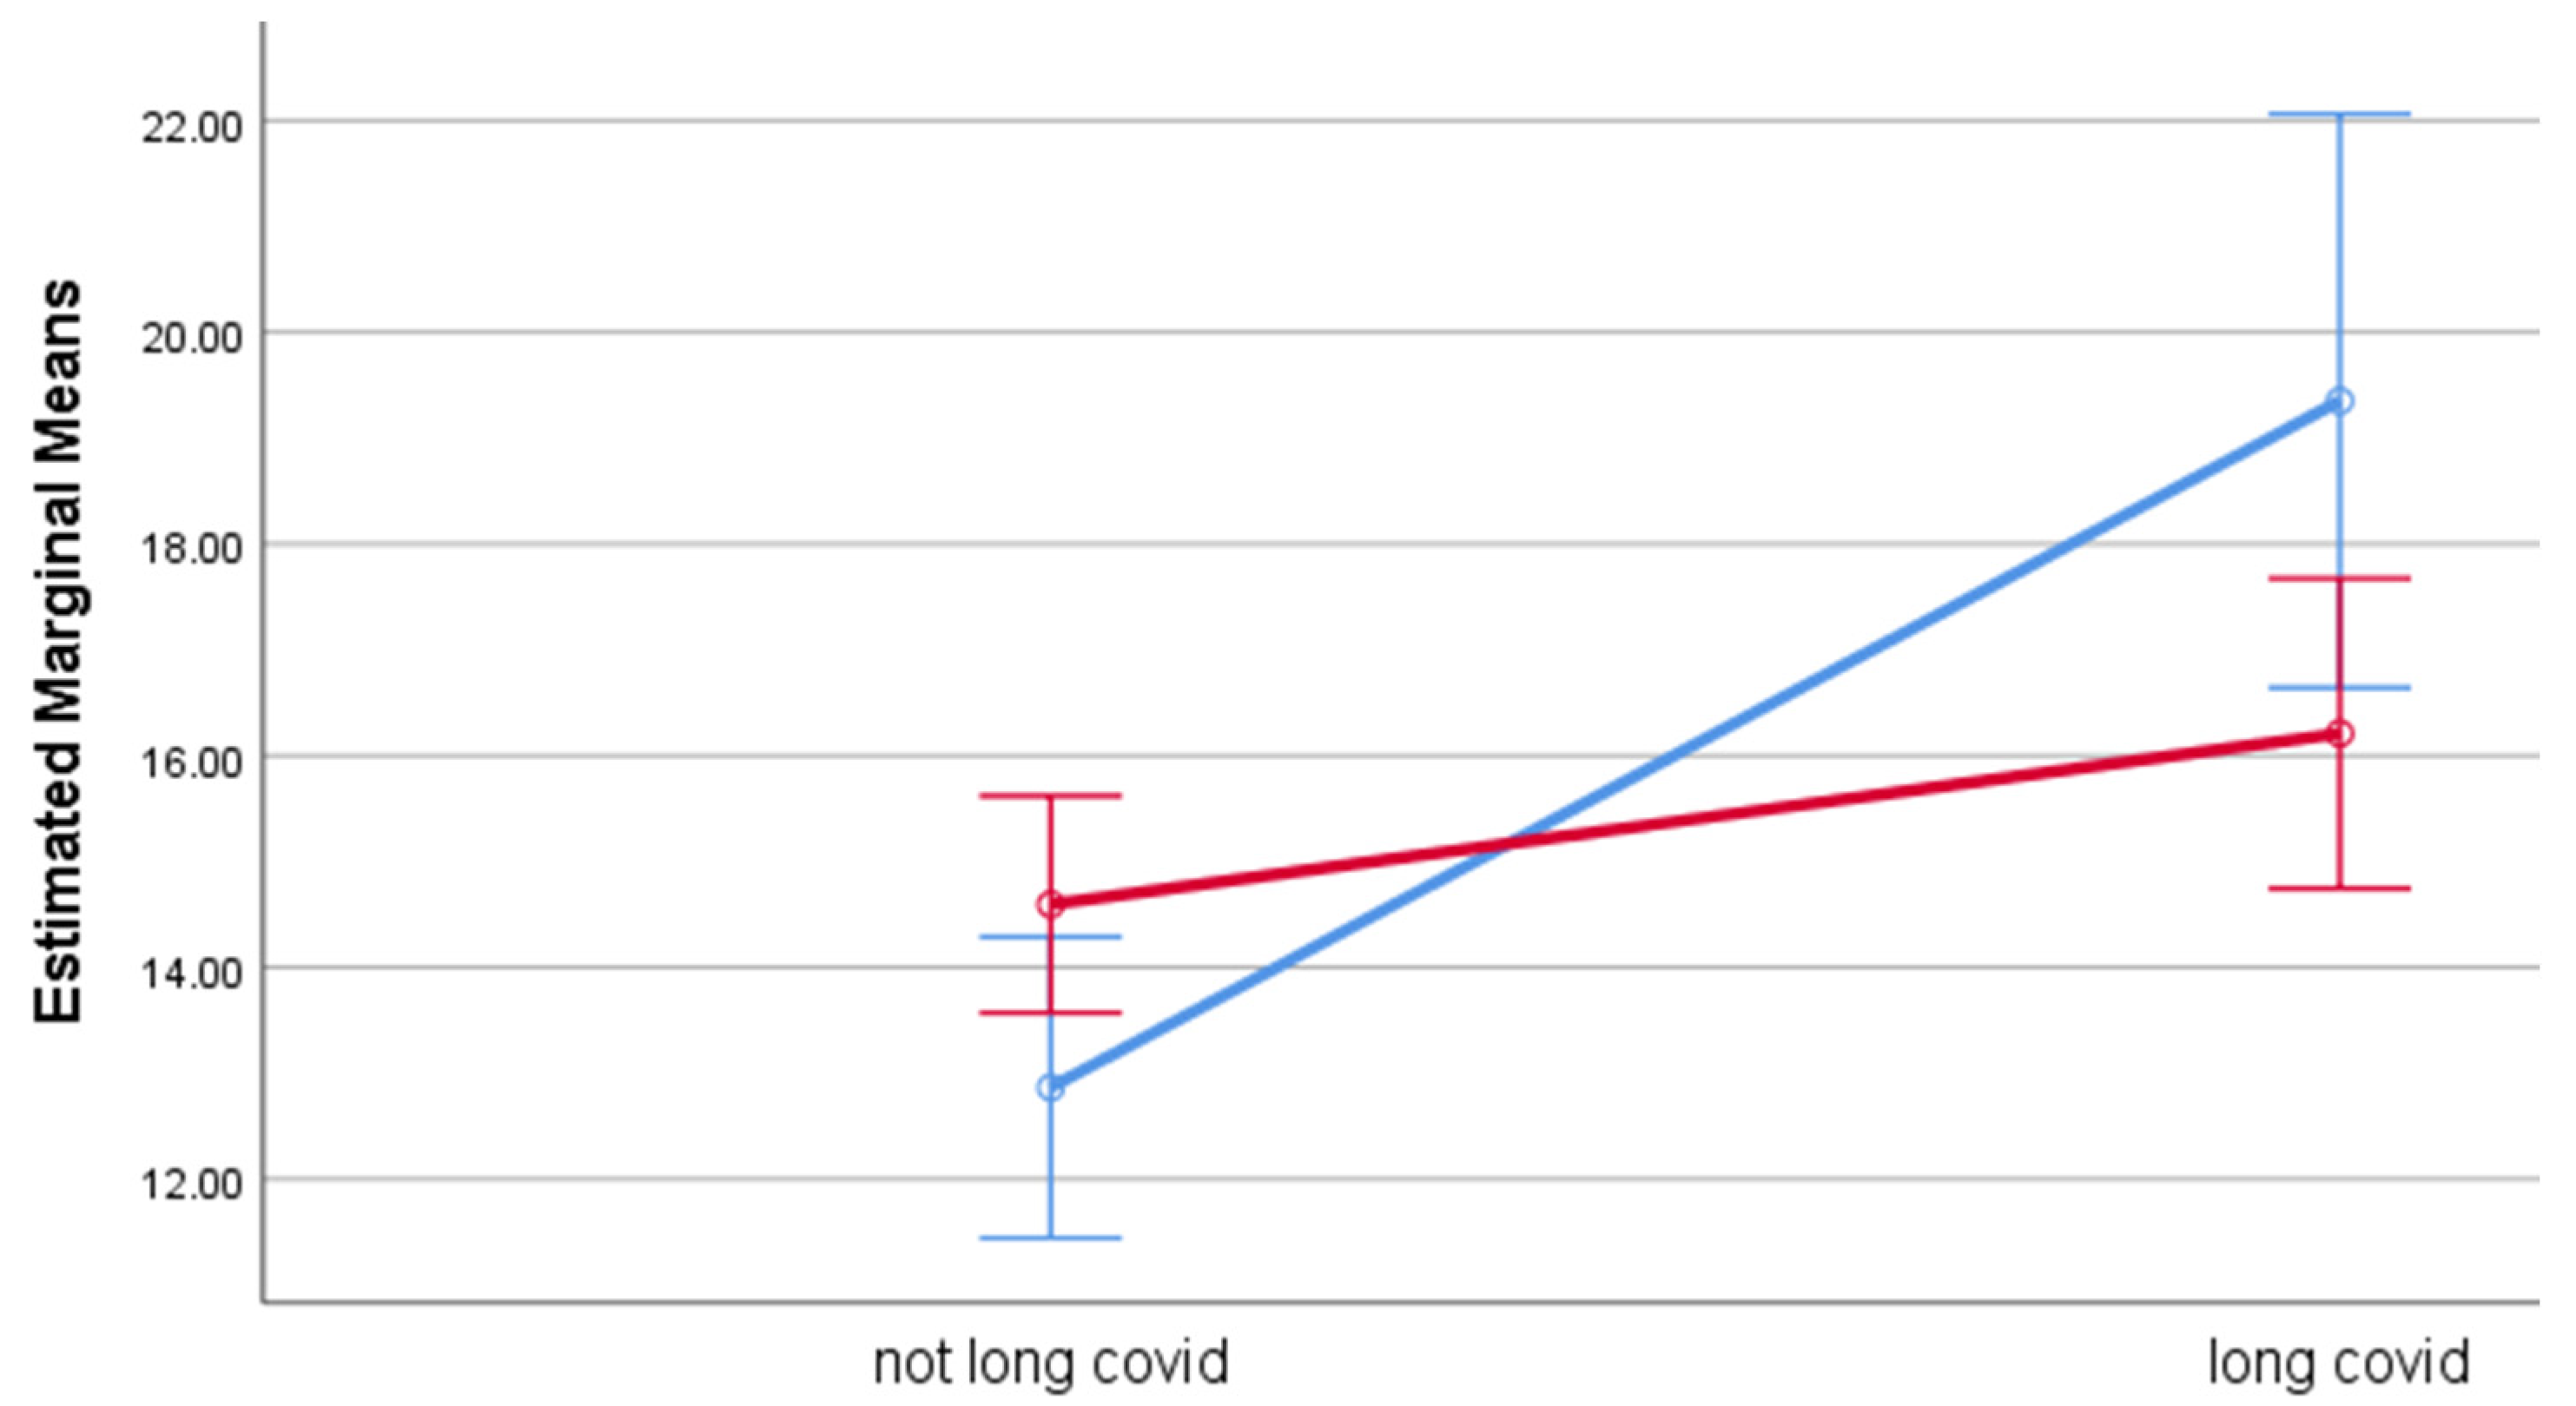
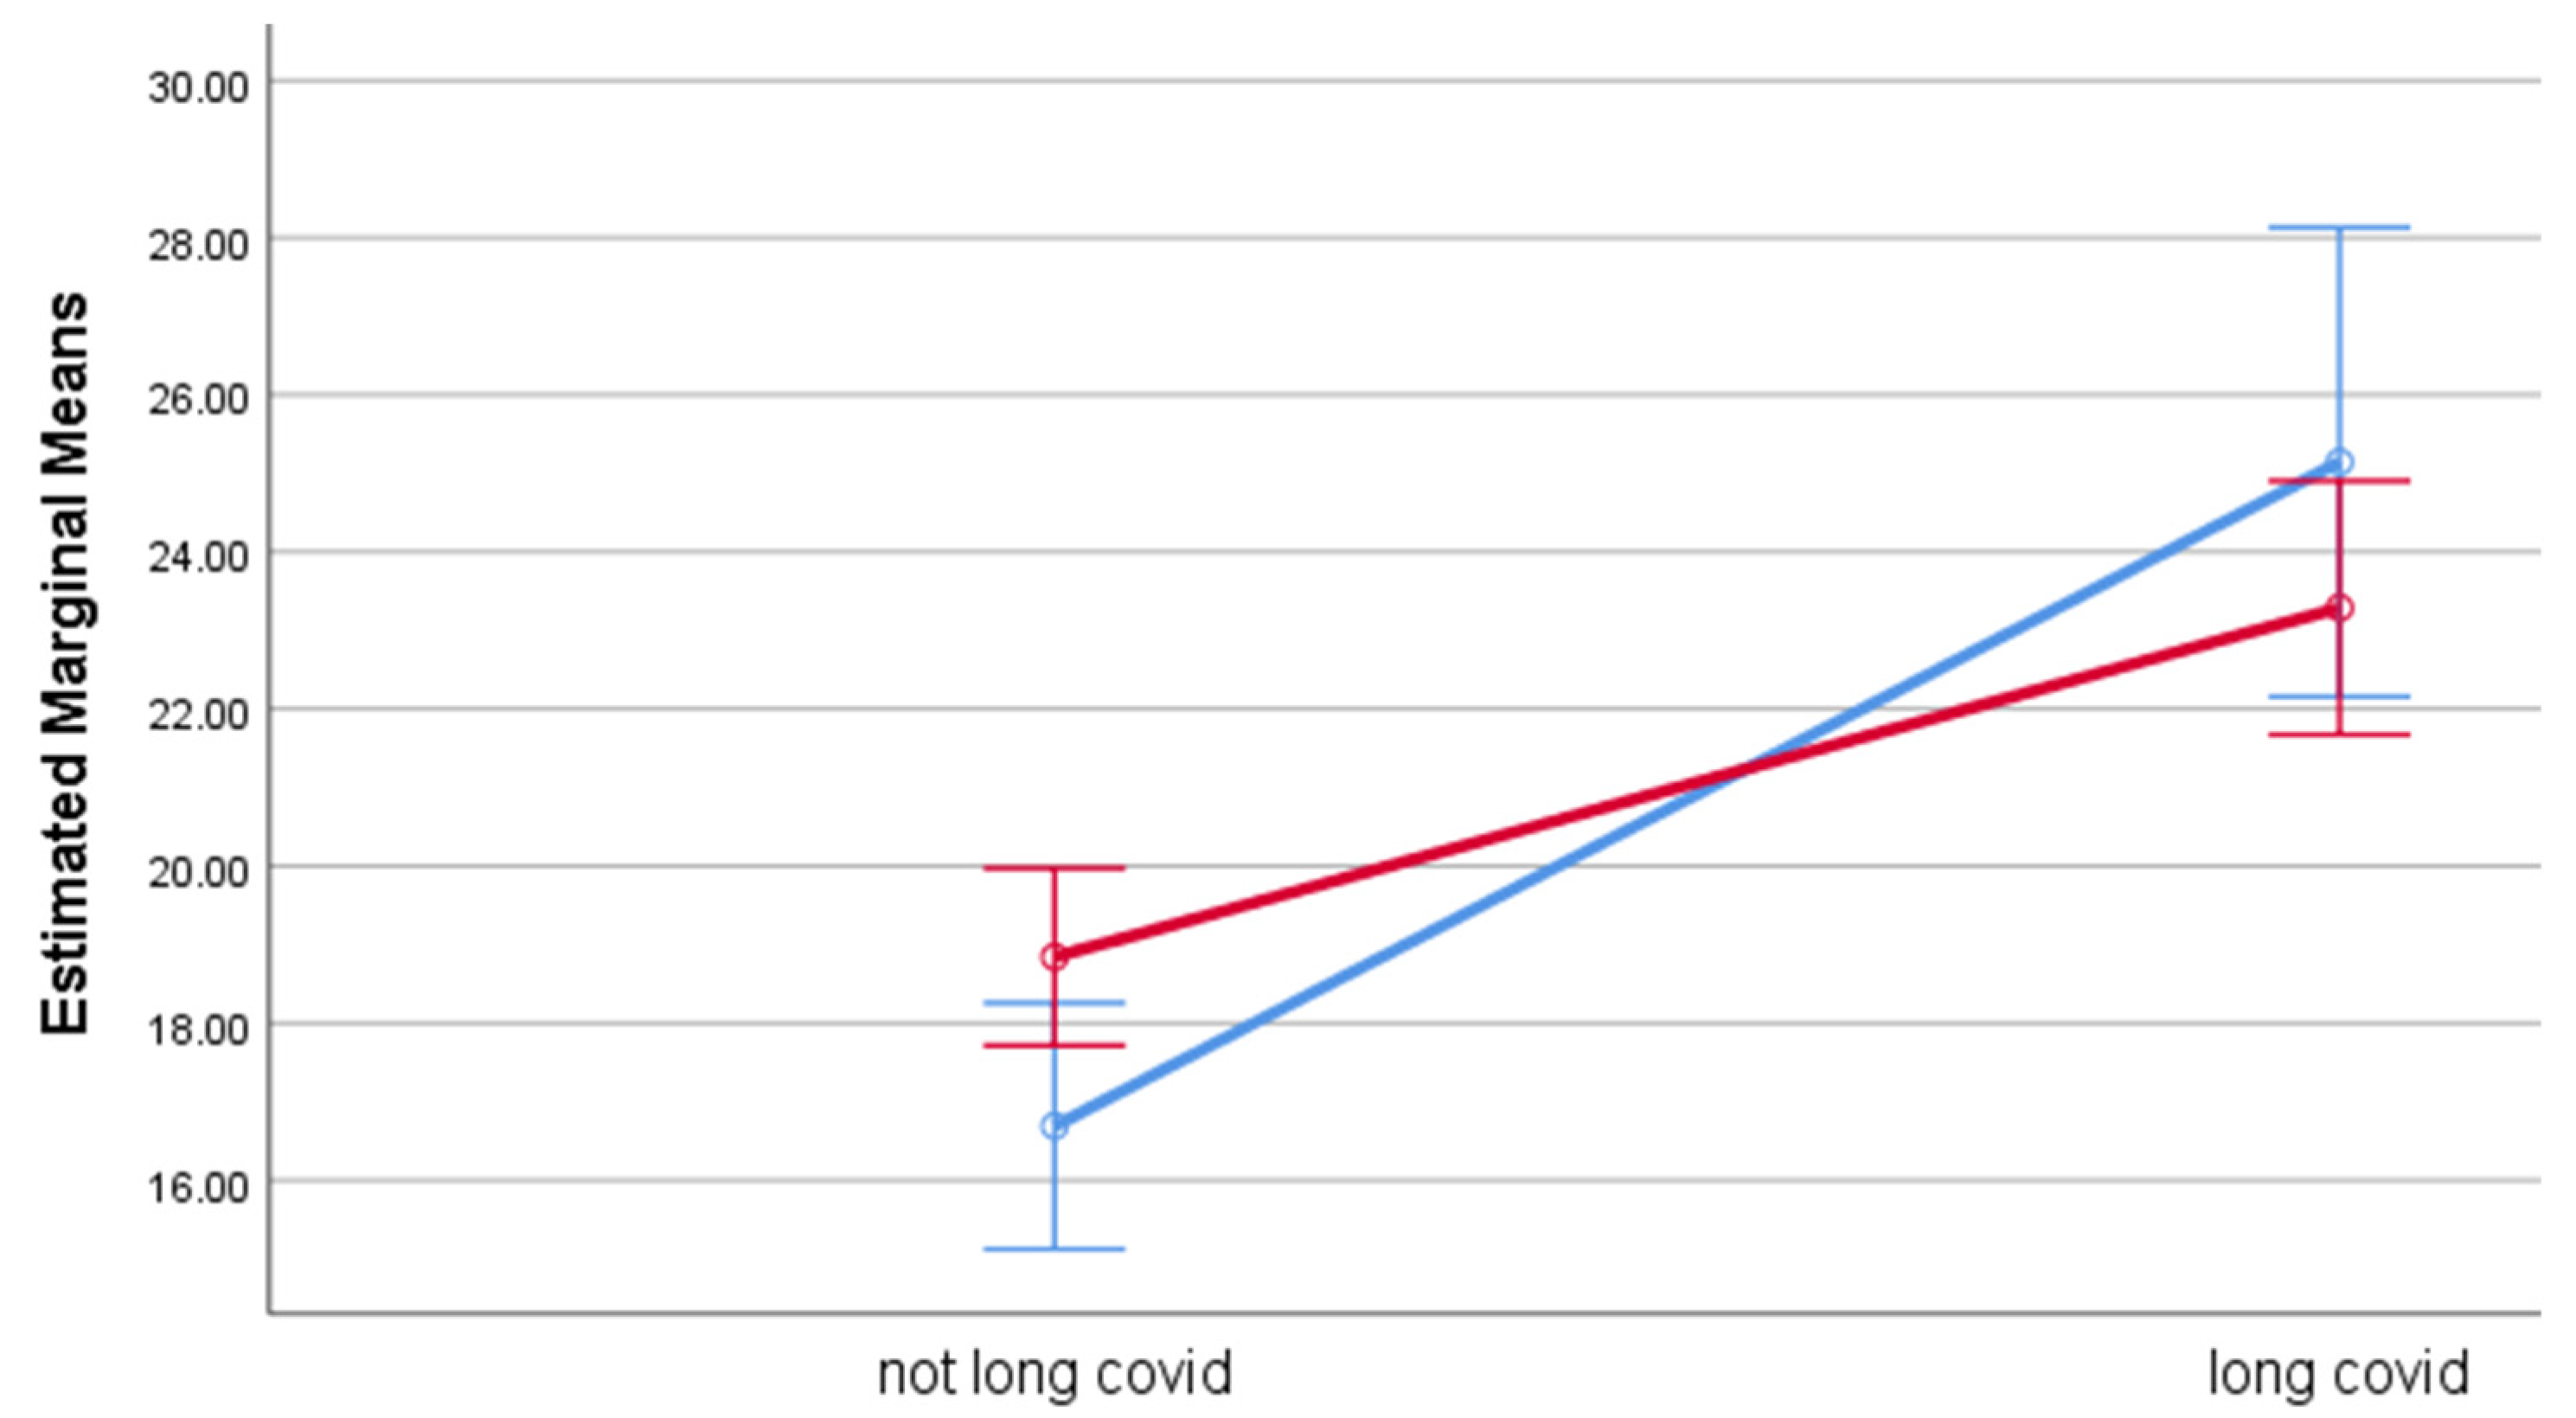
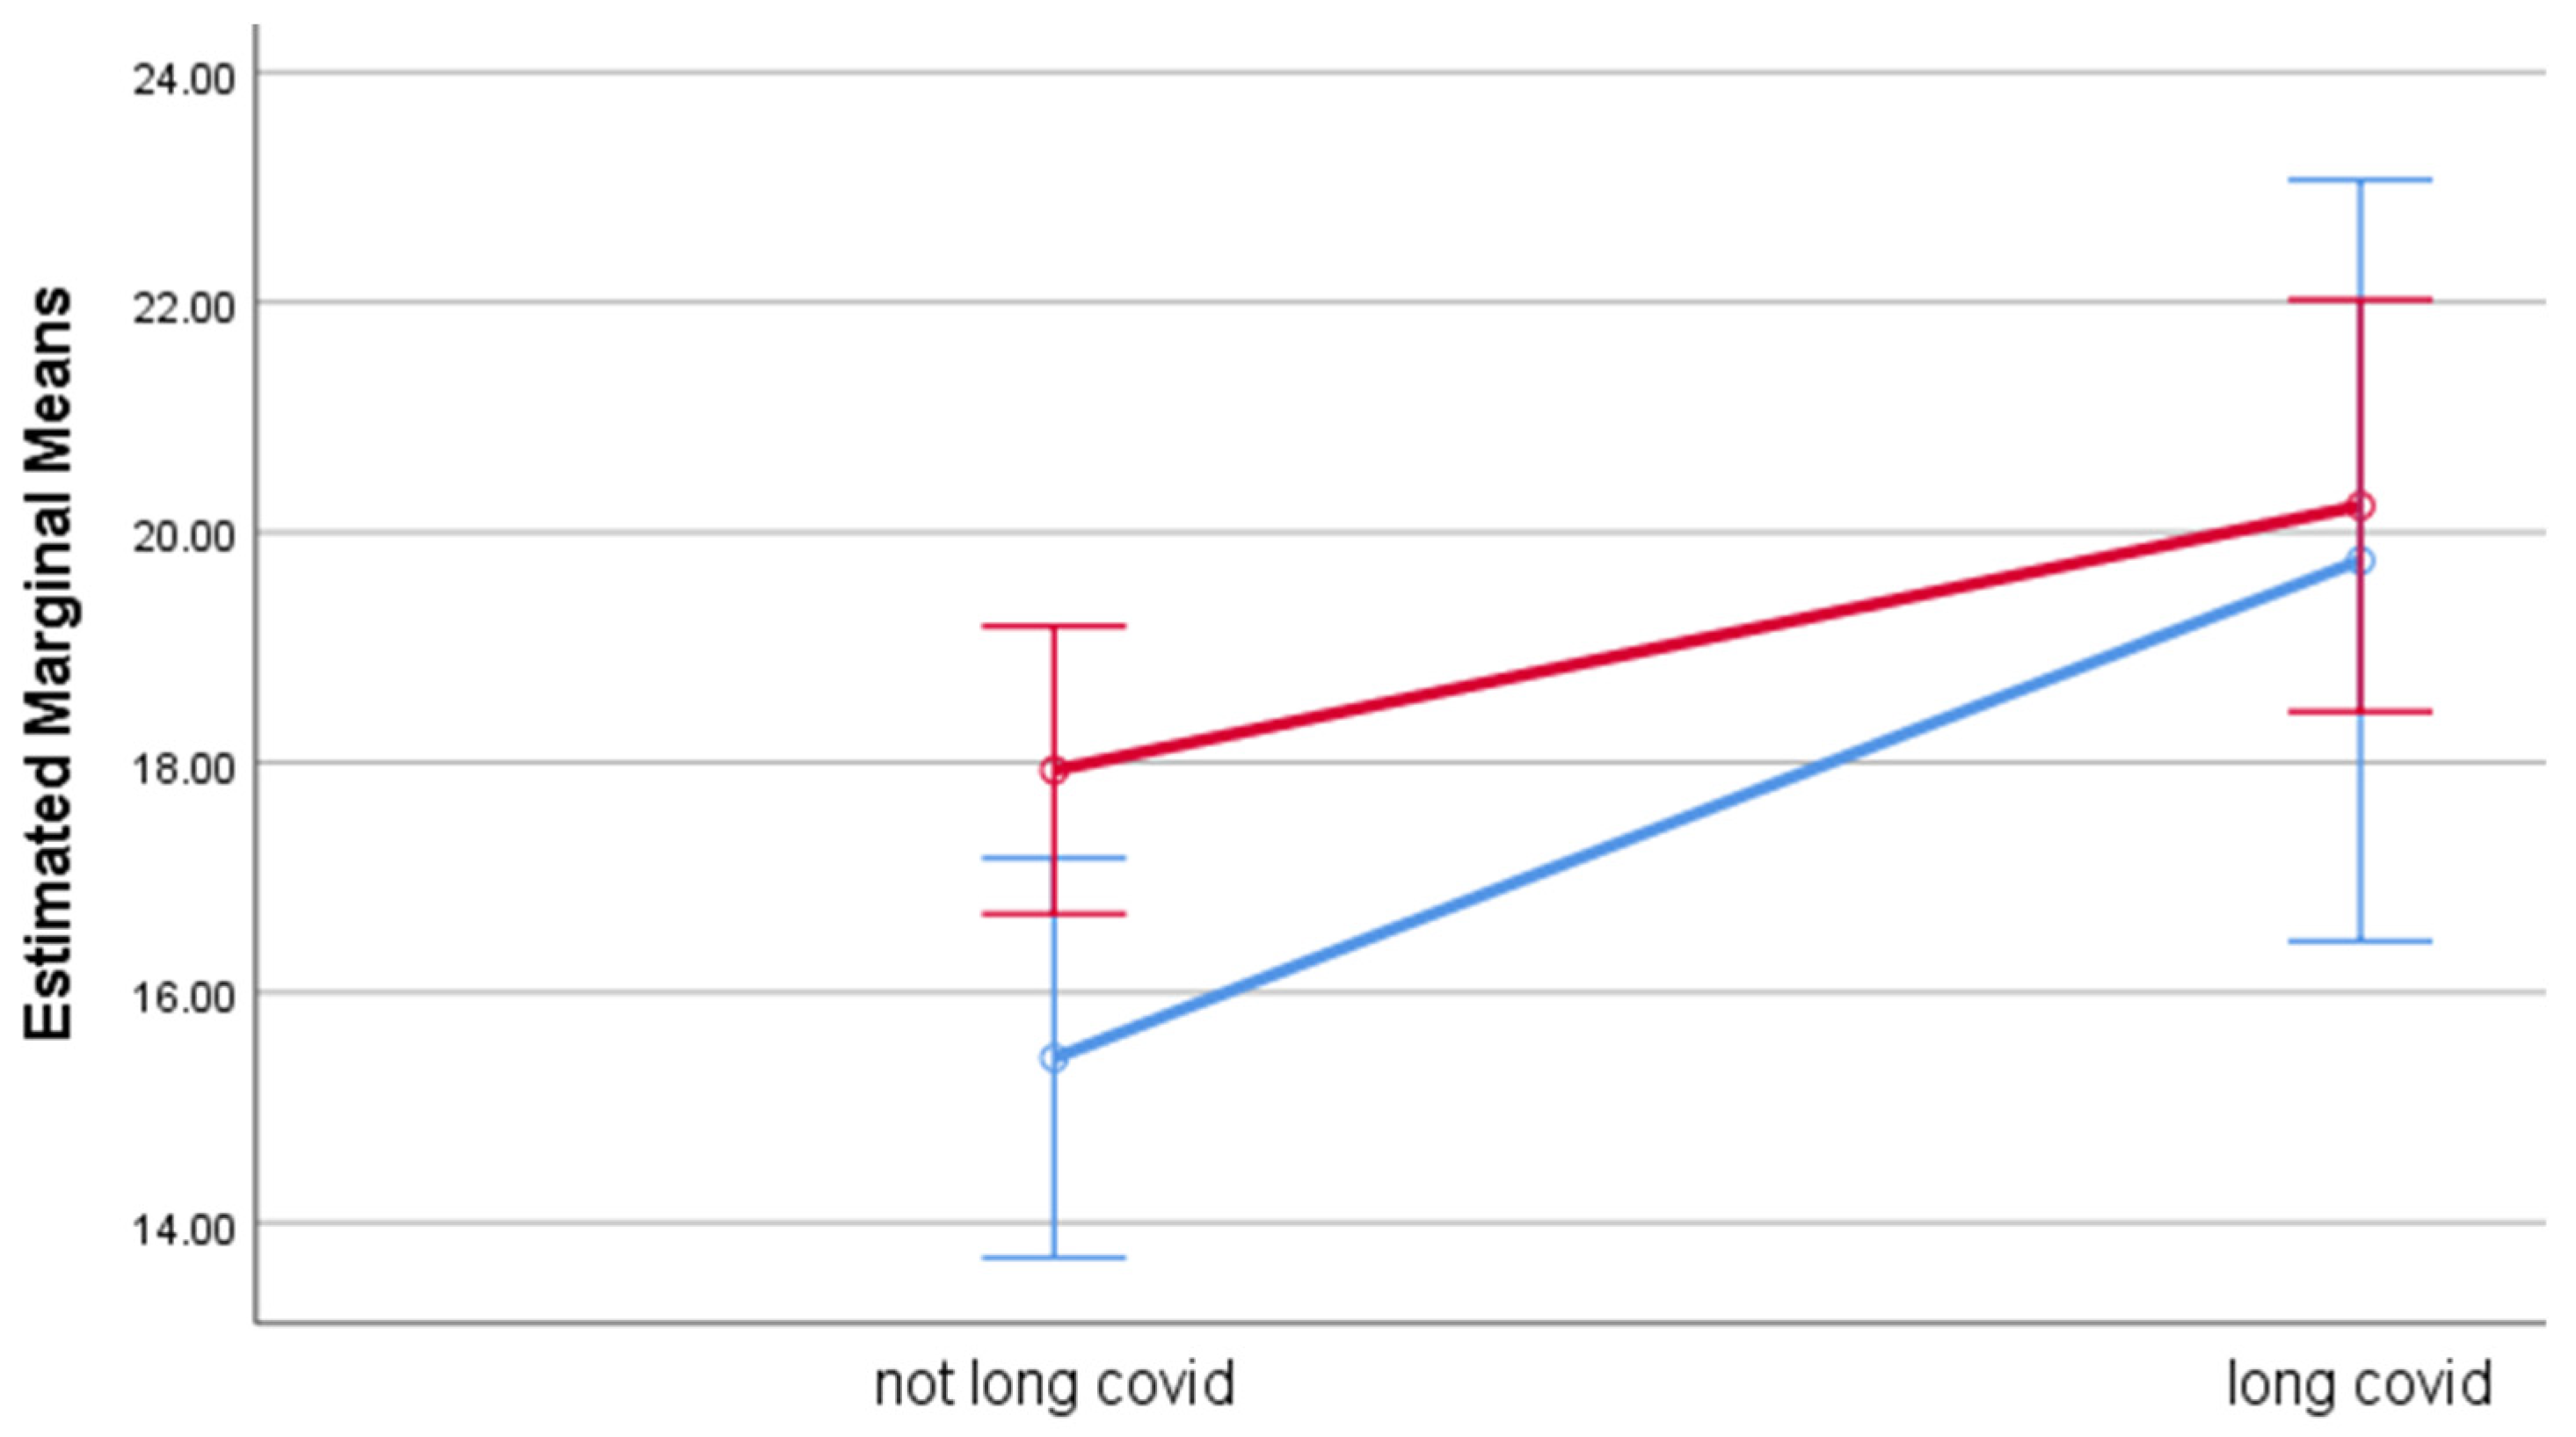
| Long COVID | 20.2 (1) | <0.001 | 0.07 | 42.23 (1) | <0.001 | 0.13 | 9.06 (1) | <0.01 | 0.03 |
| Long COVID × Gender | 7.32 (1) | <0.01 | 0.03 | 4.08 (1) | <0.05 | 0.01 | 0.85 (1) | 0.36 | 0.00 |
| R2 (Adjusted R2) | 0.088 (0.075) | 0.159 (0.147) | 0.097 (0.084) | ||||||
| Independent Variables | Psychological Distress | |||
|---|---|---|---|---|
| M | 95% CI | p a | ES b | |
| COVID-19 status c | <0.001 | 0.07 | ||
| Not long COVID | 13.7 | 12.9–14.6 | ||
| Long COVID | 17.8 | 16.2–19.3 | ||
| Gender | 0.43 | 0.00 | ||
| Men | 16.1 | 14.6–17.6 | ||
| Women | 15.4 | 14.5–16.3 | ||
| Long COVID × gender | <0.01 | 0.03 | ||
| Not long COVID men | 12.9 | 11.4–14.3 | ||
| Long COVID men | 19.4 | 16.6–22.1 | ||
| Not long COVID women | 14.6 | 13.6–15.6 | ||
| Long COVID women | 16.2 | 14.7–17.7 | ||
| Fatigue | ||||
| M | 95% CI | p | ES | |
| COVID-19 status c | <0.001 | 0.13 | ||
| Not long COVID | 17.8 | 16.8–18.7 | ||
| Long COVID | 24.2 | 22.5–25.9 | ||
| Gender | 0.88 | 0.00 | ||
| Men | 20.9 | 19.2–22.6 | ||
| Women | 21.1 | 20.1–22.1 | ||
| Long COVID × gender | <0.05 | 0.01 | ||
| Not long COVID men | 16.7 | 15.1–18.3 | ||
| Long COVID men | 25.1 | 22.2–28.1 | ||
| Not long COVID women | 18.8 | 17.7–20.0 | ||
| Long COVID women | 23.3 | 21.7–24.9 | ||
| Perceived Stress | ||||
| COVID-19 status | M | 95% CI | p | ES |
| Not long COVID | <0.01 | 0.03 | ||
| Long COVID | 16.7 | 15.6–17.8 | ||
| Gender | 20.0 | 18.1–21.9 | ||
| Men | 0.18 | 0.01 | ||
| Women | 17.6 | 15.7–19.5 | ||
| Long COVID × gender | 19.1 | 18.0–20.2 | ||
| Not long COVID men | 0.36 | 0.00 | ||
| Long COVID men | 15.5 | 13.7–17.2 | ||
| Not long COVID women | 19.8 | 16.4–23.1 | ||
| Long COVID women | 17.9 | 16.7–19.2 | ||
| COVID-19 status c | 20.2 | 18.4–22.0 | ||
Publisher’s Note: MDPI stays neutral with regard to jurisdictional claims in published maps and institutional affiliations. |
© 2022 by the authors. Licensee MDPI, Basel, Switzerland. This article is an open access article distributed under the terms and conditions of the Creative Commons Attribution (CC BY) license (https://creativecommons.org/licenses/by/4.0/).
Share and Cite
Bonsaksen, T.; Leung, J.; Price, D.; Ruffolo, M.; Lamph, G.; Kabelenga, I.; Thygesen, H.; Geirdal, A.Ø. Self-Reported Long COVID in the General Population: Sociodemographic and Health Correlates in a Cross-National Sample. Life 2022, 12, 901. https://doi.org/10.3390/life12060901
Bonsaksen T, Leung J, Price D, Ruffolo M, Lamph G, Kabelenga I, Thygesen H, Geirdal AØ. Self-Reported Long COVID in the General Population: Sociodemographic and Health Correlates in a Cross-National Sample. Life. 2022; 12(6):901. https://doi.org/10.3390/life12060901
Chicago/Turabian StyleBonsaksen, Tore, Janni Leung, Daicia Price, Mary Ruffolo, Gary Lamph, Isaac Kabelenga, Hilde Thygesen, and Amy Østertun Geirdal. 2022. "Self-Reported Long COVID in the General Population: Sociodemographic and Health Correlates in a Cross-National Sample" Life 12, no. 6: 901. https://doi.org/10.3390/life12060901