1. Introduction
Coronavirus disease 2019 (COVID-19) is a dominant respiratory disease [
1] that has circulated globally from 2020 and was characterized as a pandemic on 11 March 2020 [
2]. The COVID-19 pandemic has caused a severe global health threat and increased the processing burden of worldwide healthcare systems [
3]. As of 25 December 2021, there were 283 million confirmed cases and 5.41 million confirmed deaths due to COVID-19 across more than 237 countries, with a global mortality of 1.9% and a steep daily increase in the number of cases [
4]. COVID-19 is related to severe acute respiratory syndrome [
5].
Age is one of the risk factors well-known for severe COVID-19 [
6], but age did not show the typical U-shaped risk curve of COVID-19, which is different from other respiratory diseases [
7]. However, the factors influencing COVID-19 mortality still have not been confirmed. In addition, the pathogens of COVID-19 are unknown [
8], and relevant mortality predictors are lacking. However, a recent study showed that biomarkers may help identify relevant clinical outcomes [
9]. COVID-19 survivors may experience persistent pulmonary disease. A study from China investigating the long-term sequelae of COVID-19 suggested that COVID-19 causes chronic damage to the cardiovascular system [
10]. Identifying potential risk profiles might help in the early identification of patients with a poor prognosis. The pathogenesis of COVID-19 is unknown, and predictors of mortality due to COVID-19 are lacking. However, a recent study showed that patient characteristics might help identify relevant clinical outcomes [
11]. Machine learning (ML) can analyze various variables in a biological compartment and identify patterns associated with specific disorders [
12].
In this study, we used machine learning models and data mining to identify the relationship between various patient characteristics and COVID-19. We also aimed to investigate COVID-19 mortality in patients with pre-existing health conditions and examine the association between COVID-19 mortality and other morbidities, such as diabetes, cardiovascular cancers, and neurodegenerative diseases.
2. Materials and Methods
De-identified data from 113,882 individuals, including 14,877 COVID-19 patients collected from the UK Biobank, were used in this study. The UK Biobank is a major biomedical database and research resource that contains different types of data related to COVID-19. Our dataset included 17,954 features and a target variable. Of the COVID-19 patients, 799 patients died from the disease.
Four machine learning (ML) models: the Deep Neural Networks model (DNN), Random Forest Classifier (RF), XGBoost classifier (XGB) and Support Vector Machine (SVM), were used in this study. These four models were used to predict the mortality risk level of COVID-19 and were chosen because the DNN model provides the best performance for deep learning when the size of dataset is large and advanced in handle complicate relationship between input features and target feature. There are three disadvantages of the DNN model. Firstly, DNN model may need more than ten times the training time to achieve the best performance. Secondly, the DNN model requires very large amount of data to perform better than other ML models. The DNN model also has no standard theory for choosing parameters and training method, while the RF and XGB models provide a suitable algorithm to produce a prediction model while reducing the risk of overfitting. Although the RF and XGB models share a similar structure, the RF model on complex problems is usually poorer than the XGB trees; and the SVM model often provides a fair result compared with other machine learning models; it is a simplified model with the fast run time. SVM model may be disadvantaged when the relationship between input features and target feature are complicated and unapparent.
The ML models were built using Python with the integrated development environment provided by PyCharm 2021.2.2 (runtime version: 11.0.12 + 7-b1504.28 amd64), using an OpenJDK 64-Bit Server VM (JDK version: JetBrains s.r.o., Prague, Czech Republic), with Anaconda3 and Anaconda Navigator 2.0.4 as the project interpreters. Numpy [
13] and Pandas [
14] were used to process arrays and matrices as a dataframe and to process read/write data and operating data. To build the ML models, Sklearn [
15] provided the application programming interface (API) of the ensemble classifier for the RF classifier, XGB and SVM and the API for data preprocessing. Sklearn also provided the ML model platform, and Keras [
16] provided implementations of neural networks based on Tensorflow and Theano.
Table 1 shows the two fundamental data statistics in the UK Biobank original dataset, including all patients and patients who died due to COVID-19.
2.1. Features Merging
For features merging, there were 17,954 features in the raw dataset including 13,496 non-empty features from the UK Biobank. Some of the features could be merged into a new single feature based on the same feature semantic, as shown by the examples in
Table 2.
Table 2 shows an example of features represented the ‘weight method’ but using different UDI from 21-0.0 to 21-3.0. Therefore, those features could be merged directly using the participant ID, as they had the same units and meaning. After merging the features by UDI grouping, the number of features decreased to 3442. After the primary merge by UDI grouping, some features represented the same measurement and were divided into different UDI groupings.
Table 3 shows one of these examples, in which features that were assigned to UDI 94 and UDI 4079 groupings could be merged into one feature.
2.2. Scaling
In data scaling, feature values were scaled to the interval [−1,1] and outliers in the ML and neural network models were removed to avoid domination by extremely large values and to create a similar range and difference, by min-max normalization (Equation (1)) [
17]. Outliers that were greater than three standard deviations from the mean were removed.
2.3. Data Preprocessing and Feature Selection
Primary feature selection involved the elimination of missing data. The threshold of missing data was 30%, and 296 features were eliminated by primary feature selection. The second filter involved removal of irrelevant data. For example, variables such as ‘Blood pressure device ID’ and ‘Height measure device ID’ are not relevant predictors.
The train-test ratio of splitting data was 80:20 and an iterative imputation method MissForest [
18] was applied to replace the missing value in the training set.
Regression input perturbation ranking [
19] was used for primary feature selection using the K-best algorithm through a chi-squared distribution (Equation (2)) [
20]. The importance and collinear nature of the features were used in the selection process. A total of 229 features with zero importance were identified after one-hot encoding, 240 features were found to have a cumulative importance of 0.95 after one-hot encoding, and 469 out of 540 features were identified for removal after one-hot encoding. There were 71 of input as listed in
Table A1.
2.4. Model
2.4.1. Deep Neural Network
The DNN model used four fully connected hidden layers, one input layer and one output layer. The first hidden layer had 268 neurons, nearly double the number of input features. The number of neurons in the higher layer is decreased layer by layer decide by grid search hyperparameter tuning tools. RandomNormal was used as the initializer, the activation of hidden layers was performed using Relu, and Adadelta was used as the optimiser. Early stopping was used during the training process to monitor validation loss.
2.4.2. Random Forest Classifier
The RF model used the ‘Gini’ impurity metric (mean decrease in impurity) to calculate feature importance one by one individually. The GridSearchCV in RF model was applied to adjust the value of parameters. The number of estimators was set at 279, and the maximum depth of the trees was set at 5. The number of features to consider when looking for the best split is the square of the number of input features; the minimum number of samples and leaf required to split an internal node was set at 1 and 4, respectively.
2.4.3. XGBoost Classifier
The XGB model applied the GridSearchCV impurity metric to adjust the value of parameters. The number of estimators was set at 200, maximum tree depth was set at 8, and minimum child weight set at 1.
2.4.4. Linear SVM
The linear SVM model was mainly used to address the problem of dividing the results by a linear equation. The linear SVM model performs well when the number of features is large. Moreover, the speed of training is faster for linear SVM models than for other SVM models. Under normal circumstances, the linear SVM model has acceptable performance compared with neural networks.
2.5. Imbalanced Classification
The synthetic Minority Oversampling Technique (SMOTE) was applied for each ML model. By oversampling the minority class for ML models effectively learn the decision boundary.
2.6. Output Result
The target variable was binary (patient death yes or no). Machine learning models were applied to predict the probability of death, ranging from 0 to 1, with values close to 0 indicating a low risk, and those close to 1 indicating a high risk.
Table 4 shows the training information of each ML model.
3. Results
We used DNN, RF, XGB, and linear SVM models for COVID-19 mortality prediction. Of the four ML models tested, the RF model provided the best results. The output of the models was a continuous number from 0 to 1, representing the probability of COVID-19 mortality by 5-fold cross-validation.
Table 5 shows the AUC values for the risk level results from the DNN, RF, XGB, and linear SVM models.
Figure 1 shows the AUC value of the prediction result of the RF classifier model. The RF classifier model showed the best results of the three machine learning models. The mortality risk of COVID-19 was found to be 0.86 (95% CI: 0.84–0.88).
Table 6 and
Figure 2 show the predicted results and corresponding mortality rates. For example, when a patient had a predicted mortality probability of [0, 0.1), the survival rate was 99.8%, but when a patient had a predicted mortality probability of [0.6, 0.7), the survival rate was only 50%.
For binary classification, a novel threshold-based and k-means clustering method [
21] was used to convert the regression results to binary classification results. The best results generated by the RF model gave an AUC value of 0.79.
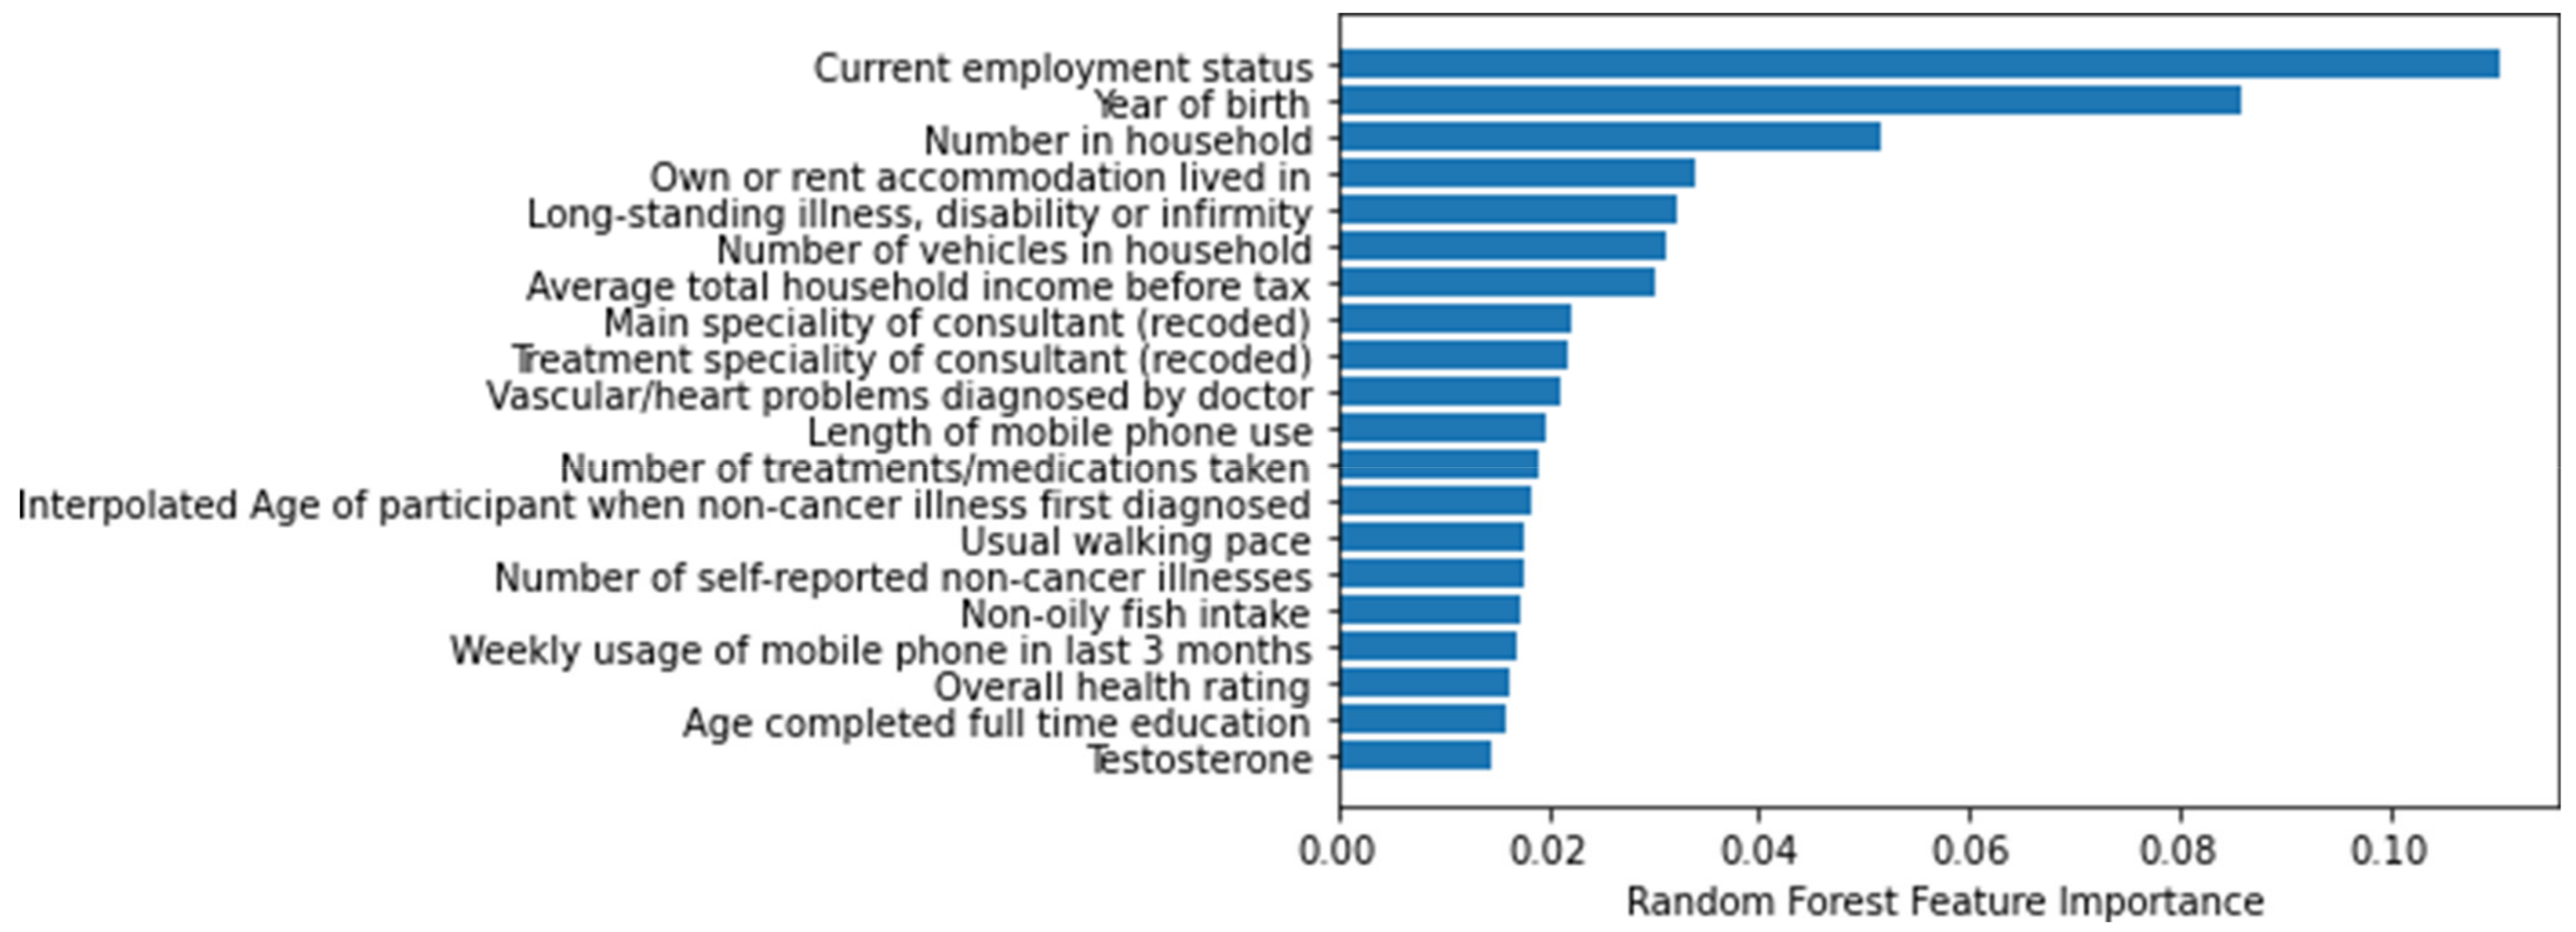
Figure 3 lists the 20 most important features of the RF model. These features were related to age, lifestyle, illness, income, and family history.
Figure 4 and
Figure 5 show the SHAP value break down related to the impact of top 20 features based on magnitude of feature attributions. Positive or negative SHAP values indicate the effect of COVID-19 mortality for top 20 features.
4. Discussion
A risk level prediction model for COVID-19 mortality was developed in this study using data from the UK Biobank. We used a risk level to predict COVID-19 related mortality rather than a binary classification prediction because a risk level can be used to easily identify patients with a poor prognosis earlier by analyzing potential risk factors.
Table 7 shows several scoring systems to estimate the early risk of COVID-19, including the International Severe Acute Respiratory Infection Consortium Clinical Characterization Protocol-Coronavirus Clinical Characterization Consortium (ISARIC-4C) score, quick COVID-19 Severity Index (qCSI), National Early Warning Score 2 (NEWS2) and CURB-65 (confusion, uremia, respiratory rate, BP, age 65 years).
Compared with developed scoring systems, the RF model in this study achieve the best performance of COVID-19 mortality risk prediction.
Considering the time limit for running the model, the DNN model used a single hidden layer, the grid search hyperparameter tuning tools used for RF model estimators was set at only few options, and the maximum depth option of the trees was set at 1 to 5. Thus, the parameters of the model may not be fully optimized and although the results showed an AUC value of 0.86 (95% CI:0.84–0.88), a higher AUC value may have been possible. Another limitation of this study is that because there were more than a thousand features in the original dataset, many of the features were similar. We may not have been able to eliminate all of the related data because the correlations between them were lower than the threshold. For example, the features ‘year of birth’ and ‘mother still lives’ should be related under normal circumstances. The raw dataset also contains variables only at the individual level. Area-level data such as temperature, and income may increase the performance of prediction models [
26], but were not provided in the detailed information of each patient in the original dataset.
For COVID-19 patients, age represented the highest risk, as more than five out of the 20 most important features were related to age of the patient. Income, lifestyle, disease history, and family disease history were also important features for COVID-19 patients. This study defined the important features related to COVID-19 mortality, and may provide an objective and quantitative risk model for clinical care.
5. Conclusions
This study found a significant relationship between specific patient characteristics and the risk of COVID-19-related death. Age, income/personal property, long-standing illness, disability, and heart disorders were important factors affecting COVID-19 mortality. Some unique features, such as ‘length of mobile phone use’ and ‘non-oily fish intake’, were relevant for predicting COVID-19 mortality but have not previously been reported. Alcohol intake showed no associated COVID-19 mortality in the prediction, which is inconsistent with what may be theoretically expected [
27]. This study identified some patient characteristics that are not easily obtained but showed a relationship with COVID-19 mortality.
Future studies will aim to collect more laboratory testing data of confirmed COVID-19 cases and collect more detail information of patients for analysis at the area-level to increase the performance of the prediction models.
Author Contributions
T.-K.W. was responsible for the overall design of the project, planned the experiments, supervised, edited, and wrote the manuscript. K.-H.K.C. were responsible overall design of the project, supervised, contributed to the critical revision of the manuscript. A.V., C.-W.W. and T.W.T. contributed to the critical revision of the manuscript. R.-X.H. and J.-D.L. performed the experiments. All authors corrected the final manuscript. All authors have read and agreed to the published version of the manuscript.
Funding
This research supported by Hong Kong PhD Fellowship Scheme (PF18-27405).
Institutional Review Board Statement
The study was conducted according to the guidelines of the Declaration of Helsinki, and approved by the human subjects ethic committee of City University of Hong Kong (Ref. no.: 2-1-201901_02 and date of approval: 14 March 2019).
Informed Consent Statement
Patient consent was waived due to the nature of secondary analysis.
Data Availability Statement
This research was conducted using data from UK Biobank, a major biomedical database (
www.ukbiobank.ac.uk (accessed on 12 December 2021), project number: 45788).
Conflicts of Interest
Asmir Vodencarevic is an employee of Novartis Pharma GmbH.
Appendix A
Table A1.
Input features for models.
Table A1.
Input features for models.
| Feature Name |
|---|
| Able to confide | Age at recruitment | Age completed full time education | Age first had sexual intercourse |
| Age when attended assessment centre | Alanine aminotransferase | Albumin | Alkaline phosphatase |
| Arm fat-free mass (left) | Arm fat-free mass (right) | Arm predicted mass (left) | Arm predicted mass (right) |
| Aspartate aminotransferase | Average total household income before tax | Birth weight known | Body mass index (BMI) |
| Body mass index (BMI) | Bread intake | Breastfed as a baby | Carer support indicators |
| Chest pain or discomfort | Cholesterol | Cooked vegetable intake | C-reactive protein |
| Creatinine | Current employment status | Cystatin C | Daytime dozing/sleeping (narcolepsy) |
| Direct bilirubin | Dried fruit intake | Eosinophill count | Ever had bowel cancer screening |
| Falls in the last year | Father still alive | Forced expiratory volume in 1-s (FEV1) | Forced expiratory volume in 1-s (FEV1) Z-score |
| Forced vital capacity (FVC) | Forced vital capacity (FVC) Z-score | Gamma glutamyltransferase | Genetic sex |
| Glucose | Glycated haemoglobin (HbA1c) | Haematocrit percentage | Haemoglobin concentration |
| HDL cholesterol | Hearing difficulty/problems | Hearing difficulty/problems with background
noise | High light scatter reticulocyte count |
| High light scatter reticulocyte percentage | Housing score (England) | IGF-1 | Illnesses of siblings |
| Immature reticulocyte fraction | Impedance of arm (left) | Impedance of arm (right) | Impedance of leg (left) |
| Impedance of leg (right) | Impedance of whole body | Intended management of patient (polymorphic) | Intended management of patient (recoded) |
| Interpolated Age of participant when non-cancer illness first | diagnosed | Interpolated Age of participant when operation took place | Interpolated Year when operation took place |
IPAQ activity group
| LDL direct
| Leg fat-free mass (left)
| Leg fat-free mass (right) |
| Leg predicted mass (left) | Leg predicted mass (right) | Length of mobile phone use | |
References
- Zhang, R.; Li, Y.; Zhang, A.L.; Wang, Y.; Molina, M.J. Identifying airborne transmission as the dominant route for the spread of COVID-19. Proc. Natl. Acad. Sci. USA 2020, 117, 14857–14863. [Google Scholar] [CrossRef] [PubMed]
- WHO. Coronavirus Disease 2019 (COVID-19) Situation Report 2020. Available online: https://www.who.int/emergencies/diseases/no24v0el-coronavirus-2019/situation-reports/ (accessed on 25 December 2021).
- Driggin, E.; Madhavan, M.V.; Bikdeli, B.; Chuich, T.; Laracy, J.; Biondi-Zoccai, G.; Brown, T.S.; Der-Nigoghossian, C.; Zidar, D.A.; Haythe, J.; et al. Cardiovascular Considerations for Patients, Health Care Workers, and Health Systems During the COVID-19 Pandemic. J. Am. Coll. Cardiol. 2020, 75, 2352–2371. [Google Scholar] [CrossRef] [PubMed]
- Roser, M.; Ritchie, H.; Ortiz-Ospina, E. Coronavirus Disease (COVID-19)–Statistics and Research. 2020. Available online: https://ourworldindata.org/coronavirus (accessed on 10 December 2021).
- Mengist, H.M.; Fan, X.; Jin, T. Designing of improved drugs for COVID-19: Crystal structure of SARS-CoV-2 main protease M pro. Signal Transduct. Target. Ther. 2020, 5, 67. [Google Scholar] [CrossRef] [PubMed]
- Demombynes, G. COVID-19 Age-Mortality Curves Are Flatter in Developing Countries; Policy Research Working Paper No. 9313; World Bank: Washington, DC, USA, 2020. [Google Scholar]
- Raoult, D.; Zumla, A.; Locatelli, F.; Ippolito, G.; Kroemer, G. Coronavirus infections: Epidemiological, clinical and immunological features and hypotheses. Cell Stress 2020, 4, 66. [Google Scholar] [CrossRef] [PubMed]
- Khanmohammadi, S.; Rezaei, N. Role of Toll-like receptors in the pathogenesis of COVID-19. J. Med. Virol. 2021, 93, 2735–2739. [Google Scholar] [CrossRef] [PubMed]
- Ayanian, S.; Reyes, J.; Lynn, L.; Teufel, K. The association between biomarkers and clinical outcomes in novel coronavirus pneumonia in a US cohort. Biomark. Med. 2020, 14, 1091–1097. [Google Scholar] [CrossRef] [PubMed]
- Phend, C. COVID-19: Abnormal Clotting Common in More Severe Disease. 2020. Available online: https://www.medpagetoday.com/infectiousdisease/covid19/85577 (accessed on 15 December 2021).
- Mamoshina, P.; Volosnikova, M.; Ozerov, I.V.; Putin, E.; Skibina, E.; Cortese, F.; Zhavoronkov, A. Machine learning on human muscle transcriptomic data for biomarker discovery and tissue-specific drug target identification. Front. Genet. 2018, 9, 242. [Google Scholar] [CrossRef] [PubMed]
- Swan, A.L.; Mobasheri, A.; Allaway, D.; Liddell, S.; Bacardit, J. Application of machine learning to proteomics data: Classification and biomarker identification in postgenomics biology. Omics J. Integr. Biol. 2013, 17, 595–610. [Google Scholar] [CrossRef] [PubMed] [Green Version]
- Harris, C.R.; Millman, K.J.; van der Walt, S.J.; Gommers, R.; Virtanen, P.; Cournapeau, D.; Wieser, E.; Taylor, J.; Berg, S.; Smith, N.J.; et al. Array programming with NumPy. Nature 2020, 585, 357–362. [Google Scholar] [CrossRef] [PubMed]
- McKinney, W. Pandas: A foundational Python library for data analysis and statistics. Python High Perform. Sci. Comput. 2011, 14, 1–9. [Google Scholar]
- Feurer, M.; Klein, A.; Eggensperger, K.; Springenberg, J.T.; Blum, M.; Hutter, F. Auto-sklearn: Efficient and robust automated machine learning. In Automated Machine Learning; Springer: Cham, Switzerland, 2019; pp. 113–134. [Google Scholar]
- Gulli, A.; Pal, S. Deep Learning with Keras; Packt Publishing Ltd.: Birmingham, UK, 2017. [Google Scholar]
- Al Shalabi, L.; Shaaban, Z. Normalization as a preprocessing engine for data mining and the approach of preference matrix. In Proceedings of the 2006 International Conference on Dependability of Computer Systems, Szklarska Poreba, Poland, 25–27 May 2006; pp. 207–214. [Google Scholar]
- Stekhoven, D.J.; Bühlmann, P. MissForest—non-parametric missing value imputation for mixed-type data. Bioinformatics 2012, 28, 112–118. [Google Scholar] [CrossRef] [PubMed] [Green Version]
- Du, Y.; Leung, J.; Shi, Y. PerturbationRank: A Non-Monotone Ranking Algorithm; Tech. Report; University of Michigan: Ann Arbor, MI, USA, 2008. [Google Scholar]
- Cordeiro, G.M.; de Paula Ferrari, S.L. A modified score test statistic having chi-squared distribution to order n 1. Biometrika 1991, 78, 573–582. [Google Scholar]
- Nayini SE, Y.; Geravand, S.; Maroosi, A. A novel threshold-based clustering method to solve K-means weaknesses. In Proceedings of the 2017 International Conference on Energy, Communication, Data Analytics and Soft Computing, Chennai, India, 1–2 August 2017; pp. 47–52. [Google Scholar]
- Myrstad, M.; Ihle-Hansen, H.; Tveita, A.A.; Andersen, E.L.; Nygård, S.; Tveit, A.; Berge, T. National Early Warning Score 2 (NEWS2) on admission predicts severe disease and in-hospital mortality from Covid-19–a prospective cohort study. Scand. J. Trauma Resusc. Emerg. Med. 2020, 28, 66. [Google Scholar] [CrossRef] [PubMed]
- Guo, J.; Zhou, B.; Zhu, M.; Yuan, Y.; Wang, Q.; Zhou, H.; Wang, X.; Lv, T.; Li, S.; Liu, P.; et al. CURB-65 may serve as a useful prognostic marker in COVID-19 patients within Wuhan, China: A retrospective cohort study. Epidemiology Infect. 2020, 148, e241. [Google Scholar] [CrossRef] [PubMed]
- Knight, S.R.; Ho, A.; Pius, R.; Buchan, I.; Carson, G.; Drake, T.M.; Harrison, E.M. Risk stratification of patients admitted to hospital with covid-19 using the ISARIC WHO Clinical Characterisation Protocol: Development and validation of the 4C Mortality Score. BMJ 2020, 370, m3339. [Google Scholar] [CrossRef] [PubMed]
- Haimovich, A.D.; Ravindra, N.G.; Stoytchev, S.; Young, H.P.; Wilson, F.P.; van Dijk, D.; Taylor, R.A. Development and validation of the quick COVID-19 severity index: A prognostic tool for early clinical decompensation. Ann. Emerg. Med. 2020, 76, 442–453. [Google Scholar] [CrossRef] [PubMed]
- Cerqua, A.; Di Stefano, R.; Letta, M.; Miccoli, S. Local mortality estimates during the COVID-19 pandemic in Italy. J. Popul. Econ. 2021, 34, 1189–1217. [Google Scholar] [CrossRef] [PubMed]
- Bilal, B.; Saleem, F.; Fatima, S.S. Alcohol consumption and obesity: The hidden scare with COVID-19 severity. Med. Hypotheses 2020, 144, 110272. [Google Scholar] [CrossRef] [PubMed]
| Publisher’s Note: MDPI stays neutral with regard to jurisdictional claims in published maps and institutional affiliations. |
© 2022 by the authors. Licensee MDPI, Basel, Switzerland. This article is an open access article distributed under the terms and conditions of the Creative Commons Attribution (CC BY) license (https://creativecommons.org/licenses/by/4.0/).


 ,
, 


