
Breast Cancer Subtypes and Quantitative Magnetic Resonance Imaging: A Systemic Review


Abstract
:1. Introduction
2. Materials and Methods
2.1. Protocol Registration
2.2. Search Strategy
2.3. Inclusion and Exclusion Criteria
2.4. Article Selection and Data Extraction
2.5. Quality Assessment
2.6. Data Synthesis
3. Results
3.1. Literature Search
3.2. Study Characteristics
3.3. Methodological Quality of the Included Studies
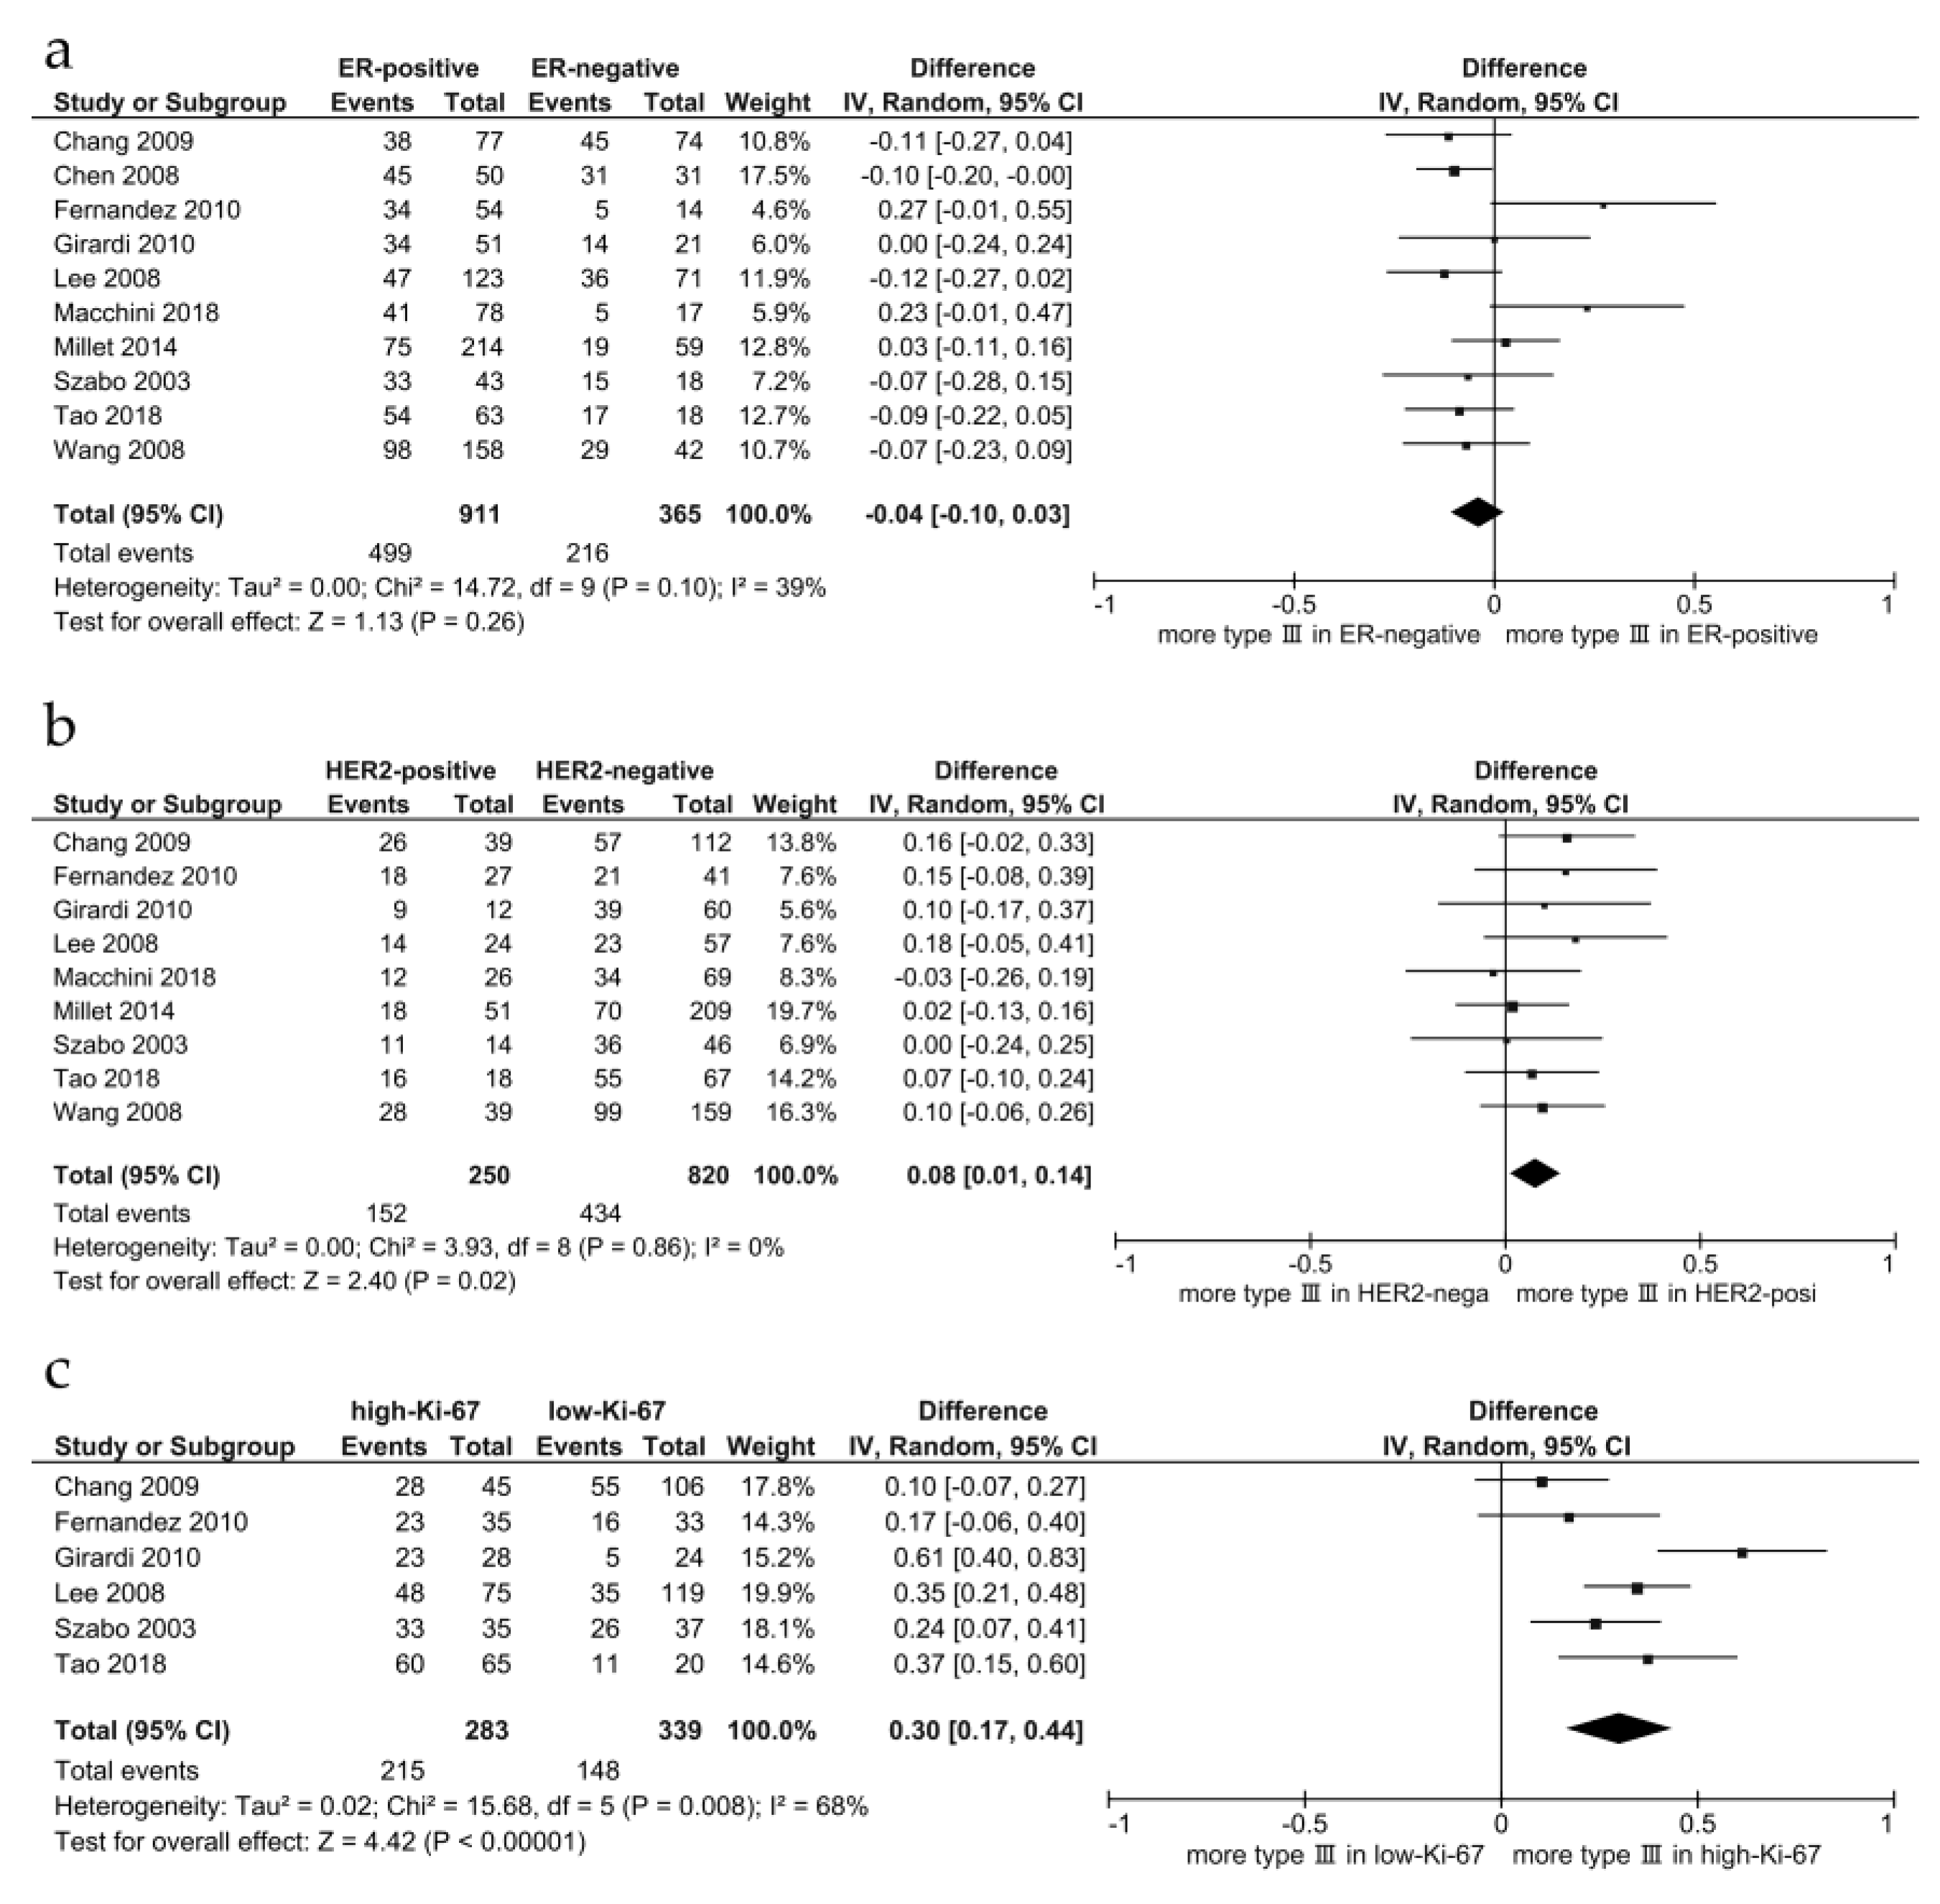
3.4. Dynamic Contrast-Enhanced-Magnetic Resonance Imaging
3.5. Diffusion-Weighted MR Images
3.5.1. Apparent Diffusion Coefficient
3.5.2. Intravoxel Incoherent Motion
3.5.3. Diffusion Tensor Imaging
3.6. Relaxation Time
3.7. Magnetic Resonance Spectroscopy
4. Discussion
4.1. DCE-MRI
4.2. DWI
4.3. Relaxation Time and T2-Weighted Images
4.4. Luminal-Type Breast Cancer
4.5. HER2-Enriched Subtype
4.6. TN Breast Cancer
4.7. Limitations
5. Conclusions
Author Contributions
Funding
Institutional Review Board Statement
Informed Consent Statement
Data Availability Statement
Conflicts of Interest
References
- Siegel, R.L.; Miller, K.D.; Fuchs, H.E.; Jemal, A. Cancer Statistics. CA Cancer J. Clin. 2021, 71, 7–33. [Google Scholar] [CrossRef] [PubMed]
- Coates, A.S.; Winer, E.P.; Goldhirsch, A.; Gelber, R.D.; Gnant, M.; Piccart-Gebhart, M.; Thurlimann, B.; Senn, H.J.; Panel, M. Tailoring therapies—Improving the management of early breast cancer: St Gallen International Expert Consensus on the Primary Therapy of Early Breast Cancer. Ann. Oncol. 2015, 26, 1533–1546. [Google Scholar] [CrossRef] [PubMed]
- Goldhirsch, A.; Winer, E.P.; Coates, A.S.; Gelber, R.D.; Piccart-Gebhart, M.; Thurlimann, B.; Senn, H.J.; Panel, M. Personalizing the treatment of women with early breast cancer: Highlights of the St Gallen International Expert Consensus on the Primary Therapy of Early Breast Cancer. Ann. Oncol. 2013, 24, 2206–2223. [Google Scholar] [CrossRef] [PubMed]
- Waks, A.G.; Winer, E.P. Breast Cancer Treatment: A Review. JAMA 2019, 321, 288–300. [Google Scholar] [CrossRef] [PubMed]
- Niikura, N.; Masuda, S.; Kumaki, N.; Xiaoyan, T.; Terada, M.; Terao, M.; Iwamoto, T.; Oshitanai, R.; Morioka, T.; Tuda, B.; et al. Prognostic significance of the Ki67 scoring categories in breast cancer subgroups. Clin. Breast Cancer 2014, 14, e323–e329. [Google Scholar] [CrossRef]
- Elias, S.G.; Adams, A.; Wisner, D.J.; Esserman, L.J.; van’t Veer, L.J.; Mali, W.P.; Gilhuijs, K.G.; Hylton, N.M. Imaging features of HER2 overexpression in breast cancer: A systematic review and meta-analysis. Cancer Epidemiol. Biomark. Prev. 2014, 23, 1464–1483. [Google Scholar] [CrossRef] [Green Version]
- Kumar, R.; Yarmand-Bagheri, R. The role of HER2 in angiogenesis. Semin. Oncol. 2001, 28, 27–32. [Google Scholar] [CrossRef]
- Zhao, M.; Fu, K.; Zhang, L.; Guo, W.; Wu, Q.; Bai, X.; Li, Z.; Guo, Q.; Tian, J. Intravoxel incoherent motion magnetic resonance imaging for breast cancer: A comparison with benign lesions and evaluation of heterogeneity in different tumor regions with prognostic factors and molecular classification. Oncol. Lett. 2018, 16, 5100–5112. [Google Scholar] [CrossRef] [Green Version]
- Fulford, L.G.; Easton, D.F.; Reis-Filho, J.S.; Sofronis, A.; Gillett, C.E.; Lakhani, S.R.; Hanby, A. Specific morphological features predictive for the basal phenotype in grade 3 invasive ductal carcinoma of breast. Histopathology 2006, 49, 22–34. [Google Scholar] [CrossRef]
- Livasy, C.A.; Karaca, G.; Nanda, R.; Tretiakova, M.S.; Olopade, O.I.; Moore, D.T.; Perou, C.M. Phenotypic evaluation of the basal-like subtype of invasive breast carcinoma. Mod. Pathol. 2006, 19, 264–271. [Google Scholar] [CrossRef]
- Foulkes, W.D.; Smith, I.E.; Reis-Filho, J.S. Triple-Negative Breast Cancer. N. Engl. J. Med. 2010, 363, 1938–1948. [Google Scholar] [CrossRef] [PubMed] [Green Version]
- Niikura, N.; Liu, J.; Hayashi, N.; Mittendorf, E.A.; Gong, Y.; Palla, S.L.; Tokuda, Y.; Gonzalez-Angulo, A.M.; Hortobagyi, G.N.; Ueno, N. Loss of human epidermal growth factor receptor 2 (HER2) expression in metastatic sites of HER2-overexpressing primary breast tumors. J. Clin. Oncol. 2012, 30, 593–599. [Google Scholar] [CrossRef] [PubMed] [Green Version]
- Niikura, N.; Tomotaki, A.; Miyata, H.; Iwamoto, T.; Kawai, M.; Anan, K.; Hayashi, N.; Aogi, K.; Ishida, T.; Masuoka, H.; et al. Changes in tumor expression of HER2 and hormone receptors status after neoadjuvant chemotherapy in 21,755 patients from the Japanese breast cancer registry. Ann. Oncol. 2016, 27, 480–487. [Google Scholar] [CrossRef] [PubMed]
- Kuhl, C. The current status of breast MR imaging. Part I. Choice of technique, image interpretation, diagnostic accuracy, and transfer to clinical practice. Radiology 2007, 244, 356–378. [Google Scholar] [CrossRef]
- Kuhl, C.K. The Changing World of Breast Cancer: A Radiologist’s Perspective. Investig. Radiol. 2015, 50, 615–628. [Google Scholar] [CrossRef] [Green Version]
- Page, M.J.; Moher, D.; Bossuyt, P.M.; Boutron, I.; Hoffmann, T.C.; Mulrow, C.D.; Shamseer, L.; Tetzlaff, J.M.; Akl, E.A.; Brennan, S.E.; et al. PRISMA 2020 explanation and elaboration: Updated guidance and exemplars for reporting systematic reviews. BMJ 2021, 372, n160. [Google Scholar] [CrossRef]
- Whiting, P.F.; Rutjes, A.W.; Westwood, M.E.; Mallett, S.; Deeks, J.J.; Reitsma, J.B.; Leeflang, M.M.; Sterne, J.A.; Bossuyt, P.M. QUADAS-2: A revised tool for the quality assessment of diagnostic accuracy studies. Ann. Intern. Med. 2011, 155, 529–536. [Google Scholar] [CrossRef]
- Goldhirsch, A.; Wood, W.C.; Coates, A.S.; Gelber, R.D.; Thurlimann, B.; Senn, H.J.; Panel, M. Strategies for subtypes—Dealing with the diversity of breast cancer: Highlights of the St. Gallen International Expert Consensus on the Primary Therapy of Early Breast Cancer 2011. Ann. Oncol. 2011, 22, 1736–1747. [Google Scholar] [CrossRef]
- Szabo, B.K.; Aspelin, P.; Kristoffersen Wiberg, M.; Tot, T.; Bone, B. Invasive breast cancer: Correlation of dynamic MR features with prognostic factors. Eur. Radiol. 2003, 13, 2425–2435. [Google Scholar] [CrossRef]
- Lee, S.H.; Cho, N.; Kim, S.J.; Cha, J.H.; Cho, K.S.; Ko, E.S.; Moon, W.K. Correlation between high resolution dynamic MR features and prognostic factors in breast cancer. Korean J. Radiol. 2008, 9, 10–18. [Google Scholar] [CrossRef] [Green Version]
- Chen, J.H.; Baek, H.M.; Nalcioglu, O.; Su, M.Y. Estrogen receptor and breast MR imaging features: A correlation study. J. Magn. Reson Imaging 2008, 27, 825–833. [Google Scholar] [CrossRef] [PubMed] [Green Version]
- Makkat, S.; Luypaert, R.; Stadnik, T.; Bourgain, C.; Sourbron, S.; Dujardin, M.; De Greve, J.; De Mey, J. Deconvolution-based dynamic contrast-enhanced MR imaging of breast tumors: Correlation of tumor blood flow with human epidermal growth factor receptor 2 status and clinicopathologic findings—Preliminary results. Radiology 2008, 249, 471–482. [Google Scholar] [CrossRef] [PubMed]
- Girardi, V.; Carbognin, G.; Camera, L.; Tonegutti, M.; Bonetti, F.; Manfrin, E.; Pozzi Mucelli, R. Fischer’s score criteria correlating with histopathological prognostic factors in invasive breast cancer. Radiol. Med. 2010, 115, 421–433. [Google Scholar] [CrossRef] [PubMed]
- Chang, Y.W.; Kwon, K.H.; Choi, D.L.; Lee, D.W.; Lee, M.H.; Lee, H.K.; Yang, S.B.; Kim, Y.; Seo, D.Y. Magnetic resonance imaging of breast cancer and correlation with prognostic factors. Acta Radiol. 2009, 50, 990–998. [Google Scholar] [CrossRef] [PubMed]
- Fernández-Guinea, O.; Andicoechea, A.; González, L.O.; González-Reyes, S.; Merino, A.M.; Hernández, L.C.; López-Muñiz, A.; García-Pravia, P.; Vizoso, F.J. Relationship between morphological features and kinetic patterns of enhancement of the dynamic breast magnetic resonance imaging and clinico-pathological and biological factors in invasive breast cancer. BMC Cancer 2010, 10, 8. [Google Scholar] [CrossRef] [PubMed] [Green Version]
- Li, S.P.; Taylor, N.J.; Makris, A.; Ah-See, M.L.; Beresford, M.J.; Stirling, J.J.; d’Arcy, J.A.; Collins, D.J.; Padhani, A.R. Primary human breast adenocarcinoma: Imaging and histologic correlates of intrinsic susceptibility-weighted MR imaging before and during chemotherapy. Radiology 2010, 257, 643–652. [Google Scholar] [CrossRef]
- Li, S.P.; Padhani, A.R.; Taylor, N.J.; Beresford, M.J.; Ah-See, M.L.; Stirling, J.J.; d’Arcy, J.A.; Collins, D.J.; Makris, A. Vascular characterisation of triple negative breast carcinomas using dynamic MRI. Eur. Radiol. 2011, 21, 1364–1373. [Google Scholar] [CrossRef]
- Koo, H.R.; Cho, N.; Song, I.C.; Kim, H.; Chang, J.M.; Yi, A.; Yun, B.L.; Moon, W.K. Correlation of perfusion parameters on dynamic contrast-enhanced MRI with prognostic factors and subtypes of breast cancers. J. Magn. Reson. Imaging 2012, 36, 145–151. [Google Scholar] [CrossRef]
- Youk, J.H.; Son, E.J.; Chung, J.; Kim, J.A.; Kim, E.K. Triple-negative invasive breast cancer on dynamic contrast-enhanced and diffusion-weighted MR imaging: Comparison with other breast cancer subtypes. Eur. Radiol. 2012, 22, 1724–1734. [Google Scholar] [CrossRef]
- Millet, I.; Curros-Doyon, F.; Molinari, N.; Bouic-Pages, E.; Prat, X.; Alili, C.; Taourel, P. Invasive breast carcinoma: Influence of prognosis and patient-related factors on kinetic MR imaging characteristics. Radiology 2014, 270, 57–66. [Google Scholar] [CrossRef]
- Yamaguchi, K.; Abe, H.; Newstead, G.M.; Egashira, R.; Nakazono, T.; Imaizumi, T.; Irie, H. Intratumoral heterogeneity of the distribution of kinetic parameters in breast cancer: Comparison based on the molecular subtypes of invasive breast cancer. Breast Cancer 2015, 22, 496–502. [Google Scholar] [CrossRef] [PubMed]
- Kawashima, H.; Inokuchi, M.; Furukawa, H.; Ikeda, H.; Kitamura, S. Magnetic resonance imaging features of breast cancer according to intrinsic subtypes: Correlations with neoadjuvant chemotherapy effects. Springerplus 2014, 3, 240. [Google Scholar] [CrossRef] [PubMed] [Green Version]
- Mazurowski, M.A.; Zhang, J.; Grimm, L.J.; Yoon, S.C.; Silber, J.I. Radiogenomic analysis of breast cancer: Luminal B molecular subtype is associated with enhancement dynamics at MR imaging. Radiology 2014, 273, 365–372. [Google Scholar] [CrossRef] [PubMed]
- Li, L.; Wang, K.; Sun, X.; Wang, K.; Sun, Y.; Zhang, G.; Shen, B. Parameters of dynamic contrast-enhanced MRI as imaging markers for angiogenesis and proliferation in human breast cancer. Med. Sci. Monit. 2015, 21, 376–382. [Google Scholar]
- Leong, L.C.; Gombos, E.C.; Jagadeesan, J.; Fook-Chong, S.M. MRI kinetics with volumetric analysis in correlation with hormonal receptor subtypes and histologic grade of invasive breast cancers. AJR Am. J. Roentgenol. 2015, 204, W348–W356. [Google Scholar] [CrossRef] [PubMed] [Green Version]
- Blaschke, E.; Abe, H. MRI phenotype of breast cancer: Kinetic assessment for molecular subtypes. J. Magn. Reson. Imaging 2015, 42, 920–924. [Google Scholar] [CrossRef]
- Lee, H.S.; Kim, S.H.; Kang, B.J.; Baek, J.E.; Song, B.J. Perfusion Parameters in Dynamic Contrast-enhanced MRI and Apparent Diffusion Coefficient Value in Diffusion-weighted MRI:: Association with Prognostic Factors in Breast Cancer. Acad. Radiol. 2016, 23, 446–456. [Google Scholar] [CrossRef]
- Shin, J.K.; Kim, J.Y. Dynamic contrast-enhanced and diffusion-weighted MRI of estrogen receptor-positive invasive breast cancers: Associations between quantitative MR parameters and Ki-67 proliferation status. J. Magn. Reson. Imaging 2017, 45, 94–102. [Google Scholar] [CrossRef]
- Catalano, O.A.; Horn, G.L.; Signore, A.; Iannace, C.; Lepore, M.; Vangel, M.; Luongo, A.; Catalano, M.; Lehman, C.; Salvatore, M.; et al. PET/MR in invasive ductal breast cancer: Correlation between imaging markers and histological phenotype. Br. J. Cancer 2017, 116, 893–902. [Google Scholar] [CrossRef] [Green Version]
- Caiazzo, C.; Di Micco, R.; Esposito, E.; Sollazzo, V.; Cervotti, M.; Varelli, C.; Forestieri, P.; Limite, G. The role of MRI in predicting Ki-67 in breast cancer: Preliminary results from a prospective study. Tumori 2018, 104, 438–443. [Google Scholar] [CrossRef]
- Kawashima, H.; Miyati, T.; Ohno, N.; Ohno, M.; Inokuchi, M.; Ikeda, H.; Gabata, T. Differentiation Between Luminal-A and Luminal-B Breast Cancer Using Intravoxel Incoherent Motion and Dynamic Contrast-Enhanced Magnetic Resonance Imaging. Acad. Radiol. 2017, 24, 1575–1581. [Google Scholar] [CrossRef] [PubMed]
- Trimboli, R.M.; Codari, M.; Khouri Chalouhi, K.; Ioan, I.; Lo Bue, G.; Ottini, A.; Casolino, D.; Carbonaro, L.A.; Sardanelli, F. Correlation between voxel-wise enhancement parameters on DCE-MRI and pathological prognostic factors in invasive breast cancers. Radiol. Med. 2018, 123, 91–97. [Google Scholar] [CrossRef] [PubMed]
- Wang, C.; Wei, W.; Santiago, L.; Whitman, G.; Dogan, B. Can imaging kinetic parameters of dynamic contrast-enhanced magnetic resonance imaging be valuable in predicting clinicopathological prognostic factors of invasive breast cancer? Acta Radiol. 2018, 59, 813–821. [Google Scholar] [CrossRef]
- Heacock, L.; Lewin, A.A.; Gao, Y.; Babb, J.S.; Heller, S.L.; Melsaether, A.N.; Bagadiya, N.; Kim, S.G.; Moy, L. Feasibility analysis of early temporal kinetics as a surrogate marker for breast tumor type, grade, and aggressiveness. J. Magn. Reson. Imaging 2018, 47, 1692–1700. [Google Scholar] [CrossRef] [PubMed]
- Incoronato, M.; Grimaldi, A.M.; Cavaliere, C.; Inglese, M.; Mirabelli, P.; Monti, S.; Ferbo, U.; Nicolai, E.; Soricelli, A.; Catalano, O.A.; et al. Relationship between functional imaging and immunohistochemical markers and prediction of breast cancer subtype: A PET/MRI study. Eur. J. Nucl. Med. Mol. Imaging 2018, 45, 1680–1693. [Google Scholar] [CrossRef]
- Macchini, M.; Ponziani, M.; Iamurri, A.P.; Pistelli, M.; De Lisa, M.; Berardi, R.; Giuseppetti, G.M. Role of DCE-MR in predicting breast cancer subtypes. Radiol. Med. 2018, 123, 753–764. [Google Scholar] [CrossRef]
- Tao, W.; Hu, C.; Bai, G.; Zhu, Y.; Zhu, Y. Correlation between the dynamic contrast-enhanced MRI features and prognostic factors in breast cancer: A retrospective case-control study. Medicine 2018, 97, e11530. [Google Scholar] [CrossRef]
- Nagasaka, K.; Satake, H.; Ishigaki, S.; Kawai, H.; Naganawa, S. Histogram analysis of quantitative pharmacokinetic parameters on DCE-MRI: Correlations with prognostic factors and molecular subtypes in breast cancer. Breast Cancer 2019, 26, 113–124. [Google Scholar] [CrossRef]
- Gigli, S.; Amabile, M.I.; David, E.; De Luca, A.; Grippo, C.; Manganaro, L.; Monti, M.; Ballesio, L. Morphological and Semiquantitative Kinetic Analysis on Dynamic Contrast Enhanced MRI in Triple Negative Breast Cancer Patients. Acad. Radiol. 2019, 26, 620–625. [Google Scholar] [CrossRef]
- Montemezzi, S.; Camera, L.; Giri, M.G.; Pozzetto, A.; Calio, A.; Meliado, G.; Caumo, F.; Cavedon, C. Is there a correlation between 3T multiparametric MRI and molecular subtypes of breast cancer? Eur. J. Radiol. 2018, 108, 120–127. [Google Scholar] [CrossRef]
- Xie, T.; Zhao, Q.; Fu, C.; Bai, Q.; Zhou, X.; Li, L.; Grimm, R.; Liu, L.; Gu, Y.; Peng, W. Differentiation of triple-negative breast cancer from other subtypes through whole-tumor histogram analysis on multiparametric MR imaging. Eur. Radiol. 2019, 29, 2535–2544. [Google Scholar] [CrossRef] [PubMed]
- Song, S.E.; Cho, K.R.; Seo, B.K.; Woo, O.H.; Park, K.H.; Son, Y.H.; Grimm, R. Intravoxel incoherent motion diffusion-weighted MRI of invasive breast cancer: Correlation with prognostic factors and kinetic features acquired with computer-aided diagnosis. J. Magn. Reson. Imaging 2019, 49, 118–130. [Google Scholar] [CrossRef] [PubMed] [Green Version]
- Yuan, C.; Jin, F.; Guo, X.; Zhao, S.; Li, W.; Guo, H. Correlation Analysis of Breast Cancer DWI Combined with DCE-MRI Imaging Features with Molecular Subtypes and Prognostic Factors. J. Med. Syst. 2019, 43, 83. [Google Scholar] [CrossRef] [PubMed]
- Dilorenzo, G.; Telegrafo, M.; La Forgia, D.; Stabile Ianora, A.A.; Moschetta, M. Breast MRI background parenchymal enhancement as an imaging bridge to molecular cancer sub-type. Eur. J. Radiol. 2019, 113, 148–152. [Google Scholar] [CrossRef] [PubMed]
- Li, J.; Mo, Y.; He, B.; Gao, Q.; Luo, C.; Peng, C.; Zhao, W.; Ma, Y.; Yang, Y. Association between MRI background parenchymal enhancement and lymphovascular invasion and estrogen receptor status in invasive breast cancer. Br. J. Radiol. 2019, 92, 20190417. [Google Scholar] [CrossRef] [PubMed]
- Sun, K.; Zhu, H.; Chai, W.; Zhan, Y.; Nickel, D.; Grimm, R.; Fu, C.; Yan, F. Whole-lesion histogram and texture analyses of breast lesions on inline quantitative DCE mapping with CAIPIRINHA-Dixon-TWIST-VIBE. Eur. Radiol. 2020, 30, 57–65. [Google Scholar] [CrossRef] [PubMed]
- Matsuda, M.; Kido, T.; Tsuda, T.; Okada, K.; Shiraishi, Y.; Suekuni, H.; Kamei, Y.; Kitazawa, R.; Mochizuki, T. Utility of synthetic MRI in predicting the Ki-67 status of oestrogen receptor-positive breast cancer: A feasibility study. Clin. Radiol. 2020, 75, e391–e398. [Google Scholar] [CrossRef] [Green Version]
- Shin, S.U.; Cho, N.; Kim, S.Y.; Lee, S.H.; Chang, J.M.; Moon, W.K. Time-to-enhancement at ultrafast breast DCE-MRI: Potential imaging biomarker of tumour aggressiveness. Eur. Radiol. 2020, 30, 4058–4068. [Google Scholar] [CrossRef]
- Onishi, N.; Sadinski, M.; Hughes, M.C.; Ko, E.S.; Gibbs, P.; Gallagher, K.M.; Fung, M.M.; Hunt, T.J.; Martinez, D.F.; Shukla-Dave, A.; et al. Ultrafast dynamic contrast-enhanced breast MRI may generate prognostic imaging markers of breast cancer. Breast Cancer Res. 2020, 22, 58. [Google Scholar] [CrossRef]
- Yamaguchi, K.; Nakazono, T.; Egashira, R.; Fukui, S.; Baba, K.; Hamamoto, T.; Irie, H. Maximum slope of ultrafast dynamic contrast-enhanced MRI of the breast: Comparisons with prognostic factors of breast cancer. Jpn. J. Radiol. 2021, 39, 246–253. [Google Scholar] [CrossRef]
- Du, S.; Gao, S.; Zhang, L.; Yang, X.; Qi, X.; Li, S. Improved discrimination of molecular subtypes in invasive breast cancer: Comparison of multiple quantitative parameters from breast MRI. Magn. Reson. Imaging 2021, 77, 148–158. [Google Scholar] [CrossRef] [PubMed]
- Pelissier, M.; Ambarki, K.; Salleron, J.; Henrot, P. Maximum slope using ultrafast breast DCE-MRI at 1.5 Tesla: A potential tool for predicting breast lesion aggressiveness. Eur. Radiol. 2021, 31, 9556–9566. [Google Scholar] [CrossRef] [PubMed]
- You, C.; Zhang, Y.; Chen, Y.; Hu, X.; Hu, D.; Wu, J.; Gu, Y.; Peng, W. Evaluation of Background Parenchymal Enhancement and Histogram-Based Diffusion-Weighted Image in Determining the Molecular Subtype of Breast Cancer. J. Comput. Assist. Tomogr. 2021, 45, 711–716. [Google Scholar] [CrossRef] [PubMed]
- Song, S.E.; Cho, K.R.; Seo, B.K.; Woo, O.H.; Jung, S.P.; Sung, D.J. Kinetic Features of Invasive Breast Cancers on Computer-Aided Diagnosis Using 3T MRI Data: Correlation with Clinical and Pathologic Prognostic Factors. Korean J. Radiol. 2019, 20, 411–421. [Google Scholar] [CrossRef]
- Tofts, P.S.; Brix, G.; Buckley, D.L.; Evelhoch, J.L.; Henderson, E.; Knopp, M.V.; Larsson, H.B.; Lee, T.Y.; Mayr, N.A.; Parker, G.J.; et al. Estimating kinetic parameters from dynamic contrast-enhanced T(1)-weighted MRI of a diffusable tracer: Standardized quantities and symbols. J. Magn. Reson. Imaging 1999, 10, 223–232. [Google Scholar] [CrossRef]
- Meyer, H.-J.; Wienke, A.; Surov, A. Diffusion-Weighted Imaging of Different Breast Cancer Molecular Subtypes: A Systematic Review and Meta-Analysis. Breast Care 2021, 17, 1–8. [Google Scholar] [CrossRef]
- Surov, A.; Meyer, H.J.; Wienke, A. Associations between apparent diffusion coefficient (ADC) and KI 67 in different tumors: A meta-analysis. Part 1: ADCmean. Oncotarget 2017, 8, 75434–75444. [Google Scholar] [CrossRef] [Green Version]
- Kim, S.H.; Cha, E.S.; Kim, H.S.; Kang, B.J.; Choi, J.J.; Jung, J.H.; Park, Y.G.; Suh, Y.J. Diffusion-weighted imaging of breast cancer: Correlation of the apparent diffusion coefficient value with prognostic factors. J. Magn. Reson. Imaging 2009, 30, 615–620. [Google Scholar] [CrossRef]
- Jeh, S.K.; Kim, S.H.; Kim, H.S.; Kang, B.J.; Jeong, S.H.; Yim, H.W.; Song, B.J. Correlation of the apparent diffusion coefficient value and dynamic magnetic resonance imaging findings with prognostic factors in invasive ductal carcinoma. J. Magn. Reson. Imaging 2011, 33, 102–109. [Google Scholar] [CrossRef]
- Choi, B.B.; Kim, S.H.; Kang, B.J.; Lee, J.H.; Song, B.J.; Jeong, S.H.; Yim, H.W. Diffusion-weighted imaging and FDG PET/CT: Predicting the prognoses with apparent diffusion coefficient values and maximum standardized uptake values in patients with invasive ductal carcinoma. World J. Surg. Oncol. 2012, 10, 126. [Google Scholar] [CrossRef] [Green Version]
- Martincich, L.; Deantoni, V.; Bertotto, I.; Redana, S.; Kubatzki, F.; Sarotto, I.; Rossi, V.; Liotti, M.; Ponzone, R.; Aglietta, M.; et al. Correlations between diffusion-weighted imaging and breast cancer biomarkers. Eur. Radiol. 2012, 22, 1519–1528. [Google Scholar] [CrossRef] [PubMed]
- Richard, R.; Thomassin, I.; Chapellier, M.; Scemama, A.; de Cremoux, P.; Varna, M.; Giacchetti, S.; Espie, M.; de Kerviler, E.; de Bazelaire, C. Diffusion-weighted MRI in pretreatment prediction of response to neoadjuvant chemotherapy in patients with breast cancer. Eur. Radiol. 2013, 23, 2420–2431. [Google Scholar] [CrossRef] [PubMed]
- Park, S.H.; Choi, H.Y.; Hahn, S.Y. Correlations between apparent diffusion coefficient values of invasive ductal carcinoma and pathologic factors on diffusion-weighted MRI at 3.0 Tesla. J. Magn. Reson. Imaging 2015, 41, 175–182. [Google Scholar] [CrossRef] [PubMed]
- Baba, S.; Isoda, T.; Maruoka, Y.; Kitamura, Y.; Sasaki, M.; Yoshida, T.; Honda, H. Diagnostic and prognostic value of pretreatment SUV in 18F-FDG/PET in breast cancer: Comparison with apparent diffusion coefficient from diffusion-weighted MR imaging. J. Nucl. Med. 2014, 55, 736–742. [Google Scholar] [CrossRef] [Green Version]
- Miyake, K.K.; Nakamoto, Y.; Kanao, S.; Tanaka, S.; Sugie, T.; Mikami, Y.; Toi, M.; Togashi, K. Journal Club: Diagnostic value of (18)F-FDG PET/CT and MRI in predicting the clinicopathologic subtypes of invasive breast cancer. AJR Am. J. Roentgenol. 2014, 203, 272–279. [Google Scholar] [CrossRef]
- De Felice, C.; Cipolla, V.; Guerrieri, D.; Santucci, D.; Musella, A.; Porfiri, L.M.; Meggiorini, M.L. Apparent diffusion coefficient on 3.0 Tesla magnetic resonance imaging and prognostic factors in breast cancer. Eur. J. Gynaecol. Oncol. 2014, 35, 408–414. [Google Scholar]
- Mori, N.; Ota, H.; Mugikura, S.; Takasawa, C.; Ishida, T.; Watanabe, G.; Tada, H.; Watanabe, M.; Takase, K.; Takahashi, S. Luminal-type breast cancer: Correlation of apparent diffusion coefficients with the Ki-67 labeling index. Radiology 2015, 274, 66–73. [Google Scholar] [CrossRef]
- Liu, S.; Ren, R.; Chen, Z.; Wang, Y.; Fan, T.; Li, C.; Zhang, P. Diffusion-weighted imaging in assessing pathological response of tumor in breast cancer subtype to neoadjuvant chemotherapy. J. Magn. Reson. Imaging 2015, 42, 779–787. [Google Scholar] [CrossRef]
- Molinari, C.; Clauser, P.; Girometti, R.; Linda, A.; Cimino, E.; Puglisi, F.; Zuiani, C.; Bazzocchi, M. MR mammography using diffusion-weighted imaging in evaluating breast cancer: A correlation with proliferation index. Radiol. Med. 2015, 120, 911–918. [Google Scholar] [CrossRef] [Green Version]
- Kim, E.J.; Kim, S.H.; Park, G.E.; Kang, B.J.; Song, B.J.; Kim, Y.J.; Lee, D.; Ahn, H.; Kim, I.; Son, Y.H.; et al. Histogram analysis of apparent diffusion coefficient at 3.0t: Correlation with prognostic factors and subtypes of invasive ductal carcinoma. J. Magn. Reson. Imaging 2015, 42, 1666–1678. [Google Scholar] [CrossRef]
- Sun, K.; Chen, X.; Chai, W.; Fei, X.; Fu, C.; Yan, X.; Zhan, Y.; Chen, K.; Shen, K.; Yan, F. Breast Cancer: Diffusion Kurtosis MR Imaging-Diagnostic Accuracy and Correlation with Clinical-Pathologic Factors. Radiology 2015, 277, 46–55. [Google Scholar] [CrossRef] [PubMed] [Green Version]
- Arponen, O.; Sudah, M.; Masarwah, A.; Taina, M.; Rautiainen, S.; Kononen, M.; Sironen, R.; Kosma, V.M.; Sutela, A.; Hakumaki, J.; et al. Diffusion-Weighted Imaging in 3.0 Tesla Breast MRI: Diagnostic Performance and Tumor Characterization Using Small Subregions vs. Whole Tumor Regions of Interest. PLoS ONE 2015, 10, e0138702. [Google Scholar]
- Cho, G.Y.; Moy, L.; Kim, S.G.; Baete, S.H.; Moccaldi, M.; Babb, J.S.; Sodickson, D.K.; Sigmund, E.E. Evaluation of breast cancer using intravoxel incoherent motion (IVIM) histogram analysis: Comparison with malignant status, histological subtype, and molecular prognostic factors. Eur. Radiol. 2016, 26, 2547–2558. [Google Scholar] [CrossRef]
- Karan, B.; Pourbagher, A.; Torun, N. Diffusion-weighted imaging and (18) F-fluorodeoxyglucose positron emission tomography/computed tomography in breast cancer: Correlation of the apparent diffusion coefficient and maximum standardized uptake values with prognostic factors. J. Magn. Reson. Imaging 2016, 43, 1434–1444. [Google Scholar] [CrossRef] [PubMed]
- Kato, F.; Kudo, K.; Yamashita, H.; Wang, J.; Hosoda, M.; Hatanaka, K.C.; Mimura, R.; Oyama-Manabe, N.; Shirato, H. Differences in morphological features and minimum apparent diffusion coefficient values among breast cancer subtypes using 3-tesla MRI. Eur. J. Radiol. 2016, 85, 96–102. [Google Scholar] [CrossRef] [PubMed] [Green Version]
- Kong, E.; Chun, K.A.; Bae, Y.K.; Cho, I.H. Integrated PET/MR mammography for quantitative analysis and correlation to prognostic factors of invasive ductal carcinoma. Q J. Nucl. Med. Mol Imaging 2018, 62, 118–126. [Google Scholar] [CrossRef]
- Guvenc, I.; Akay, S.; Ince, S.; Yildiz, R.; Kilbas, Z.; Oysul, F.G.; Tasar, M. Apparent diffusion coefficient value in invasive ductal carcinoma at 3.0 Tesla: Is it correlated with prognostic factors? Br. J. Radiol. 2016, 89, 20150614. [Google Scholar] [CrossRef] [Green Version]
- Kitajima, K.; Yamano, T.; Fukushima, K.; Miyoshi, Y.; Hirota, S.; Kawanaka, Y.; Miya, M.; Doi, H.; Yamakado, K.; Hirota, S. Correlation of the SUVmax of FDG-PET and ADC values of diffusion-weighted MR imaging with pathologic prognostic factors in breast carcinoma. Eur. J. Radiol. 2016, 85, 943–949. [Google Scholar] [CrossRef]
- Kim, Y.; Ko, K.; Kim, D.; Min, C.; Kim, S.G.; Joo, J.; Park, B. Intravoxel incoherent motion diffusion-weighted MR imaging of breast cancer: Association with histopathological features and subtypes. Br. J. Radiol. 2016, 89, 20160140. [Google Scholar] [CrossRef] [Green Version]
- Shin, H.J.; Kim, S.H.; Lee, H.J.; Gong, G.; Baek, S.; Chae, E.Y.; Choi, W.J.; Cha, J.H.; Kim, H.H. Tumor apparent diffusion coefficient as an imaging biomarker to predict tumor aggressiveness in patients with estrogen-receptor-positive breast cancer. NMR Biomed. 2016, 29, 1070–1078. [Google Scholar] [CrossRef]
- Durando, M.; Gennaro, L.; Cho, G.Y.; Giri, D.D.; Gnanasigamani, M.M.; Patil, S.; Sutton, E.J.; Deasy, J.O.; Morris, E.A.; Thakur, S.B. Quantitative apparent diffusion coefficient measurement obtained by 3.0Tesla MRI as a potential noninvasive marker of tumor aggressiveness in breast cancer. Eur. J. Radiol. 2016, 85, 1651–1658. [Google Scholar] [CrossRef] [PubMed] [Green Version]
- Onaygil, C.; Kaya, H.; Ugurlu, M.U.; Aribal, E. Diagnostic performance of diffusion tensor imaging parameters in breast cancer and correlation with the prognostic factors. J. Magn. Reson. Imaging 2017, 45, 660–672. [Google Scholar] [CrossRef] [PubMed]
- Lee, Y.J.; Kim, S.H.; Kang, B.J.; Kang, Y.J.; Yoo, H.; Yoo, J.; Lee, J.; Son, Y.H.; Grimm, R. Intravoxel incoherent motion (IVIM)-derived parameters in diffusion-weighted MRI: Associations with prognostic factors in invasive ductal carcinoma. J. Magn. Reson. Imaging 2017, 45, 1394–1406. [Google Scholar] [CrossRef] [PubMed]
- Yamaguchi, K.; Nakazono, T.; Egashira, R.; Komori, Y.; Nakamura, J.; Noguchi, T.; Irie, H. Diagnostic Performance of Diffusion Tensor Imaging with Readout-segmented Echo-planar Imaging for Invasive Breast Cancer: Correlation of ADC and FA with Pathological Prognostic Markers. Magn. Reson. Med. Sci. 2017, 16, 245–252. [Google Scholar] [CrossRef]
- Suo, S.; Cheng, F.; Cao, M.; Kang, J.; Wang, M.; Hua, J.; Hua, X.; Li, L.; Lu, Q.; Liu, J.; et al. Multiparametric diffusion-weighted imaging in breast lesions: Association with pathologic diagnosis and prognostic factors. J. Magn. Reson. Imaging 2017, 46, 740–750. [Google Scholar] [CrossRef]
- Choi, Y.; Kim, S.H.; Youn, I.K.; Kang, B.J.; Park, W.C.; Lee, A. Rim sign and histogram analysis of apparent diffusion coefficient values on diffusion-weighted MRI in triple-negative breast cancer: Comparison with ER-positive subtype. PLoS ONE 2017, 12, e0177903. [Google Scholar] [CrossRef] [PubMed] [Green Version]
- Amornsiripanitch, N.; Nguyen, V.T.; Rahbar, H.; Hippe, D.S.; Gadi, V.K.; Rendi, M.H.; Partridge, S.C. Diffusion-weighted MRI characteristics associated with prognostic pathological factors and recurrence risk in invasive ER+/HER2- breast cancers. J. Magn. Reson. Imaging 2018, 48, 226–236. [Google Scholar] [CrossRef] [PubMed]
- Zhuang, Z.; Zhang, Q.; Zhang, D.; Cheng, F.; Suo, S.; Geng, X.; Hua, J.; Xu, J. Utility of apparent diffusion coefficient as an imaging biomarker for assessing the proliferative potential of invasive ductal breast cancer. Clin. Radiol. 2018, 73, 473–478. [Google Scholar] [CrossRef]
- Fan, M.; He, T.; Zhang, P.; Cheng, H.; Zhang, J.; Gao, X.; Li, L. Diffusion-weighted imaging features of breast tumours and the surrounding stroma reflect intrinsic heterogeneous characteristics of molecular subtypes in breast cancer. NMR Biomed. 2018, 31, e3869. [Google Scholar] [CrossRef] [Green Version]
- Aydin, H.; Guner, B.; Esen Bostanci, I.; Bulut, Z.M.; Aribas, B.K.; Dogan, L.; Gulcelik, M.A. Is there any relationship between adc values of diffusion-weighted imaging and the histopathological prognostic factors of invasive ductal carcinoma? Br. J. Radiol. 2018, 91, 20170705. [Google Scholar] [CrossRef]
- Shen, L.; Zhou, G.; Tong, T.; Tang, F.; Lin, Y.; Zhou, J.; Wang, Y.; Zong, G.; Zhang, L. ADC at 3.0T as a noninvasive biomarker for preoperative prediction of Ki67 expression in invasive ductal carcinoma of breast. Clin. Imaging 2018, 52, 16–22. [Google Scholar] [CrossRef] [PubMed]
- Ozal, S.T.; Inci, E.; Gemici, A.A.; Turgut, H.; Cikot, M.; Karabulut, M. Can 3.0 Tesla diffusion tensor Imaging parameters be prognostic indicators in breast cancer? Clin. Imaging 2018, 51, 240–247. [Google Scholar] [CrossRef] [PubMed]
- Surov, A.; Clauser, P.; Chang, Y.W.; Li, L.; Martincich, L.; Partridge, S.C.; Kim, J.Y.; Meyer, H.J.; Wienke, A. Can diffusion-weighted imaging predict tumor grade and expression of Ki-67 in breast cancer? A multicenter analysis. Breast Cancer Res. 2018, 20, 58. [Google Scholar] [CrossRef]
- Mao, X.; Zou, X.; Yu, N.; Jiang, X.; Du, J. Quantitative evaluation of intravoxel incoherent motion diffusion-weighted imaging (IVIM) for differential diagnosis and grading prediction of benign and malignant breast lesions. Medicine 2018, 97, e11109. [Google Scholar] [CrossRef] [PubMed]
- Suo, S.; Zhang, D.; Cheng, F.; Cao, M.; Hua, J.; Lu, J.; Xu, J. Added value of mean and entropy of apparent diffusion coefficient values for evaluating histologic phenotypes of invasive ductal breast cancer with MR imaging. Eur. Radiol. 2019, 29, 1425–1434. [Google Scholar] [CrossRef] [PubMed]
- Kim, S.Y.; Kim, E.K.; Moon, H.J.; Yoon, J.H.; Koo, J.S.; Kim, S.G.; Kim, M.J. Association among T2 signal intensity, necrosis, ADC and Ki-67 in estrogen receptor-positive and HER2-negative invasive ductal carcinoma. Magn. Reson. Imaging 2018, 54, 176–182. [Google Scholar] [CrossRef] [PubMed]
- Huang, Y.; Lin, Y.; Hu, W.; Ma, C.; Lin, W.; Wang, Z.; Liang, J.; Ye, W.; Zhao, J.; Wu, R. Diffusion Kurtosis at 3.0T as an in vivo Imaging Marker for Breast Cancer Characterization: Correlation with Prognostic Factors. J. Magn. Reson. Imaging 2019, 49, 845–856. [Google Scholar] [CrossRef]
- Horvat, J.V.; Bernard-Davila, B.; Helbich, T.H.; Zhang, M.; Morris, E.A.; Thakur, S.B.; Ochoa-Albiztegui, R.E.; Leithner, D.; Marino, M.A.; Baltzer, P.A.; et al. Diffusion-weighted imaging (DWI) with apparent diffusion coefficient (ADC) mapping as a quantitative imaging biomarker for prediction of immunohistochemical receptor status, proliferation rate, and molecular subtypes of breast cancer. J. Magn. Reson. Imaging 2019, 50, 836–846. [Google Scholar] [CrossRef]
- You, C.; Li, J.; Zhi, W.; Chen, Y.; Yang, W.; Gu, Y.; Peng, W. The volumetric-tumour histogram-based analysis of intravoxel incoherent motion and non-Gaussian diffusion MRI: Association with prognostic factors in HER2-positive breast cancer. J. Transl. Med. 2019, 17, 182. [Google Scholar] [CrossRef]
- Surov, A.; Chang, Y.W.; Li, L.; Martincich, L.; Partridge, S.C.; Kim, J.Y.; Wienke, A. Apparent diffusion coefficient cannot predict molecular subtype and lymph node metastases in invasive breast cancer: A multicenter analysis. BMC Cancer 2019, 19, 1043. [Google Scholar] [CrossRef] [Green Version]
- Choi, B.B. Associations between Apparent Diffusion Coefficient Values and the Prognostic Factors of Breast Cancer. J. Comput. Assist. Tomogr. 2019, 43, 931–936. [Google Scholar] [CrossRef] [PubMed]
- Horvat, J.V.; Iyer, A.; Morris, E.A.; Apte, A.; Bernard-Davila, B.; Martinez, D.F.; Leithner, D.; Sutton, O.M.; Ochoa-Albiztegui, R.E.; Giri, D.; et al. Histogram Analysis and Visual Heterogeneity of Diffusion-Weighted Imaging with Apparent Diffusion Coefficient Mapping in the Prediction of Molecular Subtypes of Invasive Breast Cancers. Contrast Media Mol. Imaging 2019, 2019, 2972189. [Google Scholar] [CrossRef] [PubMed] [Green Version]
- Okuma, H.; Sudah, M.; Kettunen, T.; Niukkanen, A.; Sutela, A.; Masarwah, A.; Kosma, V.M.; Auvinen, P.; Mannermaa, A.; Vanninen, R. Peritumor to tumor apparent diffusion coefficient ratio is associated with biologically more aggressive breast cancer features and correlates with the prognostication tools. PLoS ONE 2020, 15, e0235278. [Google Scholar] [CrossRef]
- Morawitz, J.; Kirchner, J.; Martin, O.; Bruckmann, N.M.; Dietzel, F.; Li, Y.; Rischpler, C.; Herrmann, K.; Umutlu, L.; Bittner, A.K.; et al. Prospective Correlation of Prognostic Immunohistochemical Markers With SUV and ADC Derived From Dedicated Hybrid Breast 18F-FDG PET/MRI in Women With Newly Diagnosed Breast Cancer. Clin. Nucl. Med. 2021, 46, 201–205. [Google Scholar] [CrossRef] [PubMed]
- Uslu, H.; Onal, T.; Tosun, M.; Arslan, A.S.; Ciftci, E.; Utkan, N.Z. Intravoxel incoherent motion magnetic resonance imaging for breast cancer: A comparison with molecular subtypes and histological grades. Magn. Reson. Imaging 2021, 78, 35–41. [Google Scholar] [CrossRef] [PubMed]
- Iima, M.; Kataoka, M.; Honda, M.; Ohashi, A.; Ohno Kishimoto, A.; Ota, R.; Uozumi, R.; Urushibata, Y.; Feiweier, T.; Toi, M.; et al. The Rate of Apparent Diffusion Coefficient Change With Diffusion Time on Breast Diffusion-Weighted Imaging Depends on Breast Tumor Types and Molecular Prognostic Biomarker Expression. Invest. Radiol. 2021, 56, 501–508. [Google Scholar] [CrossRef]
- Tuan Linh, L.; Minh Duc, N.; Minh Duc, N.; Tra My, T.T.; Viet Bang, L.; Cong Tien, N.; Minh Thong, P. Correlations between apparent diffusion coefficient values and histopathologic factors in breast cancer. Clin. Ter. 2021, 172, 218–224. [Google Scholar]
- Guo, Y.; Kong, Q.C.; Li, L.Q.; Tang, W.J.; Zhang, W.L.; Ning, G.Y.; Xue, J.; Zhou, Q.W.; Liang, Y.Y.; Wu, M.; et al. Whole Volume Apparent Diffusion Coefficient (ADC) Histogram as a Quantitative Imaging Biomarker to Differentiate Breast Lesions: Correlation with the Ki-67 Proliferation Index. Biomed. Res. Int. 2021, 2021, 4970265. [Google Scholar] [CrossRef]
- Steven, A.J.; Zhuo, J.; Melhem, E.R. Diffusion kurtosis imaging: An emerging technique for evaluating the microstructural environment of the brain. AJR Am. J. Roentgenol. 2014, 202, W26–W33. [Google Scholar] [CrossRef]
- Le Bihan, D.; Mangin, J.F.; Poupon, C.; Clark, C.A.; Pappata, S.; Molko, N.; Chabriat, H. Diffusion tensor imaging: Concepts and applications. J. Magn. Reson. Imaging 2001, 13, 534–546. [Google Scholar] [CrossRef]
- Partridge, S.C.; Murthy, R.S.; Ziadloo, A.; White, S.W.; Allison, K.H.; Lehman, C.D. Diffusion tensor magnetic resonance imaging of the normal breast. Magn. Reson. Imaging 2010, 28, 320–328. [Google Scholar] [CrossRef] [PubMed]
- Seo, M.; Ryu, J.K.; Jahng, G.H.; Sohn, Y.M.; Rhee, S.J.; Oh, J.H.; Won, K.Y. Estimation of T2* Relaxation Time of Breast Cancer: Correlation with Clinical, Imaging and Pathological Features. Korean J. Radiol. 2017, 18, 238–248. [Google Scholar] [CrossRef] [PubMed] [Green Version]
- Li, Q.; Xiao, Q.; Yang, M.; Chai, Q.; Huang, Y.; Wu, P.Y.; Niu, Q.; Gu, Y. Histogram analysis of quantitative parameters from synthetic MRI: Correlations with prognostic factors and molecular subtypes in invasive ductal breast cancer. Eur. J. Radiol. 2021, 139, 109697. [Google Scholar] [CrossRef] [PubMed]
- Liu, M.; Guo, X.; Wang, S.; Jin, M.; Wang, Y.; Li, J.; Liu, J. BOLD-MRI of breast invasive ductal carcinoma: Correlation of R2* value and the expression of HIF-1alpha. Eur. Radiol. 2013, 23, 3221–3227. [Google Scholar] [CrossRef] [PubMed]
- Bartella, L.; Morris, E.A.; Dershaw, D.D.; Liberman, L.; Thakur, S.B.; Moskowitz, C.; Guido, J.; Huang, W. Proton MR spectroscopy with choline peak as malignancy marker improves positive predictive value for breast cancer diagnosis: Preliminary study. Radiology 2006, 239, 686–692. [Google Scholar] [CrossRef] [PubMed]
- Sah, R.G.; Sharma, U.; Parshad, R.; Seenu, V.; Mathur, S.R.; Jagannathan, N.R. Association of estrogen receptor, progesterone receptor, and human epidermal growth factor receptor 2 status with total choline concentration and tumor volume in breast cancer patients: An MRI and in vivo proton MRS study. Magn. Reson. Med. 2012, 68, 1039–1047. [Google Scholar] [CrossRef] [PubMed]
- Galati, F.; Luciani, M.L.; Caramanico, C.; Moffa, G.; Catalano, C.; Pediconi, F. Breast Magnetic Resonance Spectroscopy at 3 T in Biopsy-Proven Breast Cancers: Does Choline Peak Correlate With Prognostic Factors? Invest. Radiol. 2019, 54, 767–773. [Google Scholar] [CrossRef]
- Linderholm, B.; Tavelin, B.; Grankvist, K.; Henriksson, R. Vascular endothelial growth factor is of high prognostic value in node-negative breast carcinoma. J. Clin. Oncol. 1998, 16, 3121–3128. [Google Scholar] [CrossRef]
- Padhani, A.R.; Liu, G.; Koh, D.M.; Chenevert, T.L.; Thoeny, H.C.; Takahara, T.; Dzik-Jurasz, A.; Ross, B.D.; Van Cauteren, M.; Collins, D.; et al. Diffusion-weighted magnetic resonance imaging as a cancer biomarker: Consensus and recommendations. Neoplasia 2009, 11, 102–125. [Google Scholar] [CrossRef] [Green Version]
- Tsushima, Y.; Takahashi-Taketomi, A.; Endo, K. Magnetic resonance (MR) differential diagnosis of breast tumors using apparent diffusion coefficient (ADC) on 1.5-T. J. Magn. Reson. Imaging 2009, 30, 249–255. [Google Scholar] [CrossRef]
- Onishi, N.; Kanao, S.; Kataoka, M.; Iima, M.; Sakaguchi, R.; Kawai, M.; Kataoka, T.R.; Mikami, Y.; Toi, M.; Togashi, K. Apparent diffusion coefficient as a potential surrogate marker for Ki-67 index in mucinous breast carcinoma. J. Magn. Reson. Imaging 2015, 41, 610–615. [Google Scholar] [CrossRef] [PubMed] [Green Version]
- Leek, R.D.; Landers, R.J.; Harris, A.L.; Lewis, C.E. Necrosis correlates with high vascular density and focal macrophage infiltration in invasive carcinoma of the breast. Br. J. Cancer 1999, 79, 991–995. [Google Scholar] [CrossRef] [PubMed] [Green Version]
- Putti, T.C.; El-Rehim, D.M.; Rakha, E.A.; Paish, C.E.; Lee, A.H.; Pinder, S.E.; Ellis, I.O. Estrogen receptor-negative breast carcinomas: A review of morphology and immunophenotypical analysis. Mod. Pathol. 2005, 18, 26–35. [Google Scholar] [CrossRef] [PubMed]
- Jimenez, R.E.; Wallis, T.; Visscher, D.W. Centrally necrotizing carcinomas of the breast: A distinct histologic subtype with aggressive clinical behavior. Am. J. Surg. Pathol. 2001, 25, 331–337. [Google Scholar] [CrossRef]
- Sharma, U.; Sah, R.G.; Agarwal, K.; Parshad, R.; Seenu, V.; Mathur, S.R.; Hari, S.; Jagannathan, N.R. Potential of Diffusion-Weighted Imaging in the Characterization of Malignant, Benign, and Healthy Breast Tissues and Molecular Subtypes of Breast Cancer. Front. Oncol. 2016, 6, 126. [Google Scholar] [CrossRef] [Green Version]
- Kim, S.Y.; Shin, J.; Kim, D.H.; Kim, E.K.; Moon, H.J.; Yoon, J.H.; You, J.K.; Kim, M.J. Correlation between electrical conductivity and apparent diffusion coefficient in breast cancer: Effect of necrosis on magnetic resonance imaging. Eur. Radiol. 2018, 28, 3204–3214. [Google Scholar] [CrossRef]
- Dvorak, H.F.; Nagy, J.A.; Dvorak, J.T.; Dvorak, A.M. Identification and characterization of the blood vessels of solid tumors that are leaky to circulating macromolecules. Am. J. Pathol. 1988, 133, 95–109. [Google Scholar]
- Dvorak, H.F.; Brown, L.F.; Detmar, M.; Dvorak, A.M. Vascular permeability factor/vascular endothelial growth factor, microvascular hyperpermeability, and angiogenesis. Am. J. Pathol. 1995, 146, 1029–1039. [Google Scholar]
- Taneja, S.; Evans, A.J.; Rakha, E.A.; Green, A.R.; Ball, G.; Ellis, I.O. The mammographic correlations of a new immunohistochemical classification of invasive breast cancer. Clin. Radiol. 2008, 63, 1228–1235. [Google Scholar] [CrossRef]
- Ozturk, V.S.; Polat, Y.D.; Soyder, A.; Tanyeri, A.; Karaman, C.Z.; Taskin, F. The Relationship between MRI Findings and Molecular Subtypes in Women With Breast Cancer. Curr. Probl. Diagn. Radiol. 2020, 49, 417–421. [Google Scholar] [CrossRef]
- Yuen, S.; Monzawa, S.; Yanai, S.; Matsumoto, H.; Yata, Y.; Ichinose, Y.; Deai, T.; Hashimoto, T.; Tashiro, T.; Yamagami, K. The association between MRI findings and breast cancer subtypes: Focused on the combination patterns on diffusion-weighted and T2-weighted images. Breast Cancer 2020, 27, 1029–1037. [Google Scholar] [CrossRef] [PubMed]
- Matsubayashi, R.N.; Imanishi, M.; Nakagawa, S.; Takahashi, R.; Akashi, M.; Momosaki, S.; Muranaka, T. Breast Ultrasound Elastography and Magnetic Resonance Imaging of Fibrotic Changes of Breast Disease: Correlations Between Elastography Findings and Pathologic and Short Tau Inversion Recovery Imaging Results, Including the Enhancement Ratio and Apparent Diffusion Coefficient. J. Comput. Assist. Tomogr. 2015, 39, 94–101. [Google Scholar] [PubMed]
- Kuhl, C.K.; Klaschik, S.; Mielcarek, P.; Gieseke, J.; Wardelmann, E.; Schild, H.H. Do T2-weighted pulse sequences help with the differential diagnosis of enhancing lesions in dynamic breast MRI? J. Magn. Reson. Imaging 1999, 9, 187–196. [Google Scholar] [CrossRef]
- Dogan, B.E.; Gonzalez-Angulo, A.M.; Gilcrease, M.; Dryden, M.J.; Yang, W.T. Multimodality imaging of triple receptor-negative tumors with mammography, ultrasound, and MRI. AJR Am. J. Roentgenol. 2010, 194, 1160–1166. [Google Scholar] [CrossRef] [PubMed]
- Uematsu, T.; Kasami, M.; Yuen, S. Triple-negative breast cancer: Correlation between MR imaging and pathologic findings. Radiology 2009, 250, 638–647. [Google Scholar] [CrossRef]
- Sung, J.S.; Jochelson, M.S.; Brennan, S.; Joo, S.; Wen, Y.H.; Moskowitz, C.; Zheng, J.; Dershaw, D.D.; Morris, E.A. MR imaging features of triple-negative breast cancers. Breast J. 2013, 19, 643–649. [Google Scholar] [CrossRef]
- Yuen, S.; Uematsu, T.; Kasami, M.; Tanaka, K.; Kimura, K.; Sanuki, J.; Uchida, Y.; Furukawa, H. Breast carcinomas with strong high-signal intensity on T2-weighted MR images: Pathological characteristics and differential diagnosis. J. Magn. Reson. Imaging 2007, 25, 502–510. [Google Scholar] [CrossRef]
- Baltzer, P.A.; Yang, F.; Dietzel, M.; Herzog, A.; Simon, A.; Vag, T.; Gajda, M.; Camara, O.; Kaiser, W.A. Sensitivity and specificity of unilateral edema on T2w-TSE sequences in MR-Mammography considering 974 histologically verified lesions. Breast J. 2010, 16, 233–239. [Google Scholar] [CrossRef]
- Renz, D.M.; Baltzer, P.A.; Bottcher, J.; Thaher, F.; Gajda, M.; Camara, O.; Runnebaum, I.B.; Kaiser, W.A. Magnetic resonance imaging of inflammatory breast carcinoma and acute mastitis. A comparative study. Eur. Radiol. 2008, 18, 2370–2380. [Google Scholar] [CrossRef]
- Arita, Y.; Takahara, T.; Yoshida, S.; Kwee, T.C.; Yajima, S.; Ishii, C.; Ishii, R.; Okuda, S.; Jinzaki, M.; Fujii, Y. Quantitative Assessment of Bone Metastasis in Prostate Cancer Using Synthetic Magnetic Resonance Imaging. Invest. Radiol. 2019, 54, 638–644. [Google Scholar] [CrossRef]
- Warntjes, J.B.; Leinhard, O.D.; West, J.; Lundberg, P. Rapid magnetic resonance quantification on the brain: Optimization for clinical usage. Magn. Reson. Med. 2008, 60, 320–329. [Google Scholar] [CrossRef] [PubMed]
- Jung, Y.; Gho, S.M.; Back, S.N.; Ha, T.; Kang, D.K.; Kim, T.H. The feasibility of synthetic MRI in breast cancer patients: Comparison of T2 relaxation time with multiecho spin echo T2 mapping method. Br. J. Radiol. 2018, 92, 20180479. [Google Scholar] [CrossRef] [PubMed]
- Liang, C.; Cheng, Z.; Huang, Y.; He, L.; Chen, X.; Ma, Z.; Huang, X.; Liang, C.; Liu, Z. An MRI-based Radiomics Classifier for Preoperative Prediction of Ki-67 Status in Breast Cancer. Acad. Radiol. 2018, 25, 1111–1117. [Google Scholar] [CrossRef] [PubMed]
- Bae, M.S.; Seo, M.; Kim, K.G.; Park, I.A.; Moon, W.K. Quantitative MRI morphology of invasive breast cancer: Correlation with immunohistochemical biomarkers and subtypes. Acta Radiol. 2015, 56, 269–275. [Google Scholar] [CrossRef] [PubMed]
- Van Goethem, M.; Schelfout, K.; Dijckmans, L.; Van Der Auwera, J.C.; Weyler, J.; Verslegers, I.; Biltjes, I.; De Schepper, A. MR mammography in the pre-operative staging of breast cancer in patients with dense breast tissue: Comparison with mammography and ultrasound. Eur. Radiol. 2004, 14, 809–816. [Google Scholar] [CrossRef]
- Ha, R.; Jin, B.; Mango, V.; Friedlander, L.; Miloshev, V.; Malak, S.; Wynn, R. Breast cancer molecular subtype as a predictor of the utility of preoperative MRI. AJR Am. J. Roentgenol. 2015, 204, 1354–1360. [Google Scholar] [CrossRef]
- Grimm, L.J.; Johnson, K.S.; Marcom, P.K.; Baker, J.A.; Soo, M.S. Can breast cancer molecular subtype help to select patients for preoperative MR imaging? Radiology 2015, 274, 352–358. [Google Scholar] [CrossRef]
- Tran, B.; Bedard, P.L. Luminal-B breast cancer and novel therapeutic targets. Breast Cancer Res. 2011, 13, 221. [Google Scholar] [CrossRef] [Green Version]
- Grimm, L.J.; Zhang, J.; Baker, J.A.; Soo, M.S.; Johnson, K.S.; Mazurowski, M.A. Relationships Between MRI Breast Imaging-Reporting and Data System (BI-RADS) Lexicon Descriptors and Breast Cancer Molecular Subtypes: Internal Enhancement is Associated with Luminal B Subtype. Breast J. 2017, 23, 579–582. [Google Scholar] [CrossRef]
- Bitencourt, A.G.; Pereira, N.P.; Franca, L.K.; Silva, C.B.; Paludo, J.; Paiva, H.L.; Graziano, L.; Guatelli, C.S.; Souza, J.A.; Marques, E.F. Role of MRI in the staging of breast cancer patients: Does histological type and molecular subtype matter? Br. J. Radiol. 2015, 88, 20150458. [Google Scholar] [CrossRef] [Green Version]
- Costantini, M.; Belli, P.; Distefano, D.; Bufi, E.; Matteo, M.D.; Rinaldi, P.; Giuliani, M.; Petrone, G.; Magno, S.; Bonomo, L. Magnetic resonance imaging features in triple-negative breast cancer: Comparison with luminal and HER2-overexpressing tumors. Clin. Breast Cancer 2012, 12, 331–339. [Google Scholar] [CrossRef] [PubMed]
- Boisserie-Lacroix, M.; Macgrogan, G.; Debled, M.; Ferron, S.; Asad-Syed, M.; McKelvie-Sebileau, P.; Mathoulin-Pelissier, S.; Brouste, V.; Hurtevent-Labrot, G. Triple-negative breast cancers: Associations between imaging and pathological findings for triple-negative tumors compared with hormone receptor-positive/human epidermal growth factor receptor-2-negative breast cancers. Oncologist 2013, 18, 802–811. [Google Scholar] [CrossRef] [PubMed] [Green Version]


| Author, Year | Number of Breast Ca (Subtypes) | Assessment | Findings |
|---|---|---|---|
| Szaboet al., 2003 [19] | 61 | Time to peak, TIC, enhancement ratio | Short time to peak associated with HER2-positive status and ER-negative status. Type III curves (wash-out) associated with Ki-67 positivity. |
| Lee et al., 2008 [20] | 194 | TIC, enhancement ratio | Washout curve may predict a higher level of Ki-67. |
| Chen et al., 2008 [21] | 90 | TIC | No significant association between kinetic parameters and ER status. |
| Makkat et al., 2008 [22] | 55 | Deconvolution | Higher tumour blood flow in PR negative group than in PR-positive group. |
| Girardi et al., 2010 [23] | 72 | TIC, enhancement ratio | Significant correlation between Ki-67 and type III curves (wash-out). |
| Chang et al., 2009 [24] | 139 | Time to peak, TIC | Short time to peak correlated with ER-negative status. |
| Fernández-Guinea et al., 2010 [25] | 68 | Time to peak, TIC, enhancement ratio | Short time to peak associated with Ki-67. |
| Li et al., 2010 [26] | 31 | T2 * dynamic, Ktrans, Kep, Ve, MTT | R2* influenced by blood volume in breast carcinomas. |
| Li et al., 2010 [27] | 37 (16T N, 21 L) | Ktrans, Kep, Ve, MTT | Lower Ve, shorter MTT and higher Kep in TN than those in non-TN. |
| Koo et al., 2012 [28] | 70 | Ktrans, Kep, Ve | Higher Ktrans and Kep in ER-negative group than those in ER-positive group. Lower Ve in ER-negative group than in ER-positive group. |
| Youk et al., 2012 [29] | 271 | TIC, enhancement ratio | No specific kinetic feature for TN. |
| Millet et al., 2014 [30] | 273 | Initial enhancement, time to peak, enhancement ratio | No significant association between kinetic parameters and either HR or HER2. |
| Yamaguchi et al., 2015 [31] | 192 | Percent volume of TIC, enhancement ratio | No significant association between kinetic parameters and either HR or HER2. |
| Kawashima et al., 2014 [32] | 116 (24 LA, 29 LB, 23 HER2, 40 TN) | Enhancement ratio, TIC | Higher enhancement ratio at 2 min in LB and HER2 than in LA. |
| Mazurowski et al., 2014 [33] | 48 (28 LA, 8 LB, 4 HER2, 8 TN) | Lesion enhancement rate to background parenchymal enhancement rate | Cancers with higher ratios of lesion enhancement rate to background parenchymal enhancement rate were more likely to be LB. |
| Li et al., 2015 [34] | 52 | Ktrans, Kep, Ve | No significant association between kinetic parameters and Ki-67. |
| Leong et al., 2015 [35] | 194 (140 L, 18 HER2, 36 TN) | Enhancement ratio, volumetric analysis of the kinetic patterns, TIC | Higher enhancement ratio and rapid initial enhancement in ER-negative, PR-negative, and TN. Higher rapid washout component in HER2-positive group than in HER2-negative group. |
| Blaschke et al., 2015 [36] | 112 (73 L, 11 HER2, 28 TN) | percent volume of enhancement | Greater percent volume for HER2 subtype in the early phase compared to L and TN. |
| Lee et al., 2016 [37] | 52 (39 L, 4 HER2, 9 TN) | Ktrans, Kep, Ve, initial AUC | Median Ve higher in PR-positive group than in the PR-negative group. |
| Shin et al., 2017 [38] | 88 (39 LA, 49 LB) | Ktrans, Kep, Ve | Higher Ktrans in LB than in LA. |
| Catalano et al., 2017 [39] | 21 (6 LA, 8 LB, 7 HER2) | Ktrans, Kep, Ve | Higher Kep in non-L than in L. Higher Kep in HER2-positive group than in HER2-negative group. |
| Caiazzo et al., 2018 [40] | 27 | Enhancement ratio, maximum enhancement, slope of the enhancement | Positive correlation between Ki-67 and both maximum enhancement and maximum slope of the enhancement. |
| Kawashima et al., 2017 [41] | 137 (82 LA, 55 LB) | Enhancement ratio, SER | Higher SER in LB than in LA. |
| Trimboli et al., 2018 [42] | 25 | Time to peak, maximum enhancement, enhancement ratio, TIC | Enhancement ratio correlated with HER2 overexpression. |
| Wang et al., 2018 [43] | 116 (43 LA, 55 LB, 7 HER2, 11 TN) | TIC, time to peak, enhancement ratio | HER2 status associated with type III curves (wash-out). LA less likely to have type III curves (wash-out). |
| Heacock et al., 2018 [44] | 142 (83 L, 31 HER2, 28 TN) | initial enhancement ratio | Higher initial enhancement ratio in HER2 subtype and TN compared to L. |
| Incoronato et al., 2018 [45] | 49 (13 LA, 29 LB, 4 HER2, 3 TN) | Ktrans, Kep | Kepmax could discriminate between LA and LB subtypes. Ktransmax could discriminate between LA and non-L subtypes. |
| Macchini et al., 2018 [46] | 95 (24 LA, 54 LB, 5 HER2, 12 TN) | TIC, enhancement ratio, maximum enhancement, AUC, maximum slope, wash-out rate, time to peak | Subtypes related to maximum enhancement, peak time, and maximum slope. ER correlated with maximum and relative enhancement, wash-in rate, and AUC. |
| Tao et al., 2018 [47] | 85 (67 L, 18 others) | TIC | Distribution of curve types differed significantly for ER and Ki-67 but not PR or HER2 expression. |
| Nagasaka et al., 2019 [48] | 101 (82 L, 19 others) | Ktrans, Kep, Ve | Lower Ve in the high Ki-67 group. |
| Gigli et al., 2019 [49] | 75 (30 TN, 45 others) | Peak enhancement, time to peak, SER, enhancement ratio | Lower enhancement ratio and higher SER in TN. |
| Montemezzi et al., 2018 [50] | 453 (66 LA, 292 LB, 39 HER2, 56 TN) | TIC | Smaller proportion of type III curves (wash-out) in LA. |
| Xie et al., 2019 [51] | 134 (26 LA, 68 LB, 18 HER2, 22 TN) | Maximum slope, washout slope | Lower maximum slope in TN than in non-TN. |
| Song et al., 2019 [52] | 85 (50 L, 25 HER2, 10 TN) | Peak enhancement, percent volume of enhancement, total enhancing lesion volume | Higher peak enhancement and total enhancing lesion volume in the high-Ki-67 group than those in the low-Ki-67 group. |
| Yuan et al., 2019 [53] | 196 (148 L, 30 HER2, 18 TN) | TIC, early enhancement rate | TIC type positively correlated with positive expression of HER2. |
| Dilorenzo et al., 2019 [54] | 82 (6 LA, 56 LB, 4 HER2) | BPE | Among patients with mild BPE, luminal B tumours were more common. Among patients with marked BPE, TN cancers were more common. |
| Li et al, 2019 [55] | 164 | BPE | BPE was positively associated with positive ER status. |
| Sun et al., 2020 [56] | 145 (28 LA, 56 LB, 37 HER2, 24TN) | Ktrans, Kep, Ve, IAUGC60 | Higher 5th percentile of the Ktrans, IAUC60, and Ve in the high Ki-67 group. |
| Matsuda et al., 2020 [57] | 50 (50 L) | T1, T2 | Higher SD of T1 and T2 after contrast injection in the high Ki-67 group. |
| Shin et al., 2020 [58] | 238 (198 L, 14 HER2, 26 TN) | TTE, maximum slope, SER | Shorter TTE in HER2-positive group than in the HER2-negative group. Shorter TTE in the high Ki-67 group than in the low Ki-67 group. |
| Onishi et al., 2020 [59] | 125 (107 L, 5 HER2, 12 TN) | TTE, maximum slope | Shorter TTE in TN or HER2 subtype compared to L. |
| Yamaguchi et al., 2021 [60] | 97 (69 LA, 14 LB, 5 HER2, 9 TN) | Maximum slope | Maximum slope correlated with Ki-67. |
| Du et al., 2021 [61] | 200 (41 LA, 98 LB, 25 HER2, 36 TN) | Ktrans, Kep, Ve | Higher Ktrans and Kep in HER2 subtype. |
| Pelissier et al., 2021 [62] | 150 (30 LA, 30 LB, 30 HER2, 30 TN, 30 ILC) | Maximum slope | Lower maximum slope in LA. |
| You et al., 2021 [63] | 142 (12 LA, 113 LB, 17 TN) | BPE | Lower BPE in TN. |
| Author, Year | Number of Breast Ca (Subtypes) | Assessment | ROI | Findings |
|---|---|---|---|---|
| Surov et al., 2017 [67] | 476 | ADC | Meta-analysis. No significant correlation between Ki-67 and ADC. | |
| Meyer et al., 2021 [66] | 2990 | ADC | Meta-analysis. No significant difference in ADC values between subtypes. | |
| Kim et al., 2009 [68] | 62 | ADC | Solid | No significant correlation between ADC and ER, HER2, or Ki-67. |
| Jeh et al., 2011 [69] | 107 | ADC | Solid | Lower ADC for ER-positive than for ER-negative status. Higher ADC for HER2-positive than for HER2-negative status. |
| Choi et al., 2012 [70] | 290 | ADC | Solid | Lower ADC for ER-positive than for ER-negative status. Lower ADC in the high-Ki-67 group than in the low-Ki-67 group. |
| Martincich et al., 2012 [71] | 192 | ADC | Solid | Lower ADC for ER-positive than for ER-negative status. Highest ADC for the HER2-positive subtype. |
| Youk et al., 2012 [29] | 271 (119 L, 94 HER2, 58 TN) | ADC | Whole | Higher ADC for TN than that of others. |
| Choi et al., 2012 [70] | 118 (89 L) | ADC | Solid | Lower ADC for ER-positive status than for ER-negative status. Higher ADC for HER2-positive status than for HER2-negative status. |
| Richard et al., 2013 [72] | 118 (33 LA, 28 LB, 11 HER2, 37 TN) | ADC | Whole | Lower ADC for ER-positive status than for ER-negative status. |
| Park et al., 2015 [73] | 110 | ADC | Solid | Higher ADC in HER2-positive IDC than in HER2-negative IDC. |
| Baba et al., 2014 [74] | 70 | ADC | Solid | Higher ADC for HER2-positive than HER2-negative status. Lower ADC for ER-positive than ER-negative status. |
| Miyake et al., 2014 [75] | 89 | ADC | Unknown | Relative strong correlation for minimal ADCs between the two readers. |
| De Felice et al., 2014 [76] | 75 | ADC | Solid | No significant difference in ADC between the high-Ki-67 and low-Ki-67 groups. |
| Mori et al., 2015 [77] | 86 (42 LA, 44 LB) | ADC | Solid | Lower ADC in LB than in LA. |
| Liu et al., 2015 [78] | 176 (67 LA, 45 LB, 29 HER2, 35 TN) | ADC | Whole | Higher ADCs for TN than those for LA or LB. Higher ADCs for HER2-positive subtype than those of LA or LB. |
| Li et al., 2015 [34] | 52 | ADC | Solid | Lower ADC in the high-Ki-67 group than in the low-Ki-67 group. |
| Molinari et al., 2015 [79] | 115 (60 LA, 33 LB, 8 HER2, 14 TN) | ADC | Solid | Lower ADC in the high-Ki-67 group than in the low-Ki-67 group. Lower ADC in LB than in LA. |
| Kim et al., 2015 [80] | 173 (43 LA, 84 LB, 9 HER2, 37 TN) | ADC | Whole | Lower ADC in the high-Ki-67 group than in the low-Ki-67 group. Higher ADC for HER2-positive status than for HER2-negative status. |
| Sun et al., 2015 [81] | 52 | ADC | Solid | Kurtosis positively correlated with Ki-67. Diffusivity negatively correlated with Ki-67. |
| Arponen et al., 2015 [82] | 104 (11 TN) | ADC | Solid | ADC correlated with PR, but not with HER2, ER, or Ki-67. |
| Cho et al., 2016 [83] | 50 (29 L, 6 HER2, 15 TN) | ADC, IVIM | Whole | Lower ADCmax and Dtmax for ER-positive status. f and Df, showed correlation with hormonal factor expression. |
| Karan et al., 2016 [84] | 70 | ADC | Solid | No significant difference in ADC according to ER or HER2 statuses. |
| Kato et al., 2016 [85] | 98 (46 LA, 34 LB, 5 HER2, 13 TN) | ADC | Solid | Higher ADCmin in LA than in LB. |
| Kong et al., 2018 [86] | 46 (27 L, 9 HER2, 10 TN) | ADC | Solid | No significant difference in ADC according to ER or HER2 status. No significant difference in ADC between TN and non-TN. |
| Lee et al., 2016 [37] | 52 (39 L, 4 HER2, 9 TN) | ADC | Solid | Higher ADC for HER2 positive status than for HER2-negative statuses. Lower ADC for ER-positive than for ER-negative statuses. |
| Guvenc et al., 2016 [87] | 48 (38 L, 10 others) | ADC | Solid | Lower ADC for ER-positive than ER-negative status. No significant difference according to HER2 status. |
| Kitajima et al., 2016 [88] | 216 (153 L, 19 HER2, 44 TN) | ADC | Solid | Lower ADC for high Ki-67 than for low Ki-67. No significant difference in ADC according to ER or HER2 statuses. |
| Kim et al., 2016 [89] | 275 (58 LA, 138 LB, 27 HER2, 52 TN) | ADC, IVIM | Solid | No significant difference in ADC for ER, HER2, or Ki-67 statuses. Lower Dt in the high-Ki-67 group than in the low-Ki-67 group. |
| Shin et al., 2017 [38] | 88 (39 LA, 49 LB) | ADC | Solid | Lower ADC in LB than in LA |
| Shin et al., 2016 [90] | 140 (60 LA, 80 LB) | ADC | Solid | Lower ADC in LB than in LA |
| Durando et al., 2016 [91] | 107 (64 L, 20 HER2, 23 TN) | ADC | Solid | No significant difference between subtypes. |
| Onaygil et al., 2017 [92] | 42 (33 L, 9 others) | DTI | Solid | Higher RD and lower FA, RA, and GA for ER-negative status. Ki-67 significantly negatively correlated with FA, RA, and GA. |
| Lee et al., 2017 [93] | 82 (62 L, 9 HER2, 11 TN) | ADC, IVIM | Unknown | Lower ADC for ER-positive than in ER-negative statuses. Dt 50th, 75th, and 90th percentile metrics reduced for ER-positive status. Dt 75th percentile value is a significant differentiator of tumour subtype and Ki-67. |
| Yamaguchi et al., 2017 [94] | 53 (28 LA, 10 LB, 4 HER2, 11 TN) | ADC | Unknown | FA correlated with Ki-67 and ER. |
| Suo et al., 2017 [95] | 49 (27 L, 22 others) | ADC, IVIM | Solid | α and Df correlated with Ki-67. ADC, Dt, f, DDC, and MD correlated with ER. |
| Catalano et al., 2017 [39] | 21 (6 LA, 8 LB, 7 HER2) | ADC | Unknown | Lower ADC in the low-Ki-67 group than in the high-Ki-67 group. |
| Choi et al., 2017 [96] | 221 (149 L, 72 TN) | ADC | Whole | Higher ADC kurtosis in TN than ER-positive status. |
| Kawashima et al., 2017 [41] | 137 (82 LA, 55 LB) | ADC, IVIM | Solid | Lower Dt and ADC in LB than in LA. |
| Amornsiripanitch et al., 2018 [97] | 107 (38 LA, 44 LB, 25 unknown) | ADC, CNR | Whole | DWI CNR associated with Ki-67. |
| Zhuang et al., 2018 [98] | 80 | ADC | Whole | Lower ADCmin in the high-Ki-67 group than in the low-Ki-67 group. Higher ADCmax, and ΔADC in the high-Ki-67 group than those in the low-Ki-67 group. |
| Fan et al., 2018 [99] | 126 (26 LA, 67 LB, 22 HER2, 11 TN) | ADC | Whole | Lower ADC in LB than in HER2 subtype. |
| Aydin et al., 2018 [100] | 61 (50 L, 11 others) | ADC | Solid | Weak negative correlation between ADC and Ki-67. No significant difference in ADC according to HER2, ER, or Ki-67 statuses. |
| Shen et al., 2018 [101] | 71 (14 LA, 28 LB, 14 HER2, 15 TN) | ADC | Solid | Lower ADC in the high-Ki-67 group than in the low-Ki-67 group |
| Incoronato et al., 2018 [45] | 49 (13 LA, 29 LB, 4 HER2, 3 TN) | ADC | Unknown | Lower ADC in LB than in non-L. |
| Ozal et al., 2018 [102] | 63 (45L, 18 others) | DTI | Solid | Correlation between ER status and MD, HER2 status and RA, Ki-67 and RA, Ki-67 and VR. |
| Surov et al., 2018 [103] | 870 | ADC | Unknown | ADC weakly correlated with Ki-67. |
| Mao et al., 2018 [104] | 77 | IVIM | Solid | Ki-67 negatively correlated with Dt. |
| Zhao et al., 2018 [8] | 119 (22 LA, 50 LB, 22 HER2, 25 TN) | ADC, IVIM | Unknown | Higher Df in non-L than in L. TN showed increased Df and f and decreased Dt compared to other subtypes. |
| Suo et al., 2019 [105] | 134 (27 LA, 70 LB, 17 HER2, 20 TN) | ADC | Solid | ADC decreased for ER-positive, PR-positive, and HER2-negative statuses. |
| Kim et al., 2018 [106] | 187 (112 LA, 75 LB) | ADC | Solid | ADC not significantly correlated with Ki-67. |
| Song et al., 2019 [52] | 85 (50 L, 25 HER2, 10 TN) | ADC, IVIM | Solid | No significant associations between IVIM parameters and prognostic factors. |
| Huang et al., 2019 [107] | 46 | ADC | Solid | ADC kurtosis positively associated with Ki-67. Mean diffusivity and ADC negatively correlated with Ki-67. |
| Montemezzi et al., 2018 [50] | 453 (66 LA, 292 LB, 39 HER2, 56 TN) | ADC | Solid | Higher ADC in LA than other subtypes. Higher SD of ADC and ADC95th percentile in TN than those in LA. |
| Xie et al., 2019 [51] | 134 (26 LA, 68 LB, 18 HER2, 22 TN) | ADC | Whole | Higher ADC in TN than other subtypes. |
| Yuan et al., 2019 [53] | 196 (148 L, 30 HER2, 18 TN) | ADC | Solid | No significant difference in ADC for HER2, ER, or Ki-67 status. |
| Horvat et al., 2019 [108] | 107 (71 LA, 13 LB, 4 HER2, 19 TN) | ADC | Solid/Whole | Lower ADC in L than in non-L (Whole). No significant difference in ADC for HER2 or ER status (Solid). |
| You et al., 2019 [109] | 148 (14 LA, 75 LB, 40 HER2, 19 TN) | ADC, IVIM | Unknown | HER2-positive cancers showed higher 5th percentile mean diffusivity in the HR-positive group compared to the HR-negative group. |
| Surov et al., 2019 [110] | 661 (177 LA, 279 LB, 66 HER2, 111 TN) | ADC | Solid | Significant overlap of ADC values among different tumour subtypes. Lower ADC in LB compared to LA and HER2 subtypes. |
| Choi et al., 2019 [111] | 101 (50 L, 18 HER2, 20 TN) | ADC | Whole | ΔADC related to Ki-67, molecular subtype. |
| Horvat et al., 2019 [112] | 91 (49 LA, 8 LB, 11 HER2, 23 TN) | ADC | Solid | Higher ADC in the HER2-positive group than in the HER2-negative group. No significant differences according to ER and PR statuses. |
| Okuma et al., 2020 [113] | 88 (82 L, 6 others) | ADC | Solid | Peritumour/tumour ADC ratio significantly associated with Ki-67 but not ER or HER2 status. |
| Du et al., 2021 [61] | 200 (41 LA, 98 LB, 25 HER2, 36 TN) | ADC | Solid | Lower ADC in L than in non-L. Lower ADC in the high-Ki-67 group than in the low-Ki-67 group. |
| Morawitz et al., 2021 [114] | 56 (9 LA, 36 LB, 1 HER2, 6 TN) | ADC | Unknown | Higher ADC in the HER2-positive than in the HER2-negative groups. |
| Uslu et al., 2021 [115] | 51 (27 L, 13 HER2, 11 TN) | IVIM | Unknown | Df and f higher in HER2 subtype than in TN. Df higher in HER2 subtype than in L. |
| Iima et al., 2021 [116] | 86 (60 L, 26 others) | ADC with diffusion time | Solid | Lower ADCshort and ADC in ER-positive group compared to ER-negative group. Larger rate of ADC change with diffusion time in the high-Ki-67 group than in the low-Ki-67 group. |
| Tuan Linh et al., 2021 [117] | 49 (15 LA, 18 LB, 16 HER2) | ADC | Solid | Lower ADC in the high-Ki-67 group than in the low-Ki-67 group. No correlations between ADC and ER, PR, and HER2. |
| Guo et al., 2021 [118] | 105 (79 L, 26 others) | ADC | Whole | 10th percentile ADC predicted HER2 and ER statuses. Skewness predicted the Ki-67 status. |
| You et al., 2021 [63] | 142 (12 LA, 39 LB. 74 HER2, 17 TN) | ADC | Unknown | ADC 95th percentile and ADC kurtosis differed significantly among 4 subtypes, especially between TN and other subtypes. |
| Author, Year | Number of Breast Ca (Subtypes) | Assessment | Findings |
|---|---|---|---|
| Liu et al., 2013 [124] | 104 | R2 * | R2 * weakly correlated with Ki-67 expression |
| Seo et al., 2017 [122] | 92 | T2 * | No significant difference in T2 * according to ER or HER2 status. |
| Matsuda et al., 2020 [57] | 50 | T1, T2, PD | No significant difference in T1, T2, or PD between the high-Ki-67 group and the-low Ki-67 groups. |
| Du et al., 2021 [61] | 200 (41 LA, 98 LB, 25 HER2, 36 TN) | T1, T2, PD | Higher T1 and T2 in the HR-negative group than in the HR-positive group. Higher T1 and T2 in the high-Ki-67 group than in the low-Ki-67 group. |
| Li et al., 2021 [123] | 122 | T1, T2, PD | Higher T2 in the ER-negative group than in ER-positive group. Higher PD in HER2 -positive IDC than in HER2 -negative IDC. The T2 values of the TN, LB, and LA types are arranged in descending order. |
| Author, Year | Number of Breast Ca (Subtypes) | Assessment | Findings |
|---|---|---|---|
| Chen et al., 2008 [30] | 90 | Cho concentration | No significant difference of Cho for ER status. |
| Sah et al., 2012 [126] | 151 | Cho concentration | Lower Cho in TN than in non-TN. |
| Montemezzi et al., 2018 [19] | 453 (66 LA, 292 LB, 39 HER2, 56 TN) | Cho SNR | Higher Cho SNR in TN tumours. |
| Galati et al., 2019 [127] | 102 (30 LA, 58 LB, 14 TN) | Cho SNR | Significant association between the presence of Cho peak and higher Ki-67. |
Publisher’s Note: MDPI stays neutral with regard to jurisdictional claims in published maps and institutional affiliations. |
© 2022 by the authors. Licensee MDPI, Basel, Switzerland. This article is an open access article distributed under the terms and conditions of the Creative Commons Attribution (CC BY) license (https://creativecommons.org/licenses/by/4.0/).
Share and Cite
Kazama, T.; Takahara, T.; Hashimoto, J. Breast Cancer Subtypes and Quantitative Magnetic Resonance Imaging: A Systemic Review. Life 2022, 12, 490. https://doi.org/10.3390/life12040490
Kazama T, Takahara T, Hashimoto J. Breast Cancer Subtypes and Quantitative Magnetic Resonance Imaging: A Systemic Review. Life. 2022; 12(4):490. https://doi.org/10.3390/life12040490
Chicago/Turabian StyleKazama, Toshiki, Taro Takahara, and Jun Hashimoto. 2022. "Breast Cancer Subtypes and Quantitative Magnetic Resonance Imaging: A Systemic Review" Life 12, no. 4: 490. https://doi.org/10.3390/life12040490