1. Introduction
Pelton turbines are used in hydropower plants with high turbine heads and relatively low flow rates [
1]. This type of turbine can be made both for high power (e.g., Pelton turbines in the Biedroun hydropower plant with a power per unit of 423 MW, at a head of about 1869 m) and for low power. Low-power Pelton turbines are generally used for domestic purposes, and can operate from minimum falls of H = 10–15 m.
The research presented in this paper aims to determine the nozzle jet flow parameters for a Pelton microturbine designed for sites with a head between H = 15 m and H = 35 m.
The geometry elements that define the flow in a Pelton turbine are the injector, the runner, and the casing. The injector is the mechanical system that allows fluid flow adjustment. Its function is to convert potential energy into kinetic energy and direct the water in a specified direction in a compact jet. The injector of a Pelton turbine consists mainly of a nozzle and an injector spear. By adjusting the position of the spear relative to the nozzle, the injector opening is set. The jet emerging from the nozzle contracts and then widens according to the distance. Jet dispersion has a major influence on the energy performance of the runner [
2]. The jet dispersion depends on the turbulence of flow. The turbulence is influenced by the turbine head and the diameter of the nozzle. A compact jet with low dispersion is obtained for sufficient jet compression at the injector outlet surface. The degree of compression increases with increasing central taper angle of the injector nozzle. However, as the taper angle increases, the injector diameters increase and the flow stream lines become more distorted, resulting in additional hydraulic loss.
The dependence of the flow rate Q [l/s] on the injector opening S [mm] represents the flow-rate characteristic of the injector. The forces on the injector spear are generated by the hydrodynamic pressure. The dependence of axial force on injector opening represents the force characteristic of the injector spear. The maximum axial force occurs near full closure of the injector and is oriented in the direction of flow. At full closure, when there is no flow, the axial force is created by hydrostatic pressure and can be calculated as a function of the maximum injector nozzle diameter and the diameter of the spear steam. As the injector opening increases, the axial force reaches a maximum, then decreases and, at a given opening size, changes its sign.
The characterization of flow through hydraulic turbines has been facilitated by the development of computational fluid dynamics (CFD) simulation codes [
3,
4,
5]. Several areas of flow analysis in the Pelton turbine can be distinguished: flow in the injector, influenced by the geometry of the injector nozzle and spear, flow in the free jet (between the exit surface of the injector and the entry surface on the runner buckets), flow on the runner buckets, flow in the volume created by the runner and the turbine casing [
6,
7,
8]. An analysis of the entire flow path requires high computational power, therefore several studies have focused on specific flow areas.
Nonoshita et al. showed that the jet velocity distribution is influenced by the flow rate and turbine head. The authors identified a low-velocity area near the jet axis. This area expands with decreasing injector opening [
9].
Kumashiro et al. showed that the non-uniformity of the free jet causes a decrease of energy performance of Pelton turbines [
10]. Liu and coauthors showed that jet dispersion impacts the energy performance of Pelton turbines. Jet dispersion can also lead to interference when multiple injectors are used [
11].
Catanase et al. showed that injector spear geometry has a significant influence on free jet velocity distribution [
12]. Jo and coauthors numerically investigated jet flows in a Pelton turbine with different nozzle geometries. Jet quality and energy performance decrease with increasing nozzle throat angle [
13]. Zhang and coauthors showed that the injectors with 100° nozzle angle and 70° spear angle determines the highest jet efficiency. Comparing the influence of nozzle angle, spear angle and injector opening on the efficiency shows that the spear angle has the greatest influence [
14].
Jeon et al. investigated the influence of spear positions on energy recovery and friction loss of a Pelton turbine. The authors showed that it is important to include the geometries of the injector nozzle and spear in numerical simulations. The friction loss increases for small injector open and low flow rate [
15].
Zeng et al. analyzed flow through the injector and free jet flow for three injector openings. The authors showed that increasing the injector opening results in a more dispersed jet and higher hydraulic losses. Additionally, the ribs from the injector spear induced secondary flow and deformation of the main jet [
2]. Zhang and Casey showed that secondary flow generated by bends and bifurcations of the turbine distributor is transmitted in the free jet. These secondary flows generated turbulence and jet asymmetry [
16]. The influence of spear eccentricity on jet distribution was studied by Jung et al. [
17]. The eccentricity caused jet diffusion and an increase of the hydraulic loss in the injector.
Koukouvinis et al. [
18] presented the analysis of flow through the injector of a Pelton turbine using Smoothed Particle Hydrodynamics. Free jet flow for several injector openings is analyzed.
Obayes et al. [
19] analyzed the influence of injector nozzle diameter on the performance of a Pelton turbine. Five nozzle diameters ranging from 3.61 mm to 14.8 mm were analyzed. The best performance was obtained for a nozzle with diameter of 8.87 mm. Kholifah et al. measured the power of the Pelton Turbine for four nozzle diameters (ranging between 5 mm and 11 mm). The highest power was obtained for the nozzle with 9 mm diameter [
20]. Petley et al. showed that increasing the angle at the tip of the injector spear causes nonoptimal jet–runner interaction [
21].
Anagnostopoulos and Papantonis presented an alternative numerical method for flow analysis in Pelton turbines based on the Lagrangian approach. The authors introduced new parameters in the equation of motion that reflected the hydraulic losses and jet scattering [
22]. Panagiotopoulos et al. [
23] used the Fast Lagrangian Simulation algorithm to simulate the jet–runner interaction in a Pelton runner.
Choi et al. presented the simulation of turbulent flow in a Pelton microturbine used in a desalination system. It was shown that the torque generated by a bucket is correlated with the flow parameters in the inlet plane on the bucket [
24].
Gupta et al. showed that time step, turbulence pattern, and finite element mesh characteristics play an important role in transient multiphase flow [
25].
The analysis of the influence of fluid velocity and injector opening on the sediment flow erosion of the buckets of a Pelton runner was reviewed by Ge et al. [
26]. The authors showed that increasing the jet velocity accentuates the sediment erosion phenomenon, while the injector opening had a low influence on the erosion phenomenon. Increasing jet velocity also accentuated erosion on the injector spear [
27]. Jet velocity and bucket geometry influenced sediment erosion on Pelton runners [
28].
Zeng et al. [
29] performed a simulation of the entire flow path in a Pelton turbine (adduction, four injectors, runner, turbine casing). It was shown that there was a risk of interaction between two adjacent jets if the turbine head decreased. This risk also occurred if the angle between the two jets were reduced.
Zidonis et al. [
30] used computational fluid dynamics for the optimization of two Pelton runners. It was shown that the optimal operating points of the runners are closely related to the specific velocity.
The research presented in this paper aims to study the influence of turbine head, injector nozzle diameter and injector opening on free jet flow (velocity, pressure distribution). Additionally, the influence of these parameters on the flow rate and on the forces generated on the injector nozzle and injector spear is identified. The characterization of the free jet flow allows the identification of the optimal combinations of values for the turbine head, the nozzle diameter, and the injector opening that generate the highest pressure at the inlet surface of the turbine runner. The pressure distributions can be used as input data for the strength calculation of the Pelton runner bucket.
2. Materials and Methods
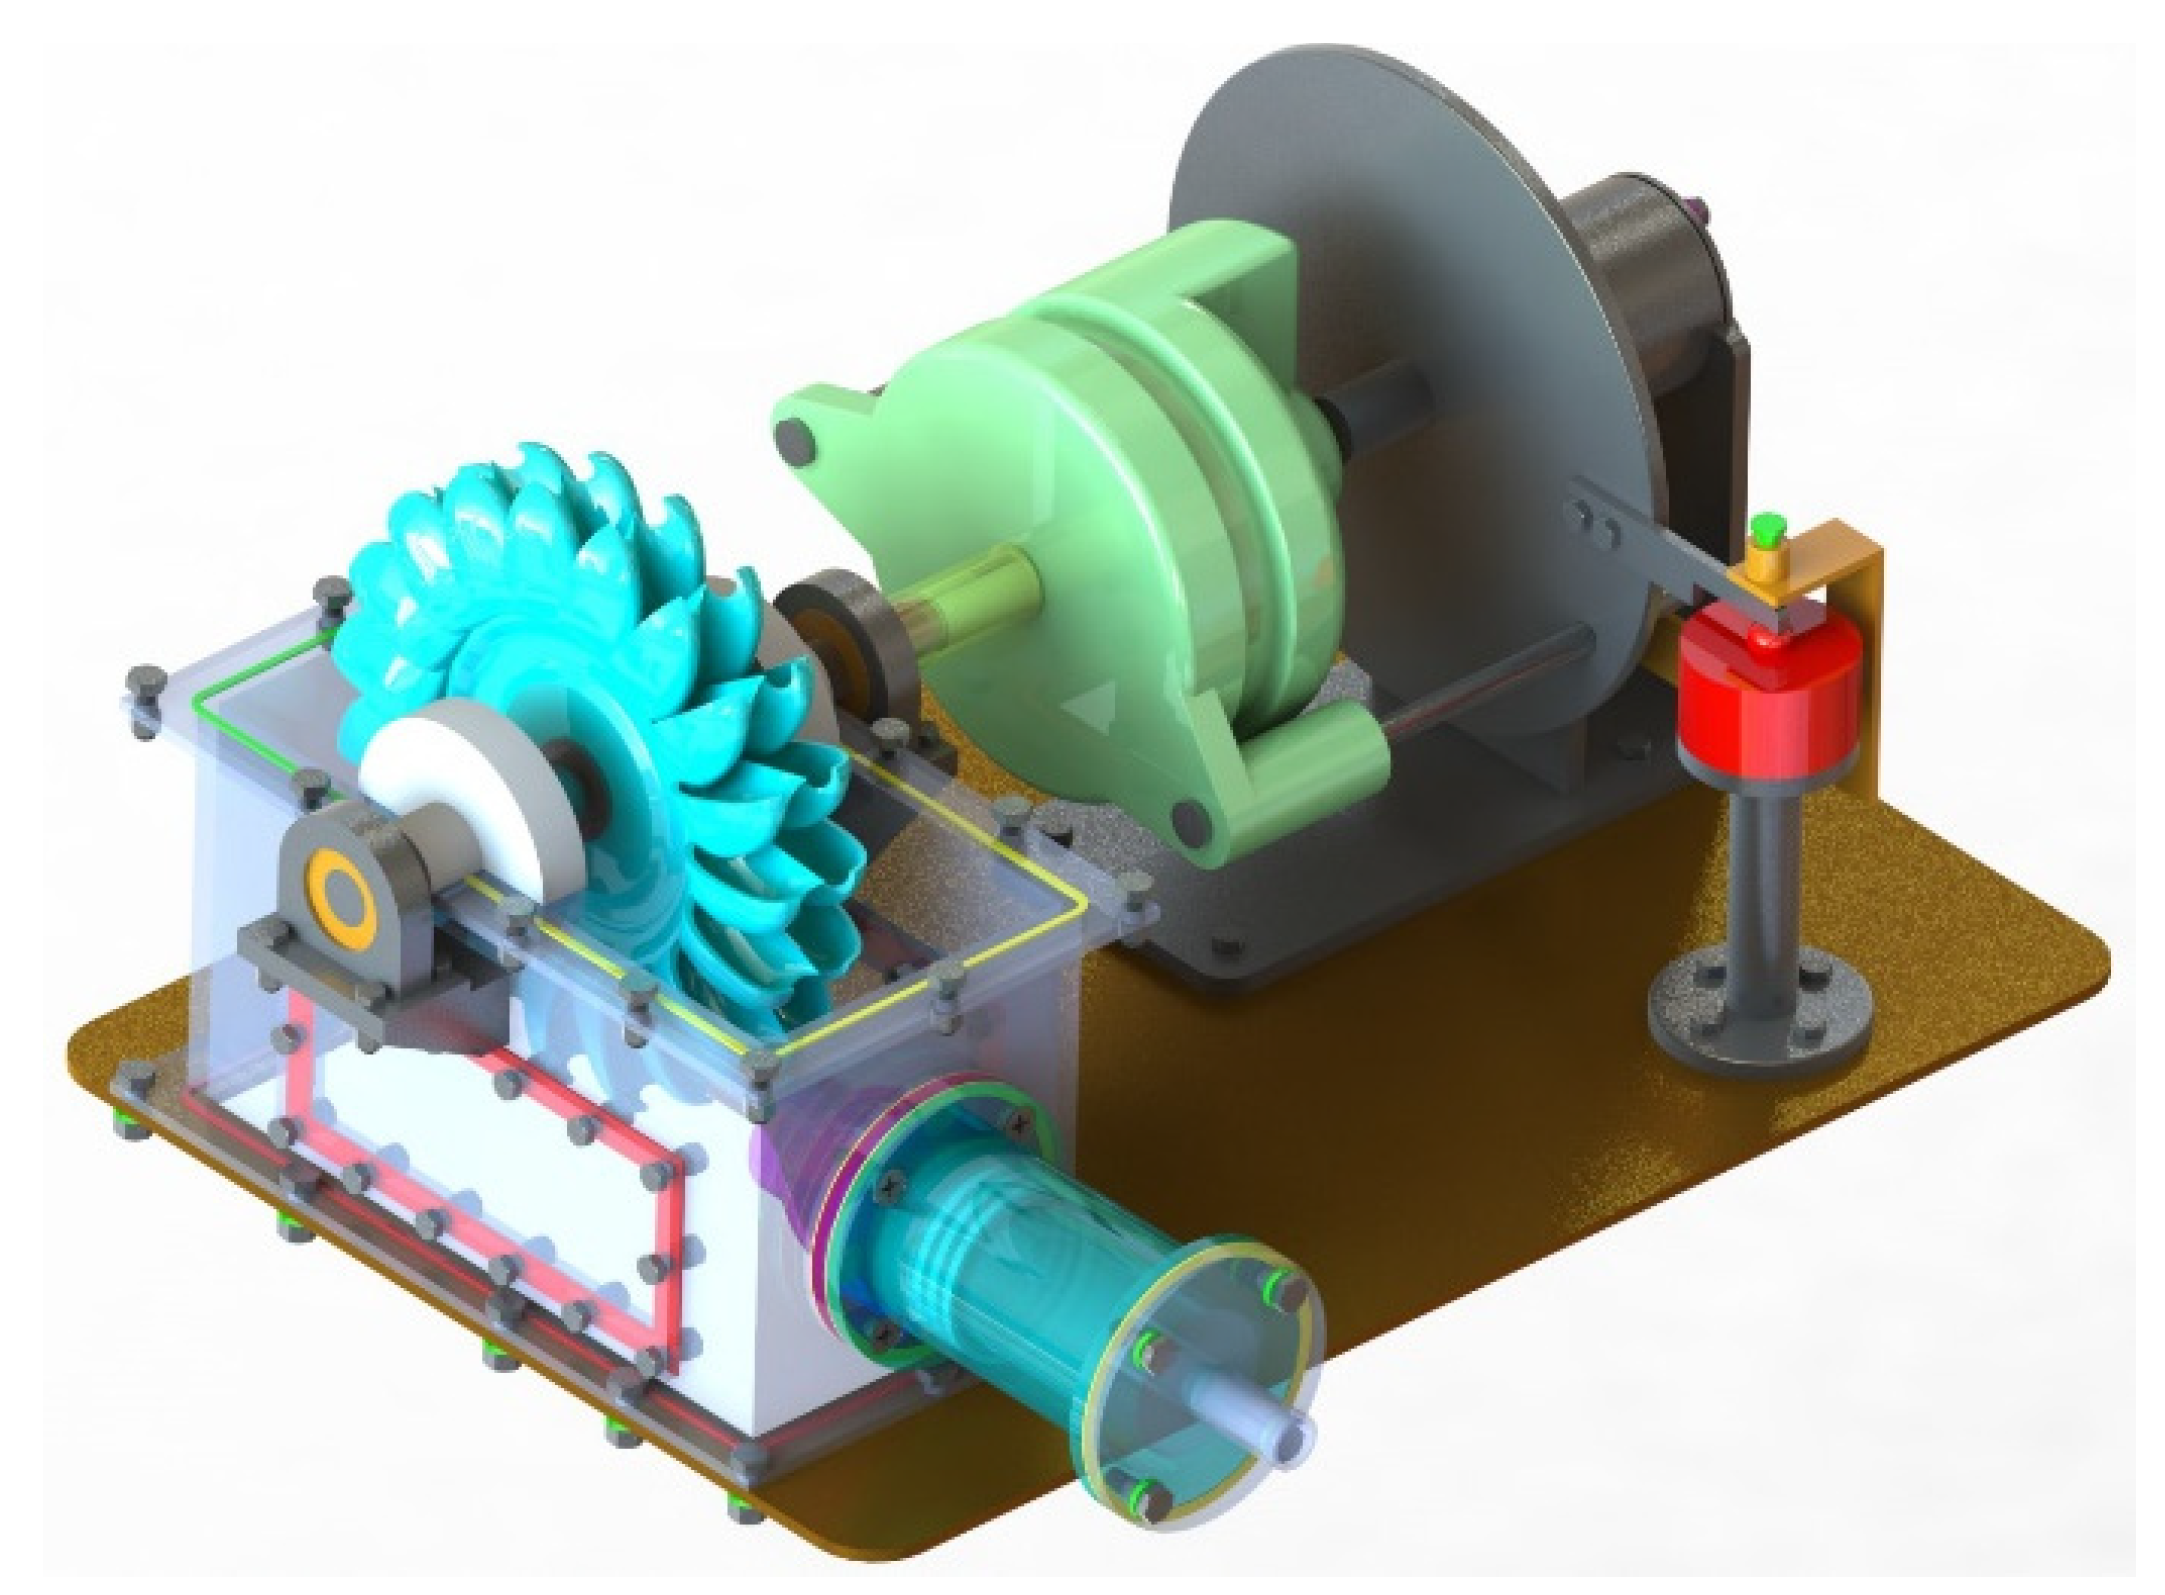
Numerical analyses were performed on the Pelton microturbine shown in
Figure 1. The microturbine assembly consists of the following main components: runner, injector (injector nozzle and spear, spacer rings), connecting pipe, runner casing, shaft, alternator, force transducer, base plate [
31,
32]. On the base plate is placed the microturbine casing and the alternator coupled to the turbine shaft. The alternator and the force transducer components (alternator support disc, alternator support, stopper, force transducer support, force transducer) constitute the torque measuring system. The torque on the turbine shaft is calculated as the product of the force measured by the force transducer and the distance between the transducer and the runner shaft axis.
The components of the flow path were designed using the “Pelton Design”, a computing application developed in Python by the first author [
31]. For the numerical simulations 3 injectors were used, with different nozzle inner diameters: 13.3 mm, 14.8 mm and 16.3 mm. The inner angle of the nozzle was 30°. The injectors had a tip angle of 45.05°.
Numerical simulations were performed using SolidWorks FlowSimulation. The following steps were completed for the flow simulation: design of the 3D geometry of the components which define flow path; set-up of flow simulation study, analysis type and control volume; set-up of boundary conditions; input of convergence criterion; running of flow study; visualization and analysis of results.
Flow Simulation predicts turbulent flows based on the Favre-averaged Navier–Stokes equations considering time-averaged effects of the flow turbulence, direct time-dependent phenomena and extra terms with additional information known as the Reynolds stresses. To solve the equations system, flow simulation uses the k-ɛ model with a discrete numerical technique based on the finite volume method applied in a rectangular coordinate system [
33].
The geometry analyzed in the numerical simulation included: the connecting pipe (turbine inlet), the injector (nozzle + injector spear), the spacer rings (defining the position of the injector spear) and the microturbine casing.
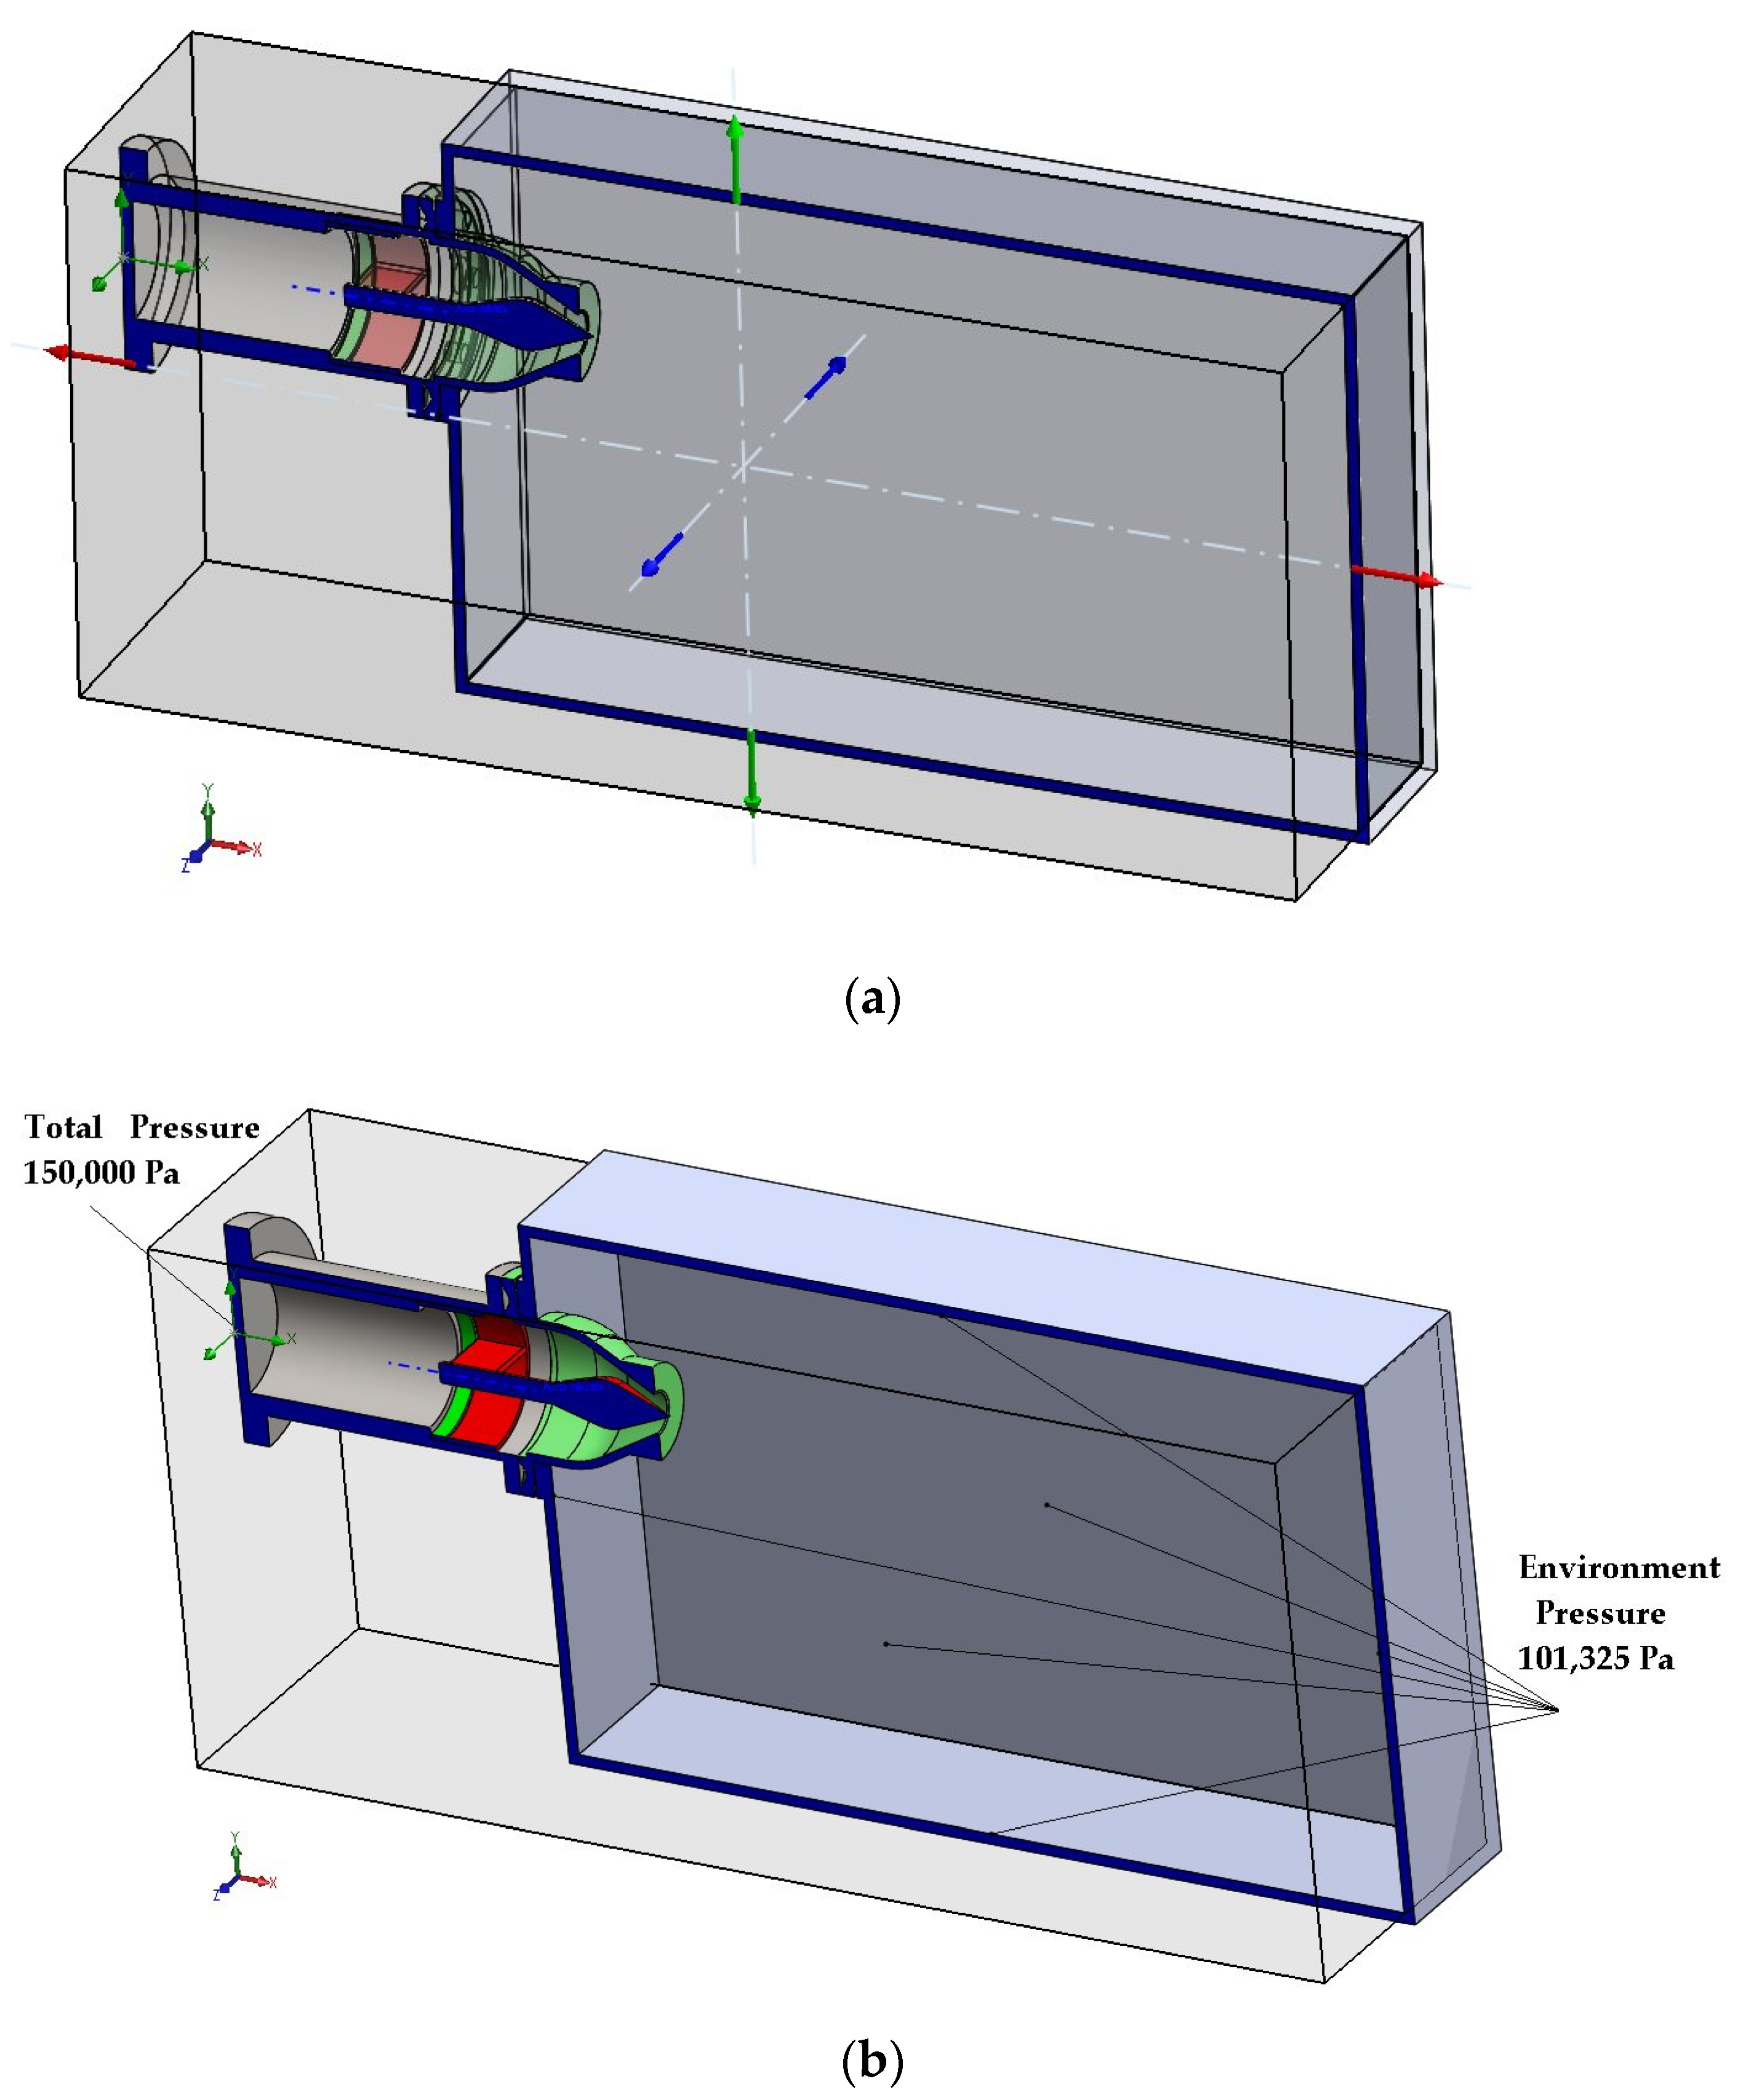
In SolidWorks Flow Simulation the geometry of the model is analyzed and the prismatic control volume is generated that includes the analyzed model. The computational domain is the region where the flow calculations are performed, and it is automatically created by flow simulation to enclosing the 3D model. The computational domain is a rectangular parallelepiped parallel to the Global Coordinate System planes.
Figure 2a shows computational domain with the origin of the reference system coincidently with the inlet to the nozzle, the X-direction oriented in the flow direction and the Y and Z directions oriented radially to the jet (
y axis is vertical). The computational domain limits are X = 3.5/450 mm, Y = 60/−140 mm and Z = −55/+ 55 mm. The analysis performed was of the Internal type, using the following initial conditions:
- -
Adiabatic wall (all model walls are thermally insulated);
- -
Roughness (a value of 0 for wall roughness was accepted);
- -
Environment Pressure 101,325 Pa;
- -
Fluid type: H2O.
The boundary conditions consist of imposing the total pressure on the inlet section of the injector and the atmospheric pressure on the inner walls of the casing,
Figure 2b. Five distinct values were used for the inlet total pressure: 150,000 Pa, 200,000 Pa, 250,000 Pa, 300,000 Pa and 350,000 Pa, corresponding to the following turbine heads: H = 15 m, H = 20 m, H = 25 m, H = 30 m and H = 35 m.
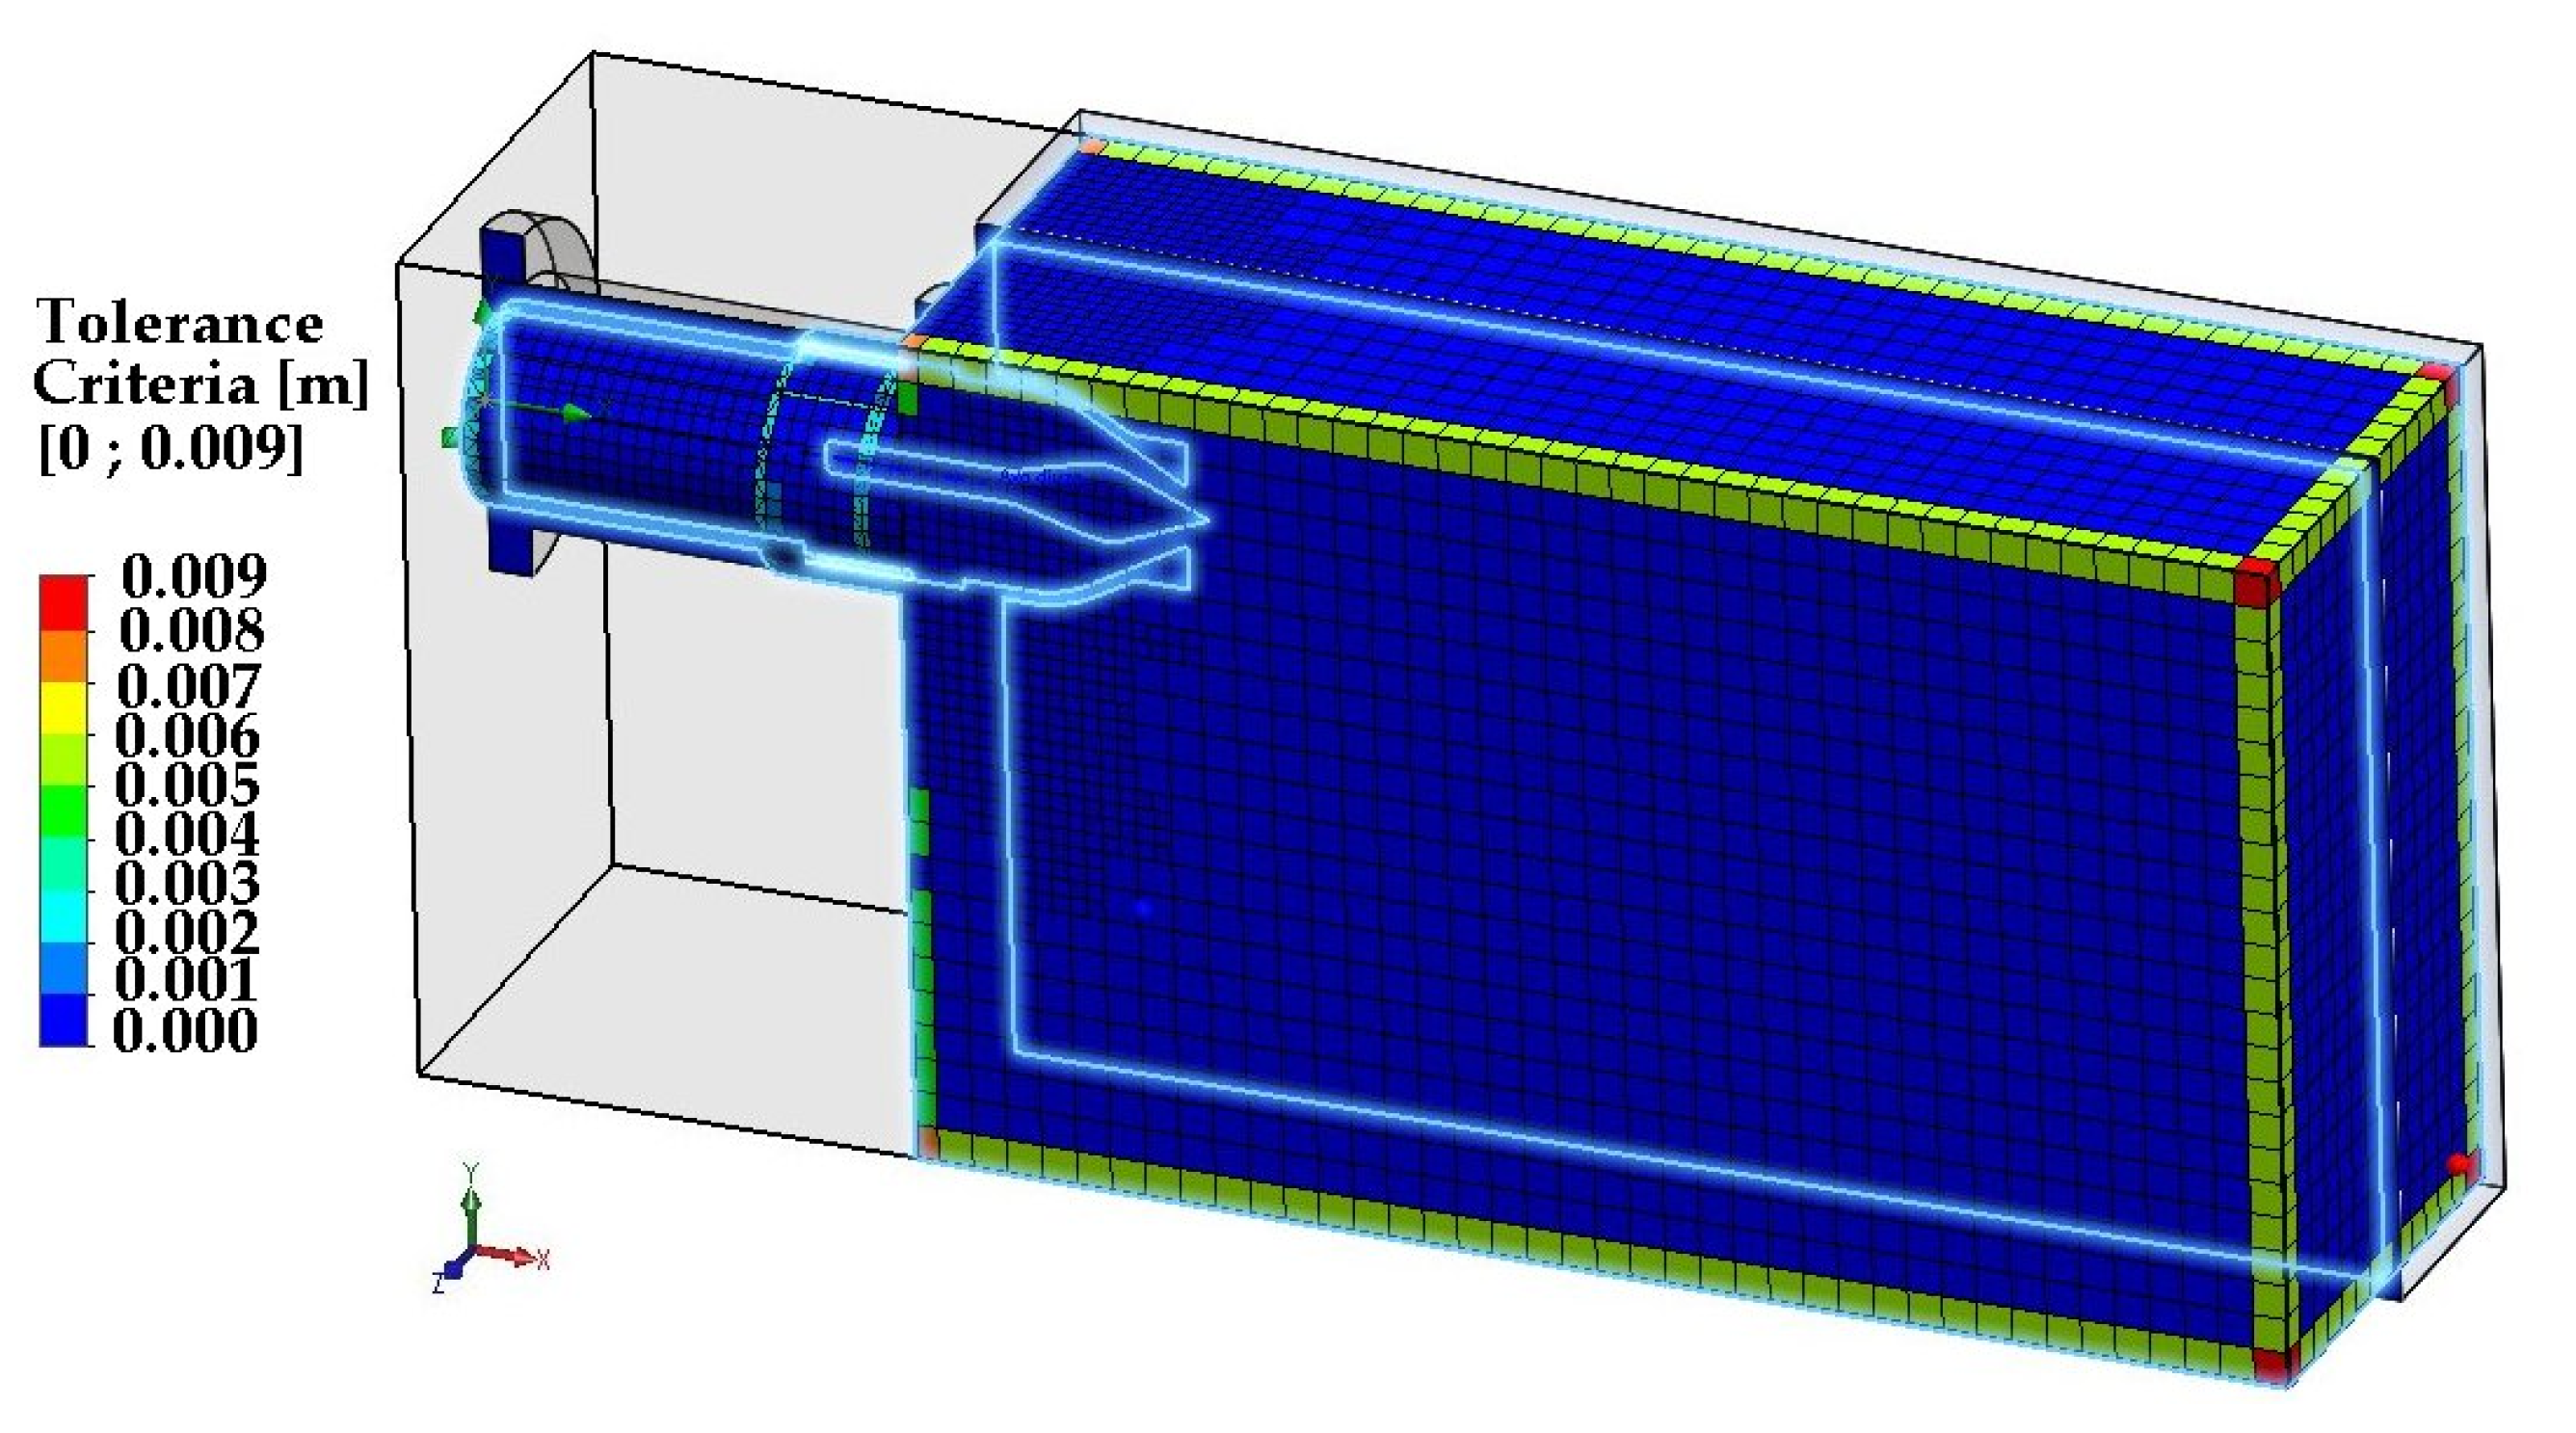
The mesh process begins by dividing the computational domain into uniform rectangular cells of parallelepiped shape, called the Basic Mesh. During the computation, a refinement of the Basic Mesh is generated based on information about geometry, boundary conditions and convergence criteria. This results in a finer mesh, consisting of smaller cells associated with the fluid and solid, especially in areas with non-linear behavior of the phenomenon, which ensures better accuracy of the numerical solution and results even for coarser mesh compared to other CFD methods [
33].
Figure 3 show the mesh and the tolerance criteria between [0; 009] m. Tolerance criteria control how well (with what tolerance) mesh polygons approximate the real interface.
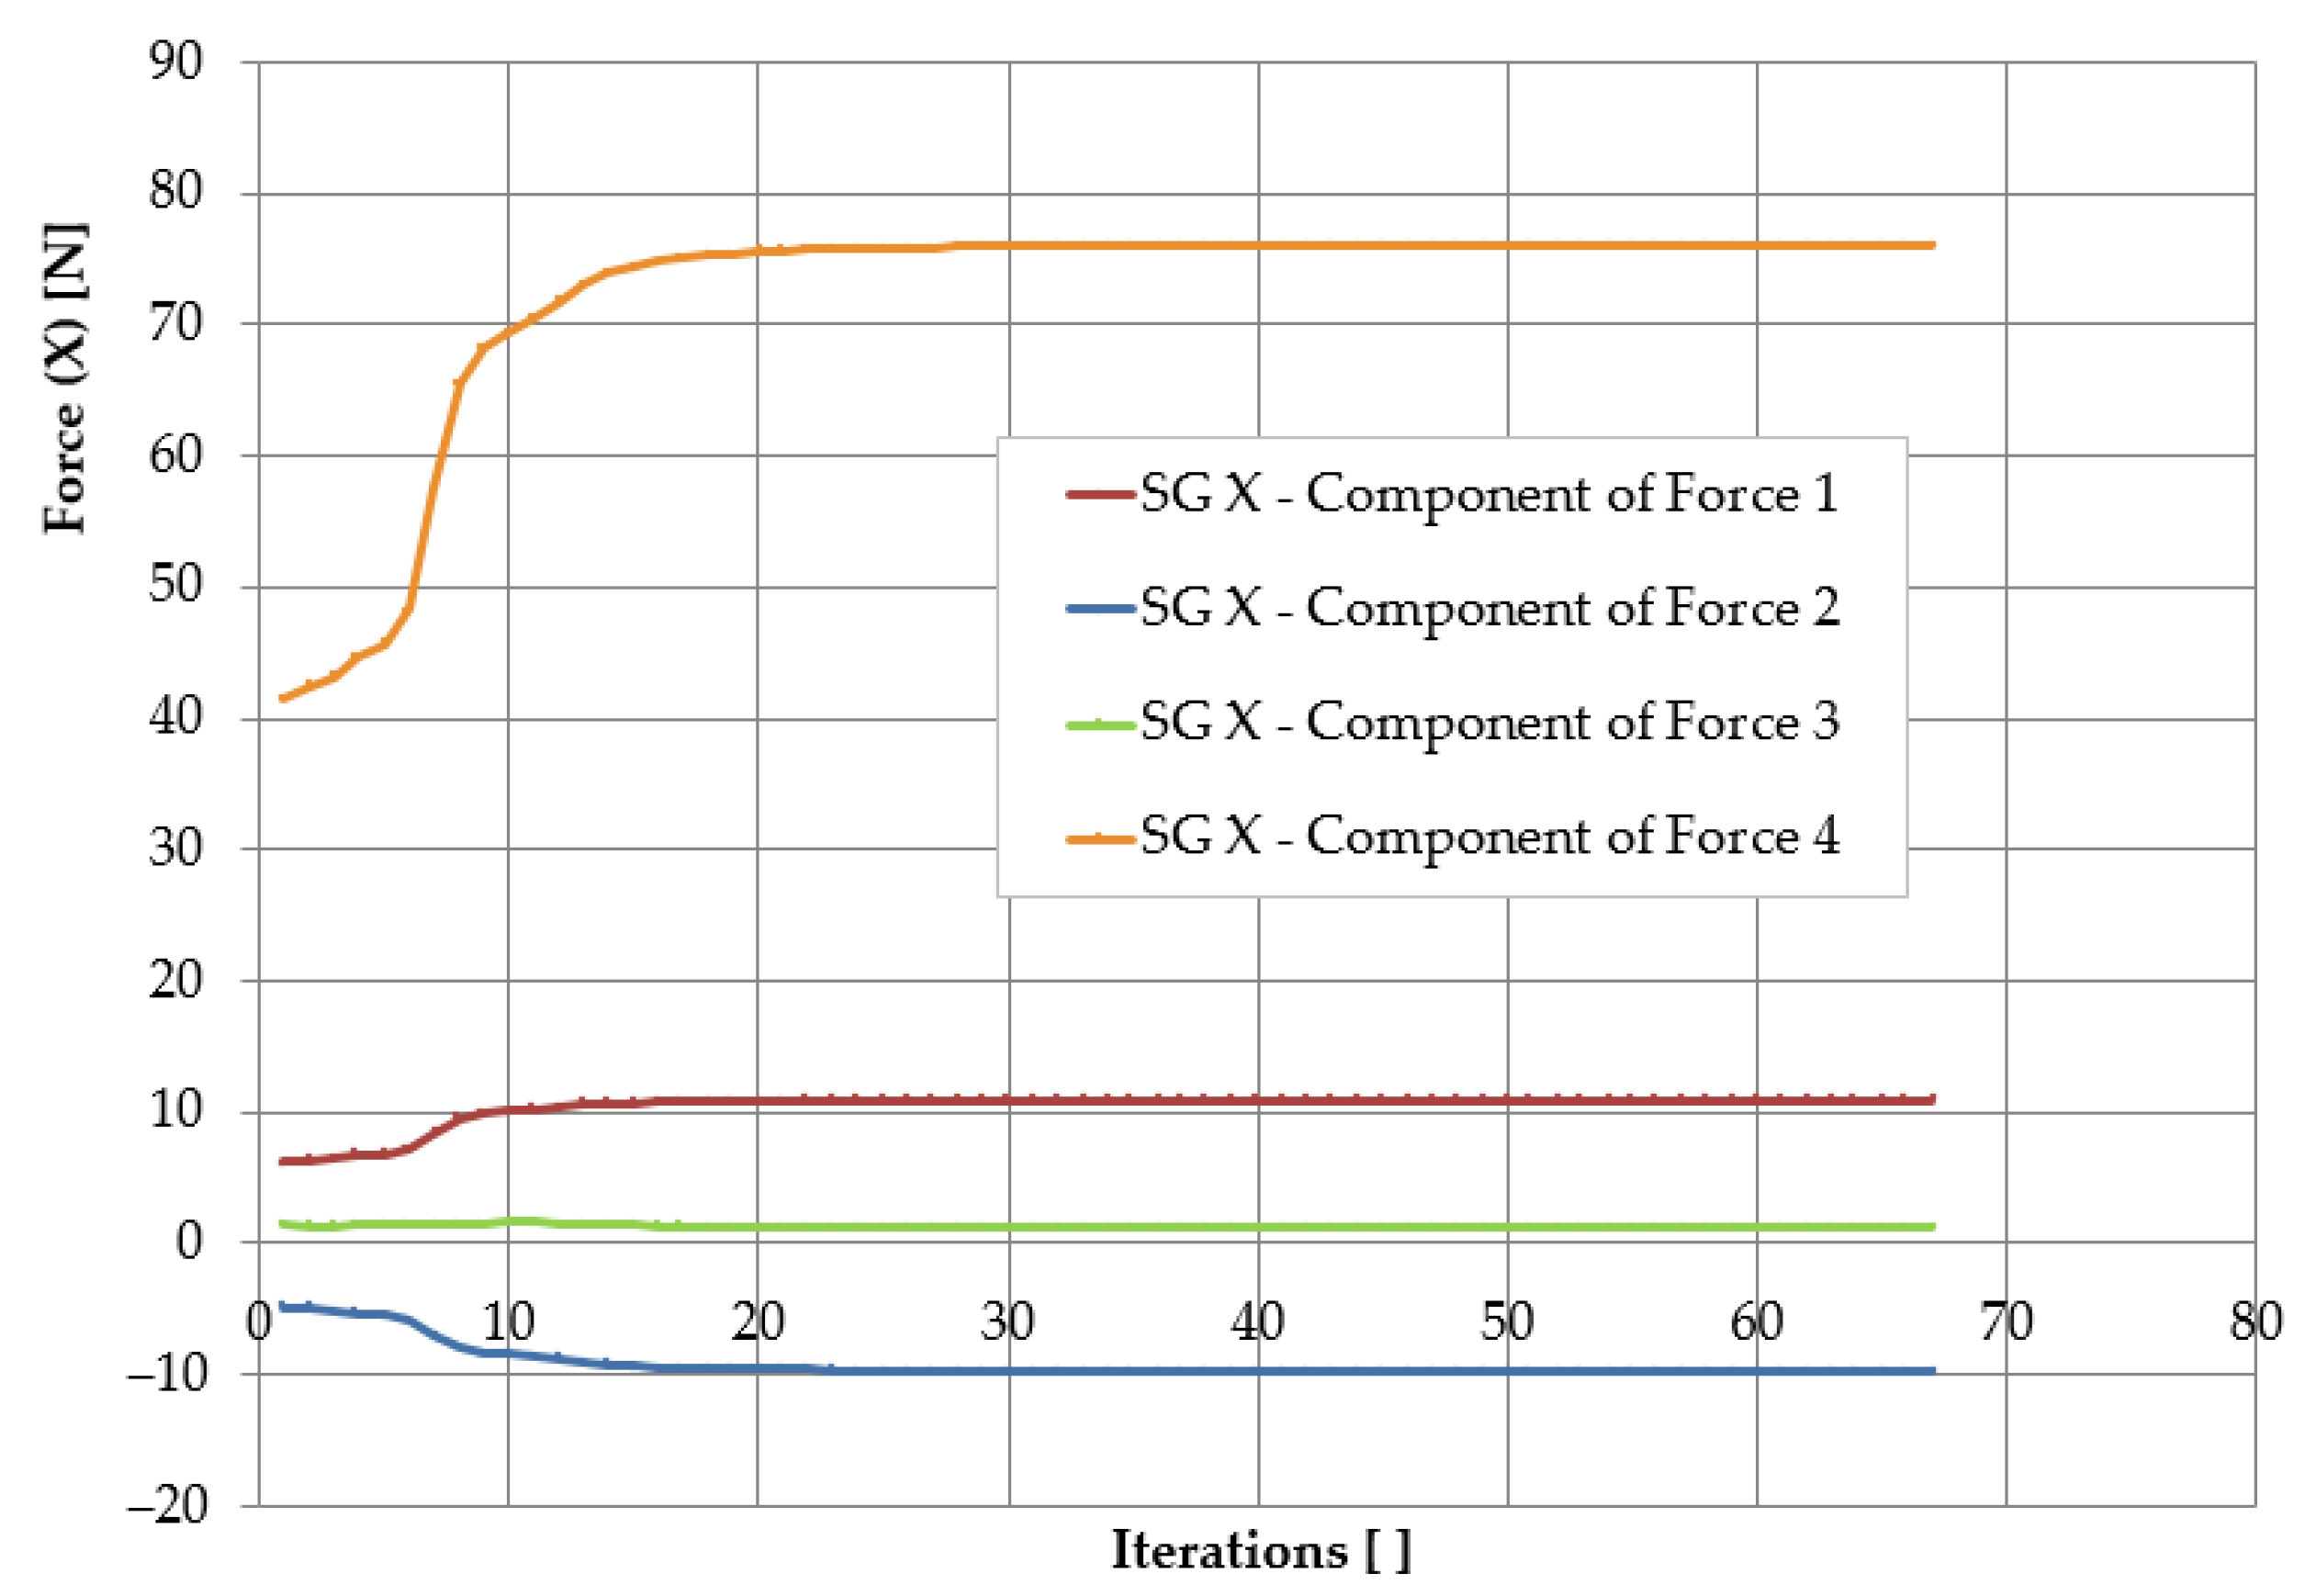
SolidWorks Flow Simulation initially considers any stationary flow problem as time-dependent. The solver iterates a determined time step to reach stationary flow states, so it becomes necessary to have criteria for identifying the attainment of stationary flow to complete the computation. Flow Simulation includes internal criteria for stopping the solution, but it is better to use specific criteria. Flow Simulation offers the following types of criteria: global, point, area, volume, and equation. For this simulation, the following global and surface convergence criteria were specified:
- -
GG Av Static Pressure 1—the globally averaged static pressure criterion;
- -
GG Av Total Pressure 1—the globally averaged total pressure criterion;
- -
GG Av Dynamic Pressure 1—the globally averaged dynamic pressure criterion;
- -
GG Mass Flow Rate 1—global mass flow-rate criterion;
- -
SG X—Component of Force 1—the X-direction area criterion of the force on the left side of the injector spear;
- -
SG X—Component of Force 2—the area criterion in the X-direction of the force on the right side of the injector spear;
- -
SG X—Component of Force 3—the area criterion in the X-direction of the force on the whole injector spear;
- -
SG X—Component of Force 4—the X-direction surface criterion of the force on the inner surface of the nozzle.
The criteria configuration will ensure the convergence of the solution, as the calculation will not be completed until the criteria are convergent over the entire control volume. A chart convergence example of the force components is presented in
Figure 4.
During simulation, SolidWorks Flow Simulation provides information about the current state of the solution by monitoring changes in the convergence criteria and viewing preliminary results in selected planes.
At the end of the simulation the following results are available:
- -
Flow rate Q, on the inlet surface of the nozzle;
- -
Force on the nozzle;
- -
Force on the whole injector spear is calculated as the resultant of the force occurring on the left surface and the force occurring on the right surface of the spear; For the injector spear, the left side is differentiated from the right side by the spear steam diameter;
- -
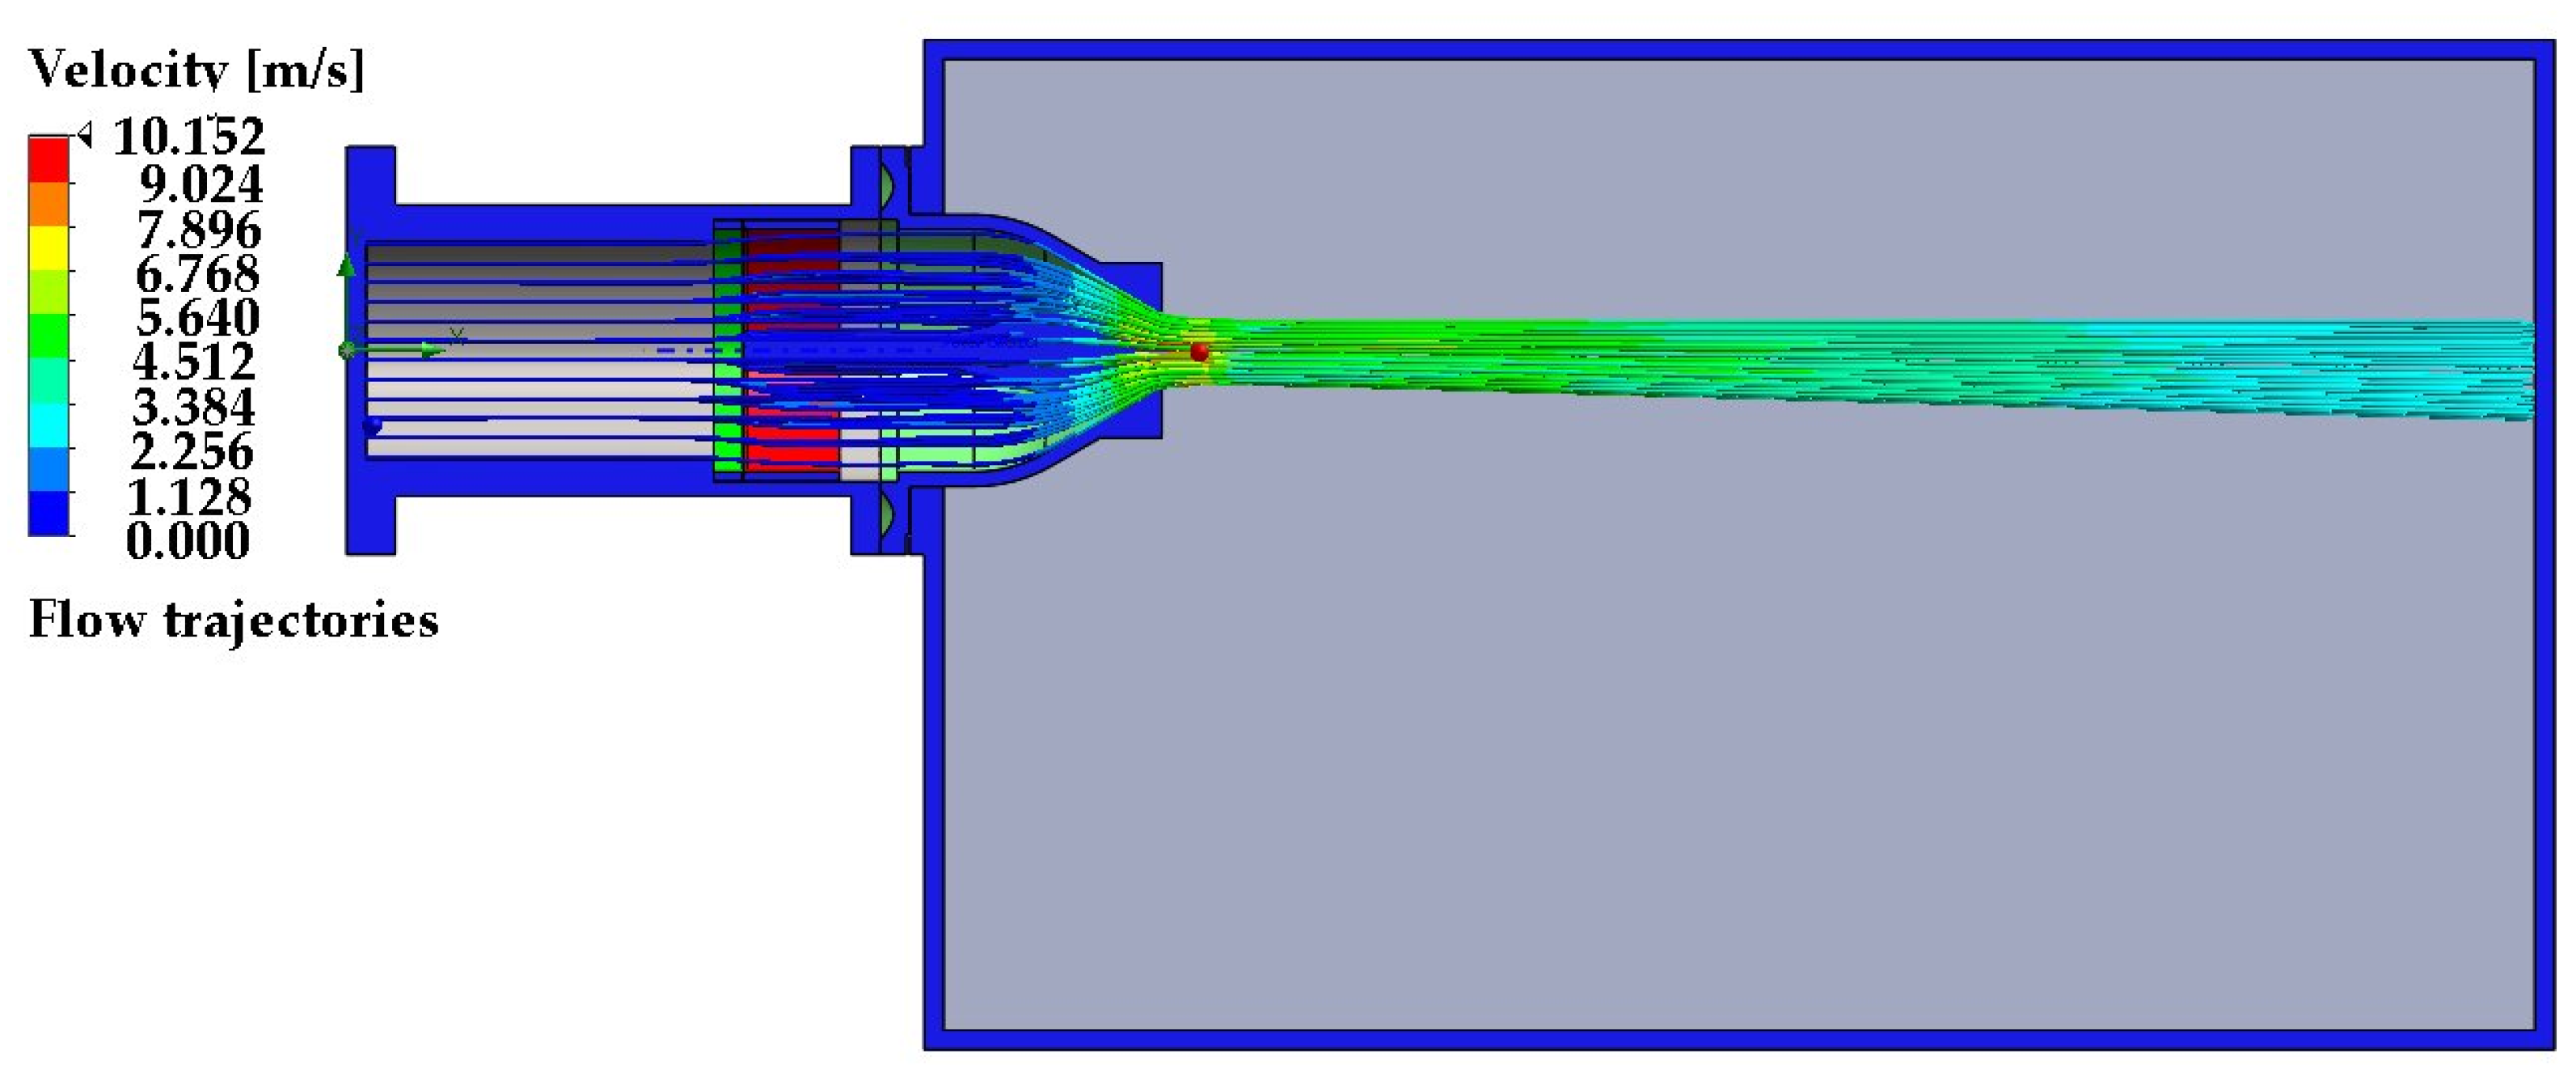
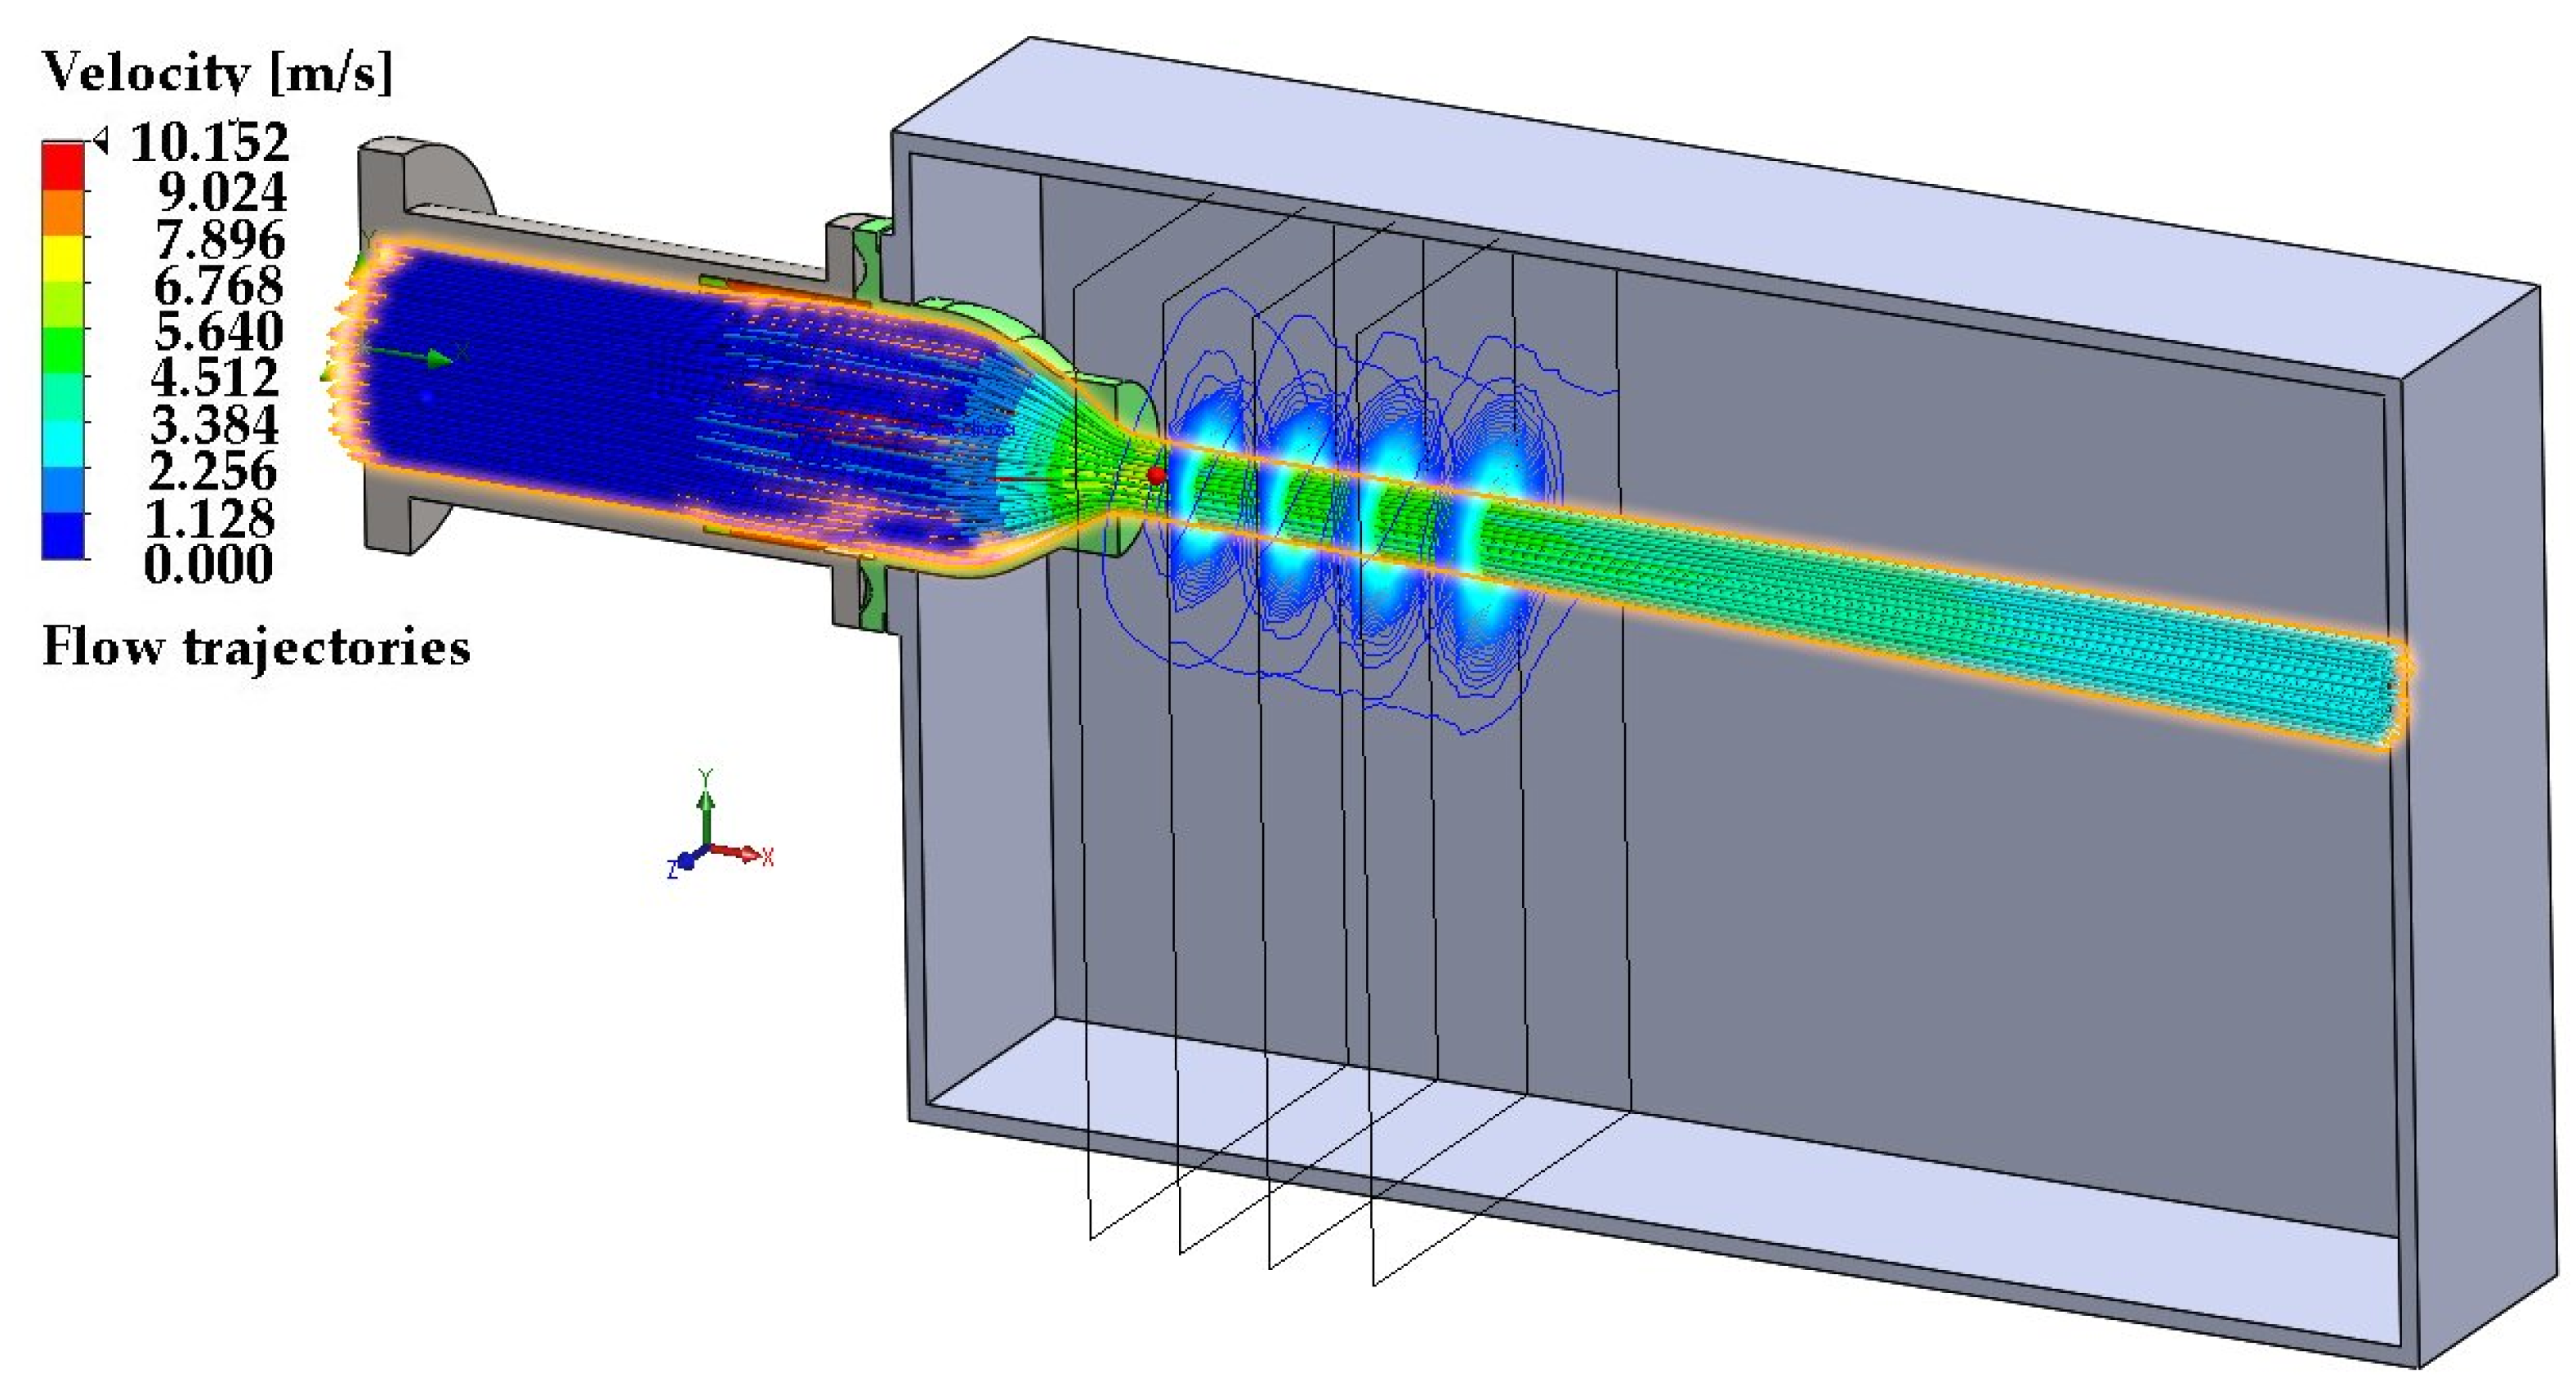
The trajectories of the flow lines (
Figure 5);
- -
The velocity (
Figure 6) and pressure distribution;
- -
The chart convergence for all imposed goals criteria.
3. Results and Discussion
3.1. Analysis of Injector Flow Rate and Force Characteristics
The results of numerical simulation are presented for the three injectors (nozzle with Ø13.3 inner diameter; nozzle with Ø14.8 inner diameter and nozzle with Ø16.3 inner diameter), five turbine heads (H = 15 m, H = 20 m, H = 25 m, H = 30 m and H = 35 m) and six injector openings (S = 3 mm, S = 6 mm, S = 9 mm, S = 12 mm, S = 15 mm and S = 18 mm).
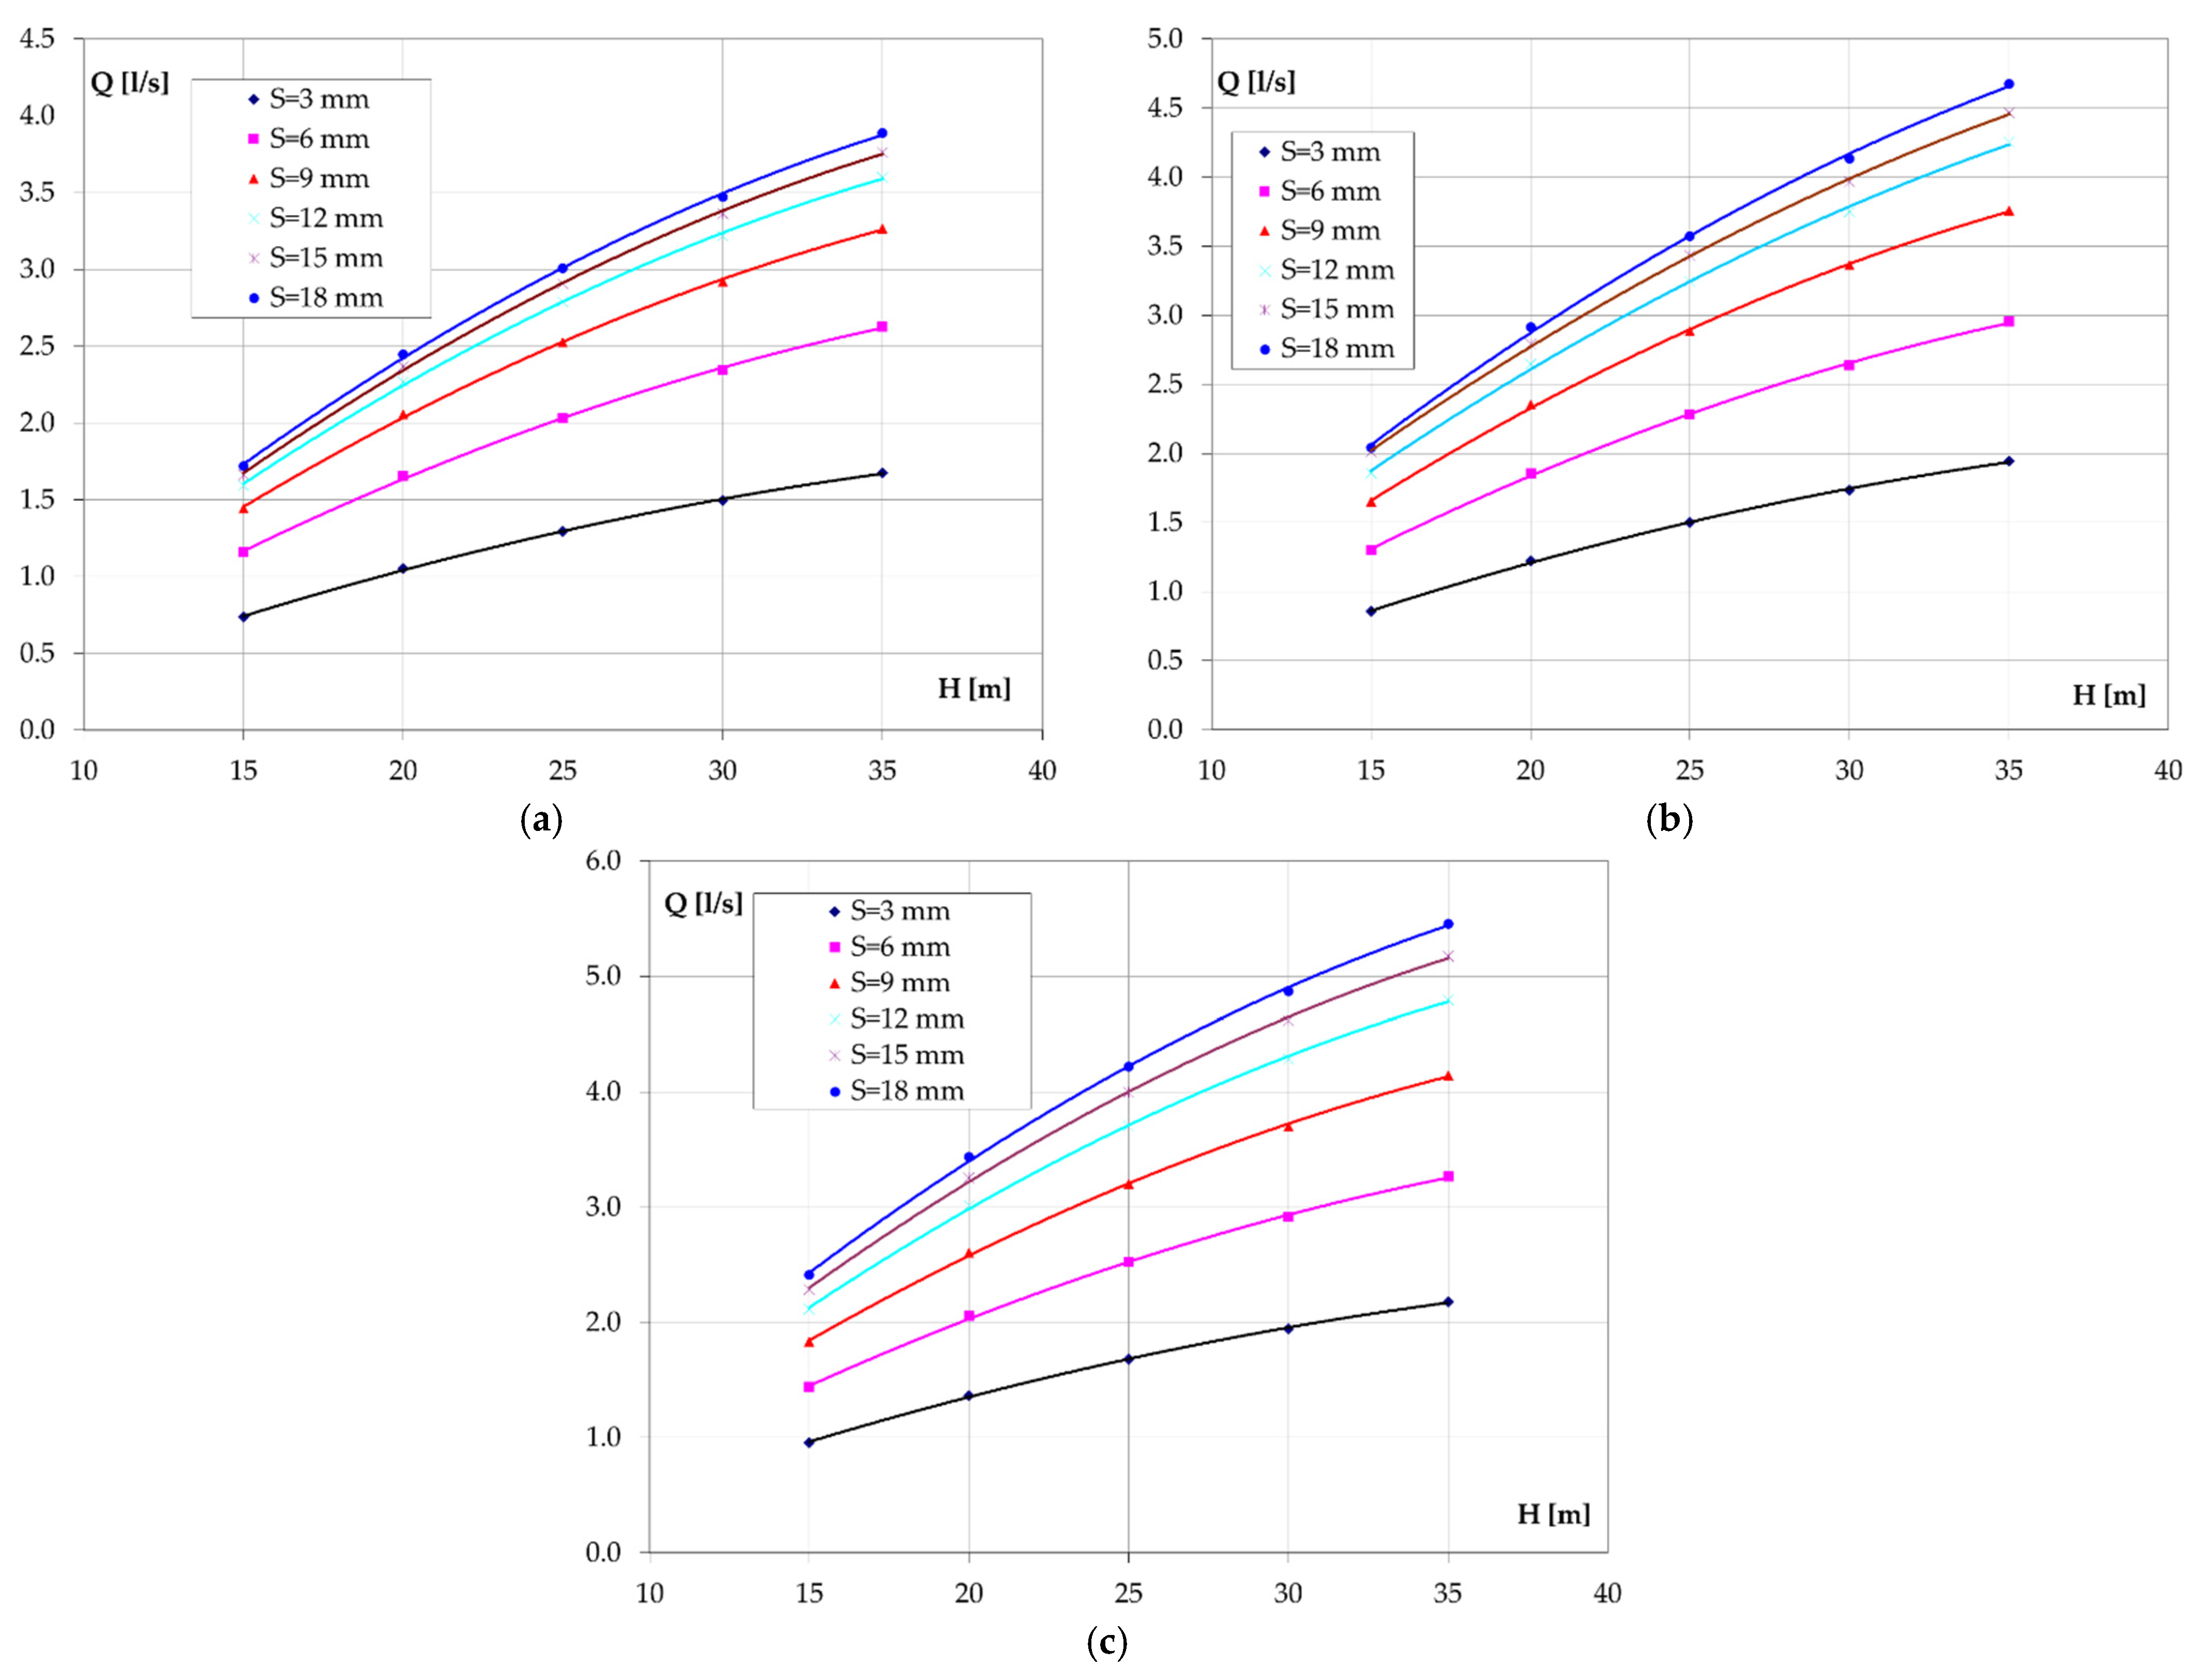
The flow characteristics Q = f(H) obtained for the three injectors are shown in
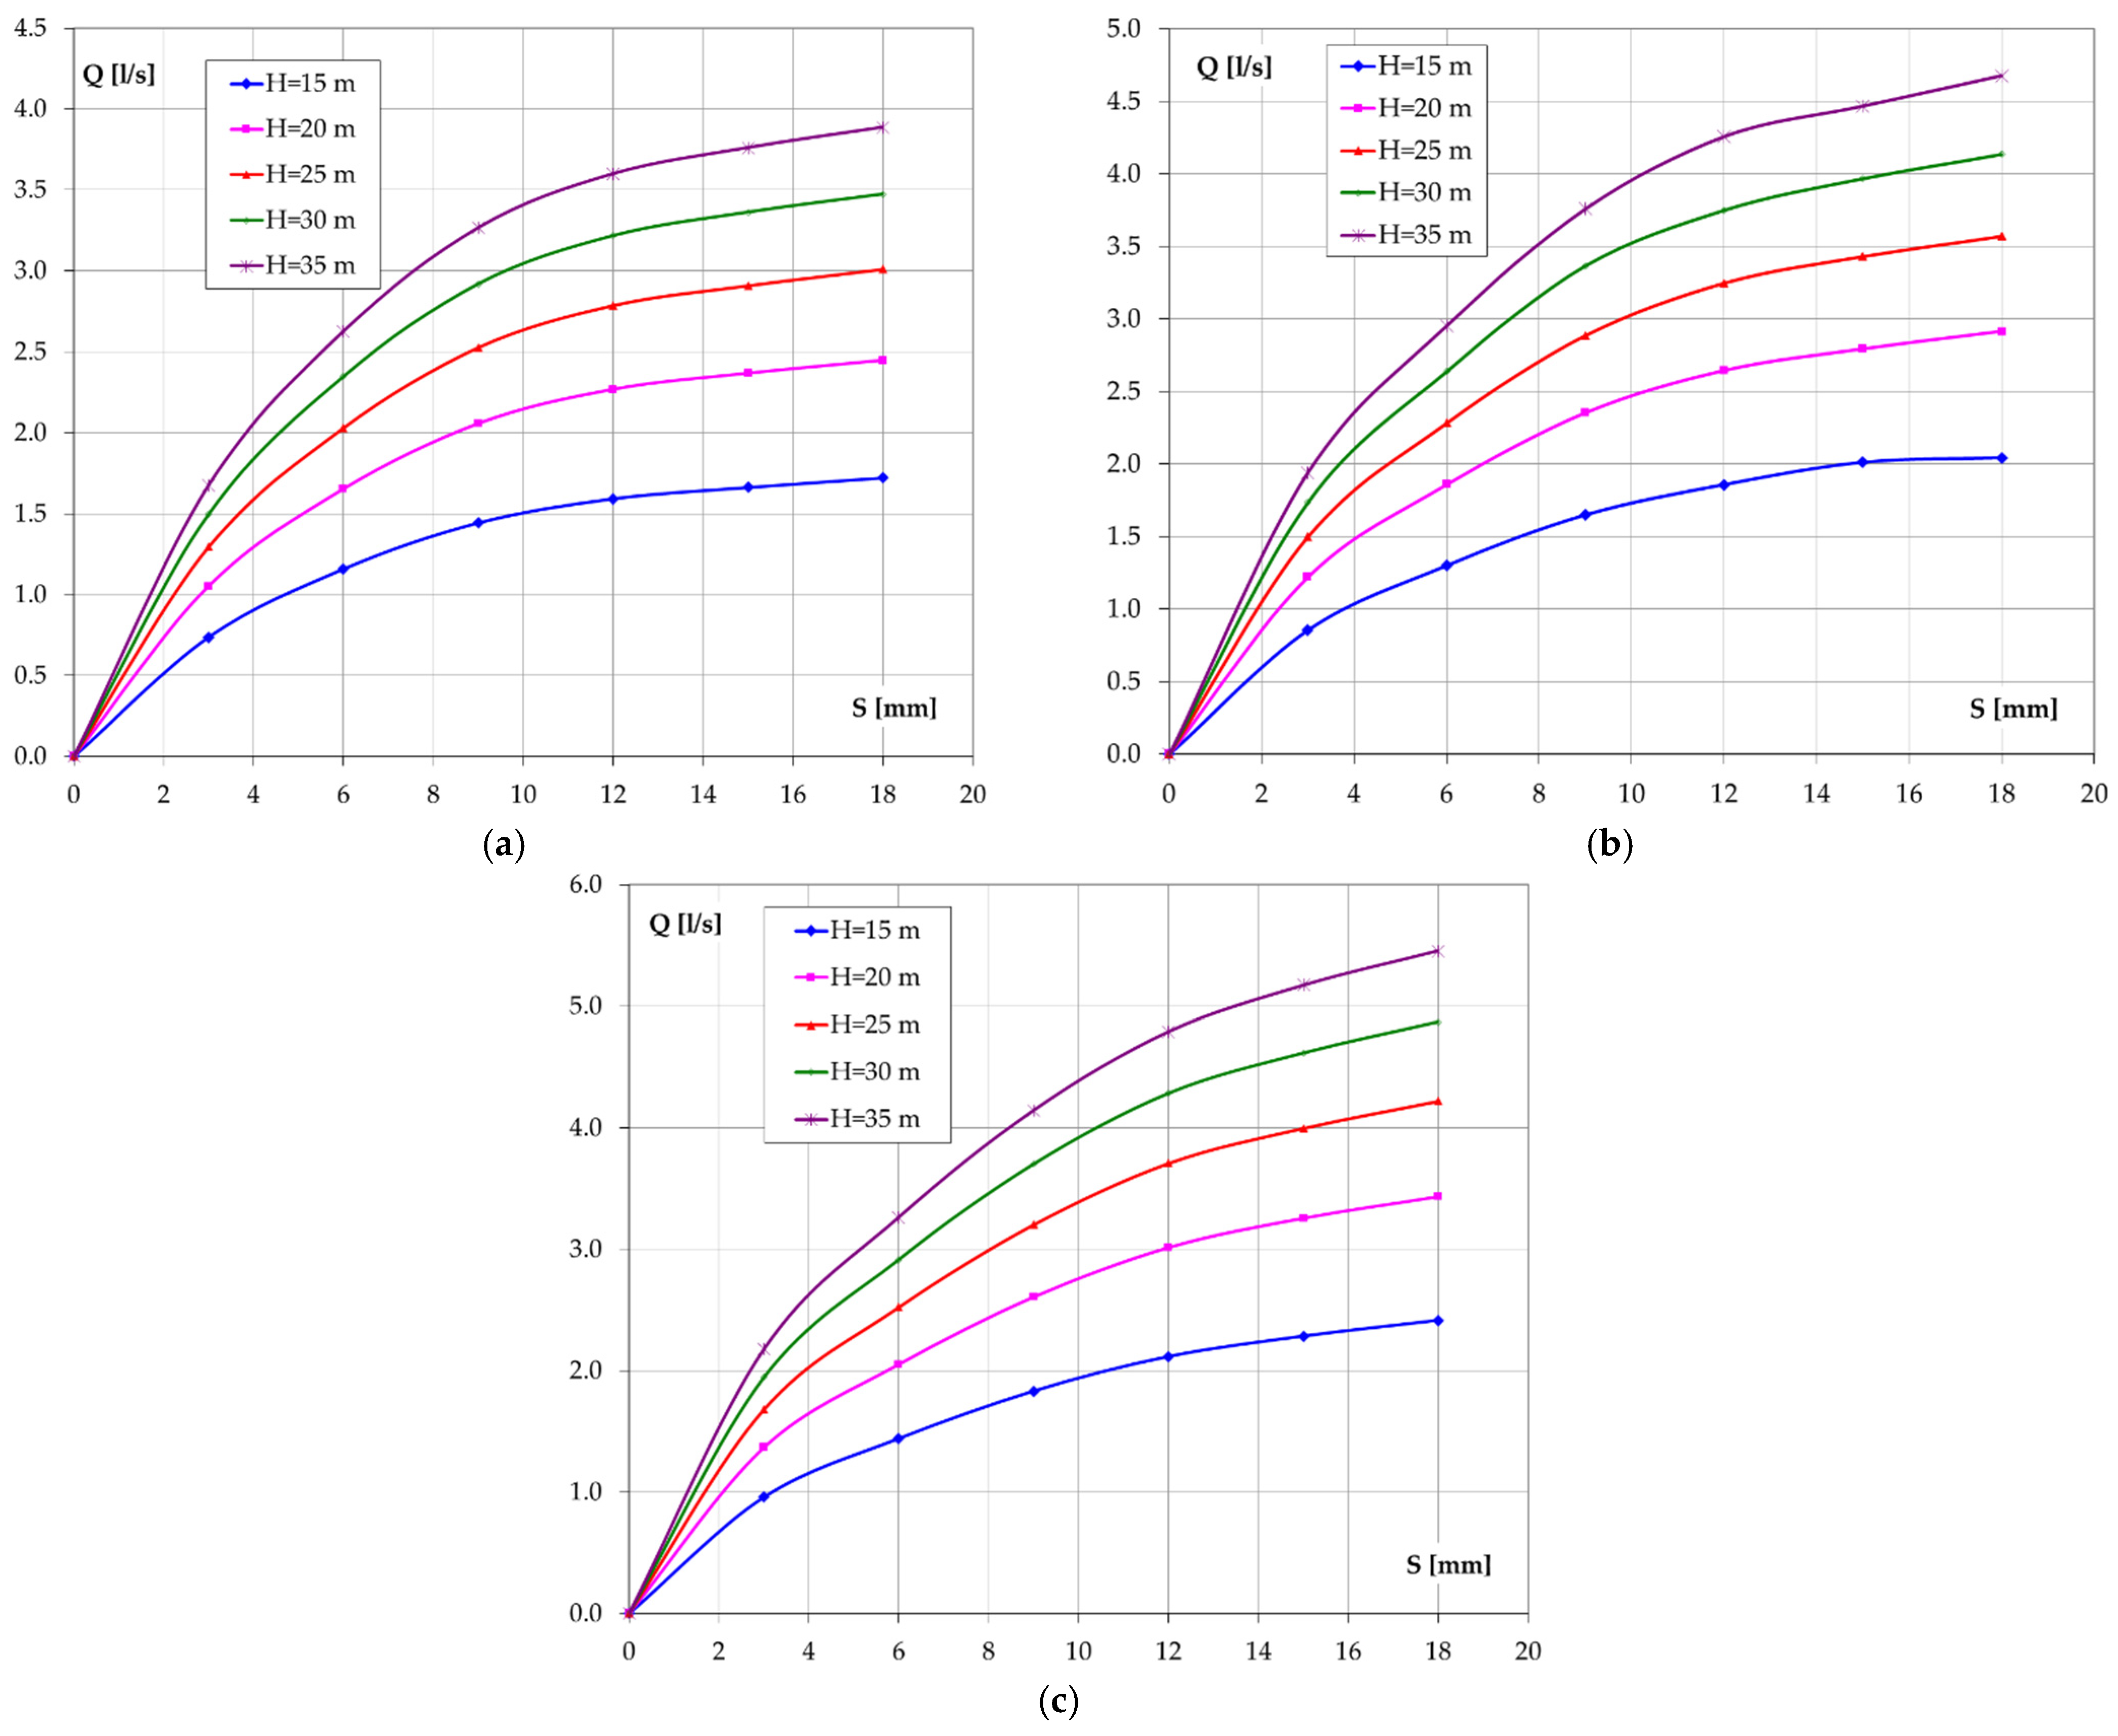
Figure 7. The flow characteristics corresponding to the six values of the injector opening S were plotted for each nozzle.
Figure 8 shows the flow characteristic Q = f(S) plotted for the five heads used in the calculation. It can be seen that the flow rate increases with increasing head, increasing nozzle diameter and increasing injector opening. The increase of the inner diameter of the nozzle accentuates the variation of flow rate versus turbine head. Additionally, the increase in nozzle diameter has a low influence on the variation of flow rate with injector opening (this can be verified by dividing the values of flow rate to a minimum or maximum value). Analyzing
Figure 7 and
Figure 8 it can be seen that the greatest influence on the flow rate is given by the variation of the head, followed by the variation of the injector opening and the variation of the nozzle inner diameter.
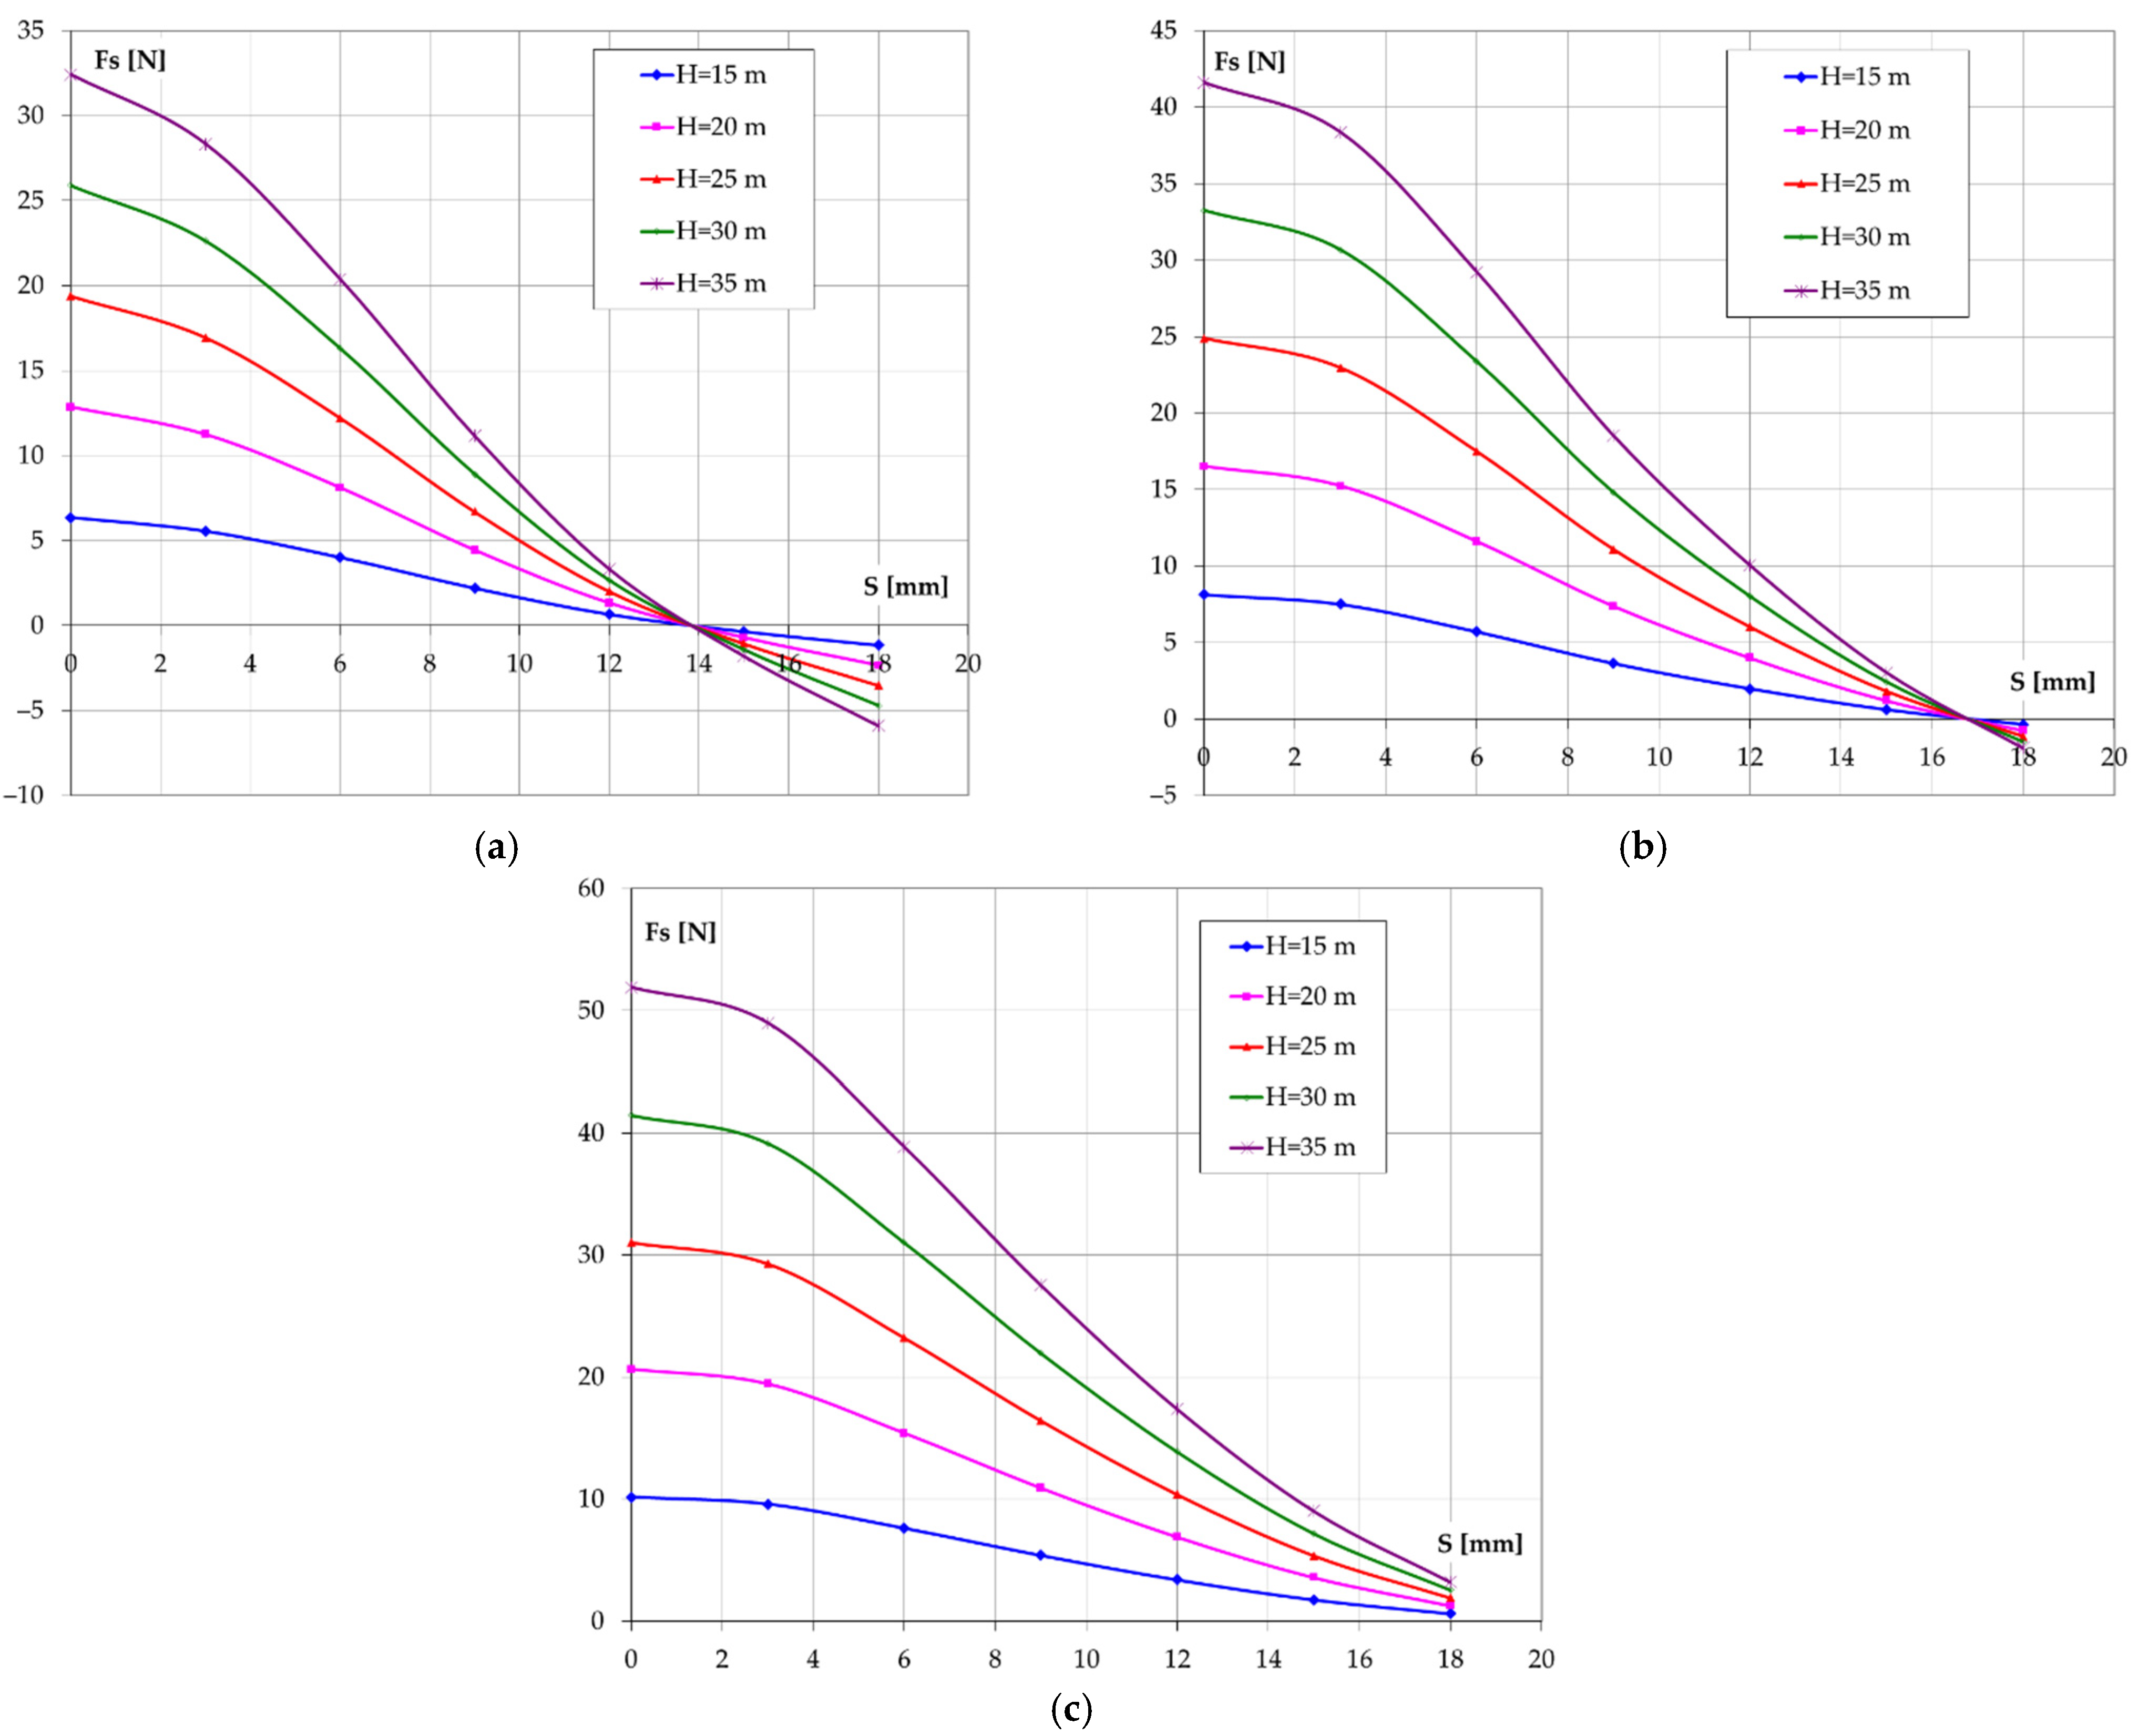
Figure 9 shows the variation of the resultant force F
s acting on the injector spear, calculated as the algebraic sum of the resultant forces on the left and right sides of the injector. This force characteristic F
s = f(S) was determined for the five computational heads.
For the Ø13.3 diameter nozzle, in the closed position of the injector and with the openings S = 3 mm, S = 6 mm, S = 9 mm, S = 12 mm the resultant force is positive (considering the positive direction of the force oriented in the water flow direction), while for the openings S = 15 mm and S = 18 mm the force is negative. At the nozzle Ø14.8 only the opening S = 18 mm generates a negative value of the resultant force. At the nozzle Ø16.3 the resistive force is positive for all six openings used in the calculations. The resultant forces on the injector spear increase with increasing nozzle diameter and increasing head and decrease with increasing injector opening. Injector opening and turbine head have the greatest influence on the variation of the resulting force on the injector spear.
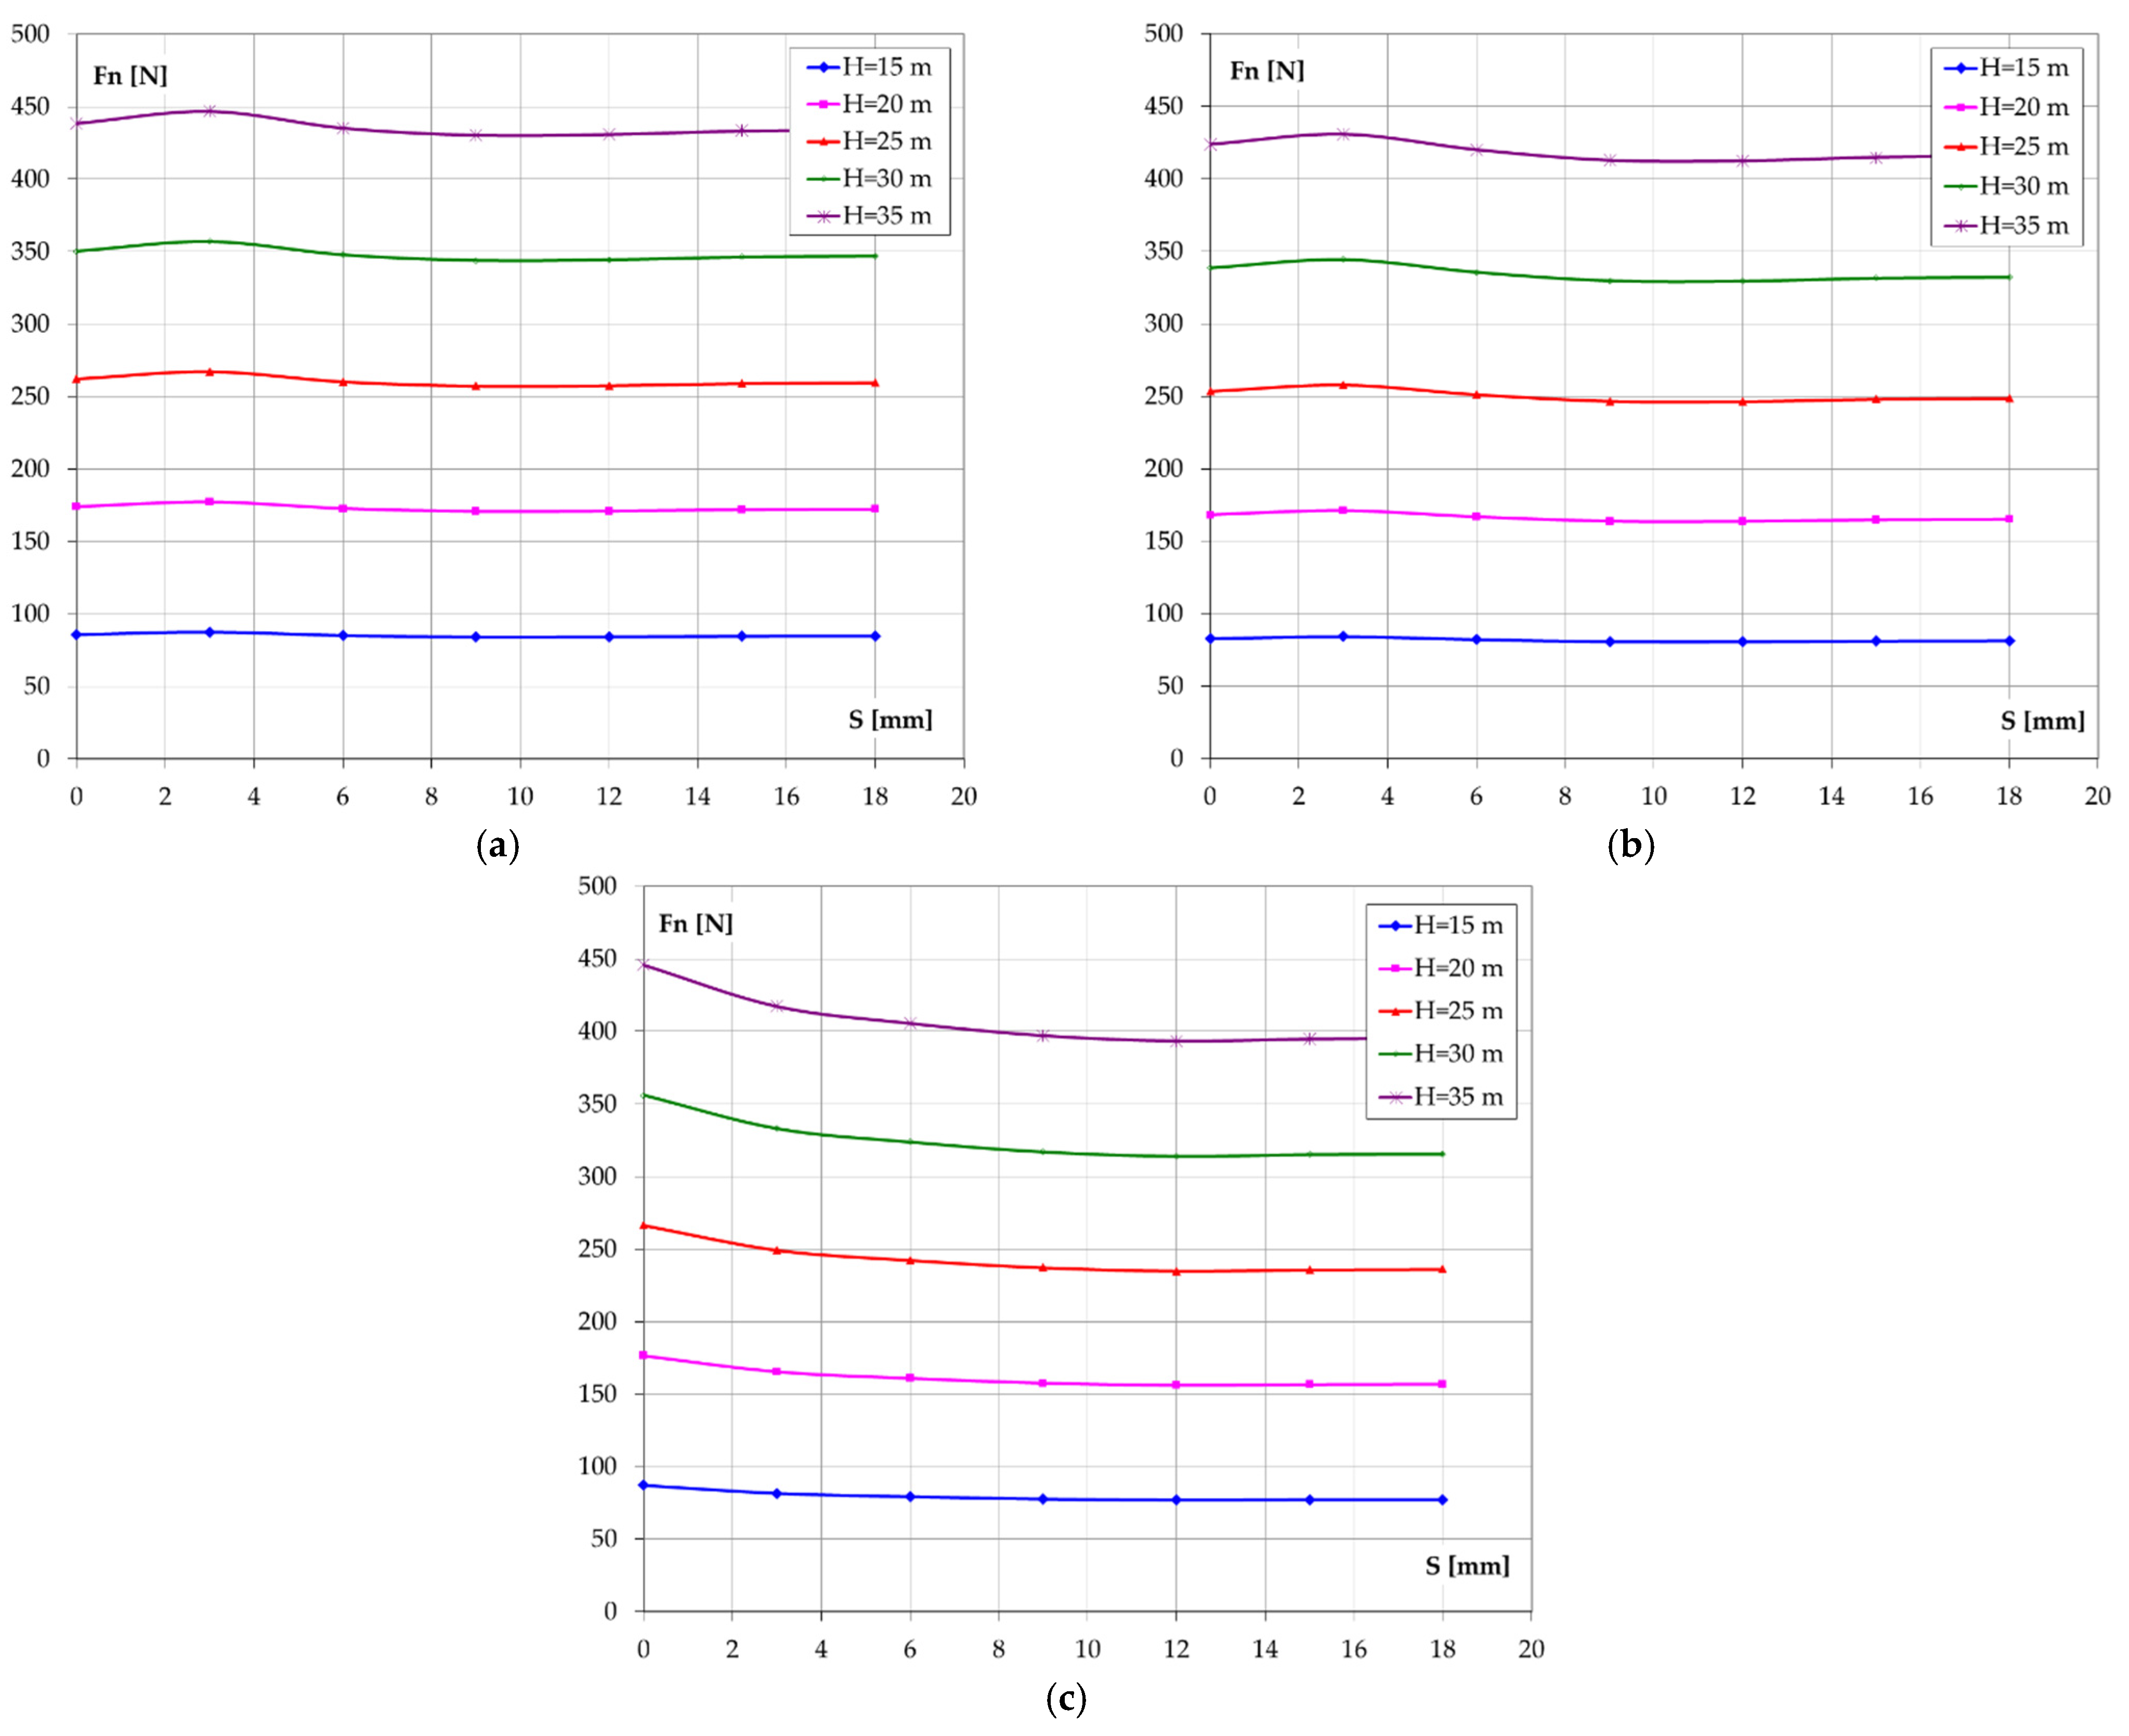
The variation of the resultant force acting on the nozzle (F
n) is shown in
Figure 10. This force characteristic F
n = f(S) was determined for the five computational heads and for the three injectors. It can be seen that unlike the resultant force on the injector spear, the resultant force on the nozzle does not vary significantly with the injector opening. The force on the nozzle increases with increasing head and has a negligible decrease with increasing nozzle diameter.
3.2. Analysis of Axial Velocity and Pressure Distribution in the Free Jet
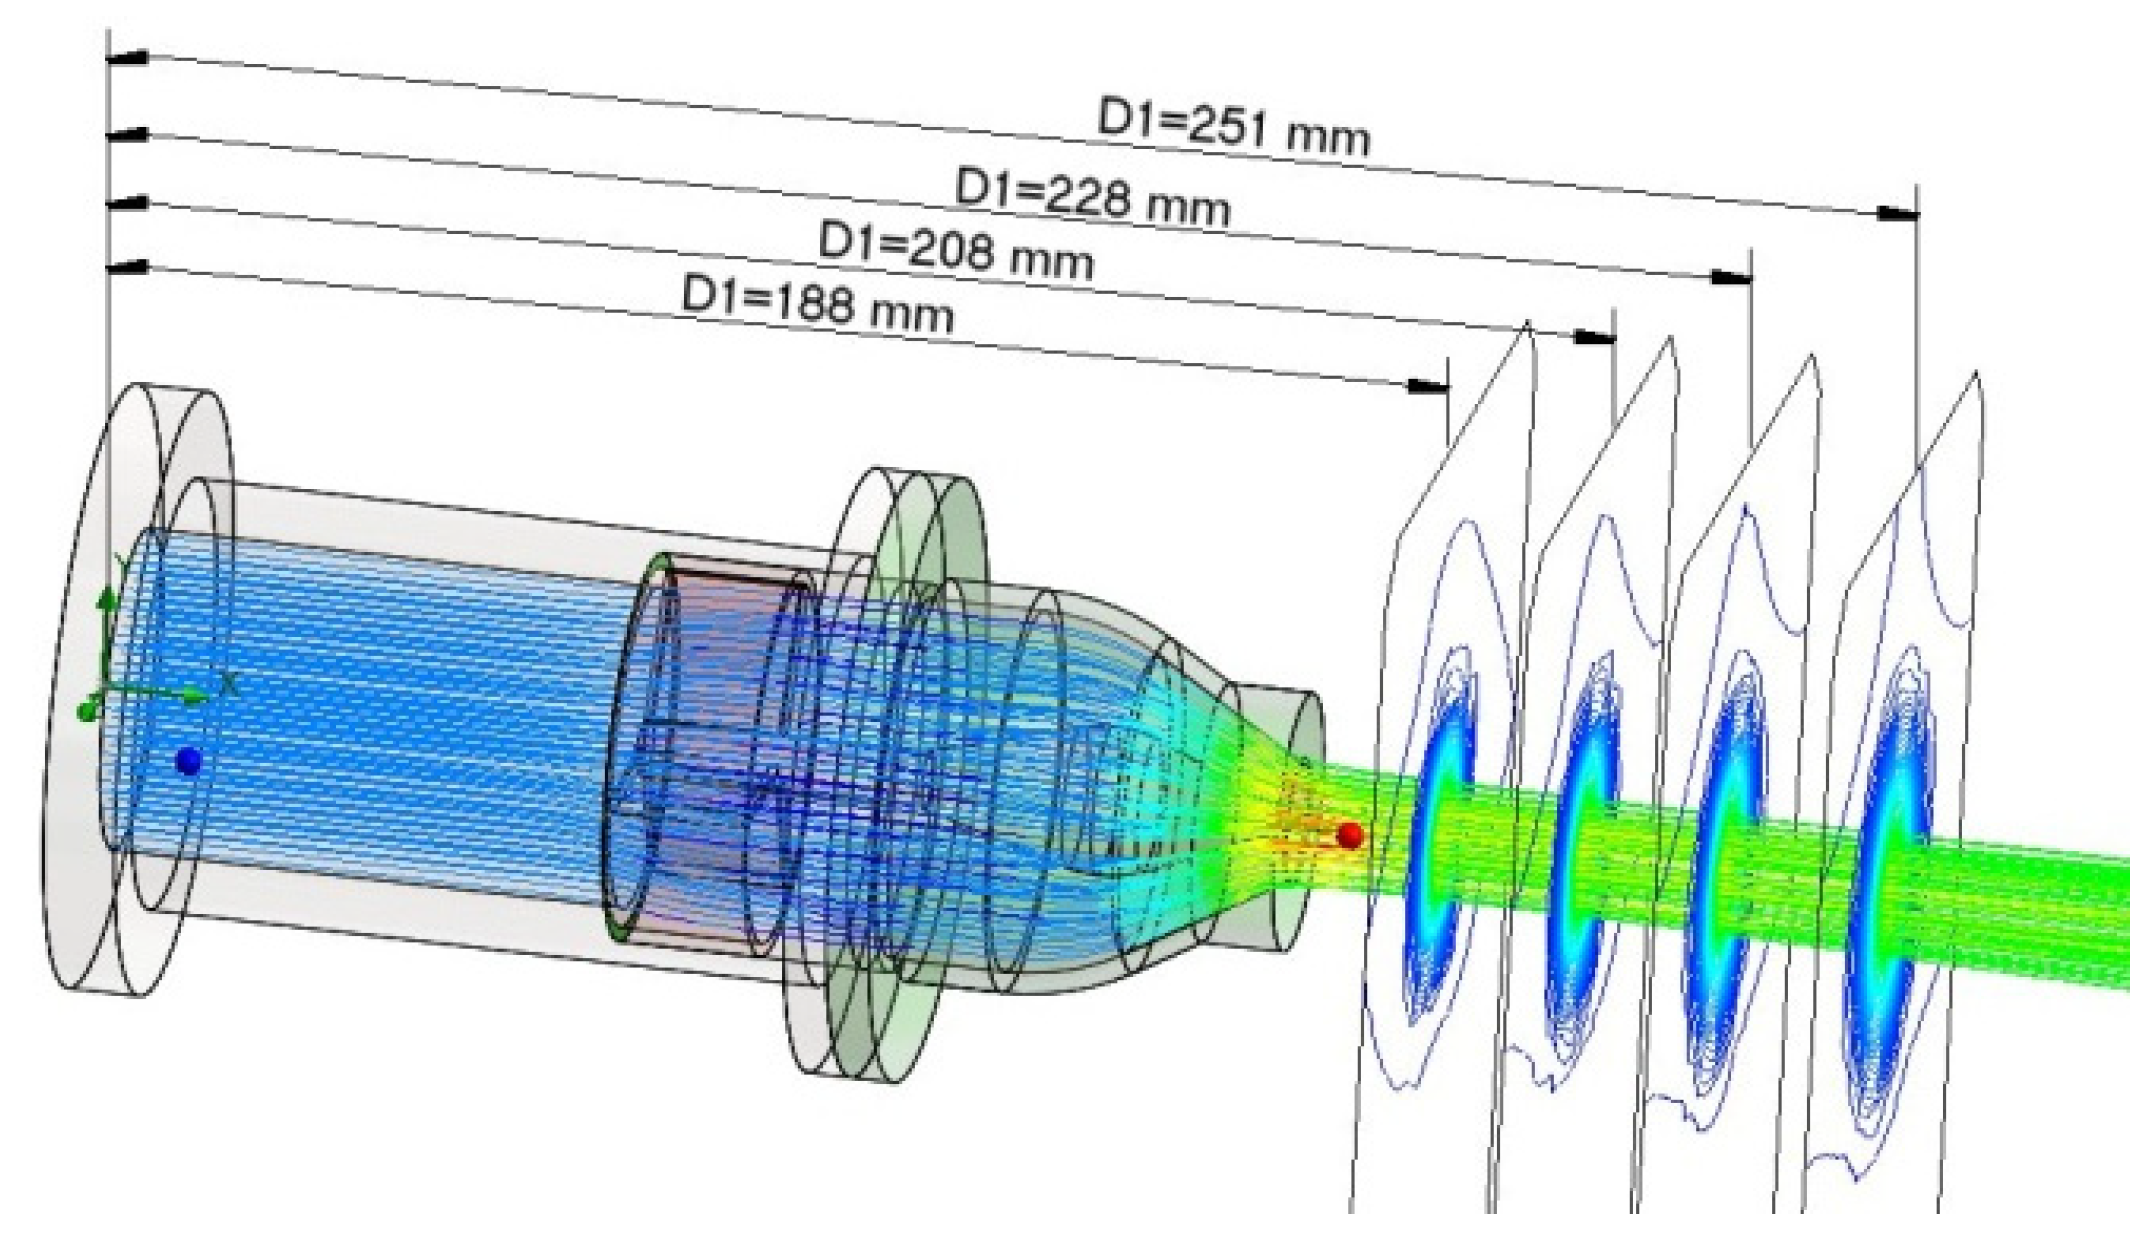
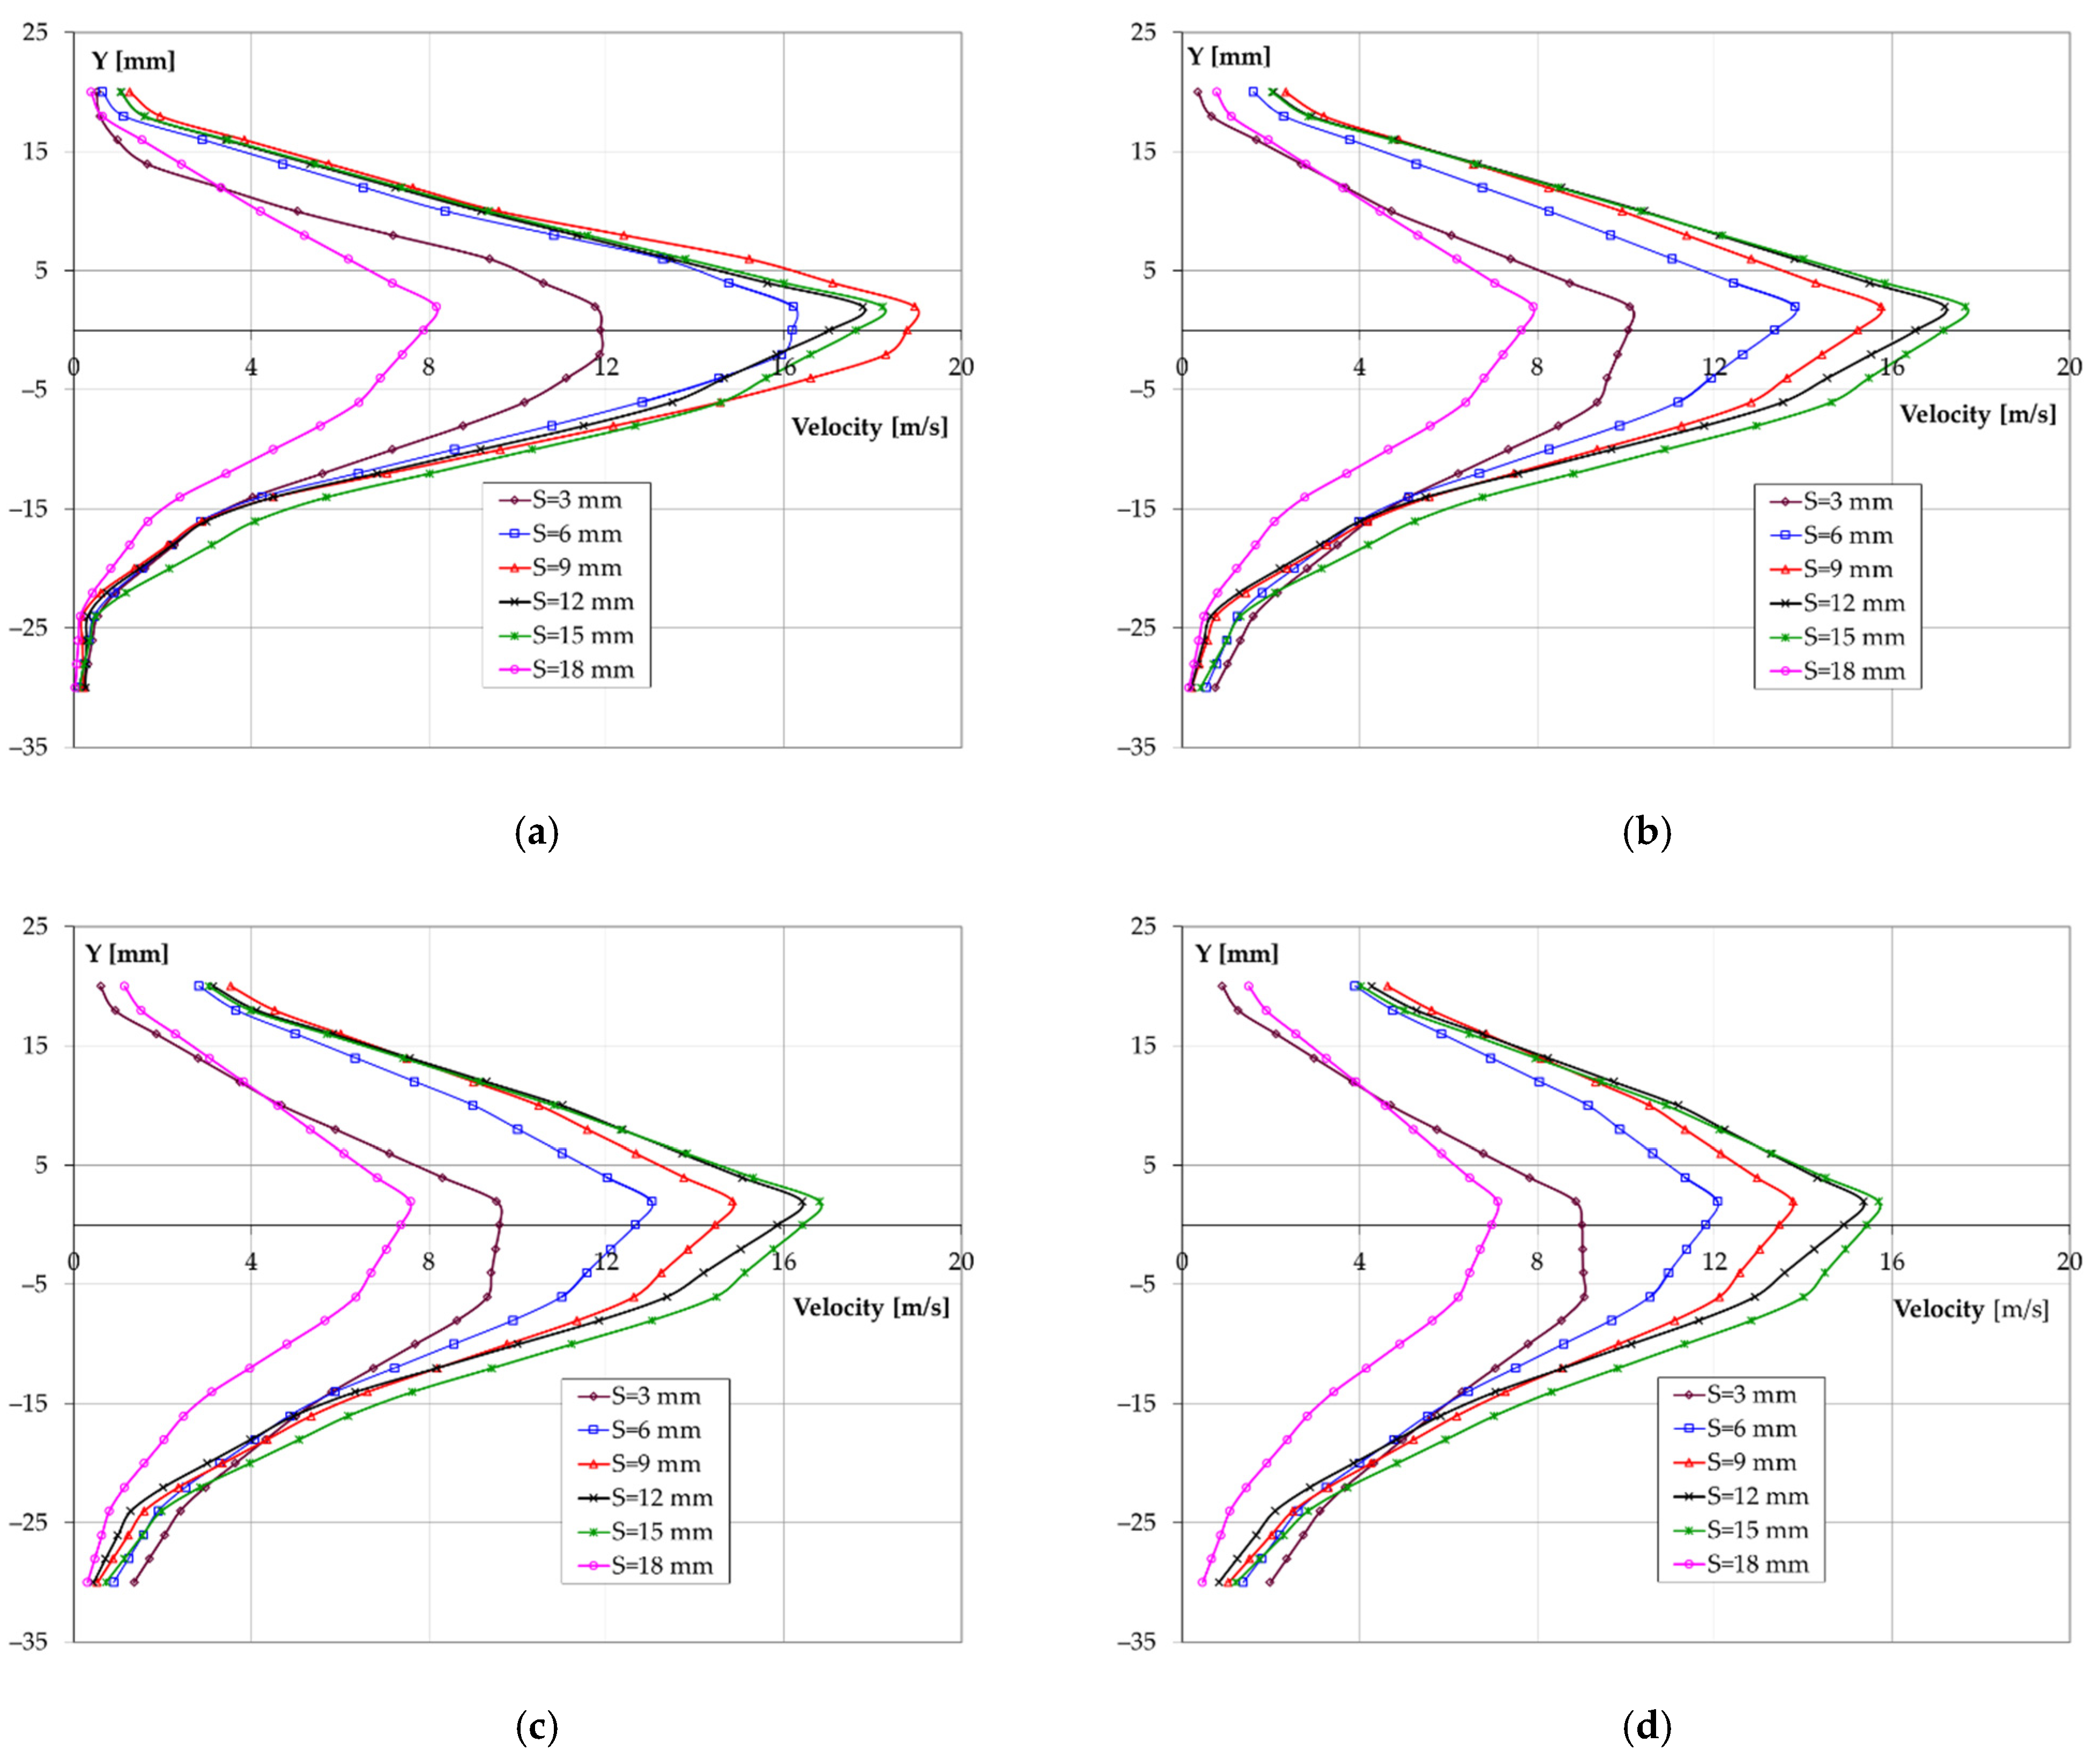
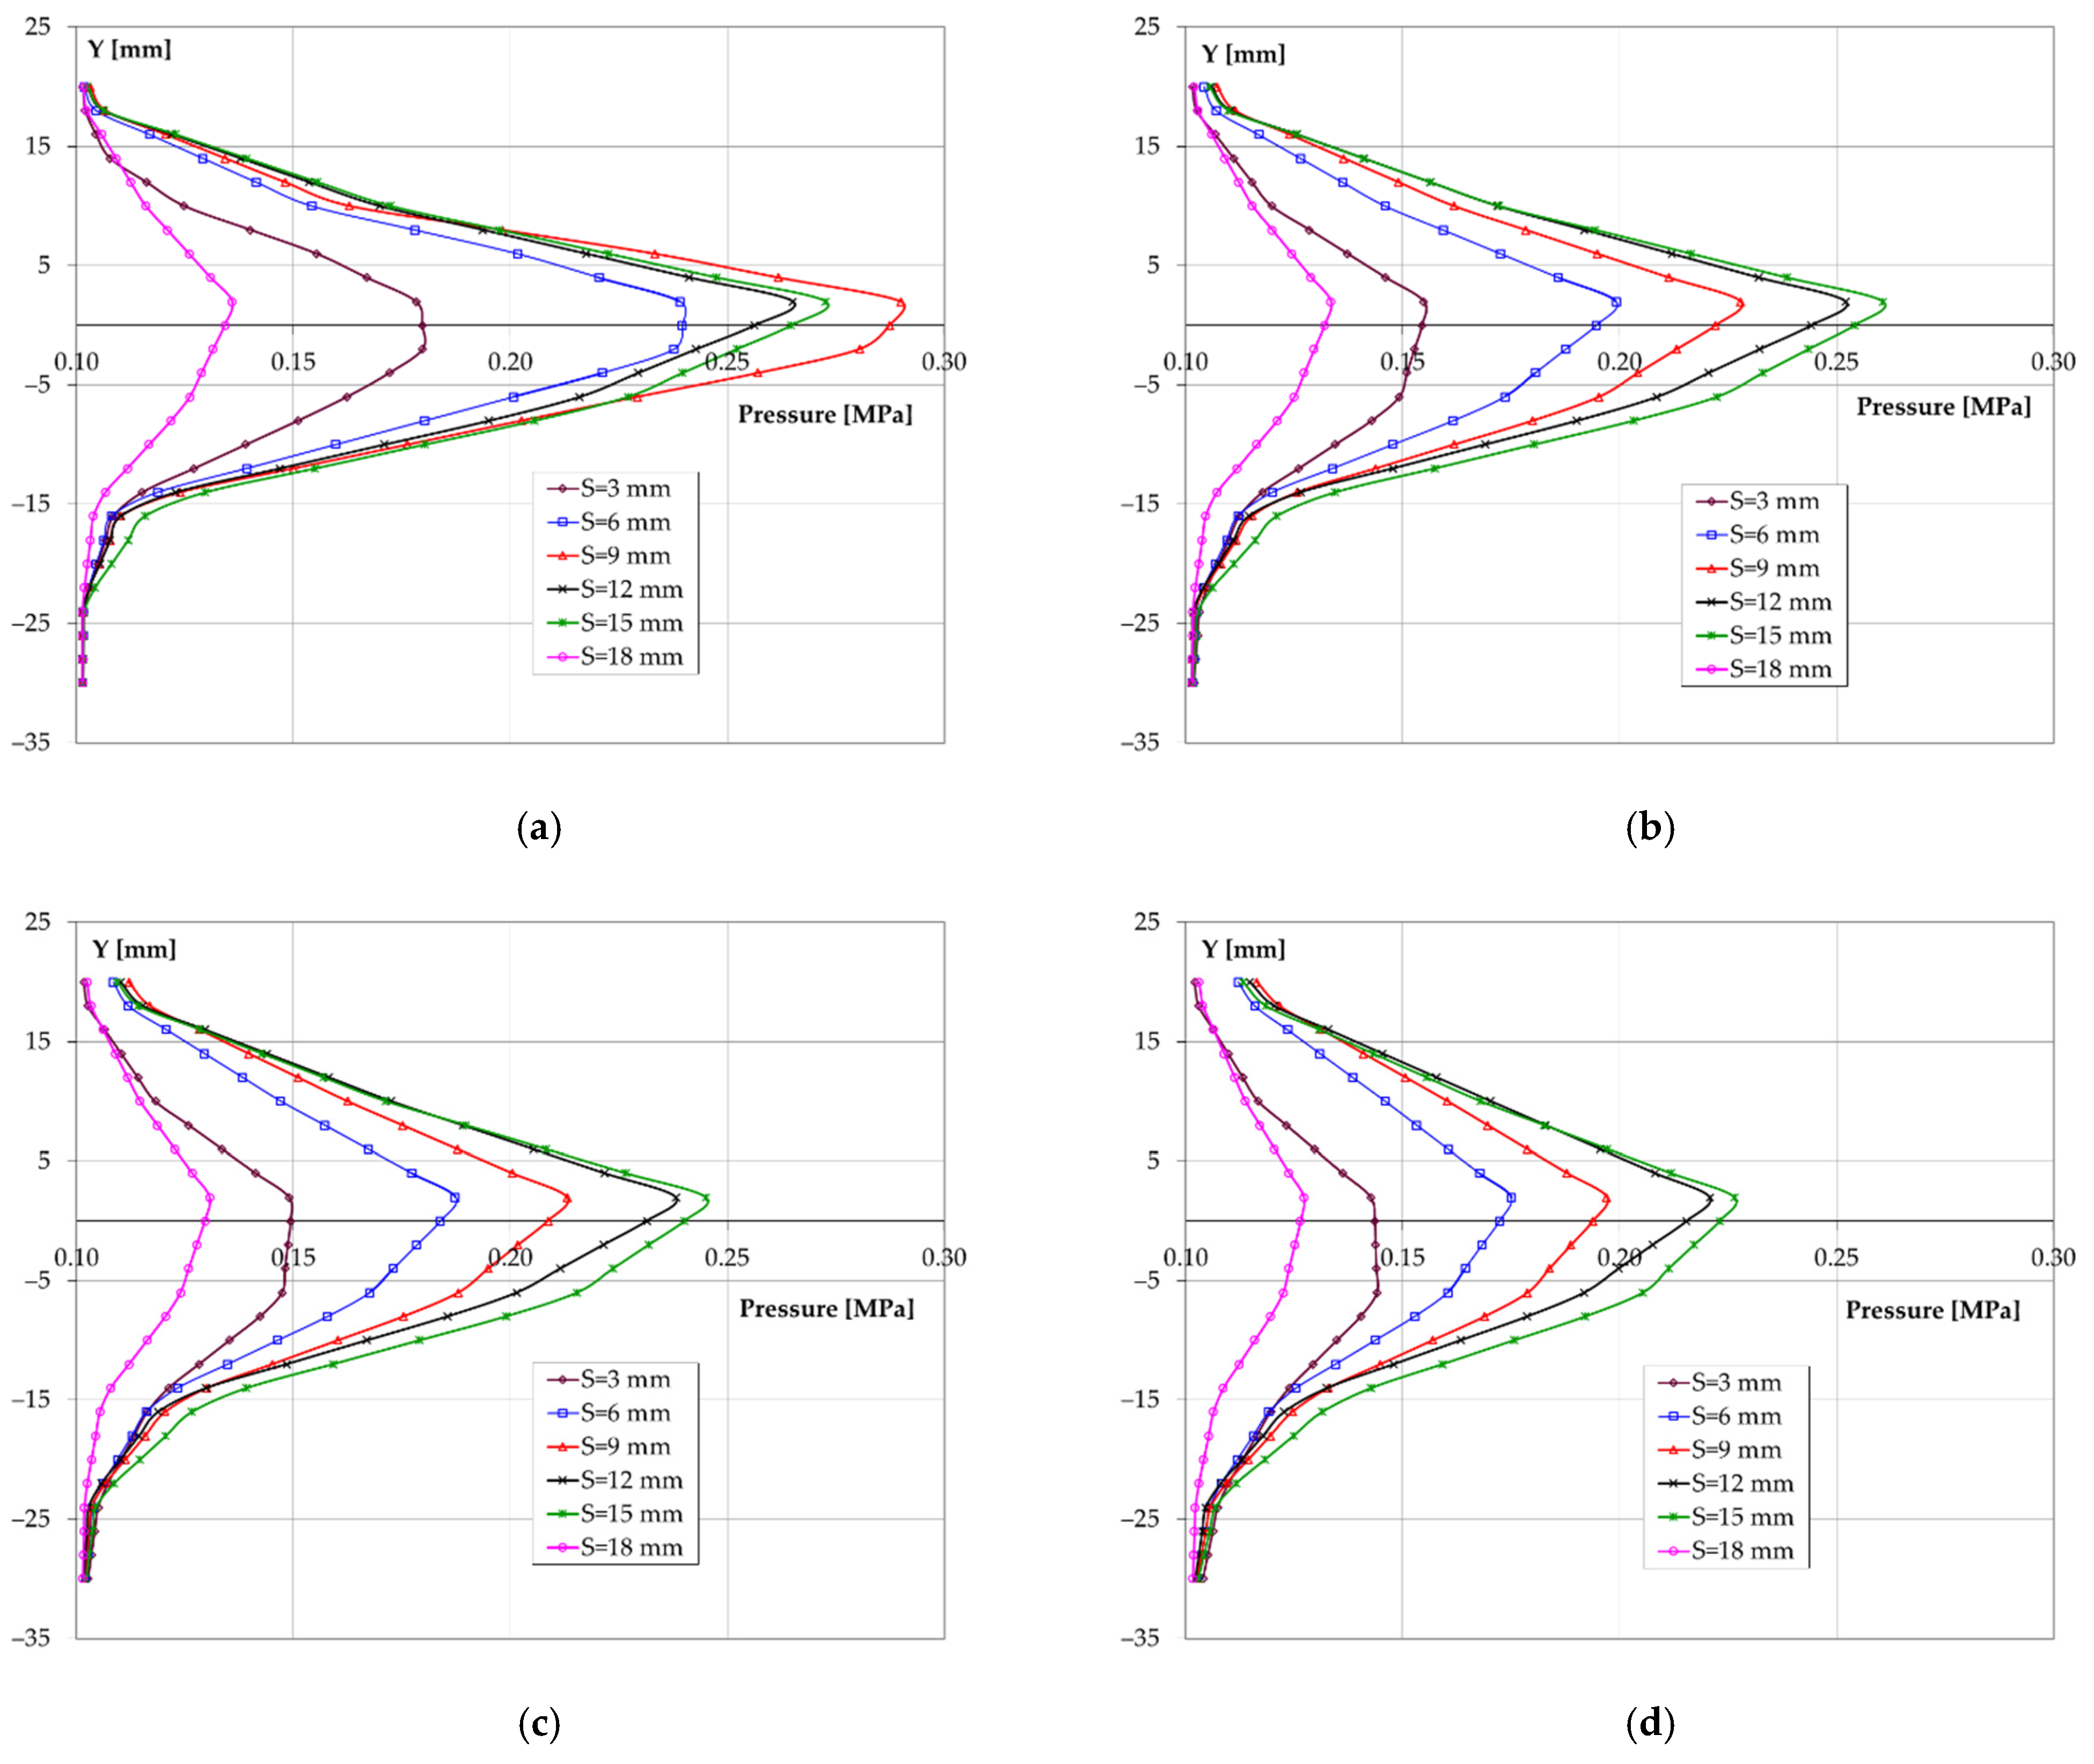
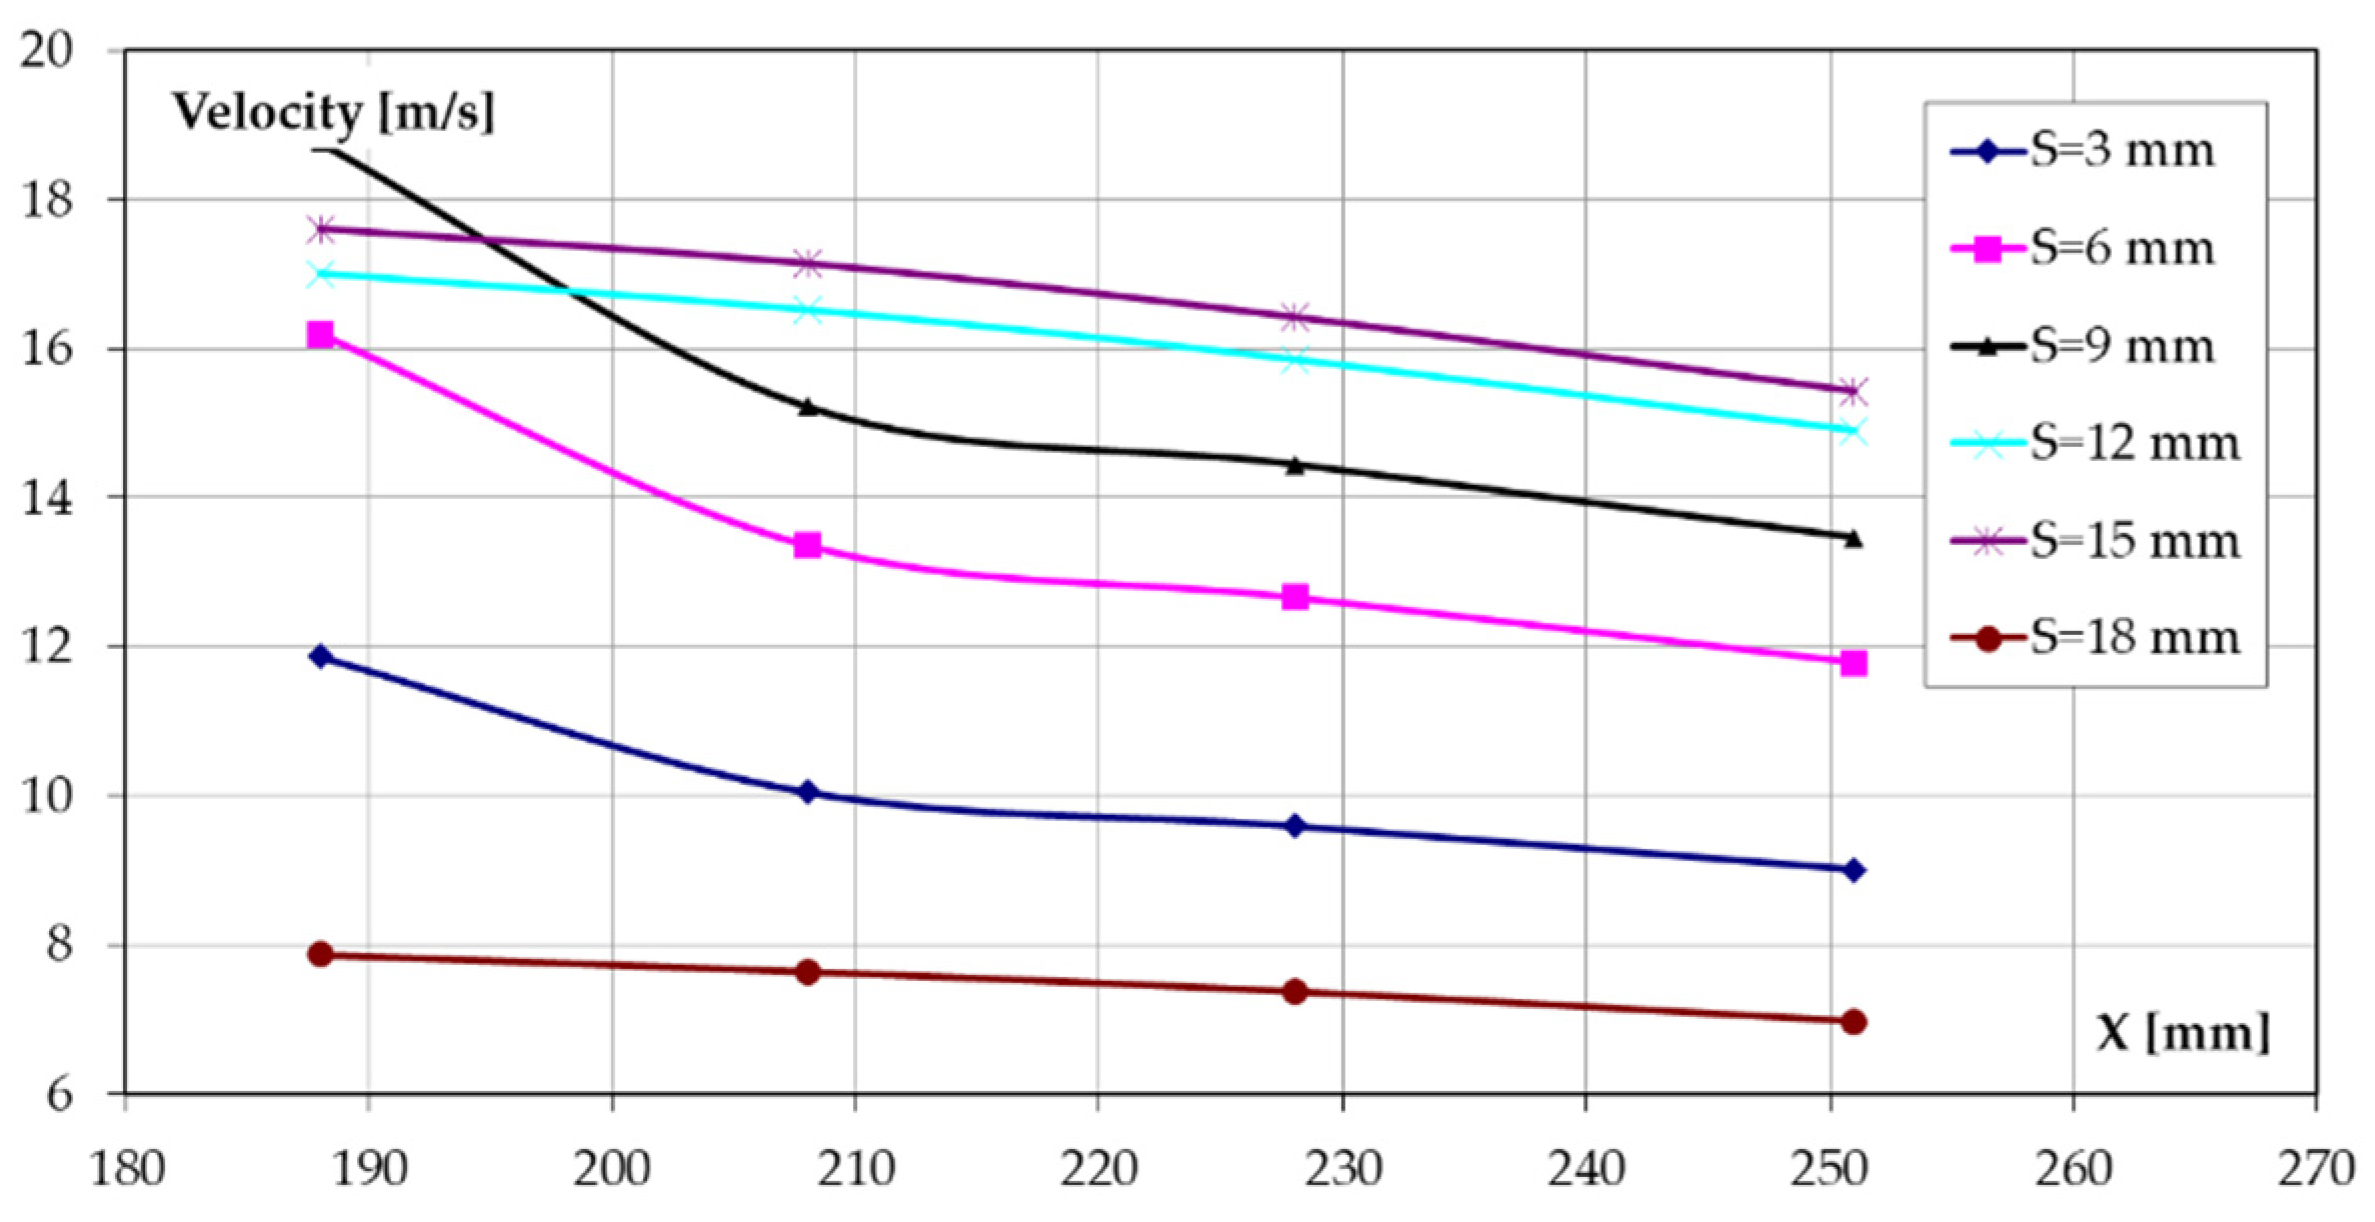
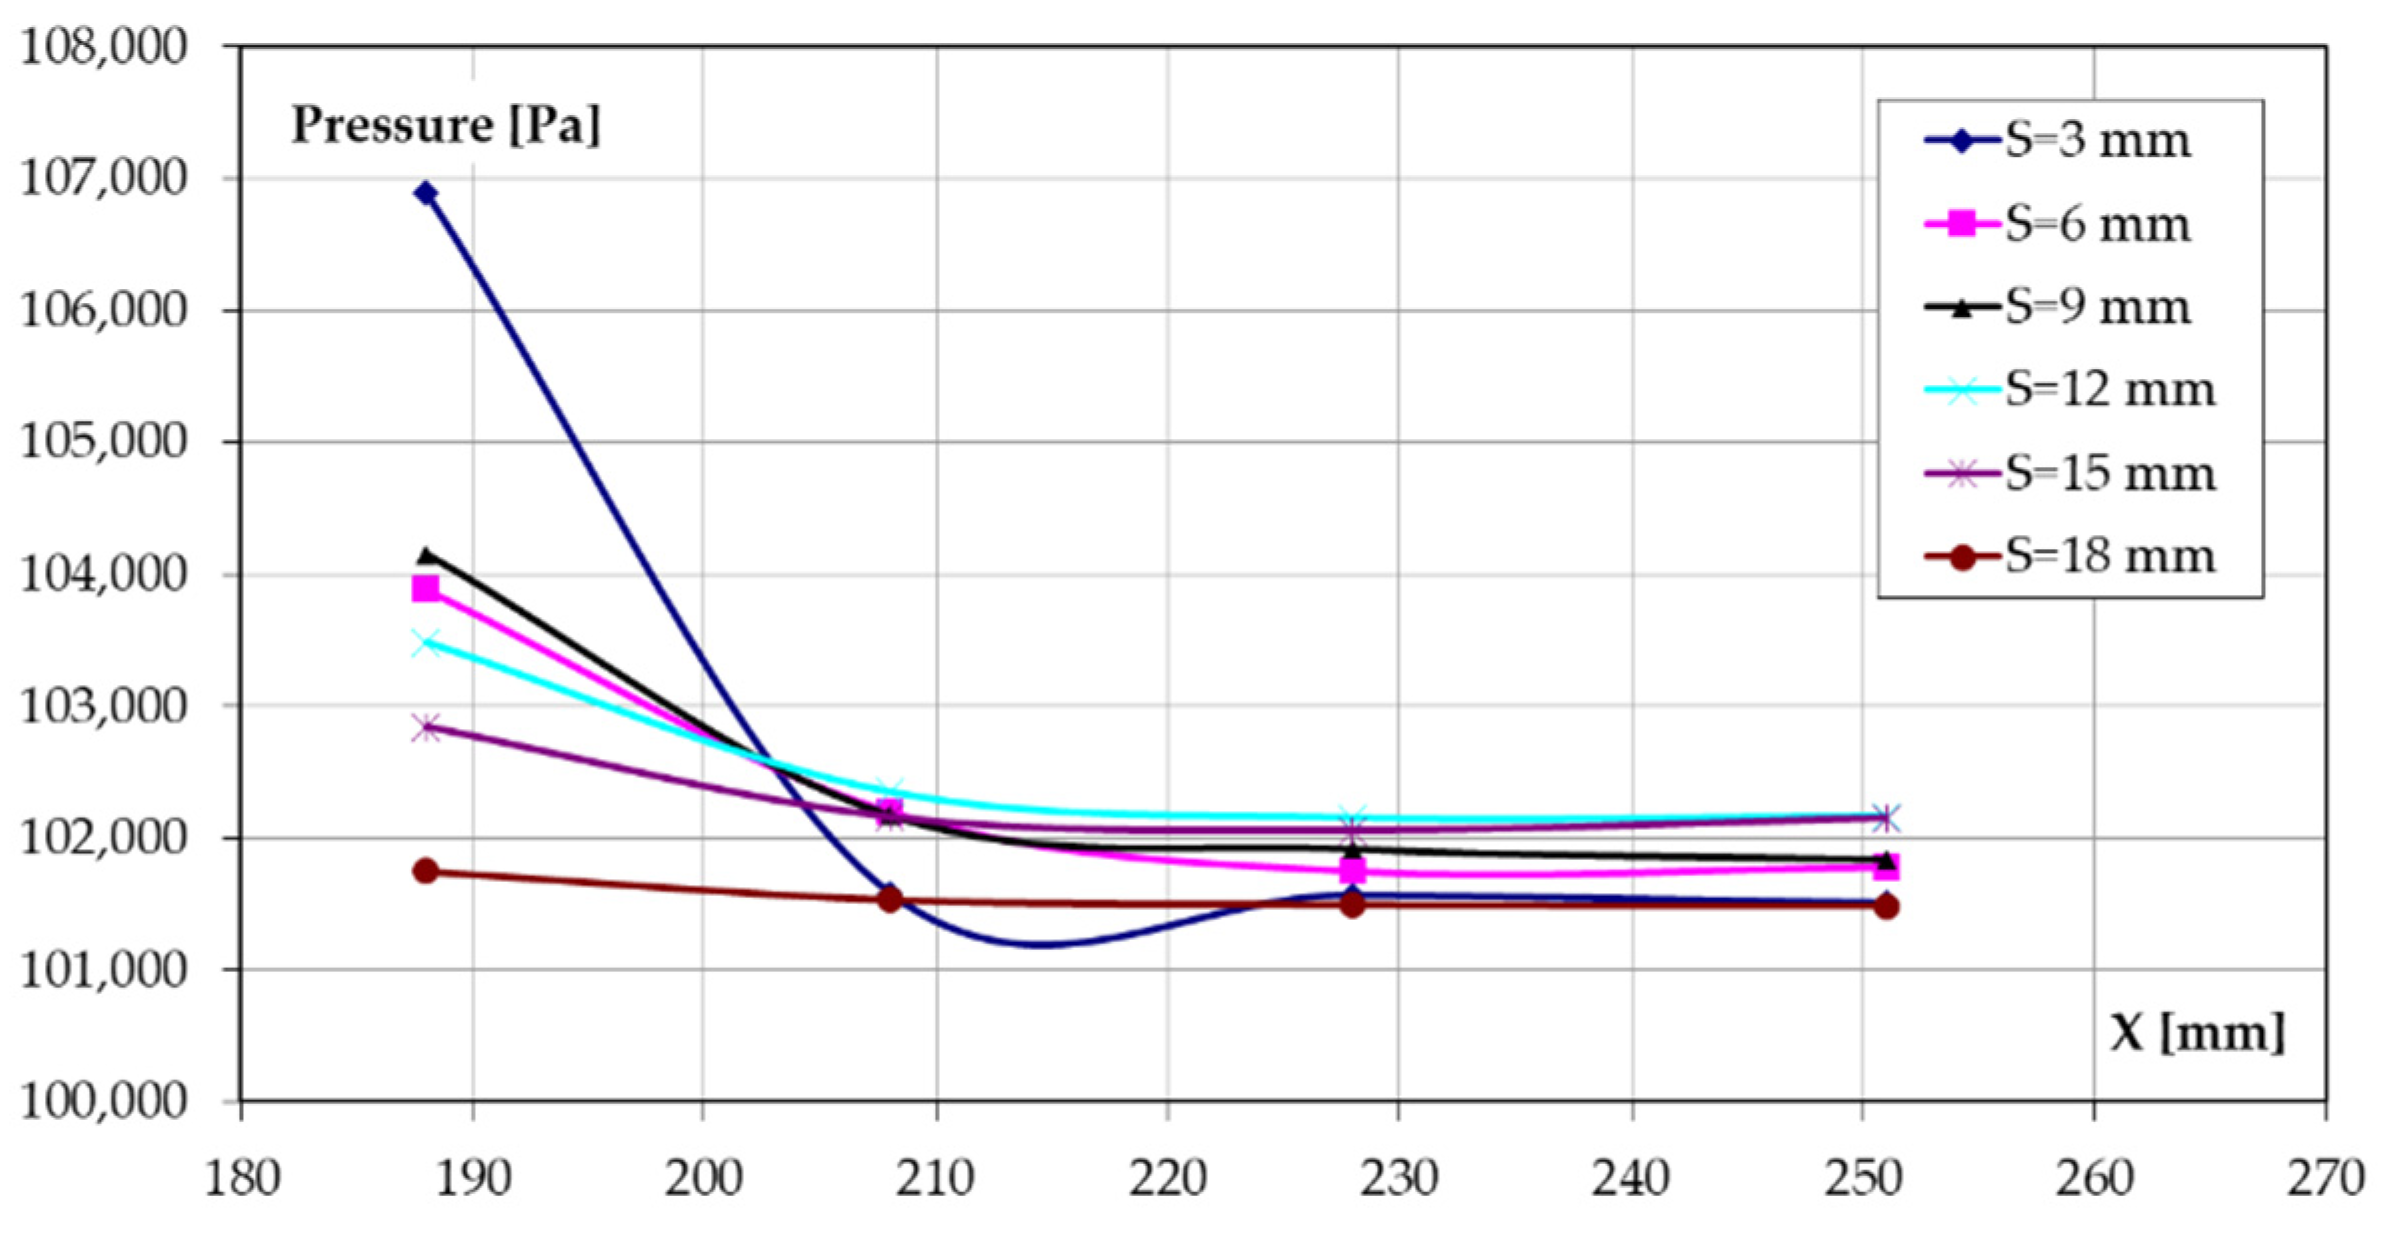
Changing the position of the injector spear relative to the nozzle causes the variation of flow rate, which will change the axial velocity and pressure distribution along the free jet. These distributions were calculated by flow simulation in four sections of the free jet. These sections, parallel to the ZY plane, were positioned relative to the inlet section of the nozzle at the following distances: 188 mm, 208 mm, 228 mm, 251 mm (
Figure 11). The distance of 251 mm corresponds to the leading edge of the runner bucket. For each of these sections the variation of axial velocity and pressure versus to height Y was plotted (the distance from the axis of the free jet to the point of calculation of velocity and pressure was denoted by Y). For each section, the range of analysis of Y height was defined between Y = −30 mm and Y = + 20 mm. The analyses presented in this sub-chapter were performed for the injector with Ø16.3 nozzle diameter.
Figure 12 shows the variation of the axial velocity v = f(Y). The positioning of the maximum velocity at a height Y different from 0 was generated by the vertical asymmetry of the runner casing.
For the section defined by the distance X = 188 mm the maximum velocity in the jet axis is obtained at injector opening S = 9 mm and the minimum velocity is obtained at injector opening S = 18 mm. In sections with X = 208 mm, X = 228 mm and X = 251 mm the maximum velocities in flow jet axis are obtained for injector openings S = 15 mm and S = 12 mm. There is a large difference between the maximum value of the free jet axis velocity corresponding to S = 15 mm and the velocity value at the opening S = 18 mm (the ratio is approximately 2:1). In terms of jet scattering, it increases with increasing distance from the exit section of the injector as the particle velocity decreases.
Figure 13 shows the variations of total pressure p = f(Y). The variations are similar to those of the axial velocity. For the section defined by the distance X = 188 mm the maximum pressure in the jet axis is obtained at the opening S = 9 mm and the minimum pressure is obtained at the opening S = 18 mm. In sections X = 208 mm, X = 228 mm and X = 251 mm the maximum pressures in jet axis are obtained for injector openings S = 15 mm and S = 12 mm.
Figure 14 and
Figure 15 show the variation of axial velocity and pressure in the free jet axis. An atypical variation of the values is observed for the opening S = 3 mm, from a higher value of pressure in section X = 188 mm to a considerably lower value in section X = 208 mm. This variation is generated by the small flow rate corresponding to this opening.
To be able to compare the performance of two or more injectors, it is important to use the same functional parameters (turbine head, flow rate, adduction type, spear and nozzle geometry). The research presents a comparative analysis of flow through the injector for three nozzle diameters, five turbine heads, and six injector opening values.
4. Conclusions
The paper focused on the numerical analysis of flow in a Pelton microturbine. The numerical simulation aim is to describe the turbine injector flow and free jet flow. The influence of the turbine head, the influence of the injector nozzle inner diameter, and the influence of the injector opening on the flow rate and on the forces occurring to the injector nozzle and injector spear were studied. Flow characteristics Q = f(H), Q = f(S) and force characteristics Fn = f(S) and Fs = f(S) were plotted for three injectors with Ø16.3 mm, Ø 14.8 mm, and Ø13.3 mm nozzle diameters, for five parametric values of the turbine head H = 15 m, H = 20 m, H = 25 m, H = 30 m and H = 35 m.
The numerical investigations showed that at a constant injector opening, the flow rate, the force on the injector spear, and the force on the nozzle decrease with decreasing turbine head. The greatest influence on the flow-rate variation is given by the variation of the turbine head, followed by the variation of the injector opening and the variation of the nozzle diameter. The increase of nozzle diameter accentuates the variation of flow rate with the turbine head. Additionally, the increase of nozzle diameter has a low influence on flow-rate variation with injector opening.
The resultant forces on the injector spear increase with increasing nozzle diameter and increasing turbine head and decrease or change its sign with increasing injector opening. The resultant forces on the nozzle are influenced by the turbine head and are not significantly influenced by the injector opening and nozzle diameter.
The axial velocity and pressure distribution along with the free jet, corresponding to the injector openings S = 3 mm, S = 6 mm, S = 9 mm, S = 12 mm, S = 15 mm, S = 18 mm, was determined by numerical simulation for the injector with Ø16.3 mm nozzle inner diameter. These distributions were analyzed for four planes parallel to YZ, located at the following distances from the injector inlet surface X = 188 mm, X = 208 mm, X = 228 mm and X = 251 mm (X = 251 mm is the distance corresponding to the leading edge on the Pelton runner bucket). The velocity and pressure of the flow in a point decrease as the distance from the nozzle outlet surface and the distance from the jet axis increase. The highest velocities and pressures in the free jet axis, for the plane defined by X = 251 mm, corresponding to the injector opening S = 15 mm, followed by the opening S = 12 mm. In the case of the axial velocity in the free jet axis, the maximum value corresponding to S = 15 mm is about twice the value corresponding to the S = 18 mm (the lowest value of the six cases analyzed). This ratio is also maintained for the pressure.
The results contribute to the selection of optimal values for turbine head, nozzle diameter, and injector opening in the design of Pelton microturbines.
The Pelton turbine injector is designed to redirect a water jet onto a runner and to regulate the flow rate Q over an appreciable range (0.15–1.0) x Q through a compact jet with a uniform structure and minimal losses. Since experimental measurements are very delicate, especially in the outside areas of the jet, where velocities vary sharply, numerical simulation can be used to determine the velocity distribution curve in one section of the jet as a function of injector spear stroke, the velocity distribution curve at different sections for the same stroke, or the forces acting on the spear, which are important parameters of the Pelton turbine design.


