Article

Experimental Characterization of Large Turbomachinery Tilting Pad Journal Bearings

1
Department of Civil and Industrial Engineering, University of Pisa, 56122 Pisa, Italy
2
Baker Hughes, 50127 Florence, Italy
3
AM Testing, 56121 Pisa, Italy
*
Author to whom correspondence should be addressed.
Machines 2021, 9(11), 273; https://doi.org/10.3390/machines9110273
Submission received: 7 October 2021 / Revised: 3 November 2021 / Accepted: 4 November 2021 / Published: 7 November 2021
(This article belongs to the Special Issue Tilting Pad Journal Bearings: State of the Art)

Abstract

:
The paper deals with the experimental characterization of different 280 mm diameter tilting pad journal bearings for turbomachines using a dedicated test rig. The test articles were a 5-pad Direct Lube Rocker Pivot bearing, a 5-pad Flooded Rocker Pivot bearing, and a 4-pad Flooded Ball and Socket Pivot bearing. The three bearings were tested in their specific design range of operating conditions. Their static and dynamic behavior was investigated as a function of different operating parameters. In particular, the assumed journal center eccentricity and pads temperature were measured, and the power loss determined as a function of angular speed for different static loads. Dynamic stiffness and damping coefficients were determined as a function of excitation frequency for different speeds and loads. The experimental results were compared showing the influence of the operating parameters, configuration, and oil supply.

1. Introduction

Tilting pad journal bearings (TPJB) are essential components for supporting the rotors of turbomachinery industrial applications, guaranteeing stability and efficiency even in increasingly severe operating conditions in terms of load and speed.
TPJBs have been the subject of extensive theoretical and experimental studies in recent decades focusing in particular on their dynamic characteristics. For reviews, refer to [1,2]. However, many aspects still need to be clarified to increase the reliability of numerical simulation and prediction tools, particularly useful at the design stage. Therefore, it is necessary to carry out test campaigns, extending the fields of exploration in terms of bearing size, geometric configuration, oil supply, and operating conditions. The “component level” test approach is generally used in new product development programs in order to reduce the risk associated to the adoption of new design components.
A certain number of test rigs have been set up in the labs all over the world differing in size, range of operating conditions, and configuration. Most of them adopt the floating bearing configuration where loads are applied to the bearing and the rotor bearing relative displacement is measured, as, for example, in [3,4,5,6,7,8], while a few adopt the floating rotor configuration where the loads are applied to the rotor instead [9]. Identification methods, mainly in the frequency domain as proposed in [3], allow one to determine the dynamic coefficients. Effects on bearing behaviour of load direction [10], pivot stiffness [11] and flexural pivot [12], nonlinearities [13] have been evaluated.
As regards the effect of size, quite large size bearings working at high peripheral speeds have been tested and characterized both statically and dynamically in a few labs. Bearings of 500 mm nominal diameter have been tested on a test rig which provides high resolution measurements of oil film pressures, oil film thicknesses, and shaft temperatures [14,15]. The research focused on the pad temperatures and the transition between laminar and turbulent flow in [16] and on the influence of active cooling in [17]. A 580 mm diameter direct lubrication TPJB for steam turbine was studied experimentally statically and dynamically using a full-scale bearing test rig and compared to a conventional flooded lubrication bearing, investigating also the vibration of pads [5]. A similar test campaign and comparison was conducted on a direct lubricated two pads TPJB with 890 mm diameter [18]. Tests on machine units were conducted on machine units instead, to validate the optimization of bearing clearances, pad length, thickness, and pivot position of a 900 mm diameter TPJB, obtained by a comprehensive analytical model [19].
In the last few years, experimental campaigns for the preliminary validation of different types of tilting pad journal bearings in terms of both dynamic and static performance have been carried out on TPJBs with diameter larger than 250 mm in the test rig developed thanks to the joint effort of the University of Pisa and the companies Baker Hughes and AM Testing [20,21,22]. The test rig covers a size range well above that of the more common test rigs (around 100 mm diameter) and is capable of providing higher speeds and loads with respect to test rigs of similar size such as, for example, [4,6] and is comparable to those of larger size. A peripheral speed of 129 m/s and a specific load of 2.8 MPa have been reached in previous tests.
The present research activity is aimed at the evaluation of the behavior of large bearings for turbomachines, in particular, centrifugal compressors and industrial steam turbines, when they are operated at higher speed with respect to the actual ones. After a brief description of the experimental apparatus and of the procedures used, this paper presents and discusses the experimental results obtained with different 280 mm diameter TPJBs. More specifically, bearings with direct lube and flooded configurations and rocker back and ball-and-socket pivots will be examined. The test results, unique in the considered size range, will show the influence of load, speed, type of oil supply, pad configuration and some particular effects such as turbulence. Although not all the geometrical features will be disclosed, being confidential information of Baker Hughes, the paper can be of interest to researchers in the field of centrifugal compressors and industrial steam turbines since the investigated experimental conditions are representative of more severe operating conditions with respect to the standard ones.

2. Materials and Methods

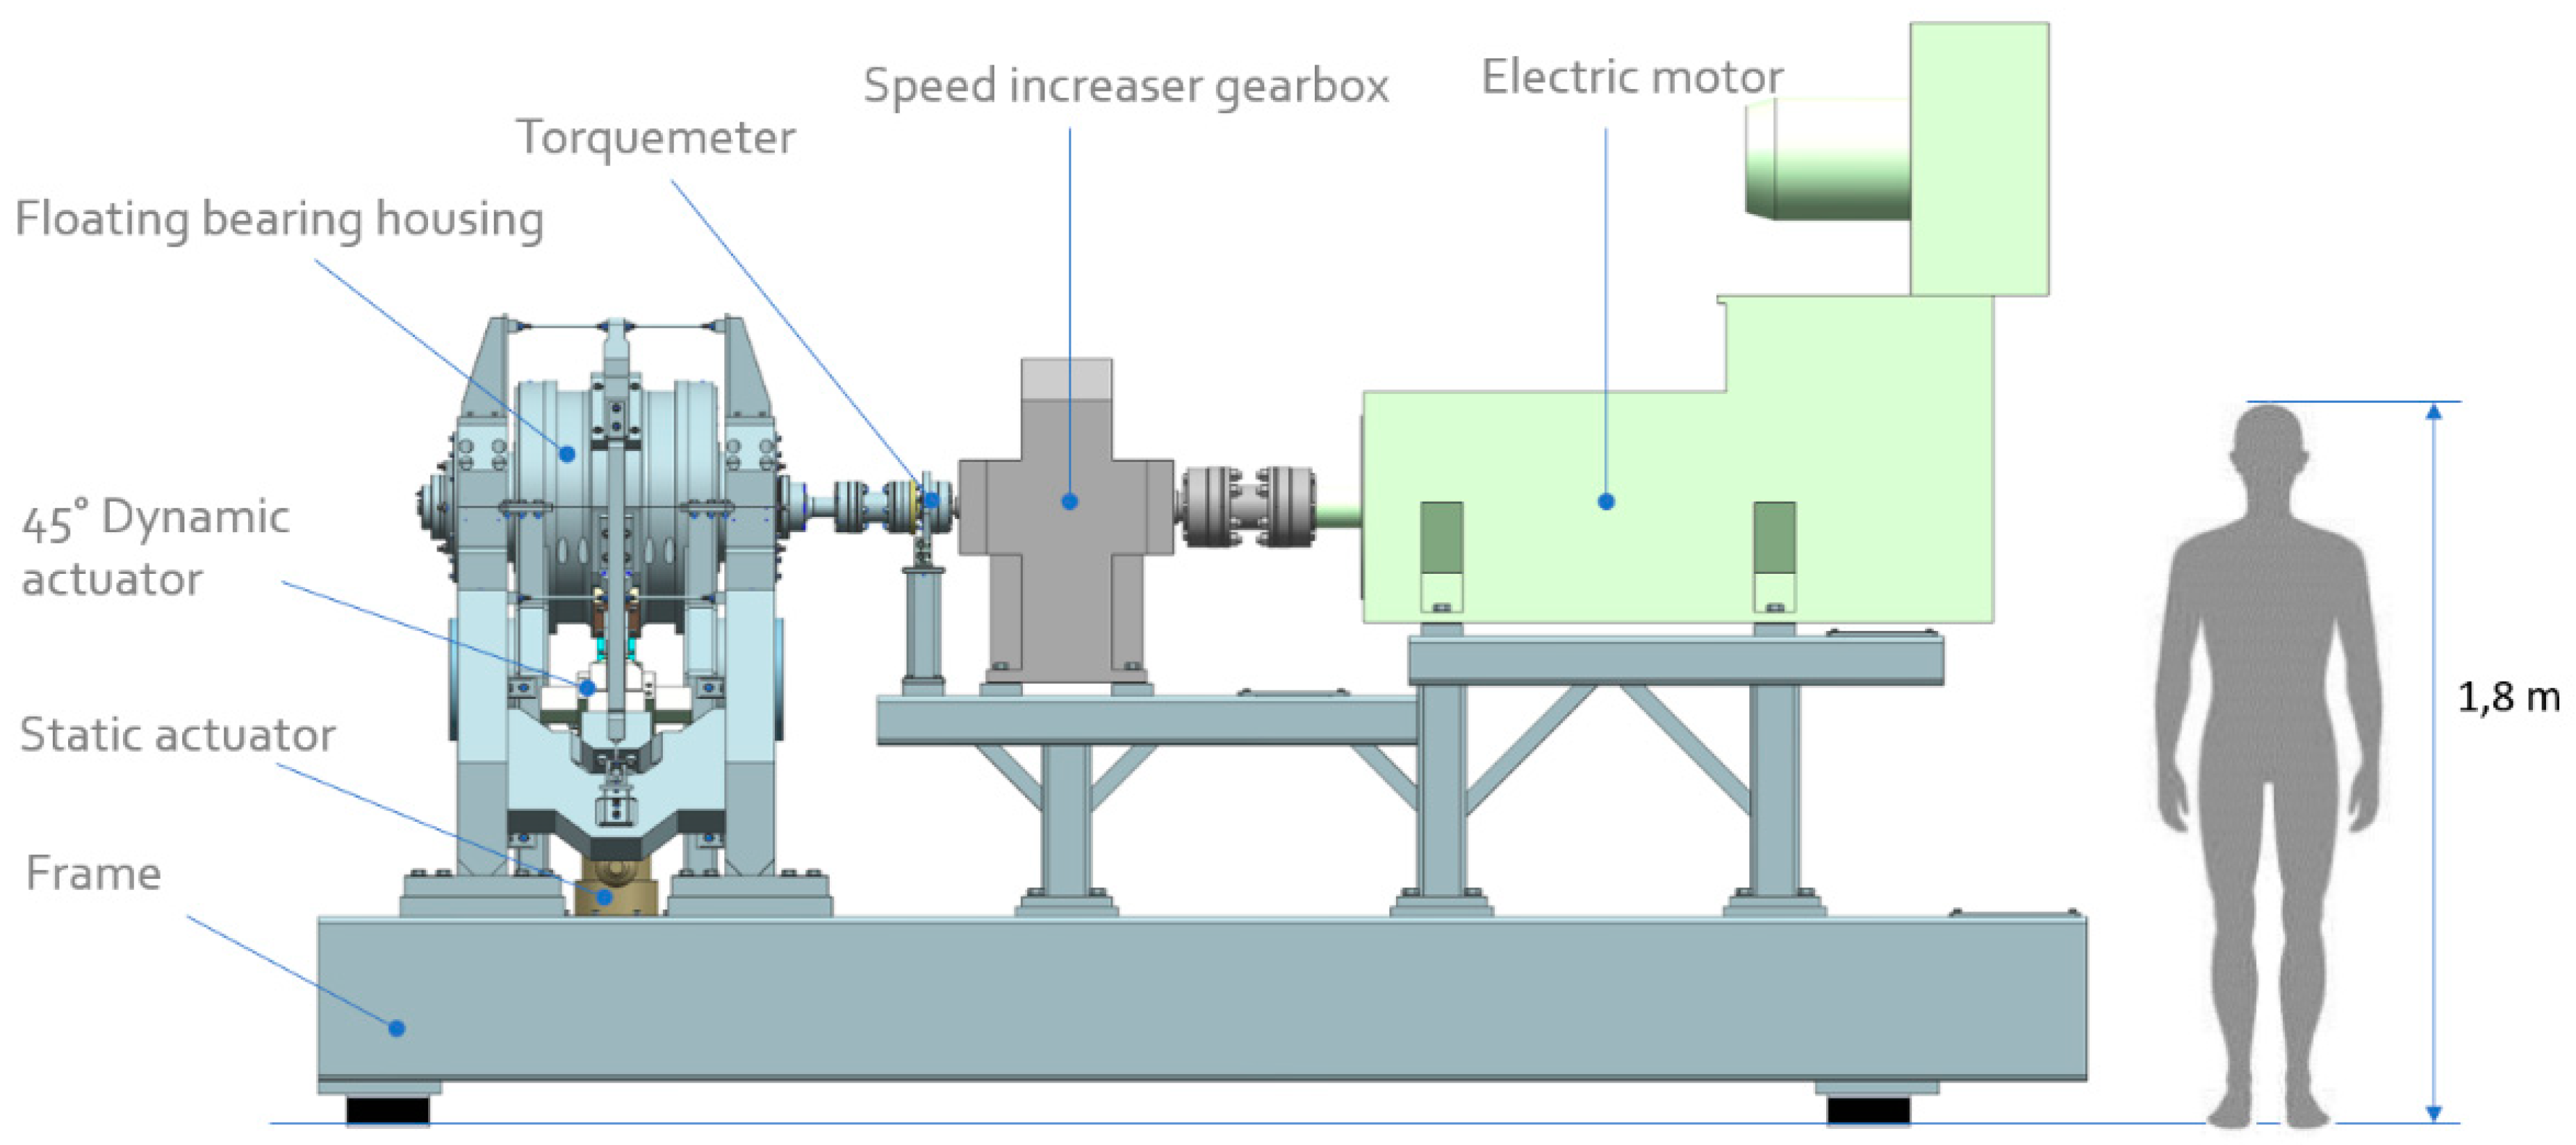
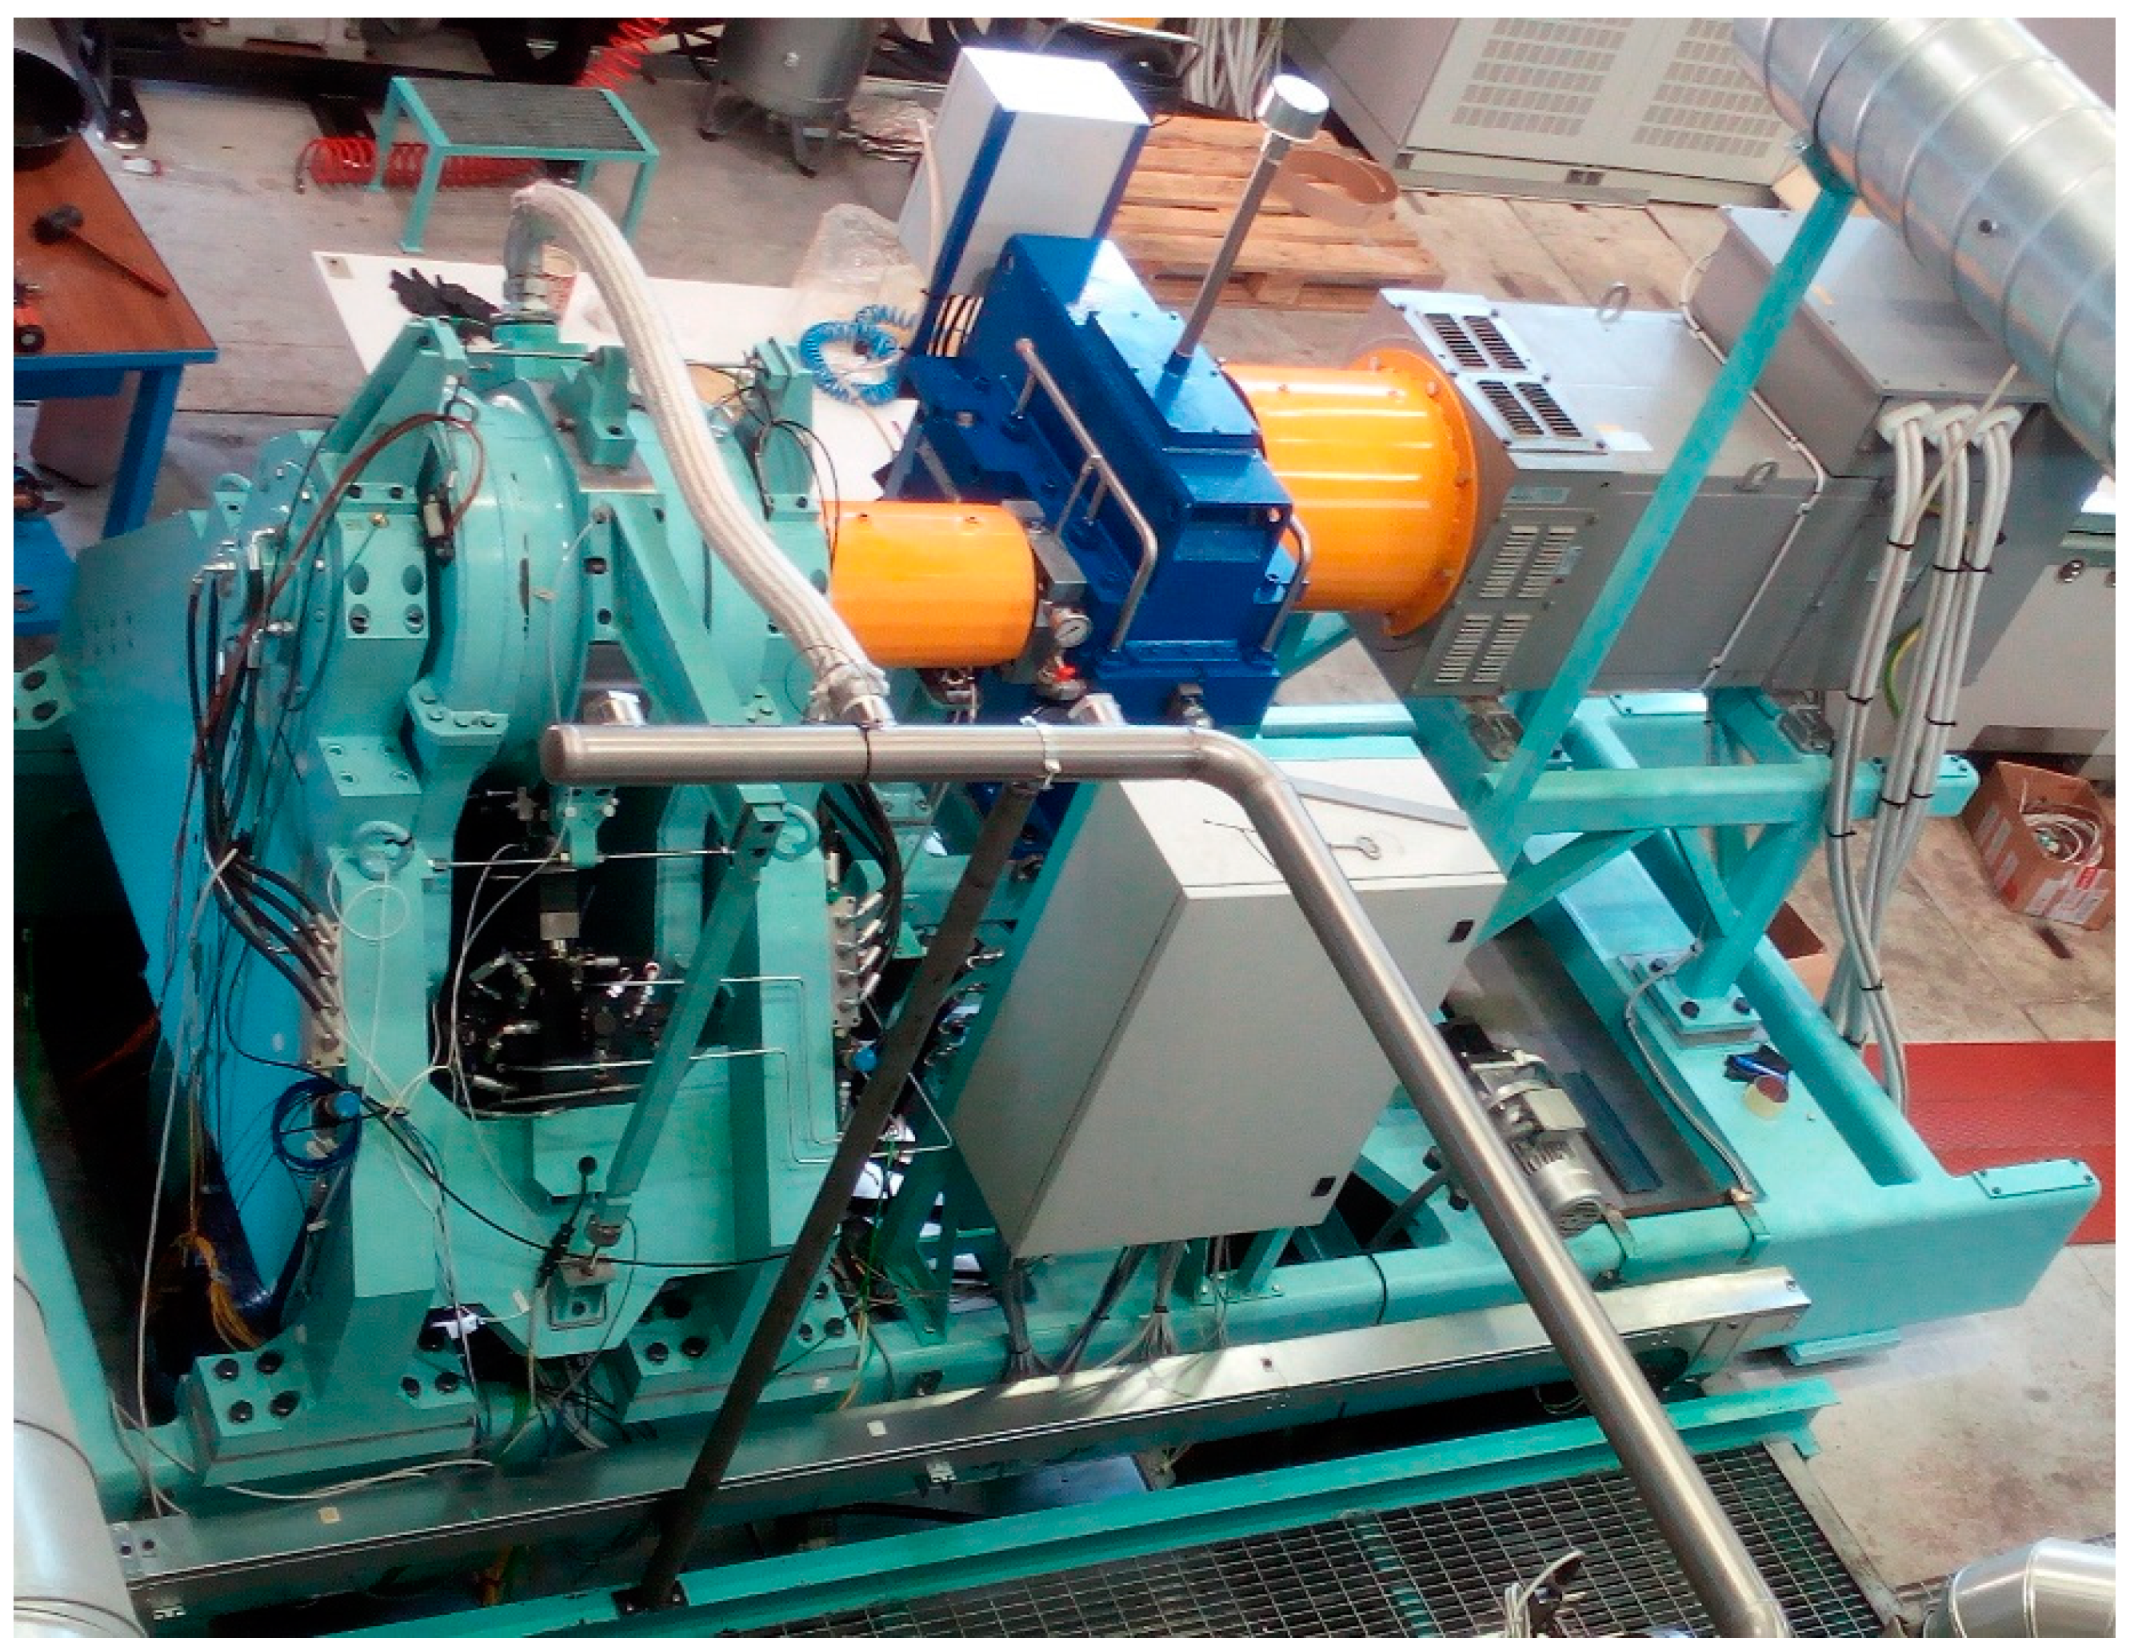
2.1. The Experimental Apparatus

This section describes the architecture of the experimental apparatus used for the testing activities and the dynamic coefficients identification method [8,20,21]. Moreover, the test articles are presented.
A drawing and a picture of the test rig are shown in Figure 1 and Figure 2.
The rotor of the test bearing is connected to a single stage gear multiplier with the low-speed shaft connected to a 630 kW electric motor controlled by an inverter. A torque meter with 1 kNm full scale is located between the test section and the gearbox with a gear ratio 6:1. The motor maximum speed is 4000 rpm so that the theoretical rotor maximum rotational speed is 24,000 rpm. The nominal torque of the motor is 3000 Nm. The experimental apparatus is used to perform both static and dynamic tests employing hydraulic actuators. Their full scales are 270 kN for the static load actuator and 30 kN for the dynamic ones. Dynamic loads can be applied at frequencies up to 350 Hz. Three independent oil systems are used for supplying the lubricant to the tested bearing, to the hydraulic actuators, and to the gearbox. The main characteristics of the lubrication systems are reported in Table 1, that summarize the capabilities of the experimental plant. Due to the high power dissipated oil–water heat exchangers and 700 kW cooling towers are employed. A complex control and data acquisition system is used able to record about 30 high-frequency signals (up to 100 kHz) and 60 low-frequency signals normally sampled at 1 Hz. Averaged values of high-frequency signals are also recorded every second. Including all systems, the whole plant maximum power is about 1 MW.

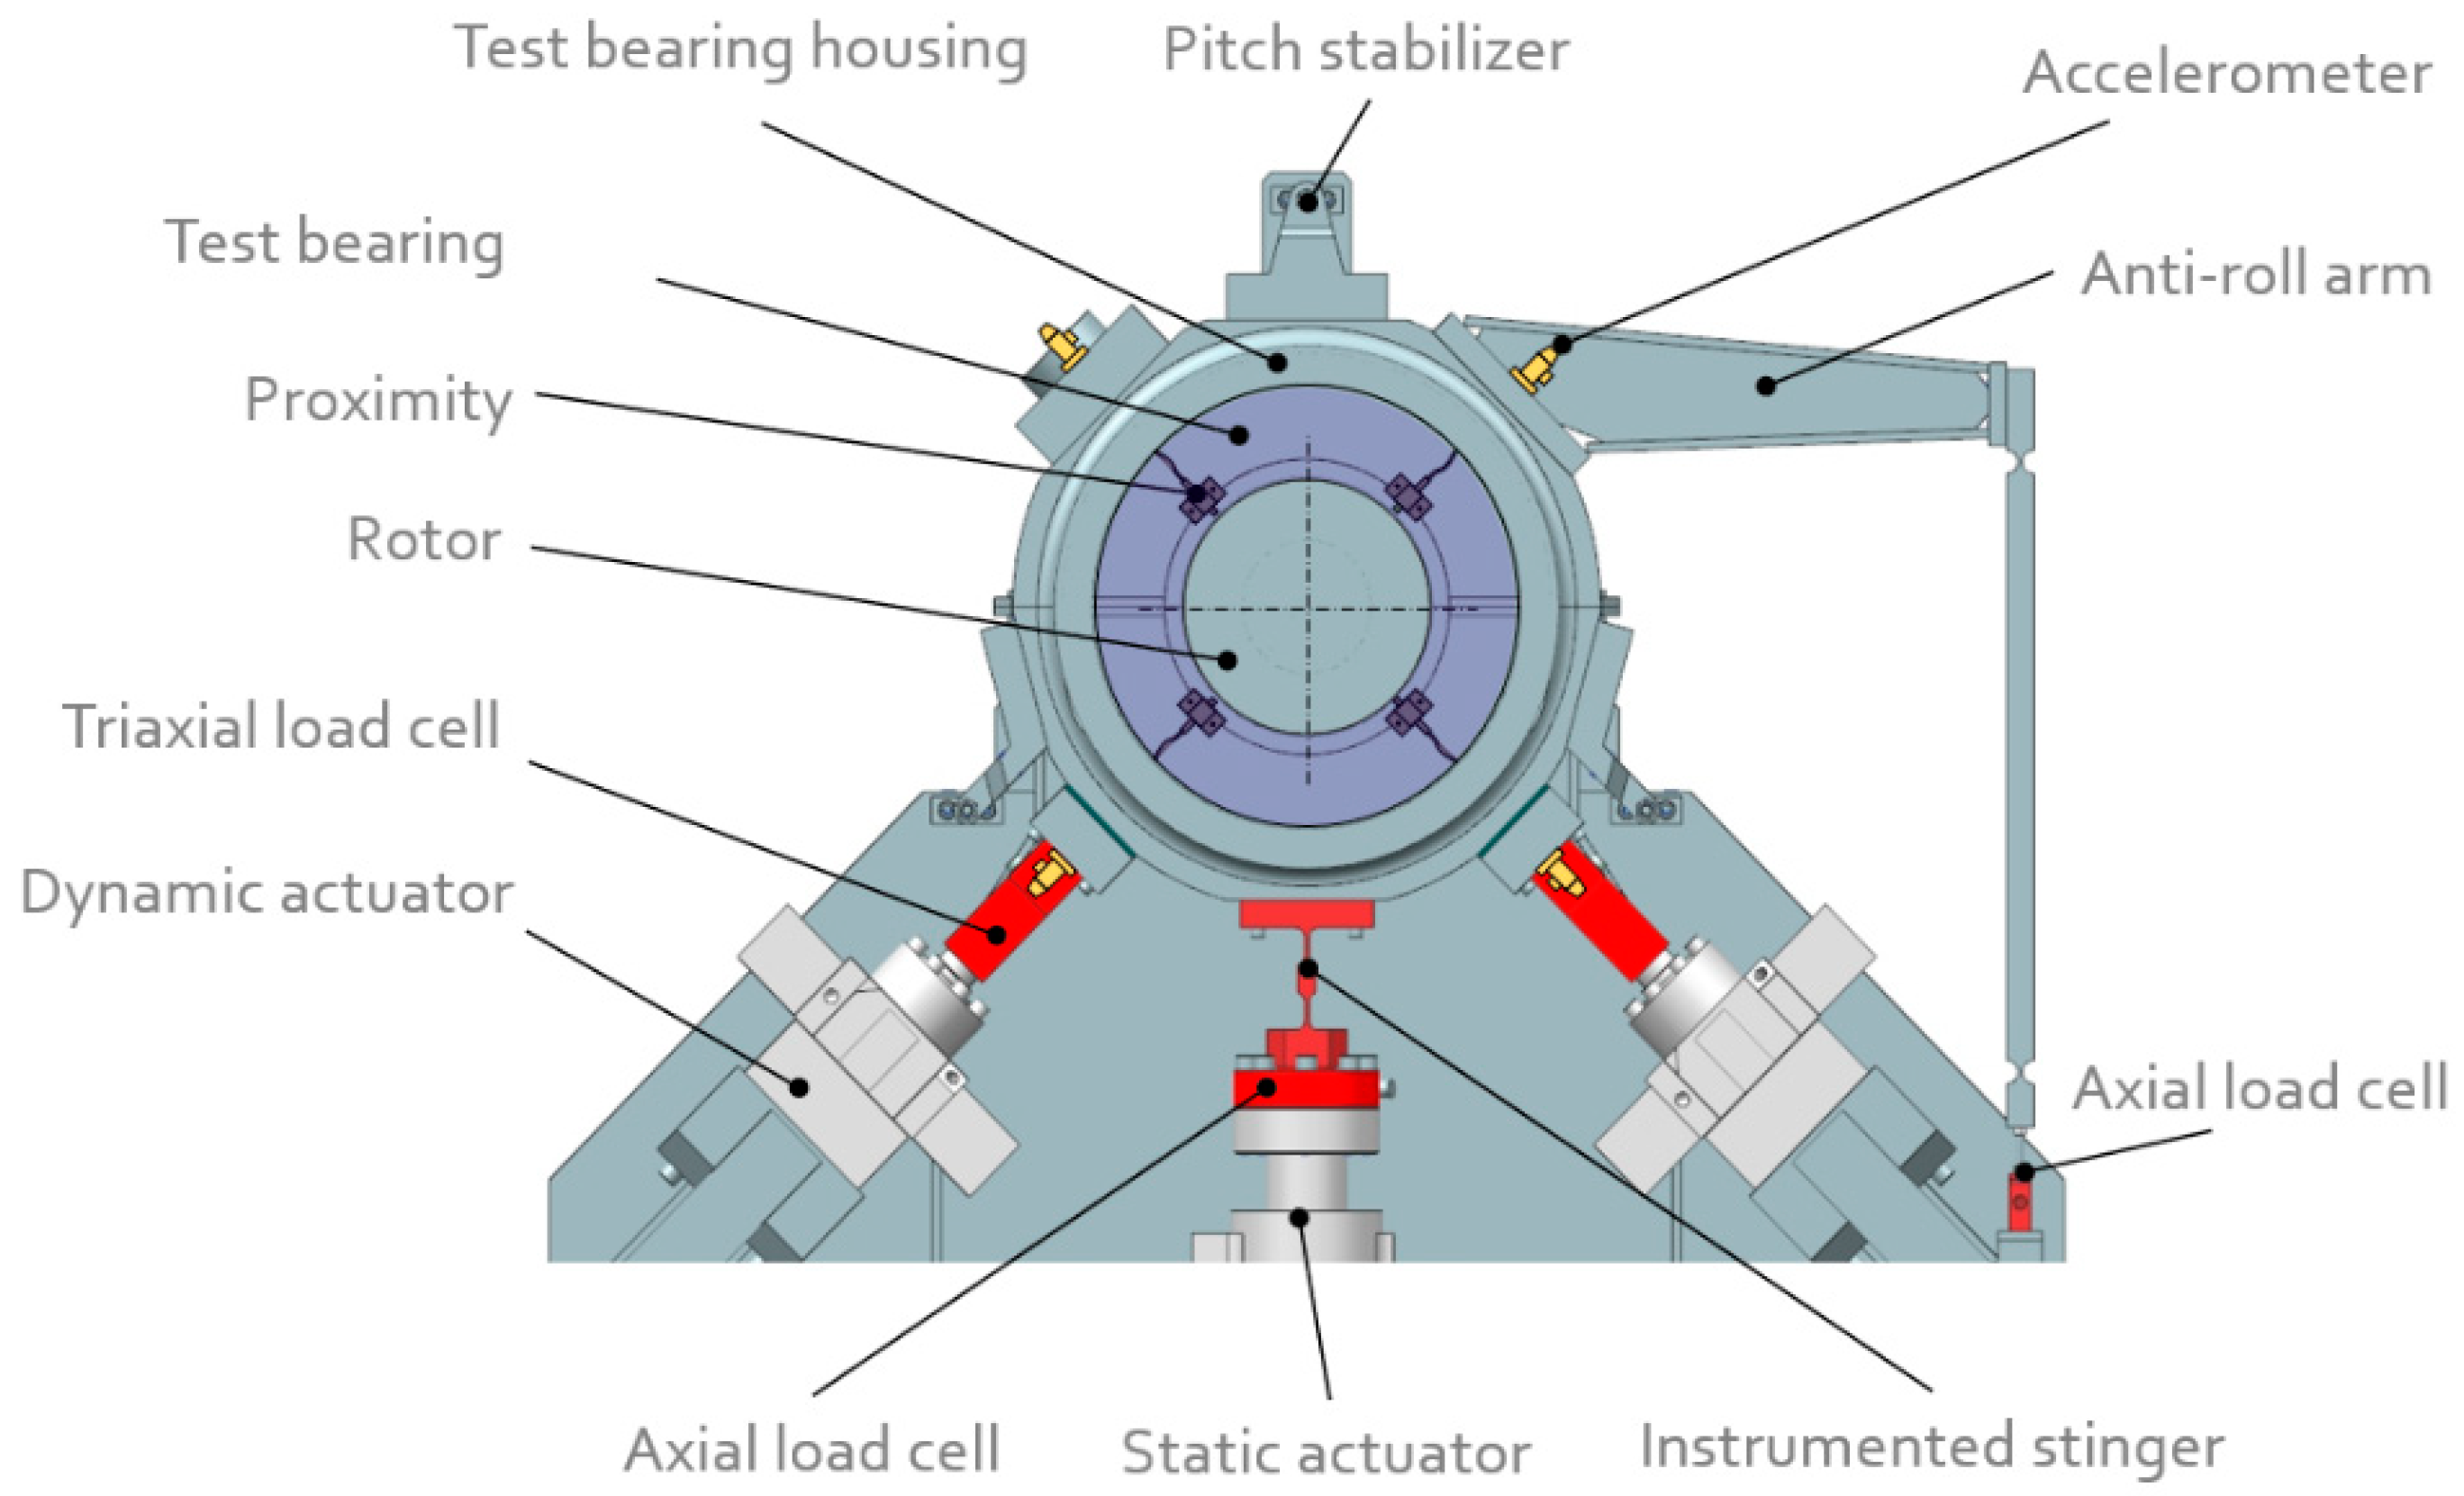
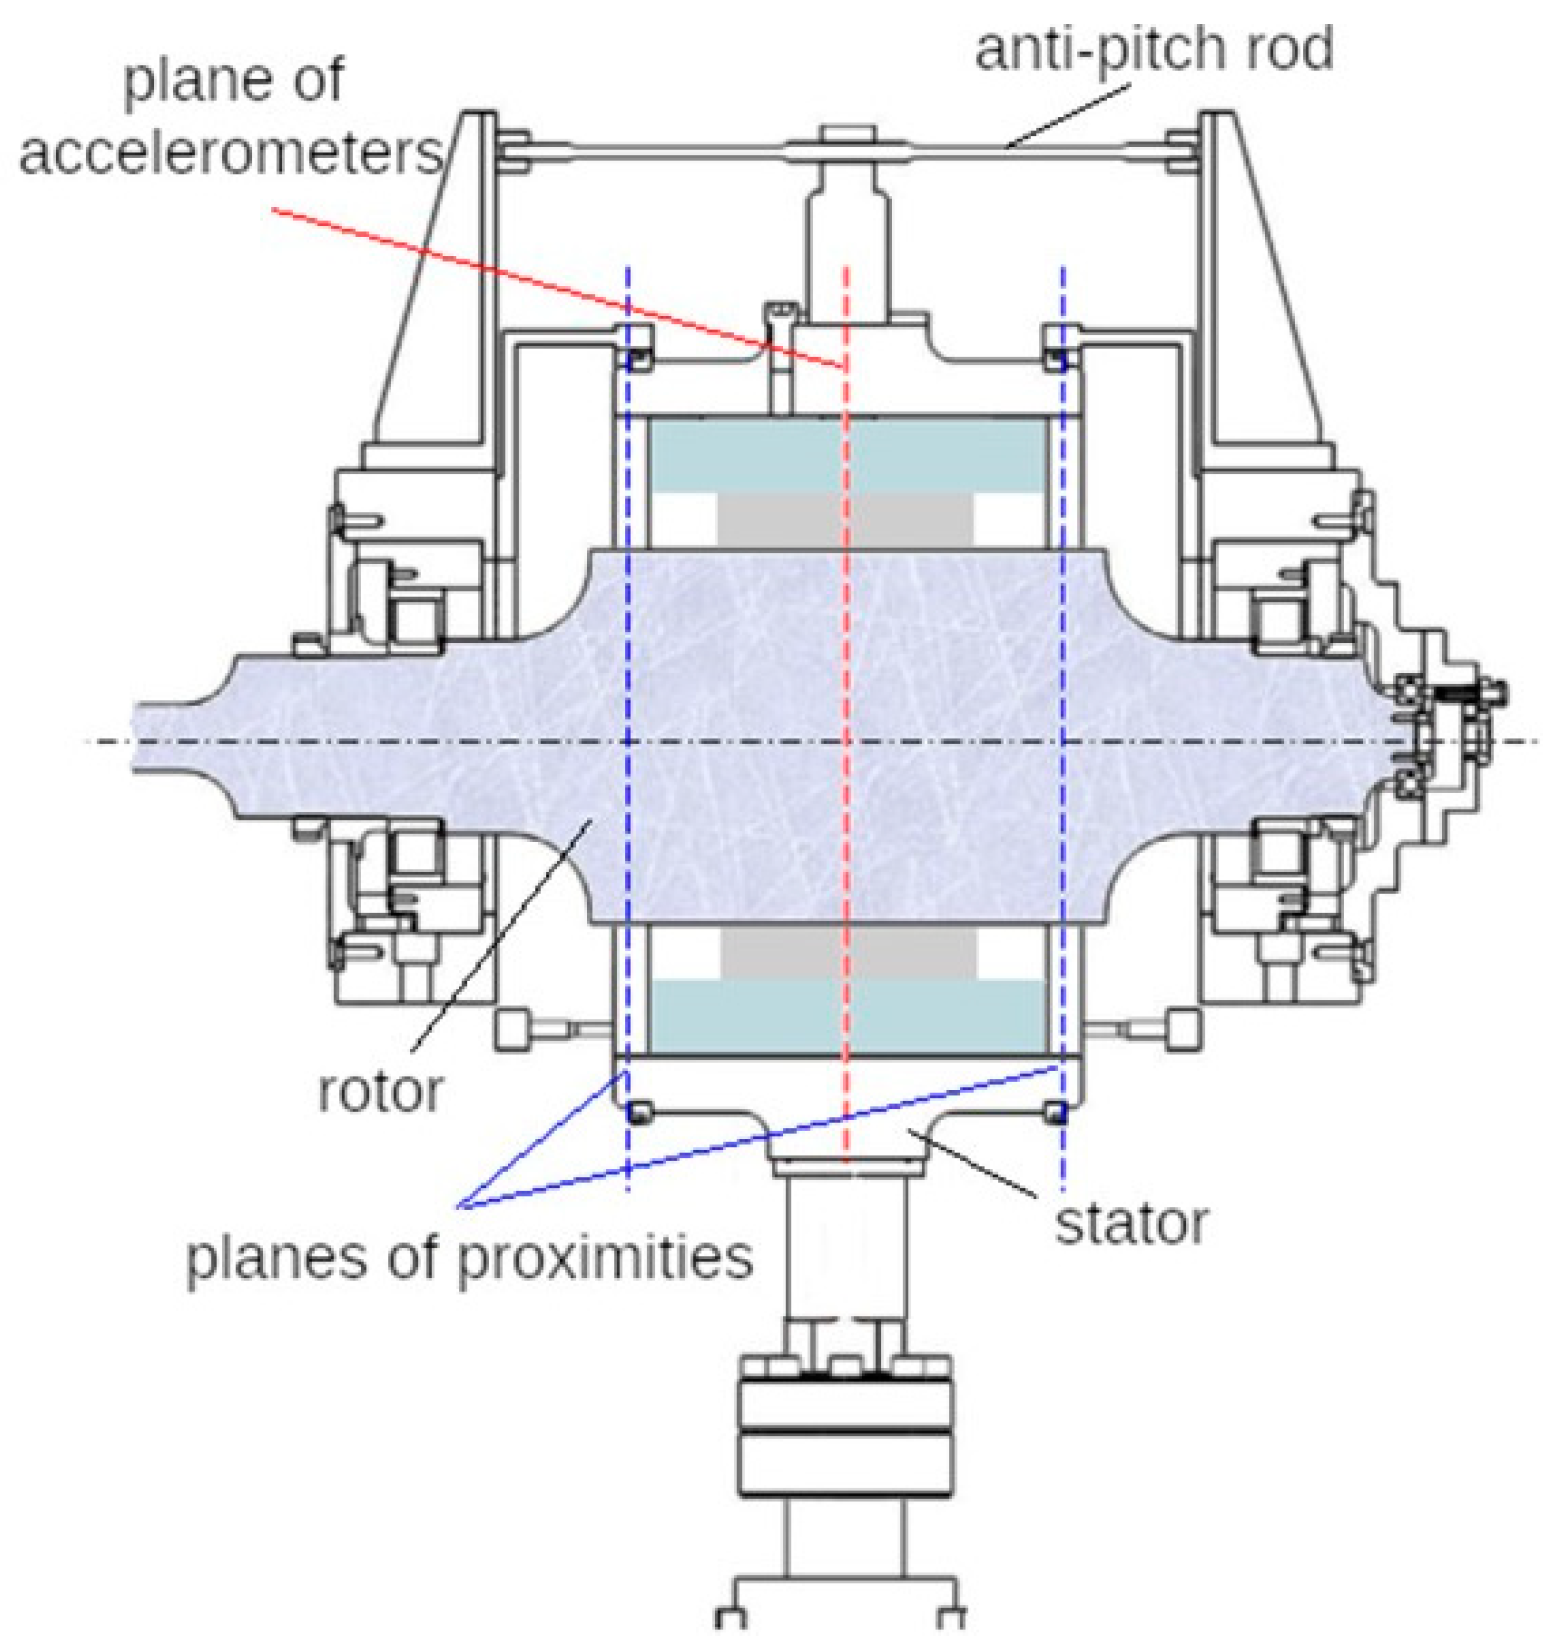
2.2. Test Section and Test Types

A configuration with floating bearing housing and fixed axis rotor is used for the test section (Figure 3). In this configuration, the static and dynamic loads are applied to the bearing housing and the rotor is supported by two rolling bearings. The bearing housing consists of two semi-housings, a lower and an upper one, positioned through two pins with a design clearance and fixed by bolts.
The static load is applied upwards in the vertical direction, while the dynamic load is obtained by using two identical hydraulic actuators controlled in force. They are positioned at 45° with respect to the vertical direction, so that they are mutually orthogonal, and can work one at a time or simultaneously. The pistons of the dynamic jacks are supported by hydrostatic bearings in order to limit friction. Instrumented stingers that have high longitudinal stiffness and small transverse ones are interposed between the actuators and the bearing housing. An axial load cell between the actuator and the stinger is used to measure the static load. The stingers of the dynamic actuators are triaxial load cells that also measure all tangential force components. An anti-roll arm is used to reduce the tangential forces on the stingers by limiting the rotation of the housing due to the bearing friction torque. An axial load cell is placed between the anti-roll arm and the basement.
It is noteworthy that the force constraints due to the interactions of the three actuators are minimized by means of the flexible stingers. Nonetheless, in spite of the unavoidable residual interactions of the actuators, since the bearing housing is constrained transversally only by load cells, all the transversal loads applied to the bearing are measured and can be used as force input together with the bearing displacement in the 2D dynamic model identification algorithm to determine the bearing dynamic characteristics.
Three pitch stabilizers (anti-pitch rod), at 120° around the bearing provide axial constraints (negligible transversal constraint) to the bearing housing (Figure 4). They are also used to align the bearing with respect to the rotor, through an iterative procedure, acting on two opposite bolts placed on their threaded central bodies.
Eight high-resolution proximity sensors are used to measure the radial relative displacements between the bearing housing and the rotor on two parallel planes perpendicular to the bearing axis. Four accelerometers measure the acceleration of the bearing housing at the mid-section (Figure 3). More information about all the sensors used for the dynamic characterization of the bearing is given in Table 2.
The test section was primarily designed to test large size TPJBs with diameters from 150 to 300 mm, axial length to diameter ratio L/D = 0.4–1.0, and peripheral speeds up to 150 m/s. Bearings with diameters from 250 to 300 mm can be tested with minor modifications, essentially using a shaft with suitable diameter. Some major modifications are instead necessary for testing bearings with lower diameters due to the different range of stiffness involved, leading to lower shaft frequencies.
Static and dynamic tests can be performed. A bump test is also usually carried out to identify the bearing clearance, center, and alignment by applying a low frequency rotating force generated by two sinusoidal forces with 90° phase shift, produced by the dynamic actuators. Low-frequency signals are recorded under stationary conditions at different load, speed, oil temperature, and flow rate. Typical collected data are forces, torque, displacements, rotational speed, temperatures, pressures, flow rates in the main and auxiliary lubrication systems.
The dynamic tests are performed to identify the bearing stiffness and damping coefficients. Sinusoidal forces at the desired frequency and amplitude are produced by the dynamic actuators. A vertical force is produced with the actuators operating in phase with equal amplitude and frequency and a horizontal force when operating in antiphase. The main high frequency collected data are forces, displacements, and accelerations. Some characteristics of the experimental rig with the present test section for bearings with 280 mm inner diameter are reported in Table 3.

2.3. Dynamic Coefficients Identification Method

To avoid imbalance disturbance, synchronous values of the dynamic coefficients are not directly obtained by testing at the rotational frequency but by an interpolation of the results obtained at different frequencies chosen below and above the rotational frequency. In order to decrease the acquisition time, the forces applied during excitation can contain more frequency components (“multitone” test) instead of a single frequency (“single tone” test). Two linearly independent tests are necessary for the identification of the dynamic coefficients for each working condition. Usually, tests with vertical and horizontal dynamic forces are performed with amplitudes of each sinusoidal load tuned in order to have a displacement amplitude sufficiently high for the analysis but not so high to produce non-linear behaviors [13]. Signals of force, displacement, and acceleration are then processed in the frequency domain using the Fast Fourier Transform (FFT), separating the different frequency components. The bearing film force is firstly determined by subtracting the bearing housing inertia from the measured forces acting on the housing:
F b x i F b x a F b y i F b y a = F h x i F h x a F h y i F h y a M A x i A x a A y i A y a
where F indicates the amplitude of the force FFT, A the amplitude of the acceleration FFT, M the housing mass; the subscripts b and h refer to bearing and housing, x and y refer to the horizontal and vertical direction, a and i to the anti-phase and in-phase test, respectively. The stiffness and damping coefficients are obtained as the real and imaginary parts of the bearing impedance matrix determined in the frequency domain by multiplying the [2 × 2] bearing force complex matrix by the corresponding inverse displacement complex matrix:
H x x H x y H y x H y y = k x x k x y k y x k y y + i ω c x x c x y c y x c y y
with
H x x H x y H y x H y y = F b x i F b x a F b y i F b y a D x i D x a D y i D y a 1
where H indicates the complex elements of the impedance matrix, k and c the stiffness and damping coefficients, respectively, and D the amplitude of the displacement.

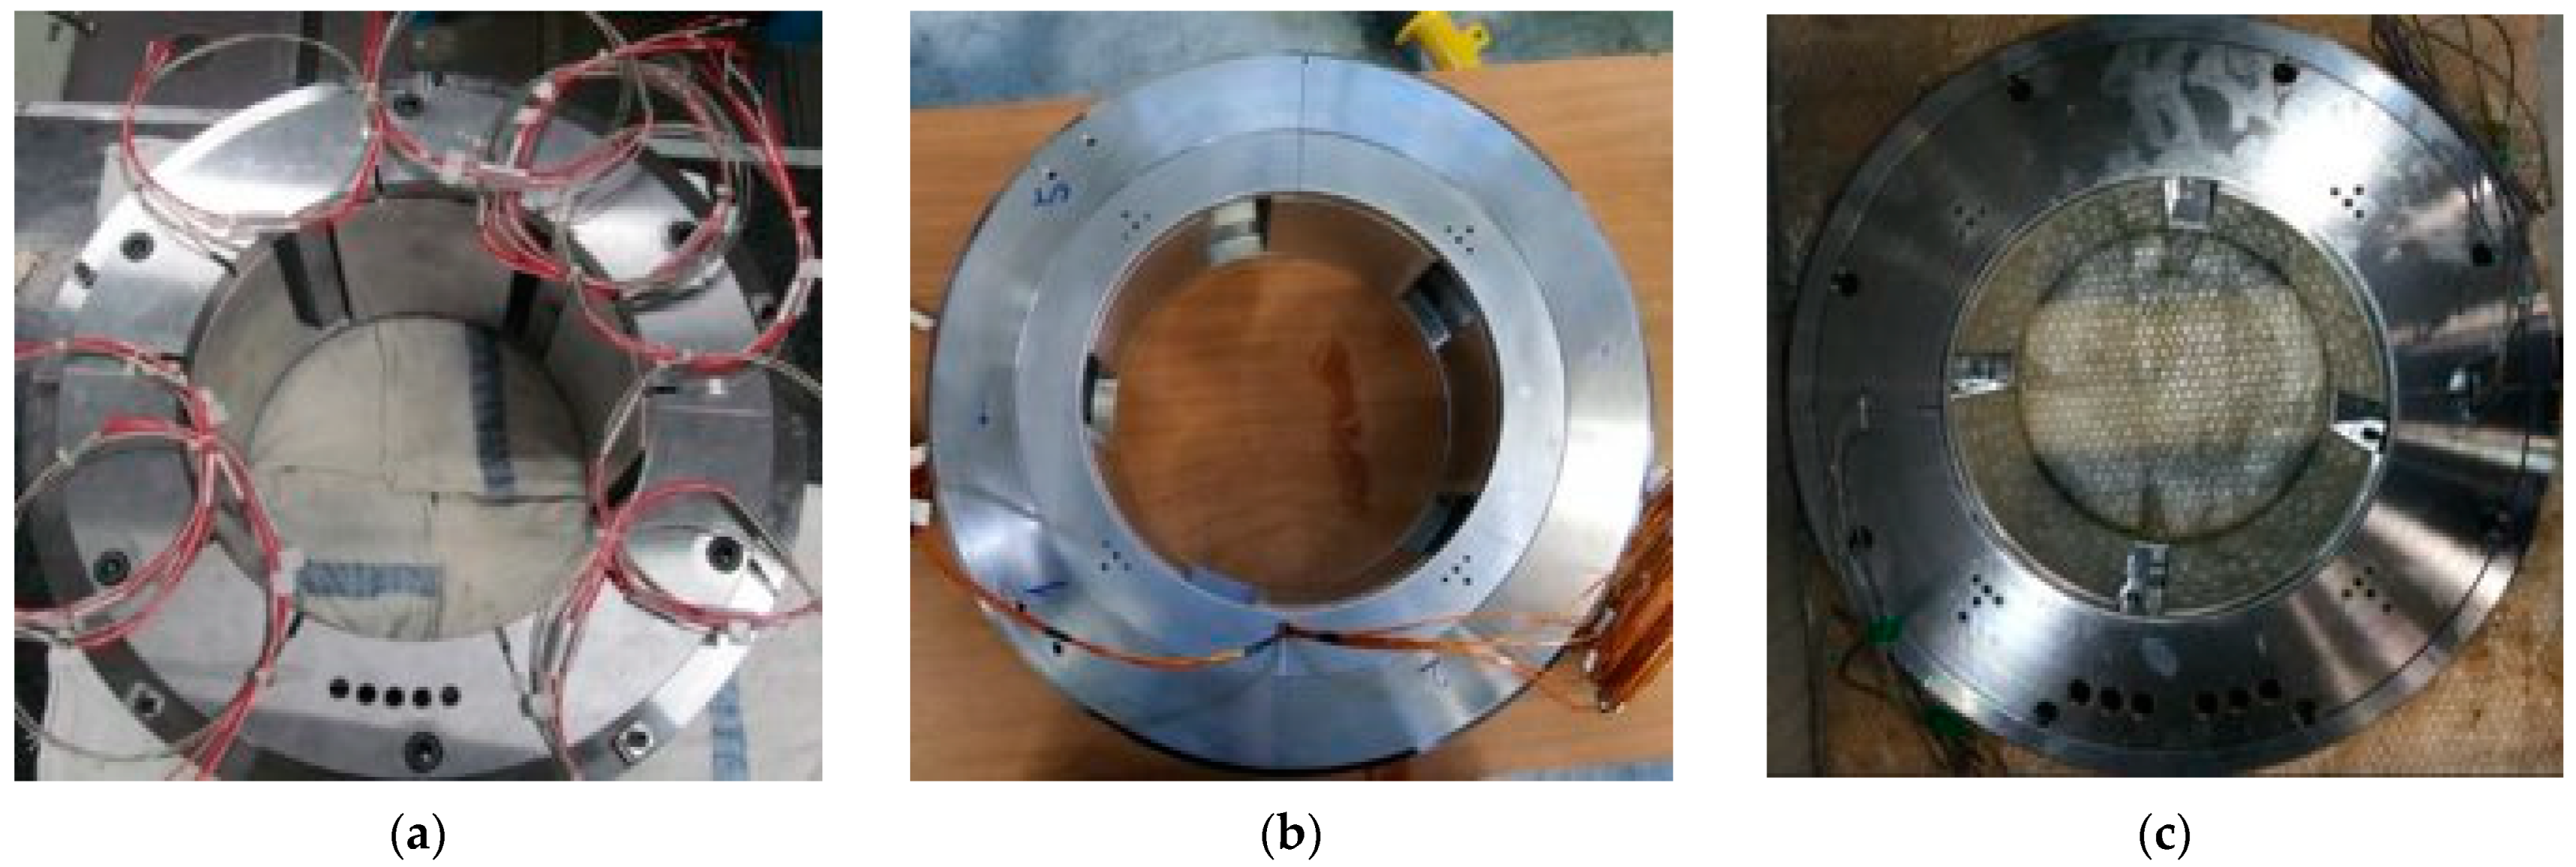
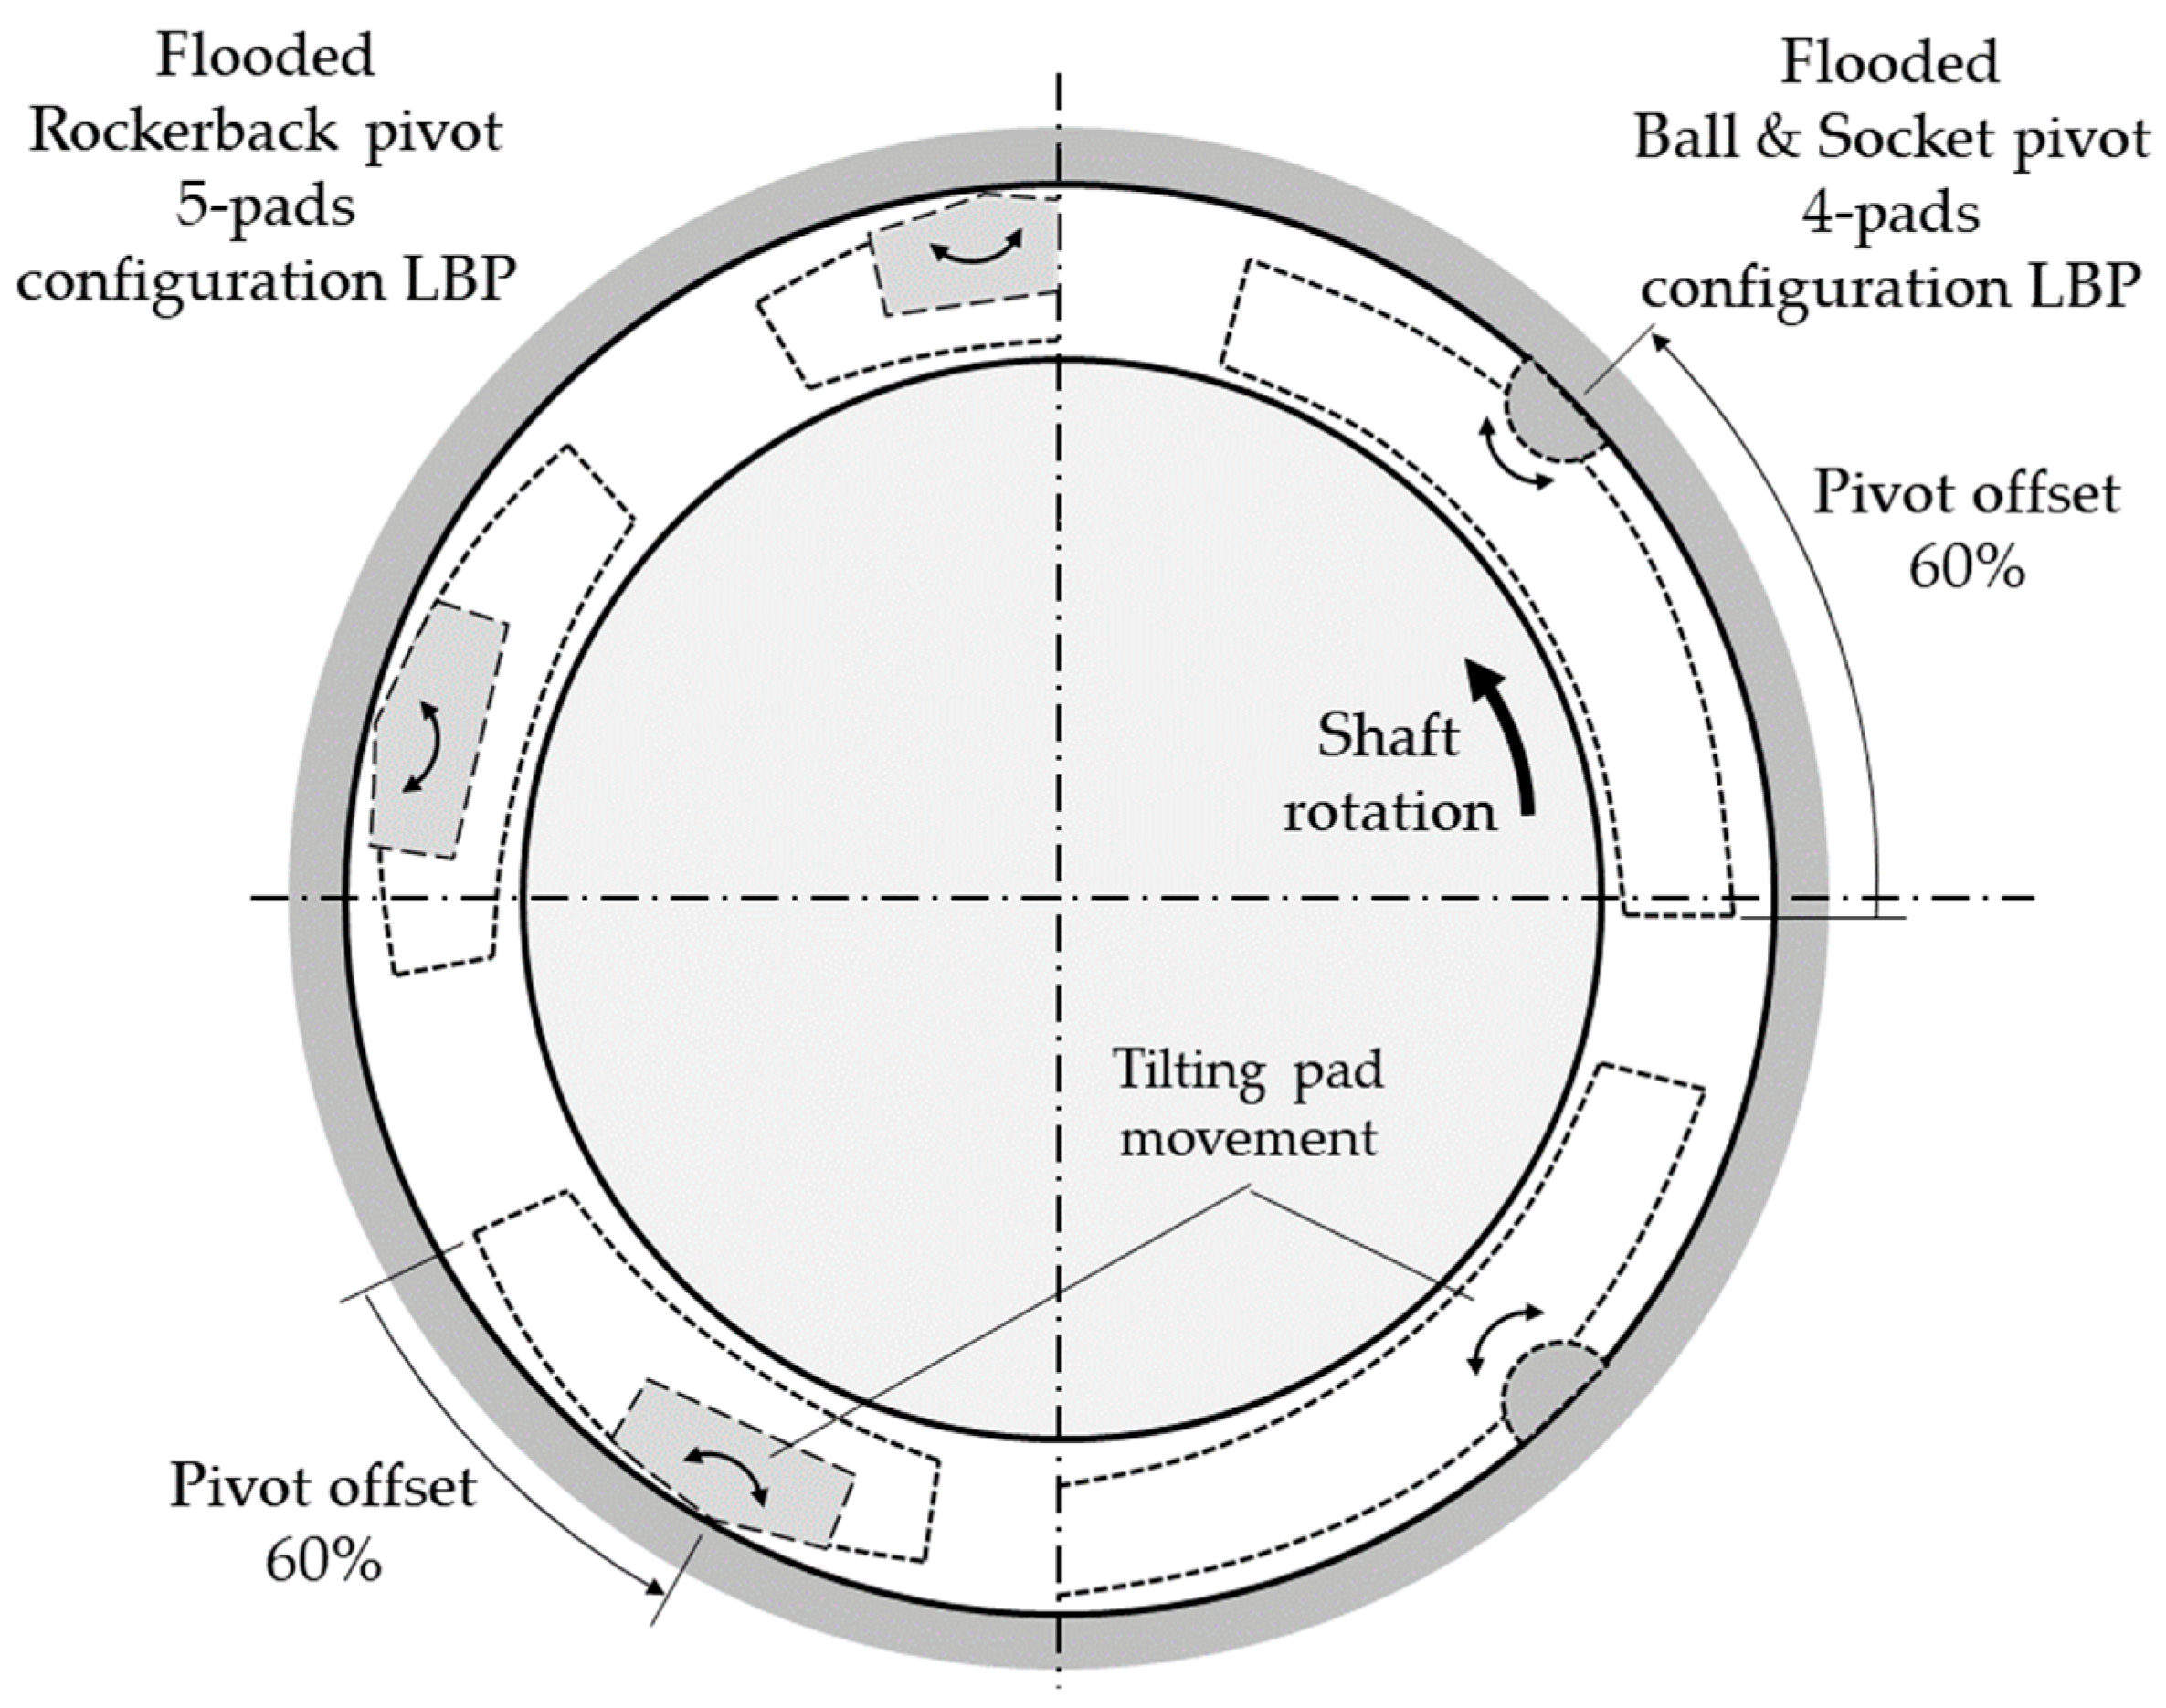
2.4. Tested Bearings

Three TPJBs were tested: the Direct Lube Rocker Pivot bearing, the Flooded Rocker Pivot bearing, and the Flooded Ball & Socket Pivot bearing. The bearings are shown in Figure 5 and their characteristics are summarized in Table 4. According to Baker Hughes nomenclature, bearing lubrication layouts are classified as:
  • flooded lubrication when the end seals clearance is low enough to get pressurized bearing housings;
  • direct lubrication when all the required oil is supplied by oil inlet orifices/spray bars and the bearing cavity is evacuated through the adoption of larger end seals clearance with respect to flooded configurations.
The scheme of the pivot geometry is shown in Figure 6 for the Load-between-Pivot configuration. The 5-pad configuration is shown on the left and the 4-pad on the right.
In the following schemes, the direction of the shaft rotation is indicated as seen from the side opposite to the driver side.
The Direct Lube Rocker Pivot bearing (Figure 5a) is a high-speed 5-pad TPJB that was designed with the aim of reaching high peripheral speeds (>100 m/s). The pads are connected to the bearing housing by means of a cylindrical pivot (Figure 6). The pad arc geometry and the particular scheme of the lubrication layout were defined through an optimization process to target the required static and dynamic performance in the entire speed range. Each pad is instrumented with two thermocouples (Figure 7). For this bearing and the following ones, the location of the thermocouples is at 25% and 75% of the pad arc, at 50% of the axial length, while the radial distance from the sliding surface is compliant with API 670 requirements [23].
The Flooded Rocker Pivot bearing (Figure 5b) is the standard product for all the applications that do not require high-speed operating range (<80 m/s). The 5 pads are equipped with a cylindrical pivot (Figure 6) and fed with lubricant through five holes in the bearing housing. The oil fills the housing internal chamber, and the flow rate is set by varying the clearance between rotor and oil seals. This design allows to have an easier oil layout, but with less thermal exchange between oil and pad. The lower pads are instrumented with two thermocouples each while the thermal behavior of the three upper pads is assessed through a thermocouple placed at 75% of the pad arc (Figure 8).
The Flooded Ball & Socket Pivot bearing (Figure 5c) is one of the bearings adopted in large centrifugal compressor applications that do not require high-speed operating range (<80 m/s). The 4 pads are equipped with a ball-and-socket type pivot (Figure 6) and fed with lubricant through spray bars attached to the bearing housing. The oil fills the housing internal chamber, and the flow rate is set by varying the spray bar holes diameter and the clearance between rotor and oil seals. Again, the lower pads are equipped with two thermocouples and the upper pads with one thermocouple (Figure 9).

3. Results

The most relevant experimental results of the three tested bearing configurations are presented in this section. The bearings test campaign was designed in order to investigate the performance of the bearings in a wide range of the possible operating conditions in terms of applied load, peripheral speed bearing configuration, oil flow, and oil inlet temperature:
  • bearing specific load (0.2–2.2 MPa).
  • peripheral speed (up to 130 m/s).
  • oil flow (50–100% of required flow).
  • oil inlet temperature (40–60 °C).
  • load direction: Load-between-Pivot (LBP).
In the following sections, the results relative to a selected sub-set are presented. More specifically, the results related to two different applied static load configurations for each specific bearing are compared. The load conditions were chosen, taking into account the design load conditions of the machines (centrifugal compressor, steam turbines) equipped with each specific bearing type. The comparison was carried out considering the static (eccentricity, maximum pad metal temperature, power losses) and dynamic (asynchronous stiffness coefficients, synchronous stiffness, and damping coefficients) results. An uncertainty assessment on the dynamic system was performed and shown in previous works [22].
As for the industrial best-practice, before introducing a new bearing design in turbomachines, a component level test of the bearing must be performed to preliminarily validate the dynamic and static performance, thus reducing the associated risk in the machine design. The operating conditions presented in the paper are the design conditions of the specific turbomachines that adopt such bearing solutions.
The Direct Lube Rocker Pivot bearing was tested with a constant oil flow value of 450 L/min that represented the required oil flow to target the desired pad temperature values (lower than 90 °C) at bearing design speed (110 m/s).
The Flooded Rocker Pivot bearing was tested with an oil flow nominal value, equal to 213 L/min, representing the required value at bearing design speed (90 m/s) and with an oil inlet temperature of 40 °C.
The Flooded Ball & Socket 4-pad bearing was tested with an oil flow value of 160 L/min (required value at 90 m/s) and with an oil inlet temperature of 40 °C.

3.1. Static Performance

3.1.1. The Bump Test Results

The bump test results (Figure 10, Figure 11 and Figure 12) illustrate the polygonal clearance profile of the bearing realized by closing the gap between the rotor and the pads along all directions with a rotating force of 5 kN, compared to the theoretical circles representing the minimum and maximum bearing assembly clearance values. The clearance curves at both proximity probes measurement planes, obtained after the iterative procedure of alignment, are almost superimposed, so, for clarity’s sake, only the average curve is shown.
It is worth noting how the angular offset of pivots of the Direct Lube Rocker Pivot bearing (Figure 10) is clearly visible through the rotated shape of the pentagon. The regularity of the pentagonal shapes and its position with respect to the theoretical minimum and maximum clearance circles testifies to the good quality of the pads manufacturing.
Figure 11 shows the clearance profile for the Flooded Rocker Pivot bearing. As for the previous bearing, the angular offset of the pivot determines the rotated shape of the pentagon. The irregular shape of the pentagonal figure can be ascribed to a large misalignment between the upper and lower semi-housings entirely due to the clearance of the alignment pins.
The Flooded Ball & Socket Pivot bearing measured profile is illustrated in Figure 12. The square shape produced by the four-pad bearing is regular, denoting the good quality of the pads manufacturing. It is worth noting that there is a little misalignment between the upper semi-housing (slightly moved to the left) and the lower one (slightly moved to the right). The entity of the misalignment is comprised in the design clearance of the alignment pins.

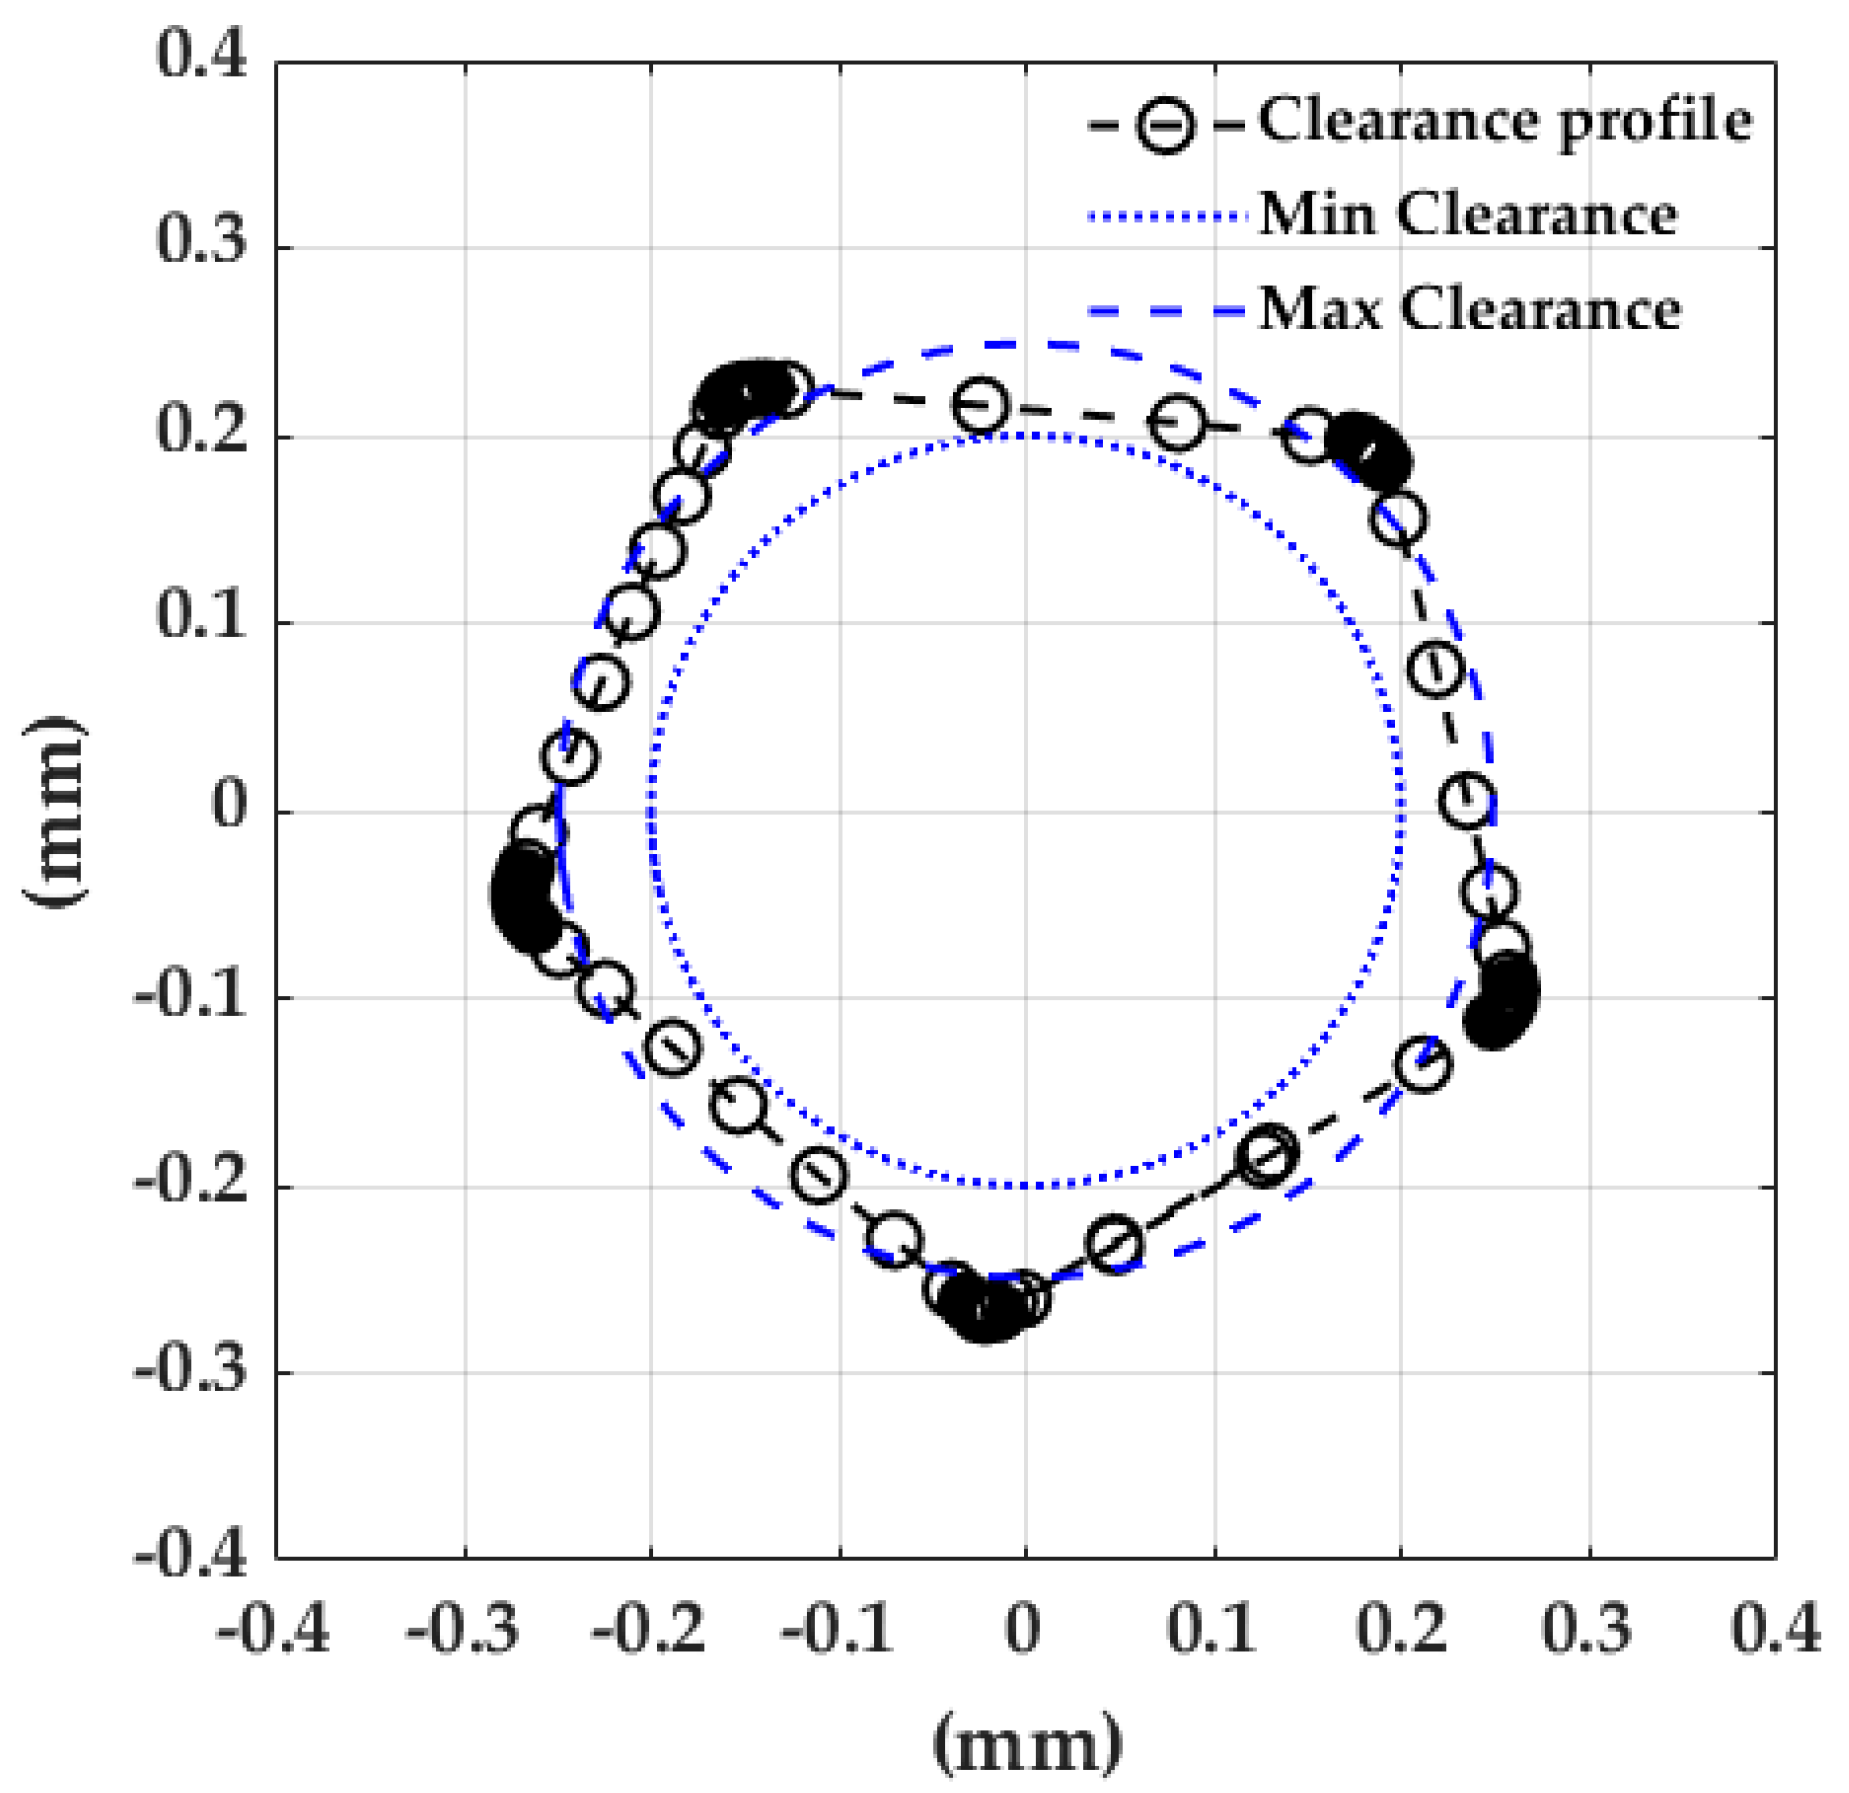
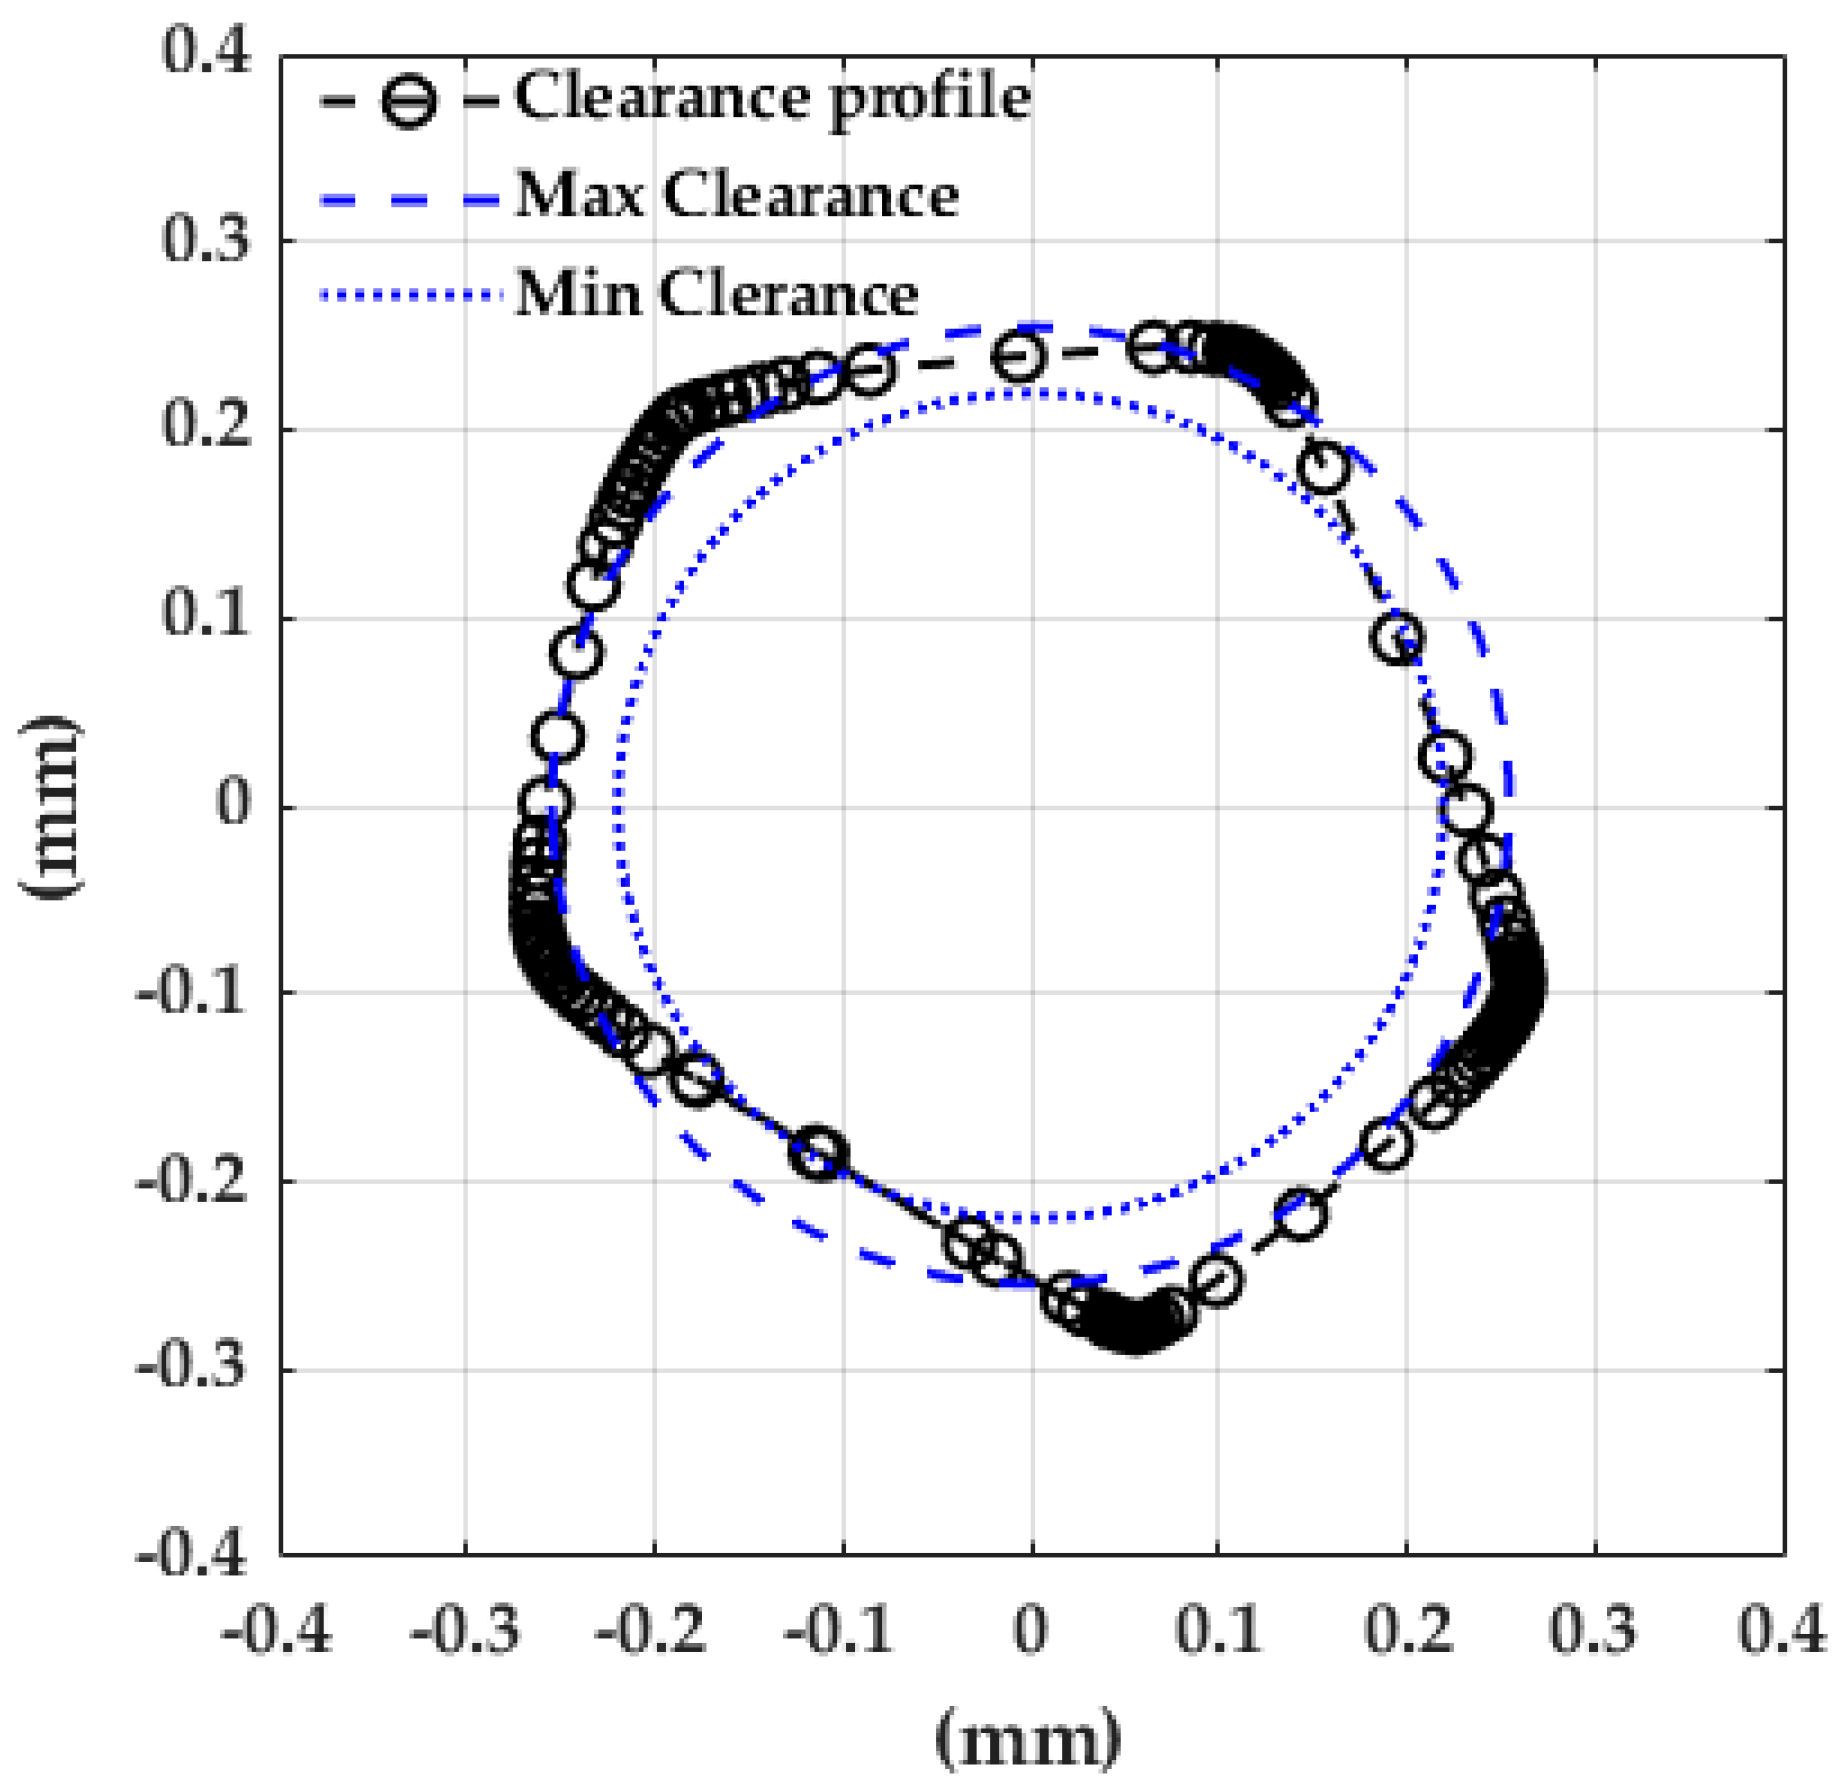
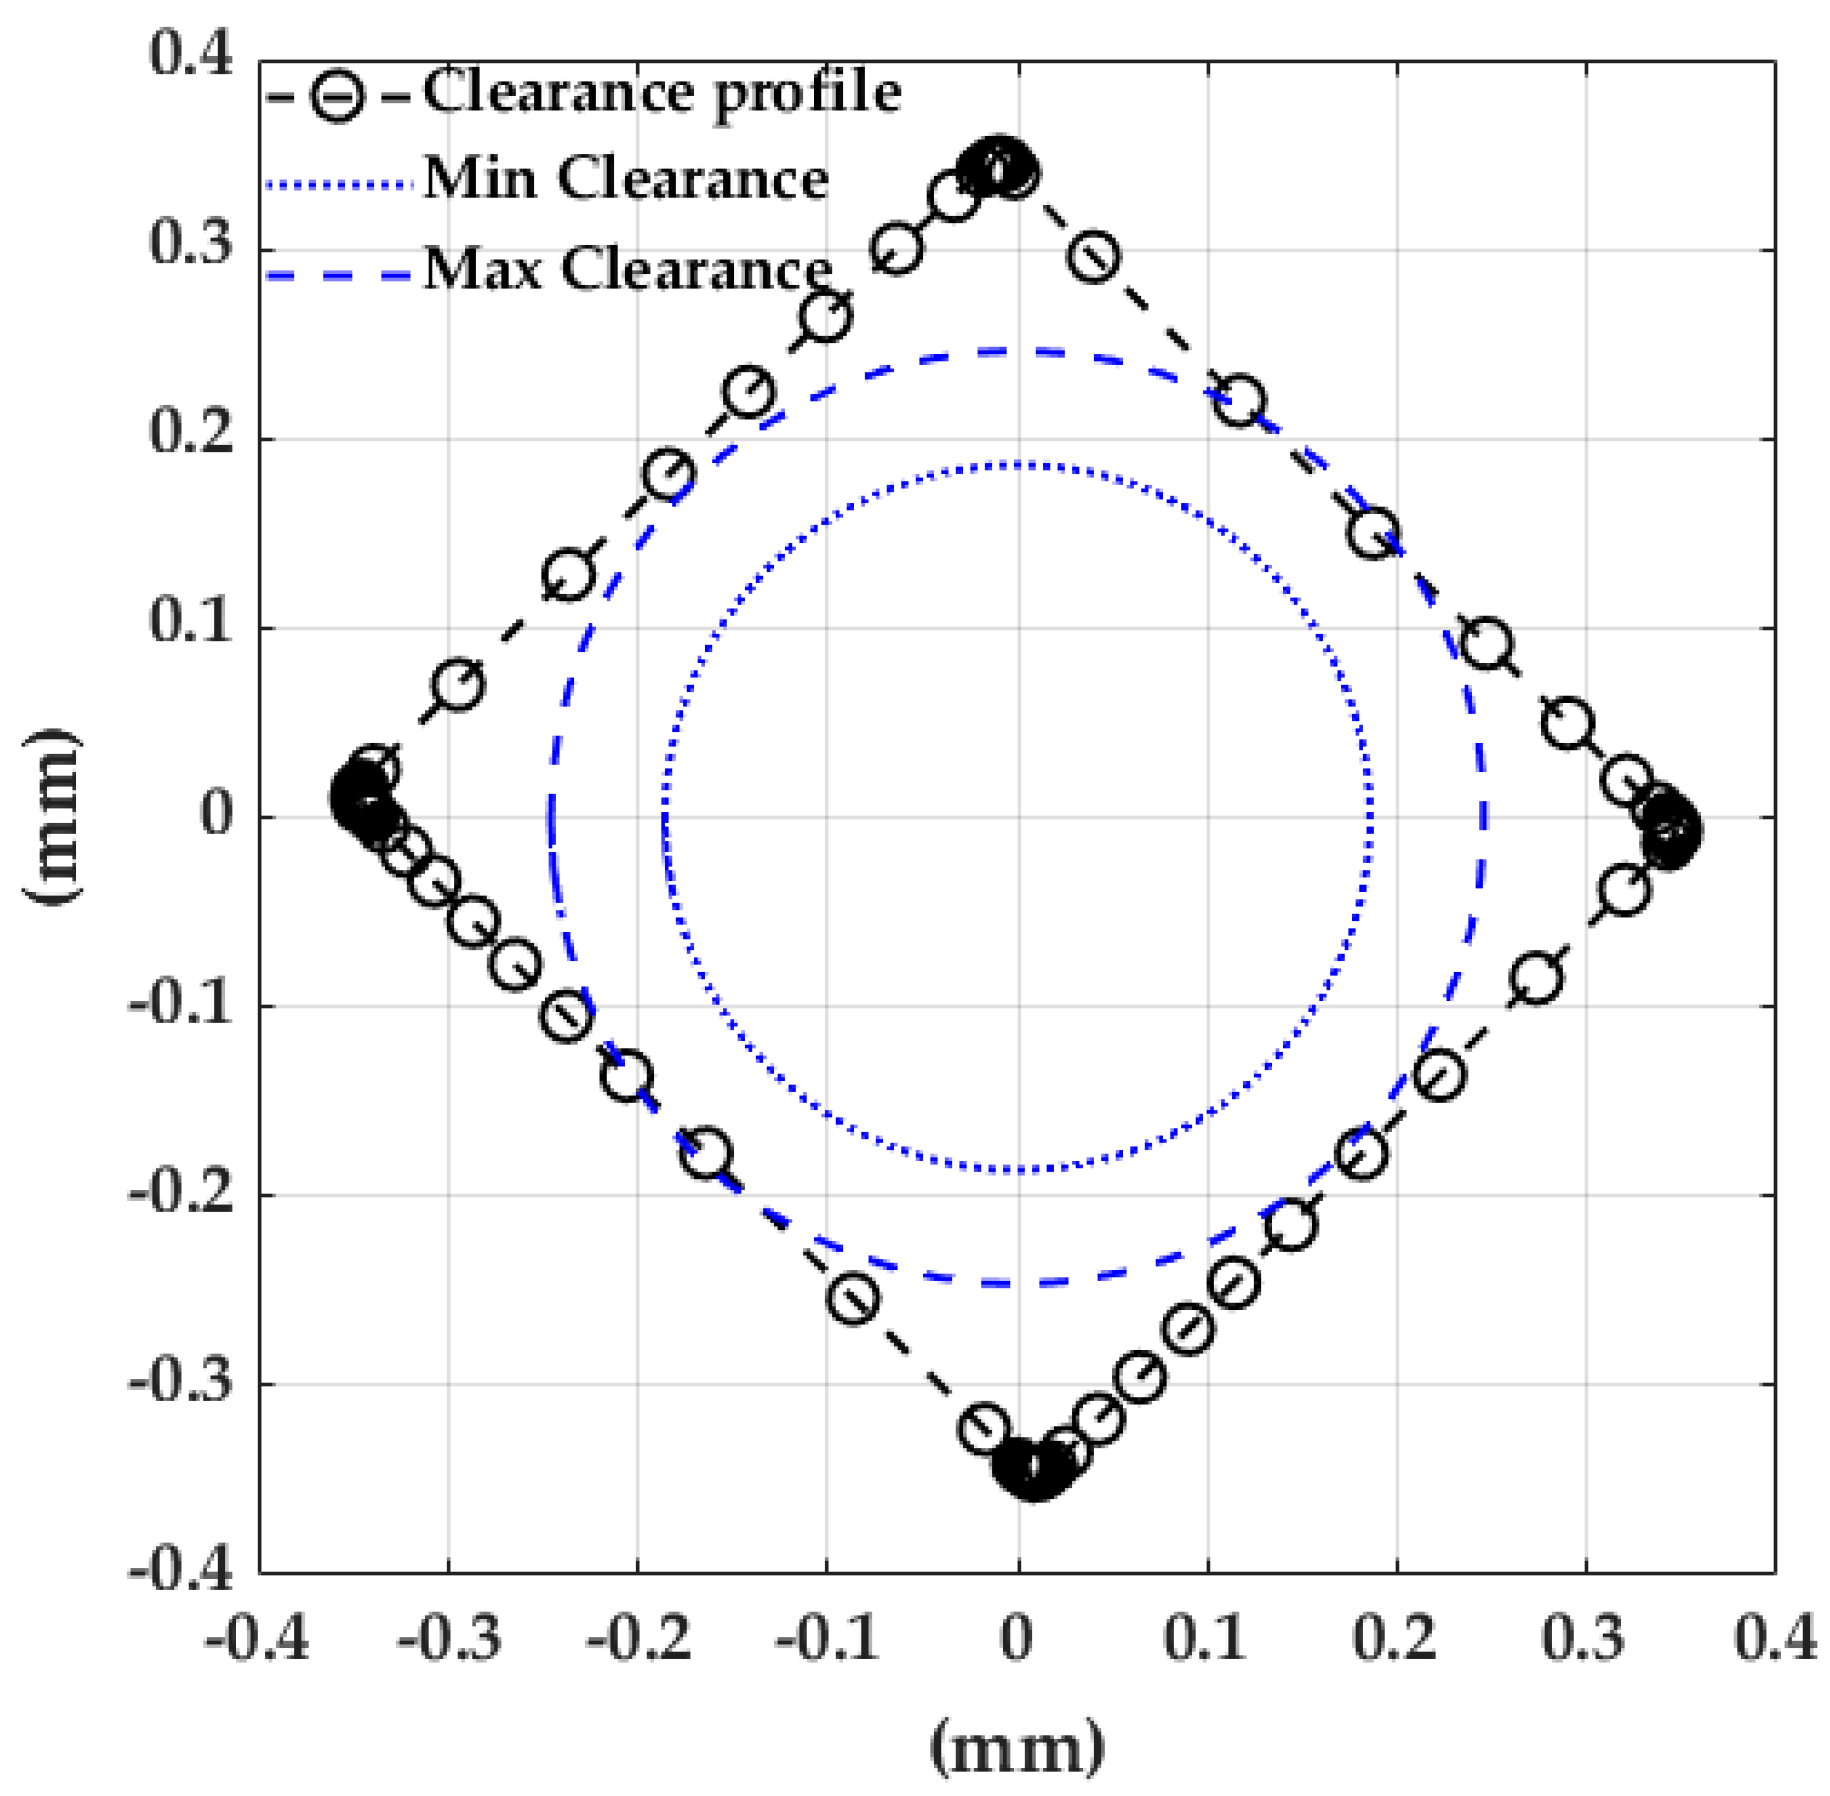
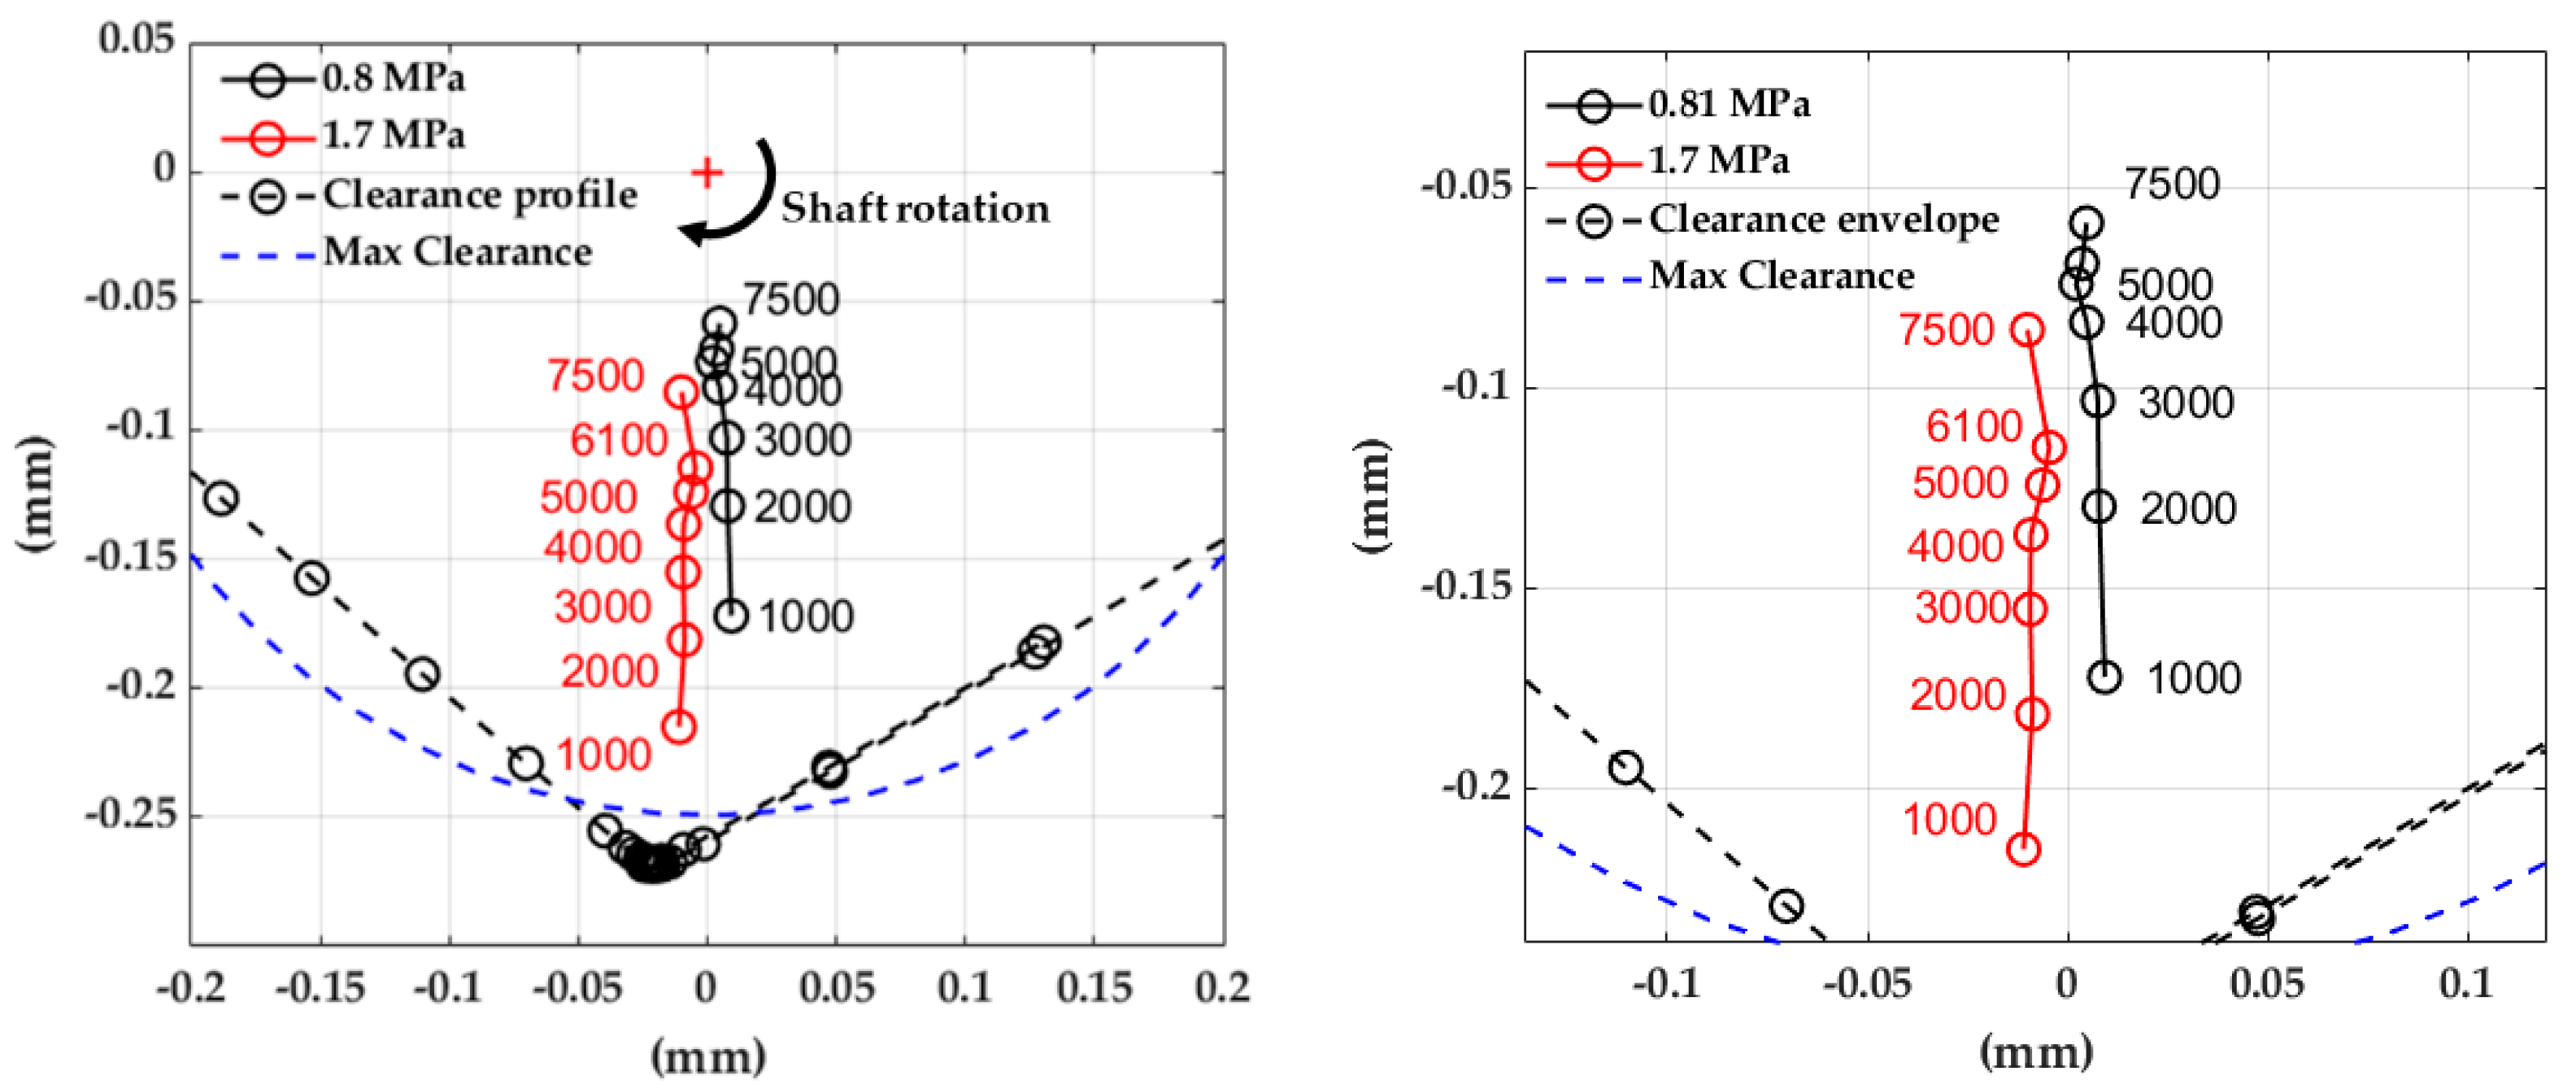
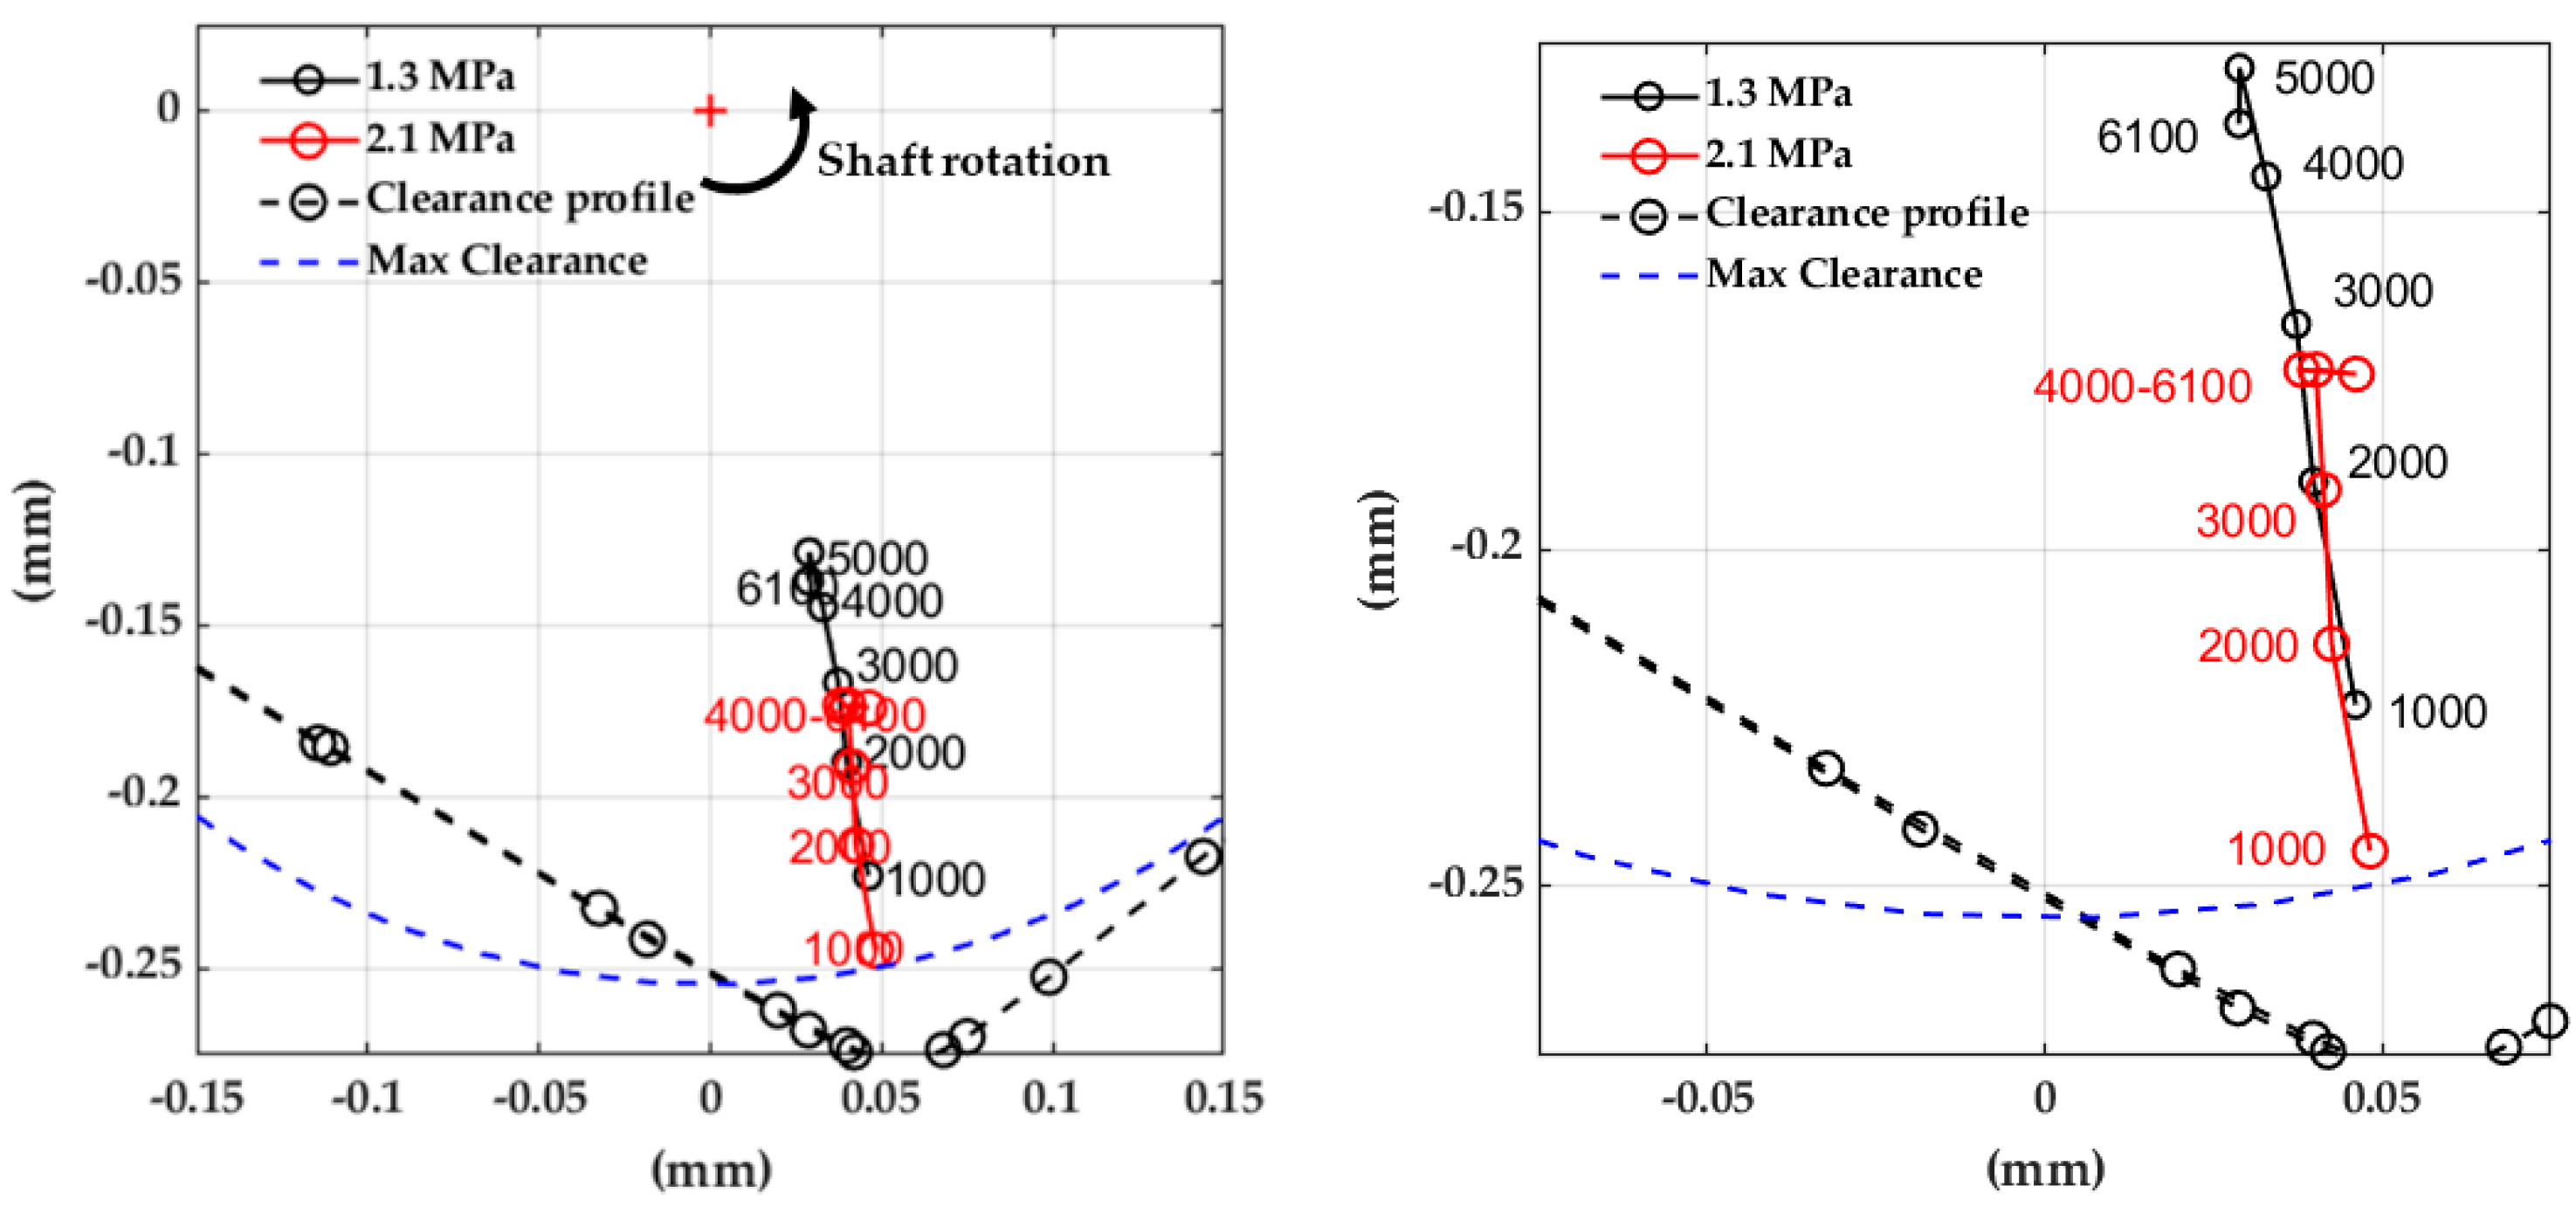
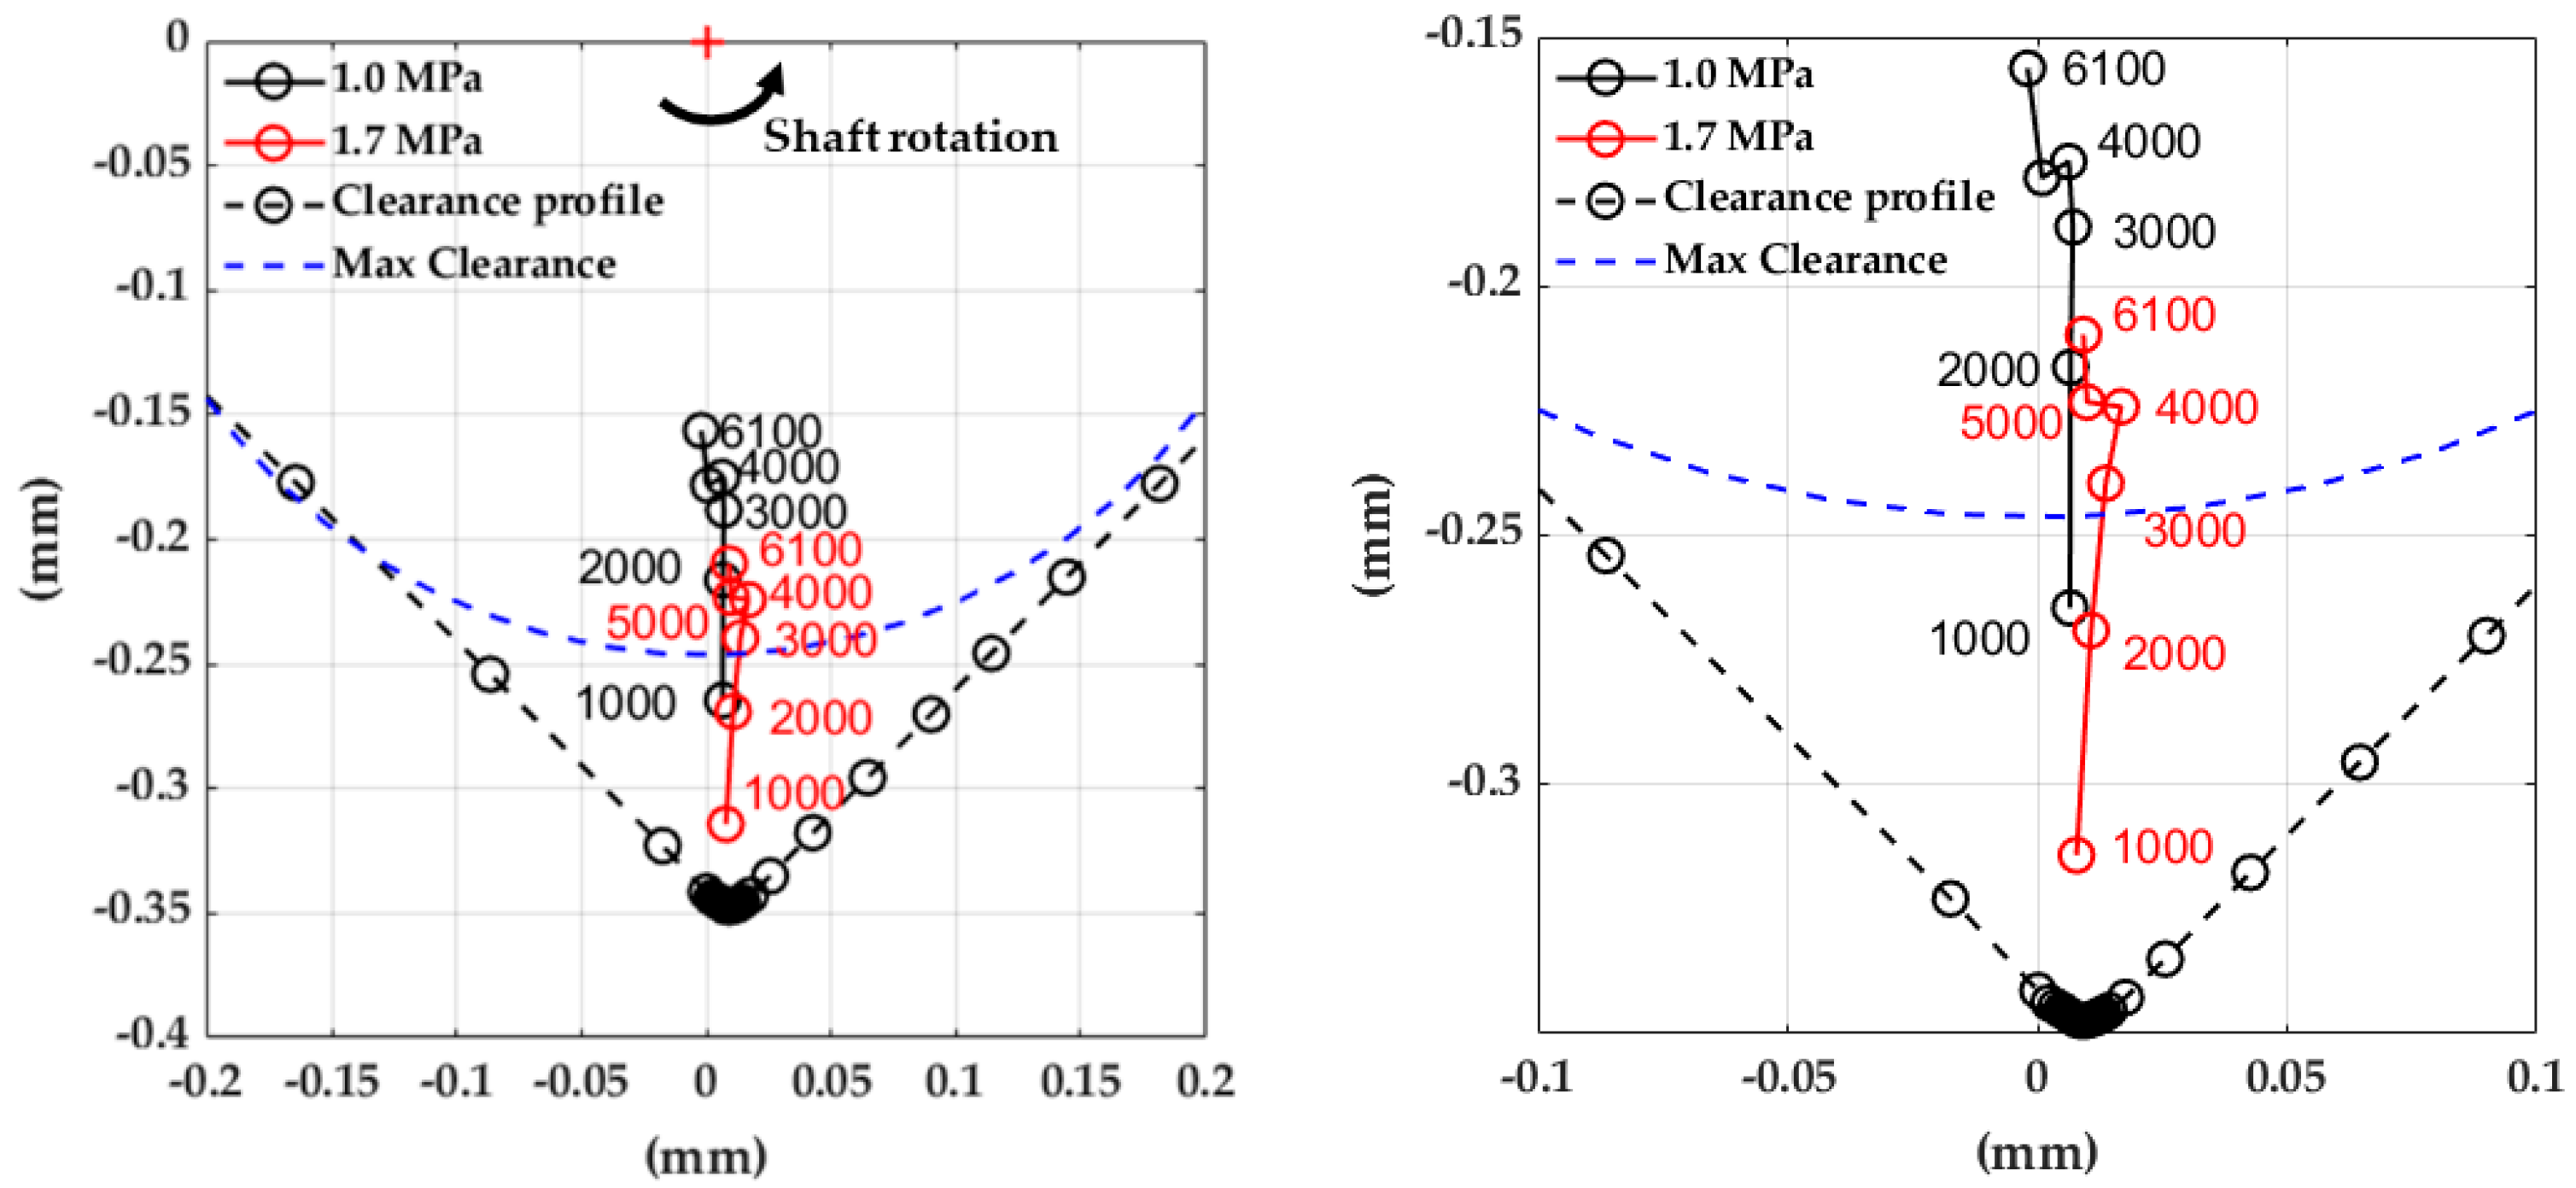
3.1.2. The Shaft Center Eccentricity

Figure 13 shows the shaft center position of the Direct Lube Rocker Pivot bearing as function of the rotational speed for the two load cases (0.8, 1.7 MPa) using the nominal maximum clearance circle as reference. As the speed increases, the shaft moves towards the bearing center along an almost vertical line, as expected for tilting pad journal bearings. As the load increases, the shaft centerline is characterized by higher eccentricity values and it is shifted laterally in the journal rotation direction.
Figure 14 shows the shaft center location of the Flooded Rocker Pivot bearing as function of the rotational speed for the two load cases using the nominal maximum clearance circle. The shaft moves towards the bearing center as speed increases along an inclined line but at high speed the center moves off the regular trend and under the higher load, above 4000 rpm, it shifts horizontally. For the higher load case, as for the previous bearing, higher eccentricities of the shaft centerline are found with respect to the low load case at corresponding speed values.
Figure 15 shows the shaft center location of the Flooded Ball & Socket Pivot bearing as function of the rotational speed for the two load cases using as reference the nominal maximum clearance circle. The shaft moves towards the bearing center as speed increases along an almost vertical line but above 4000 rpm the center has an apparent horizontal shift to the left. The load increase has also the effect of shifting the shaft center downwards and slightly to the right.
At low rotational speed, the shaft center of the Flooded Ball & Socket Pivot bearing is outside the nominal maximum clearance circle but inside the bump test envelope. This can be explained with the static shaft sink value (s) evaluated according to the geometric expression [24]:
s = c r cos Θ P
with c r and Θ P representing, respectively, the bearing radial clearance and the angle between the lower pads pivot position and the vertical direction downwards. Table 5 shows the geometric shaft sink values for the three tested bearings.
As shown in Table 5, the 4-pad Flooded Ball & Socket Pivot bearing is characterized by higher values with respect to the two 5-pad solutions due to its higher load angle Θ P .
Another noteworthy aspect is the horizontal shift of the shaft centerline under static load variation observed above 4000 rpm. At that speed, the circumferential Reynolds Number = ρωRcr/μ, where ρ is the mass density, ω the angular speed, R the bearing inner radius, and μ the dynamic viscosity, is higher than the one indicating the onset of turbulence [25]. The adopted formulation is the one used to globally evaluate the bearing flow regime in industrial practice tools. Such a transition affects also other static and dynamic characteristics as reported in the following sections.

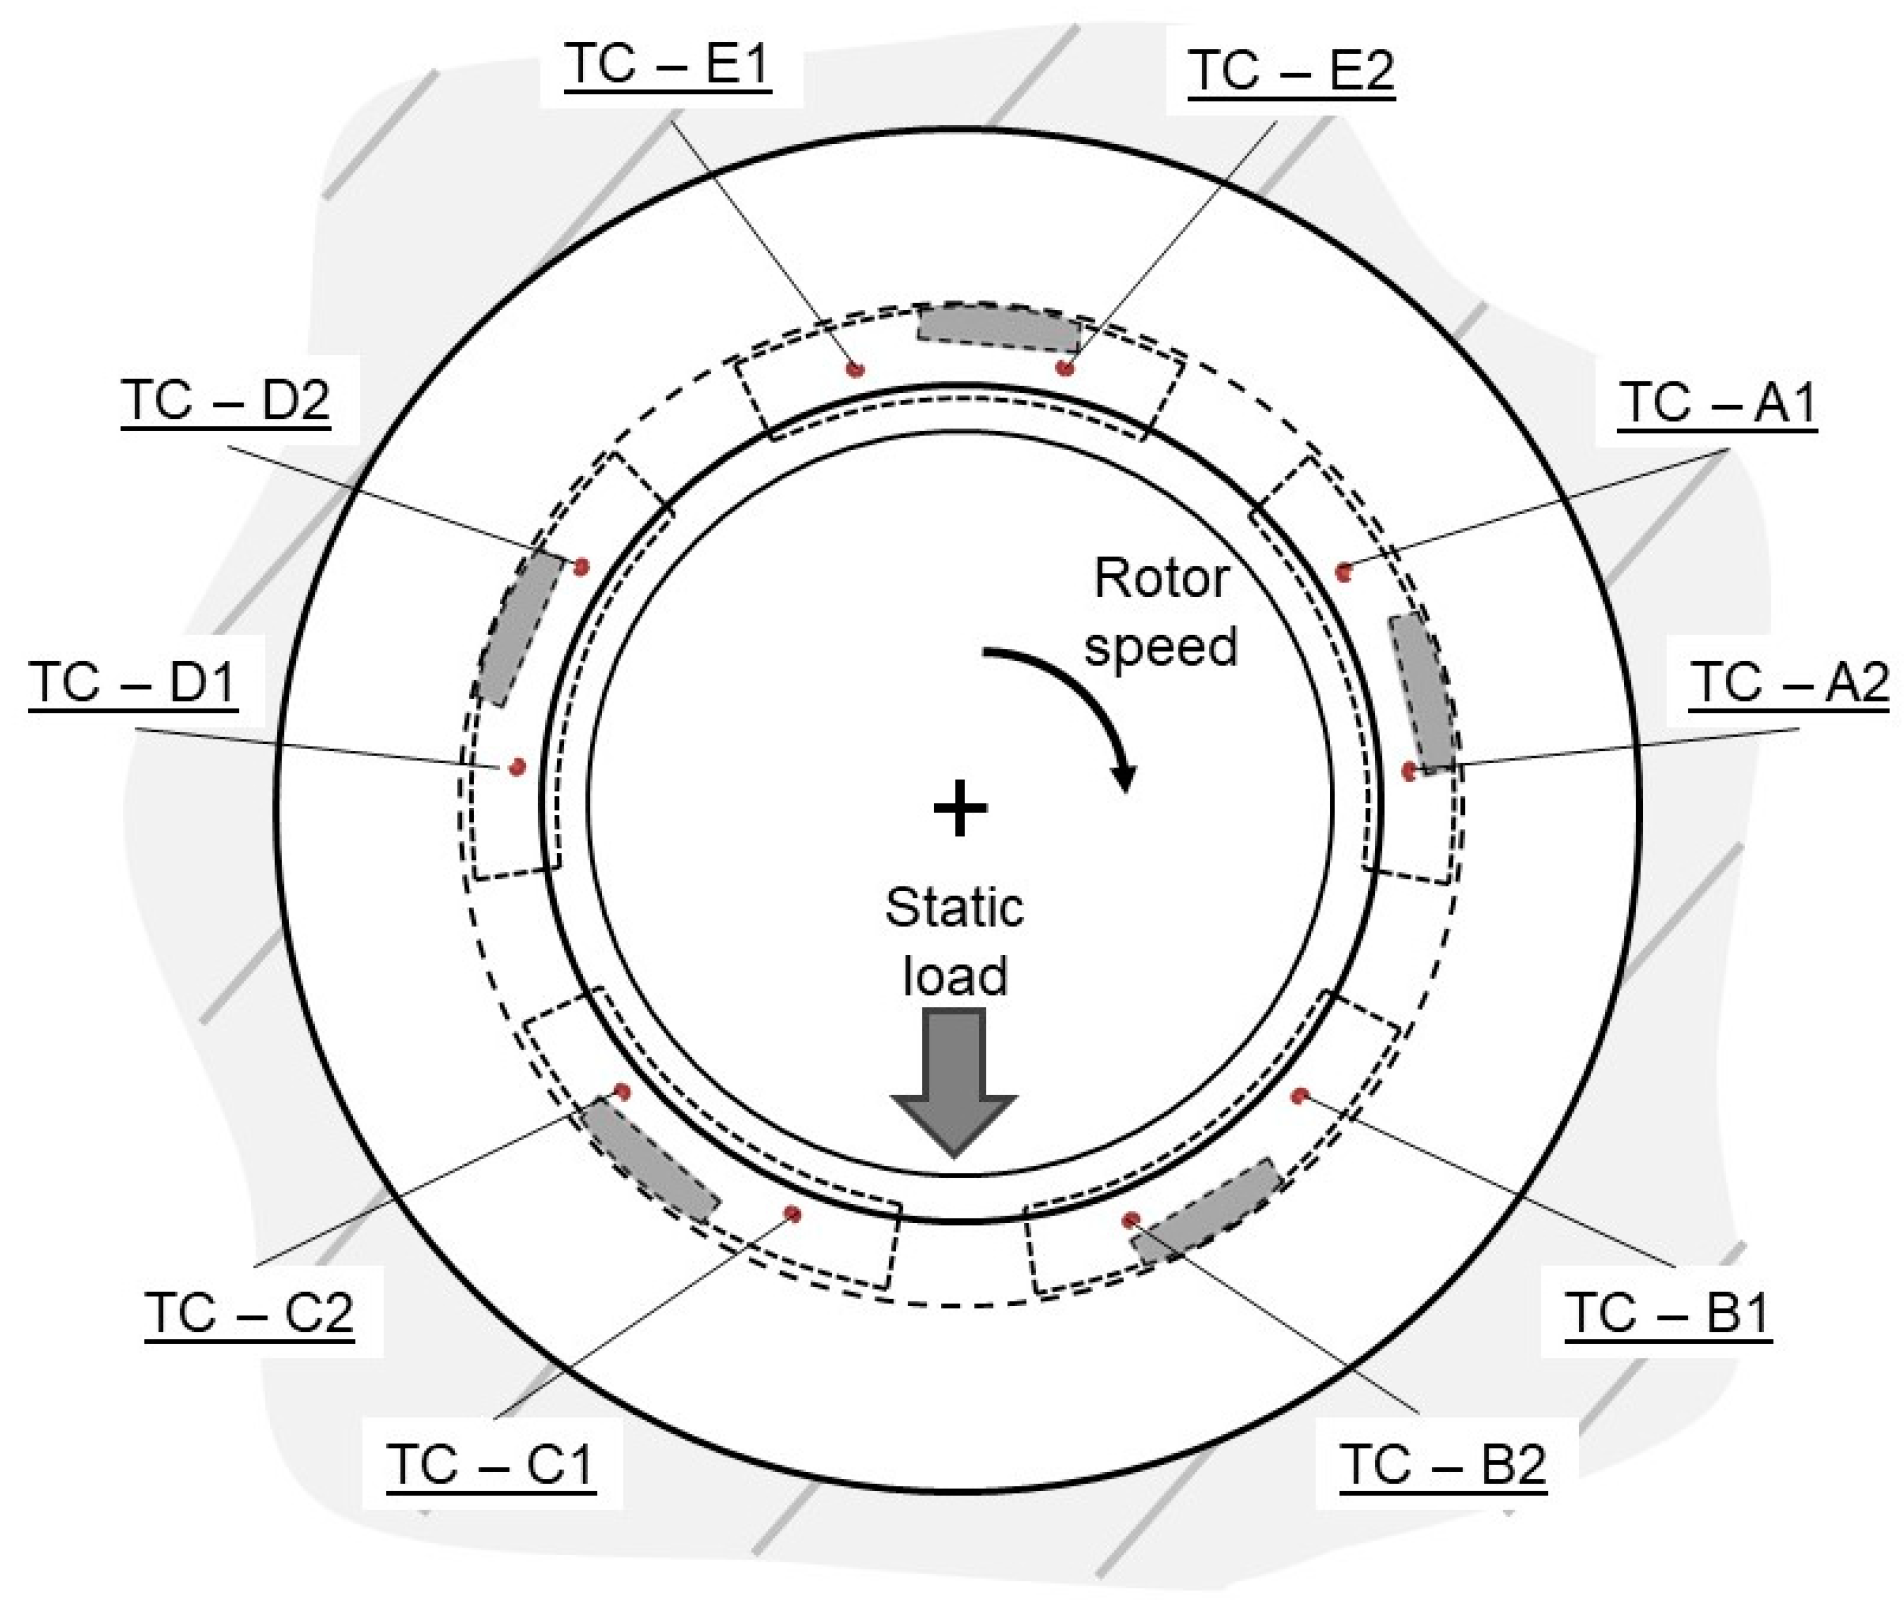
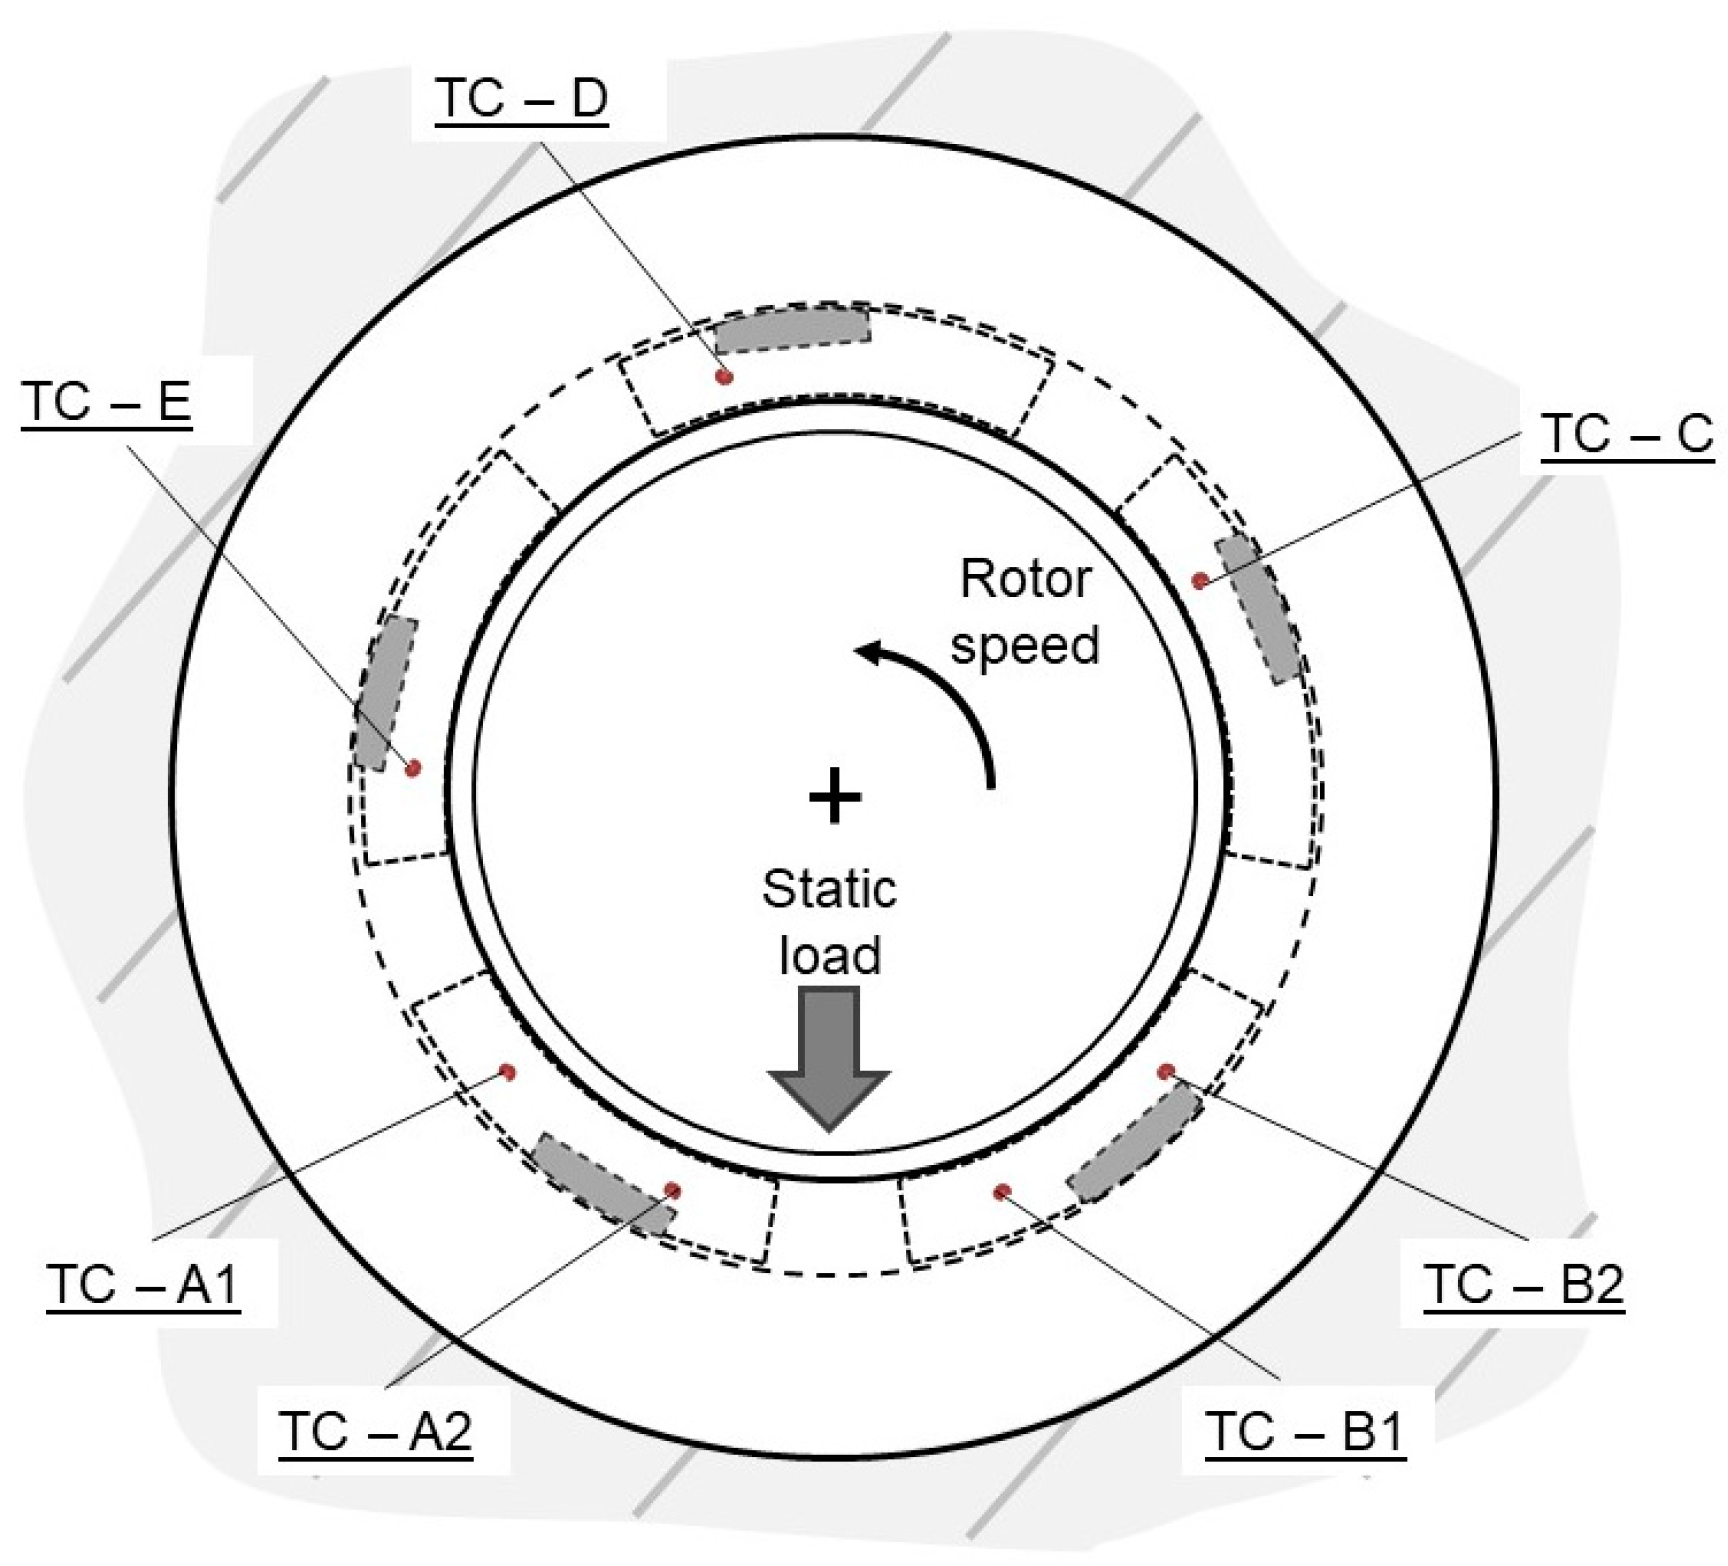
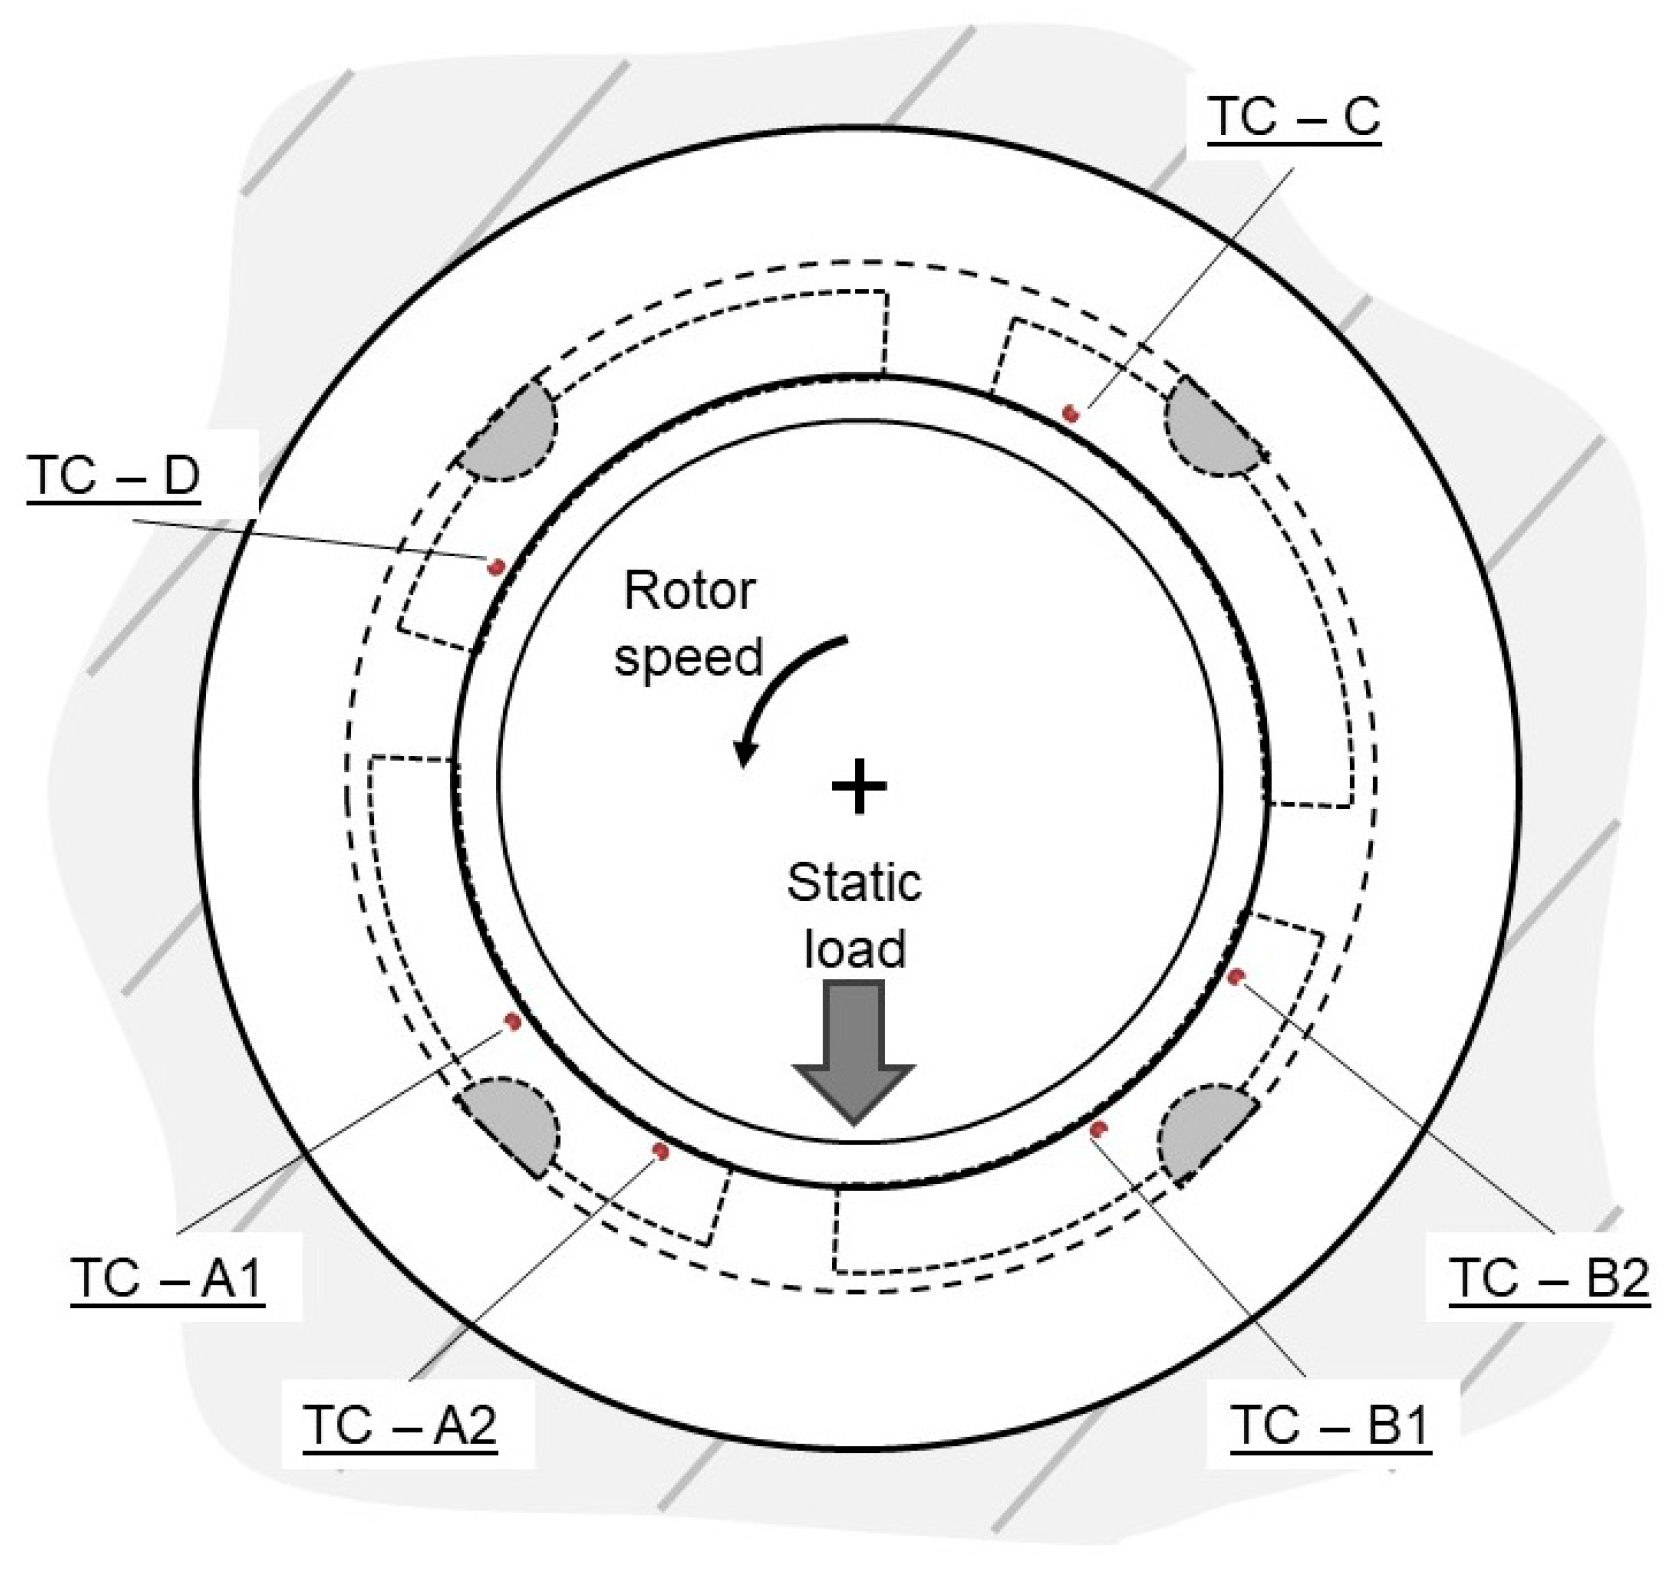
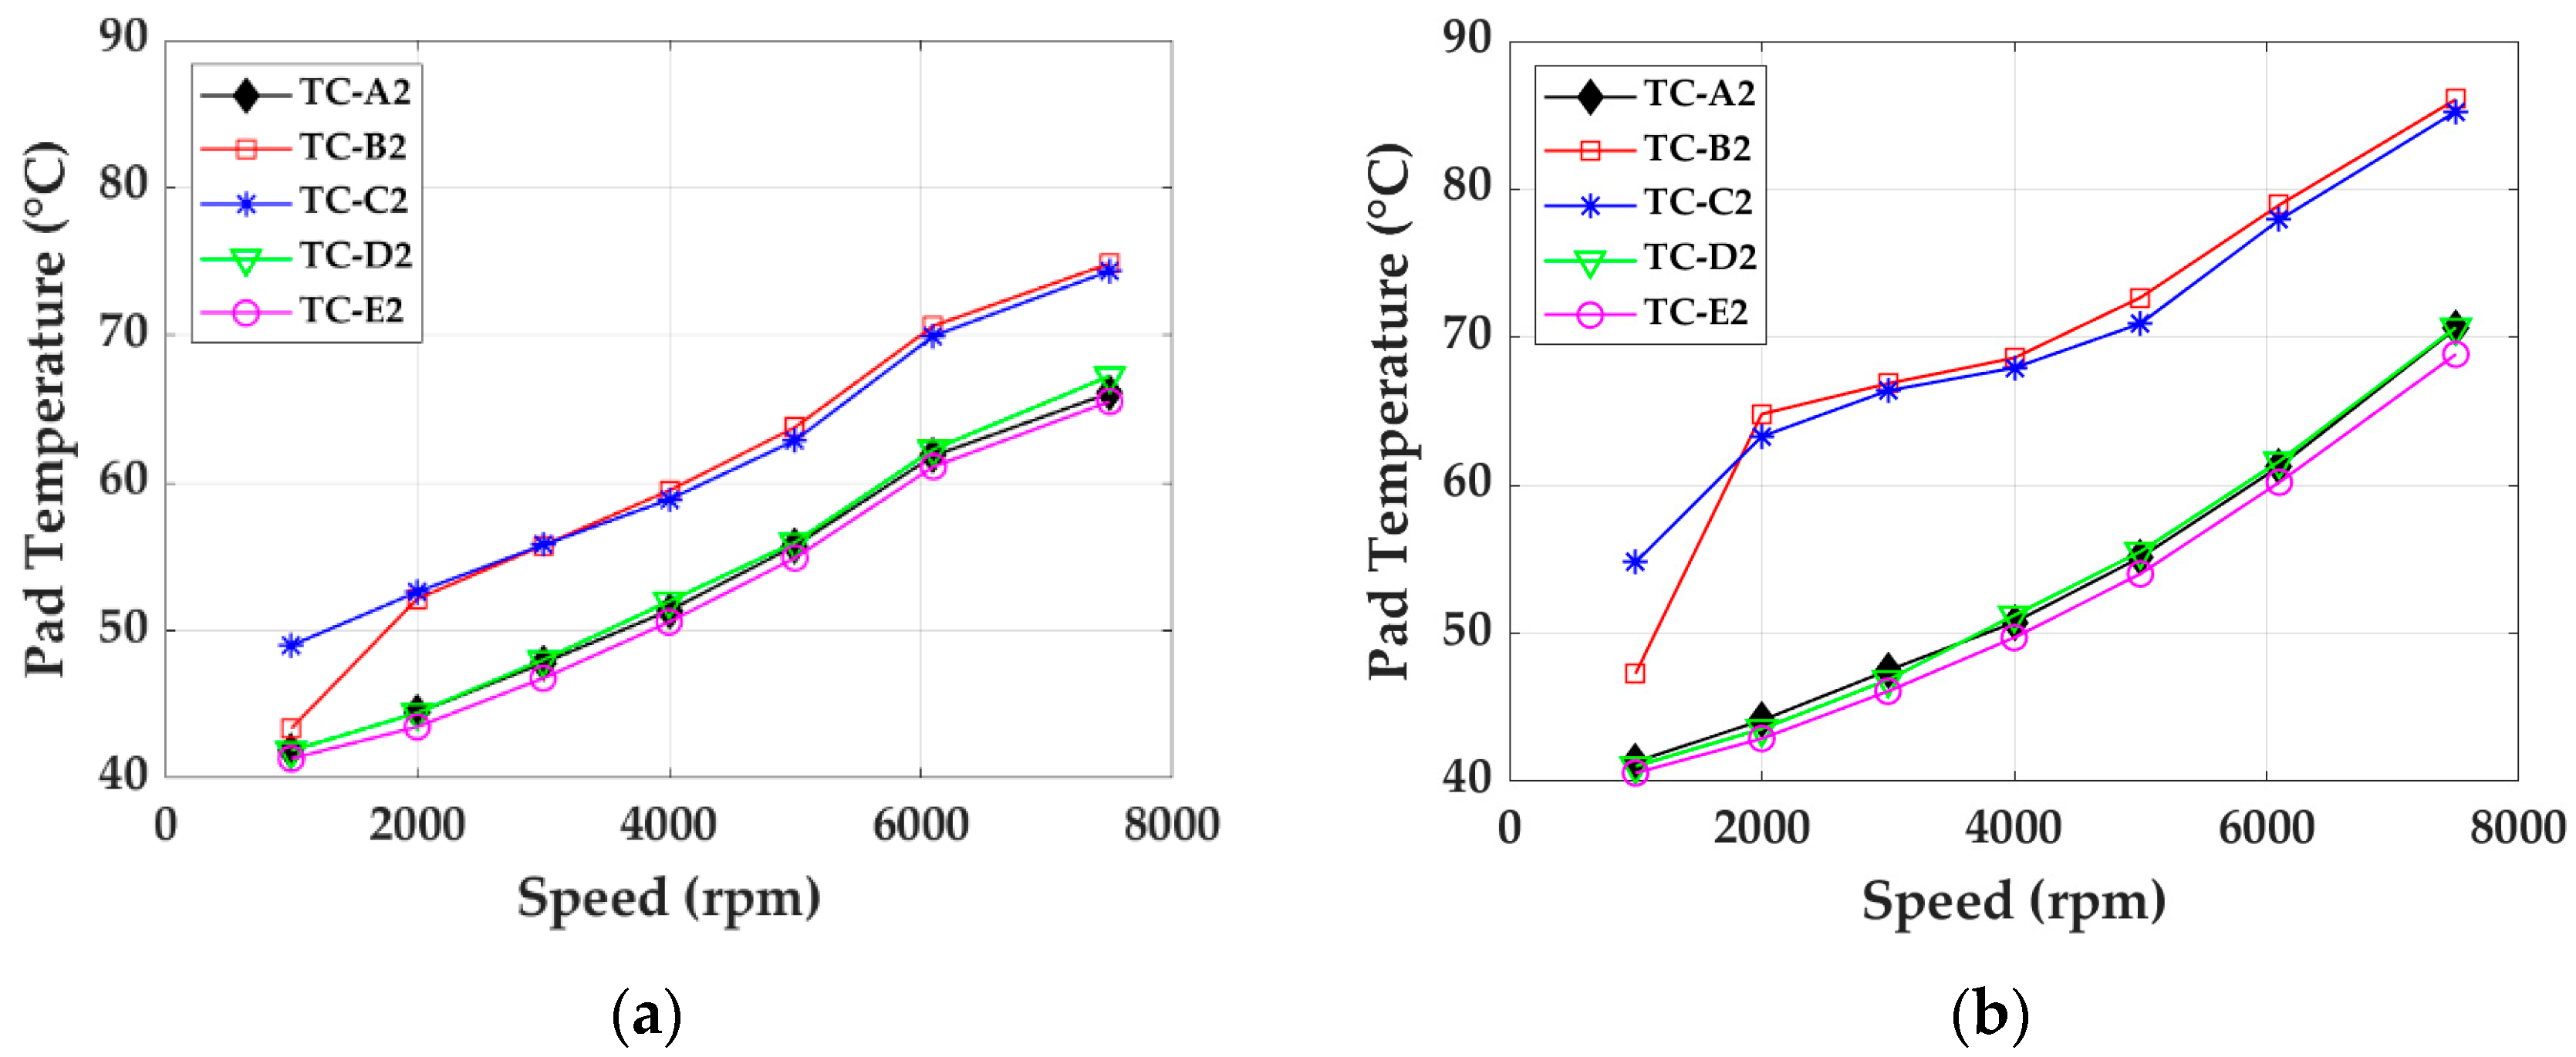
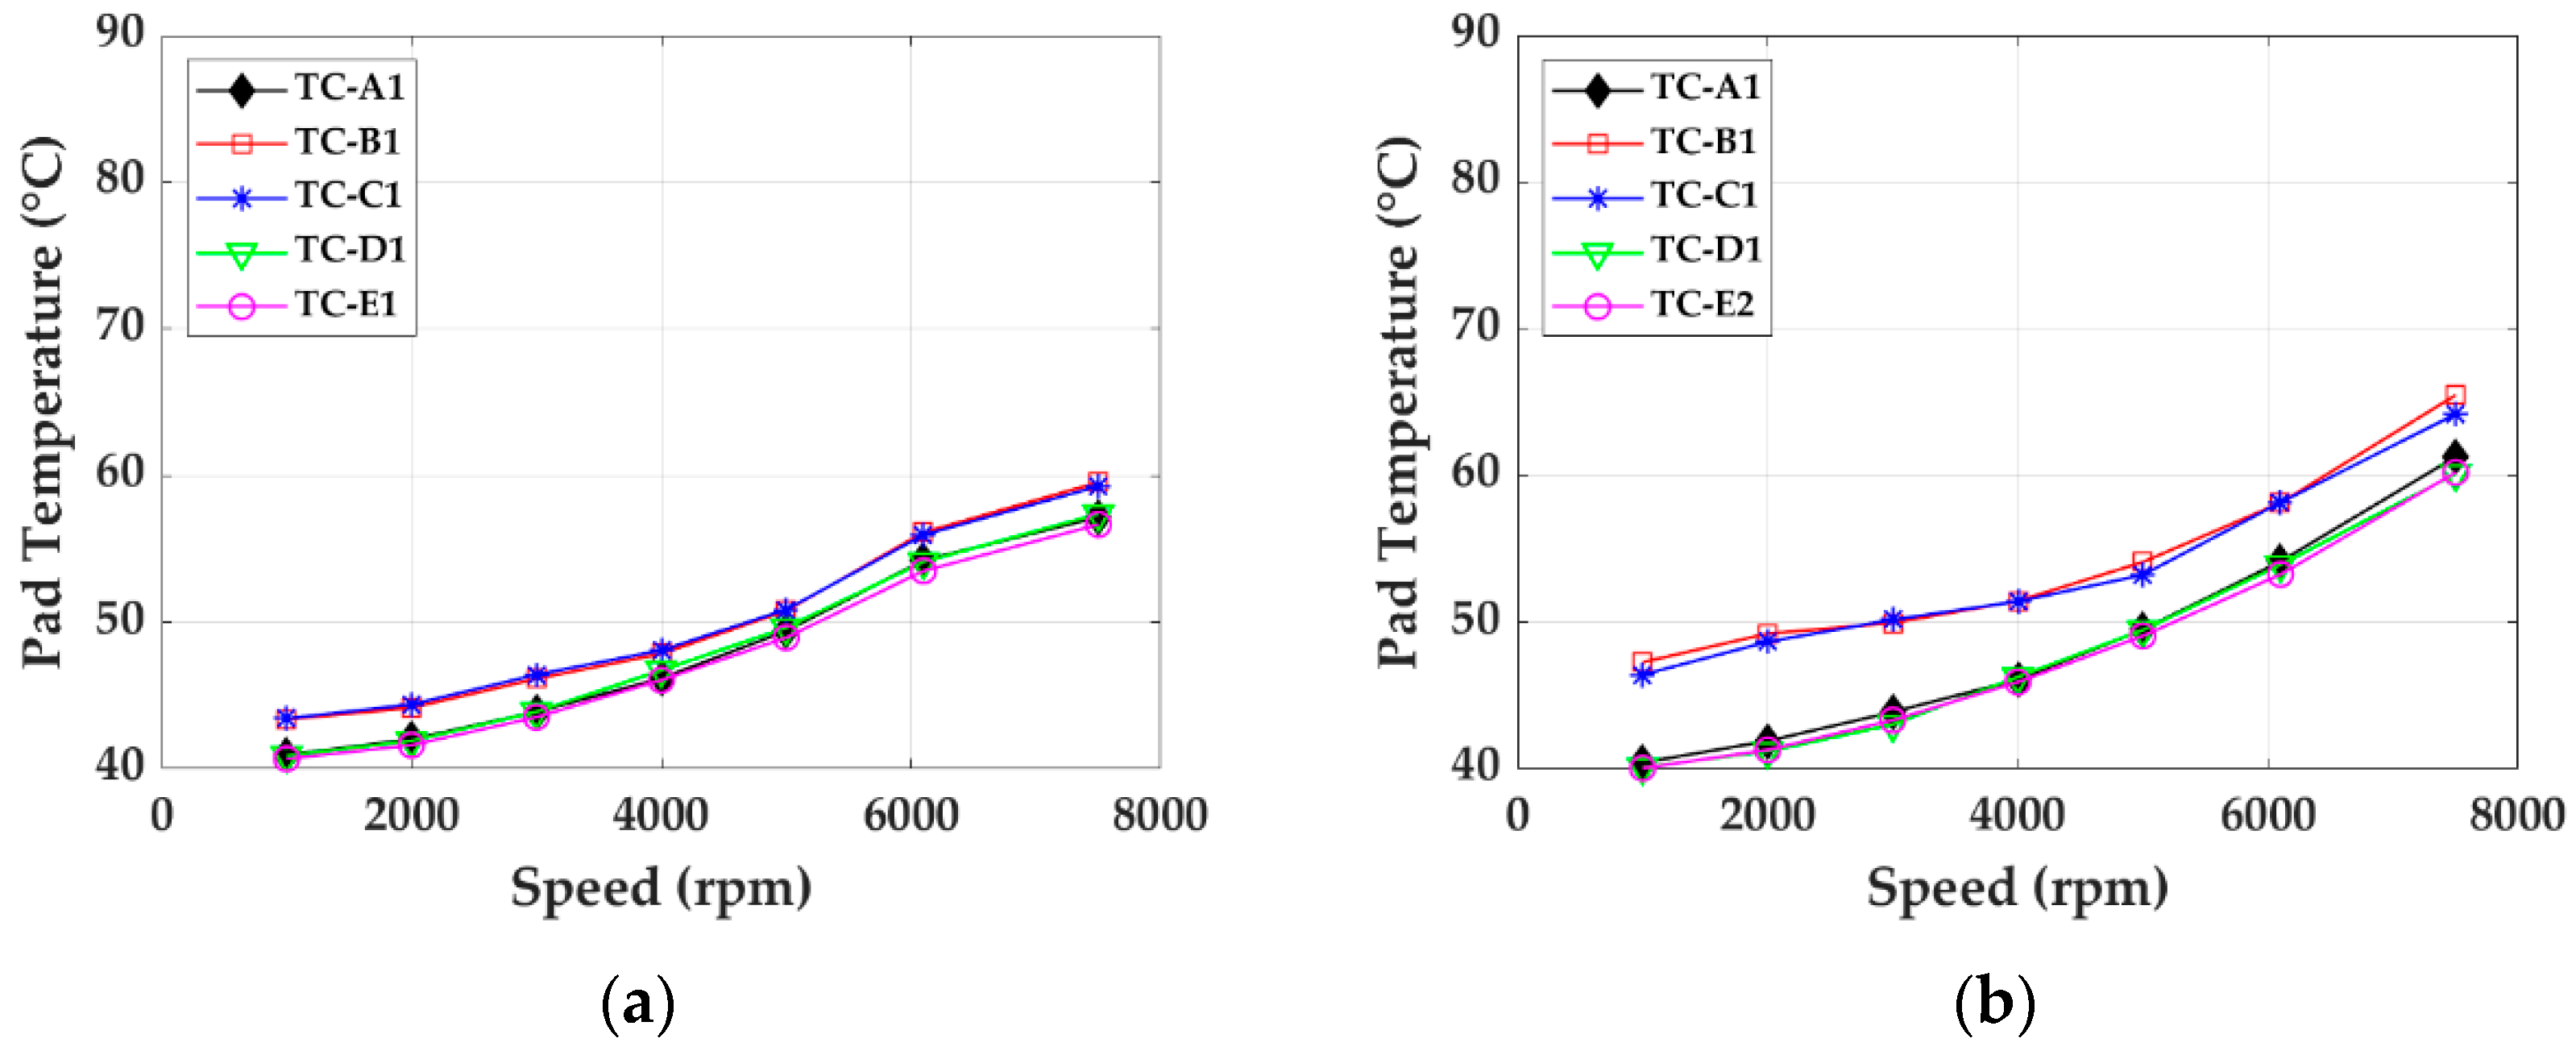
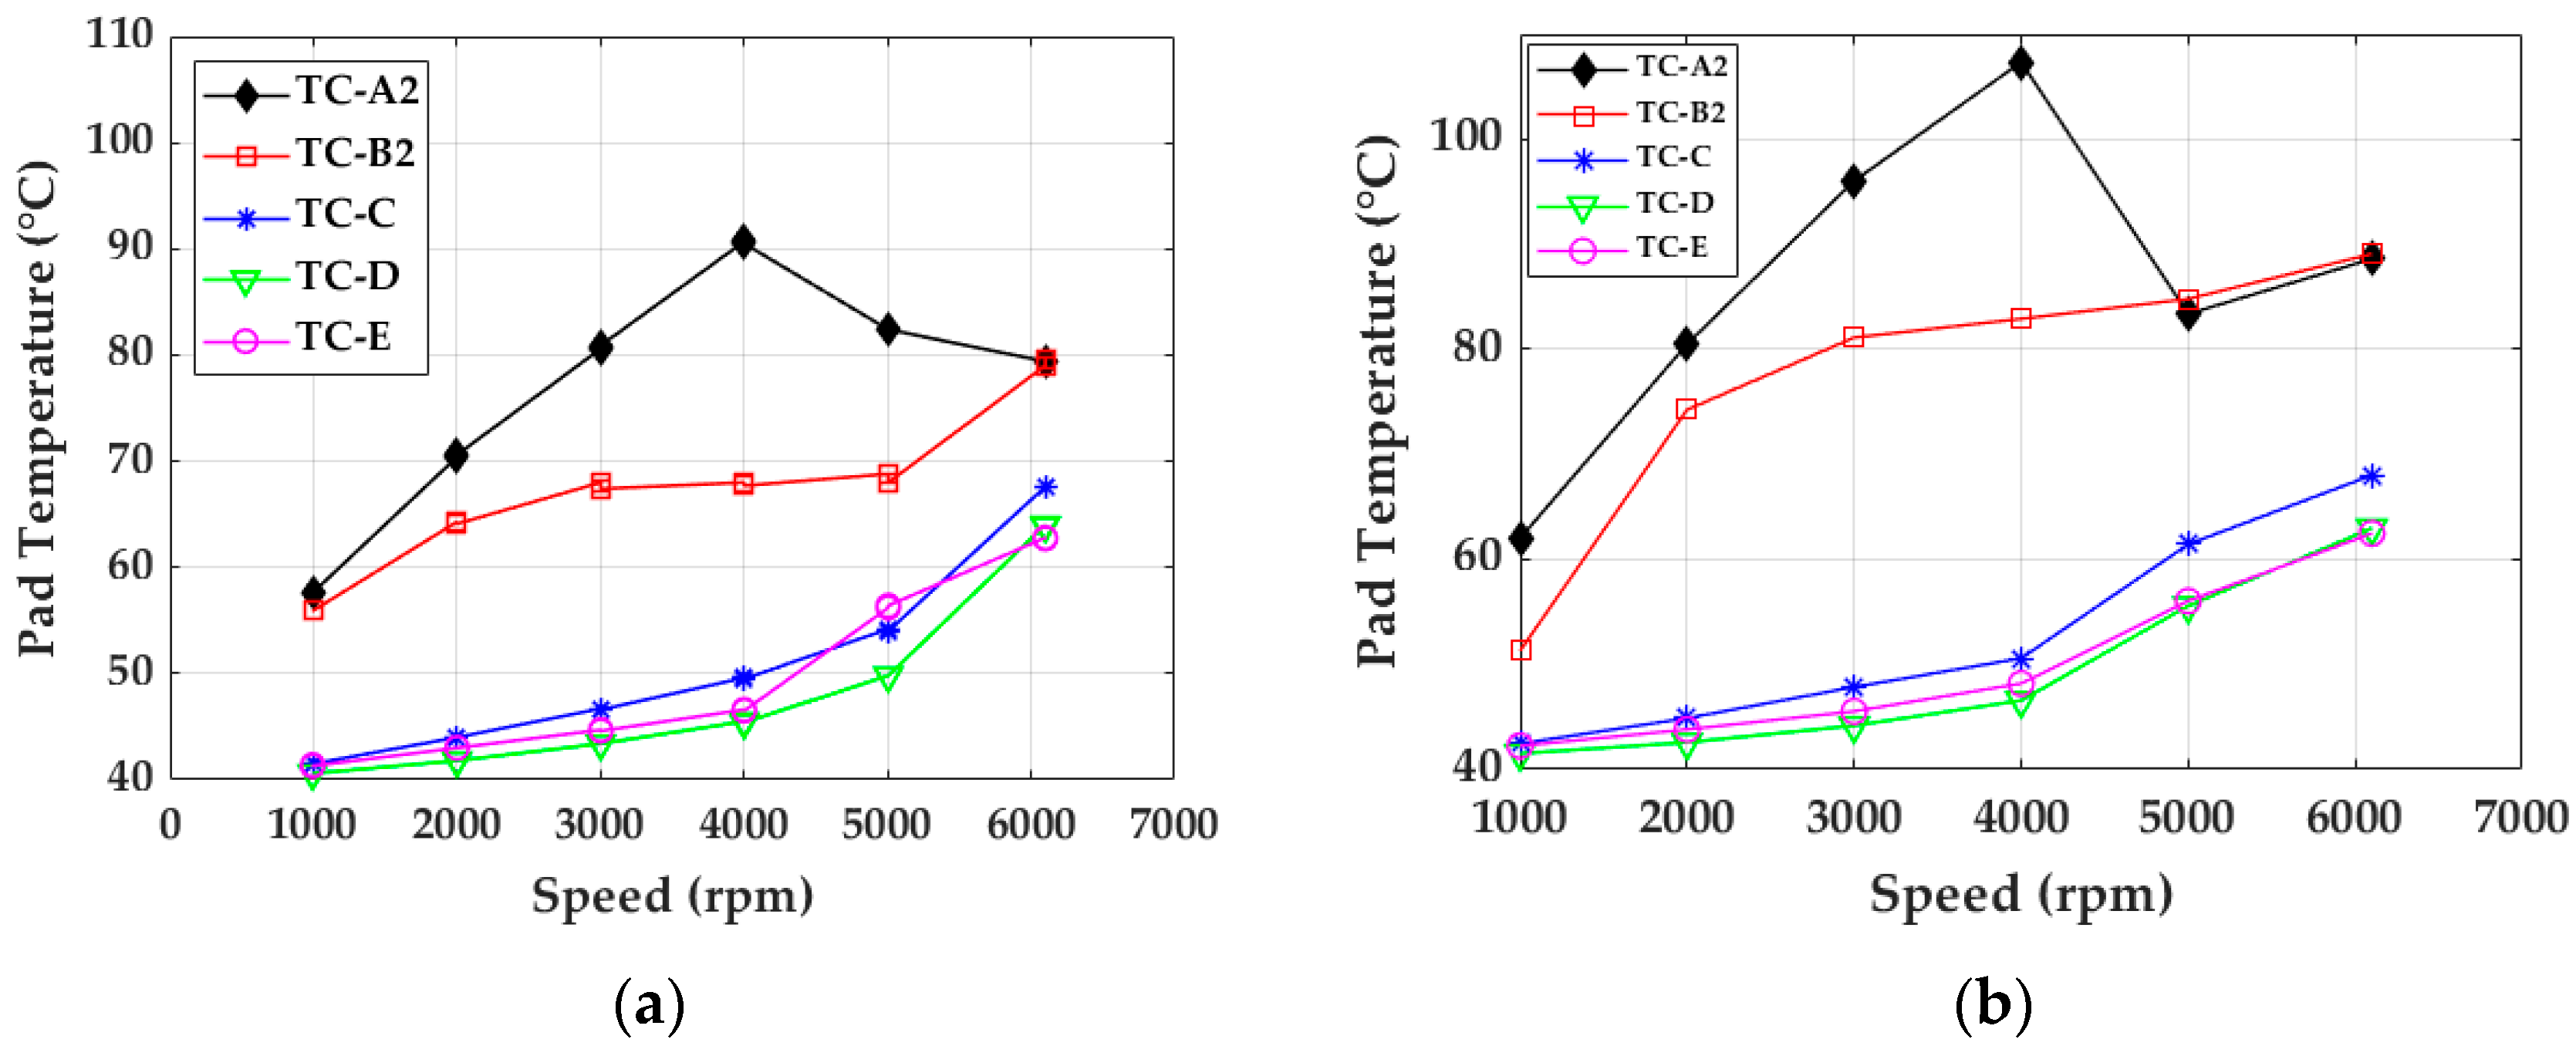
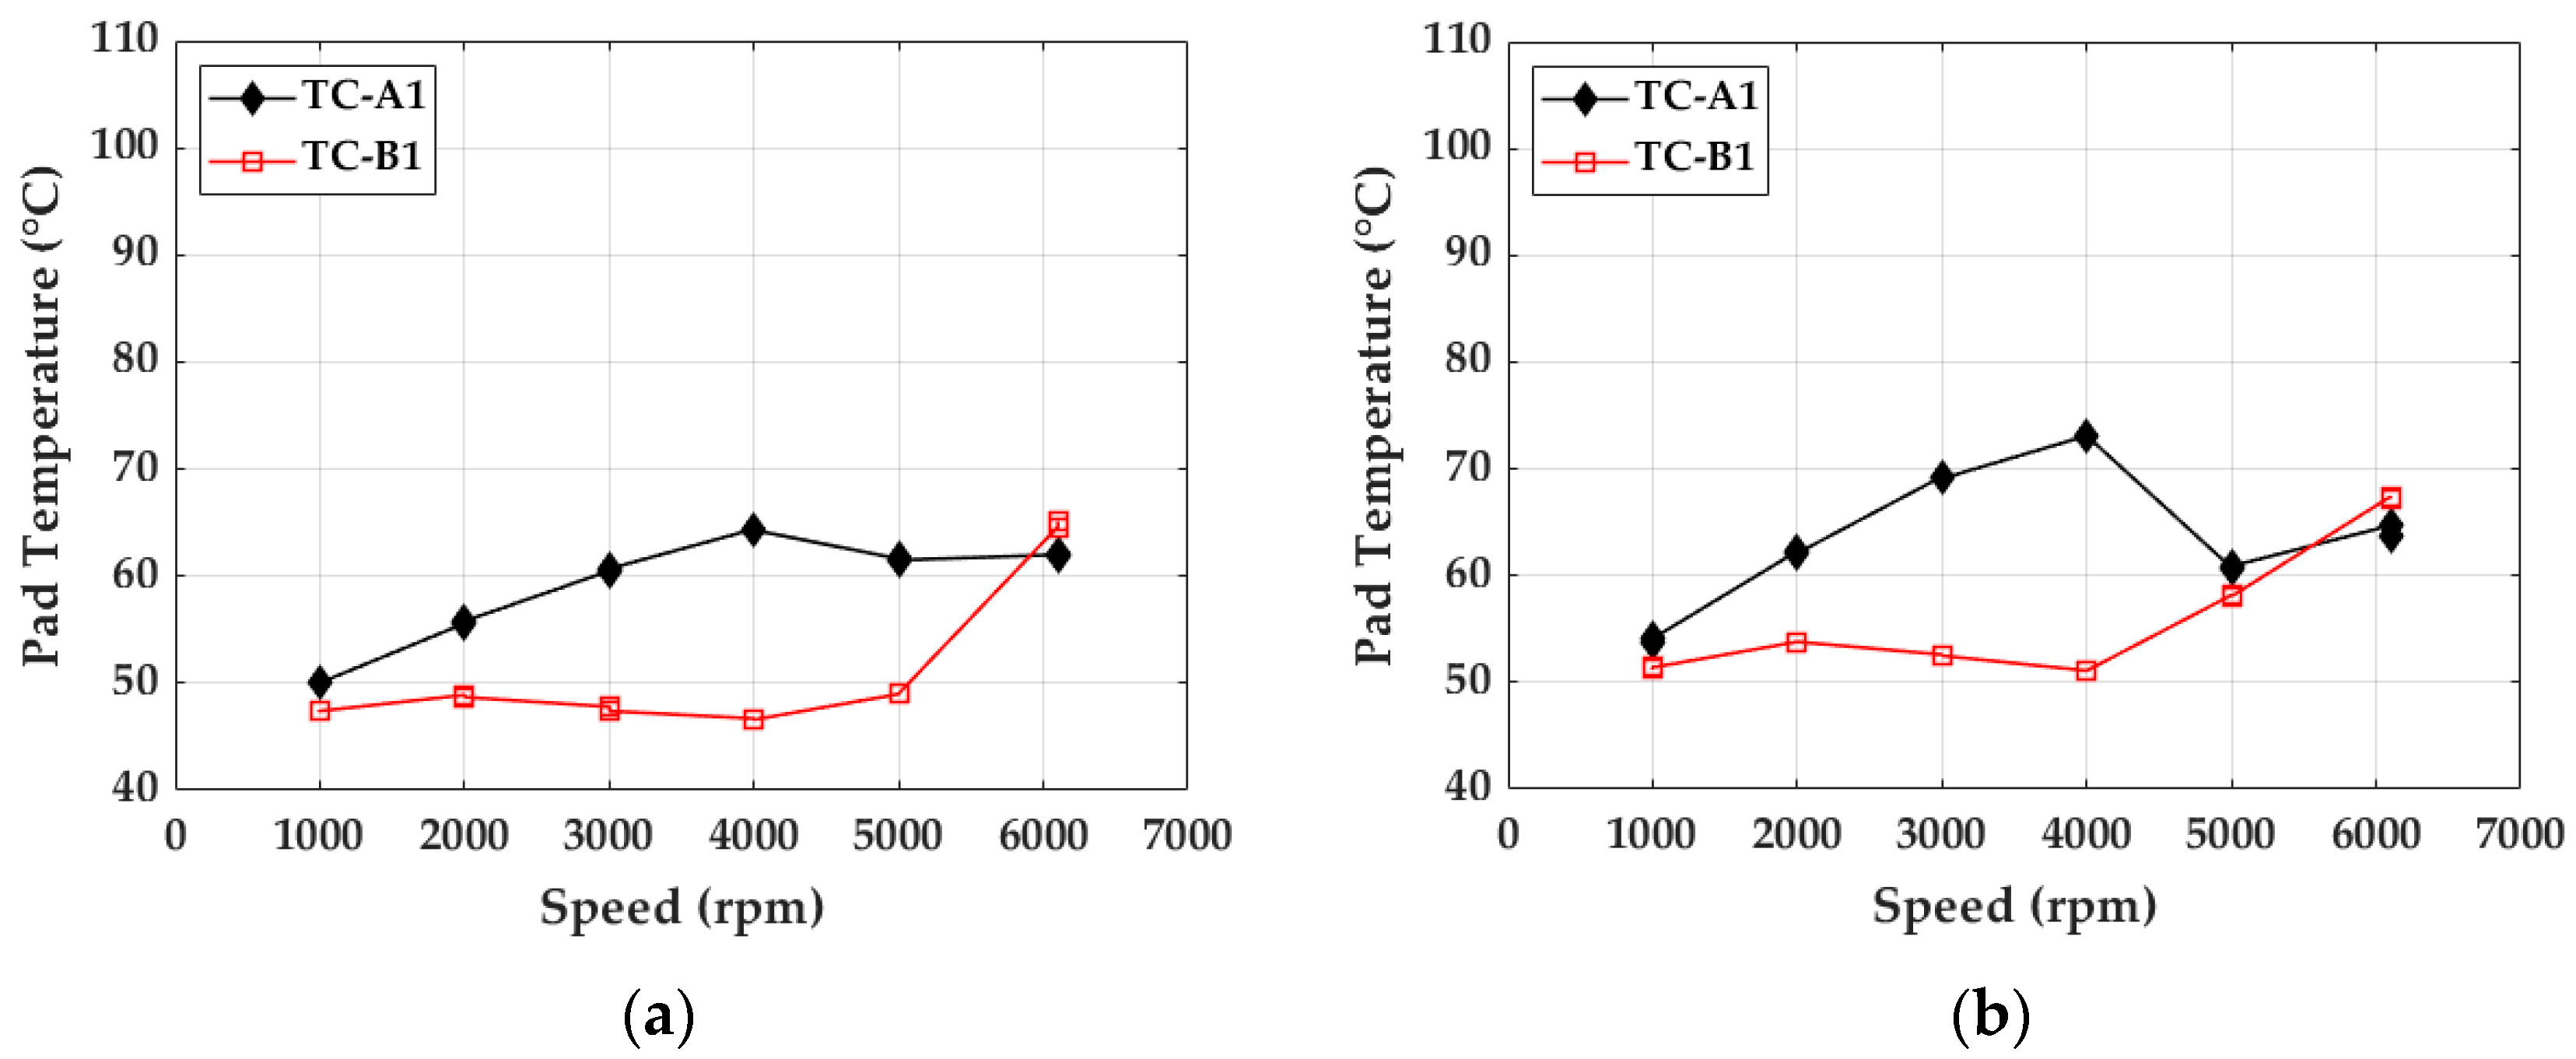
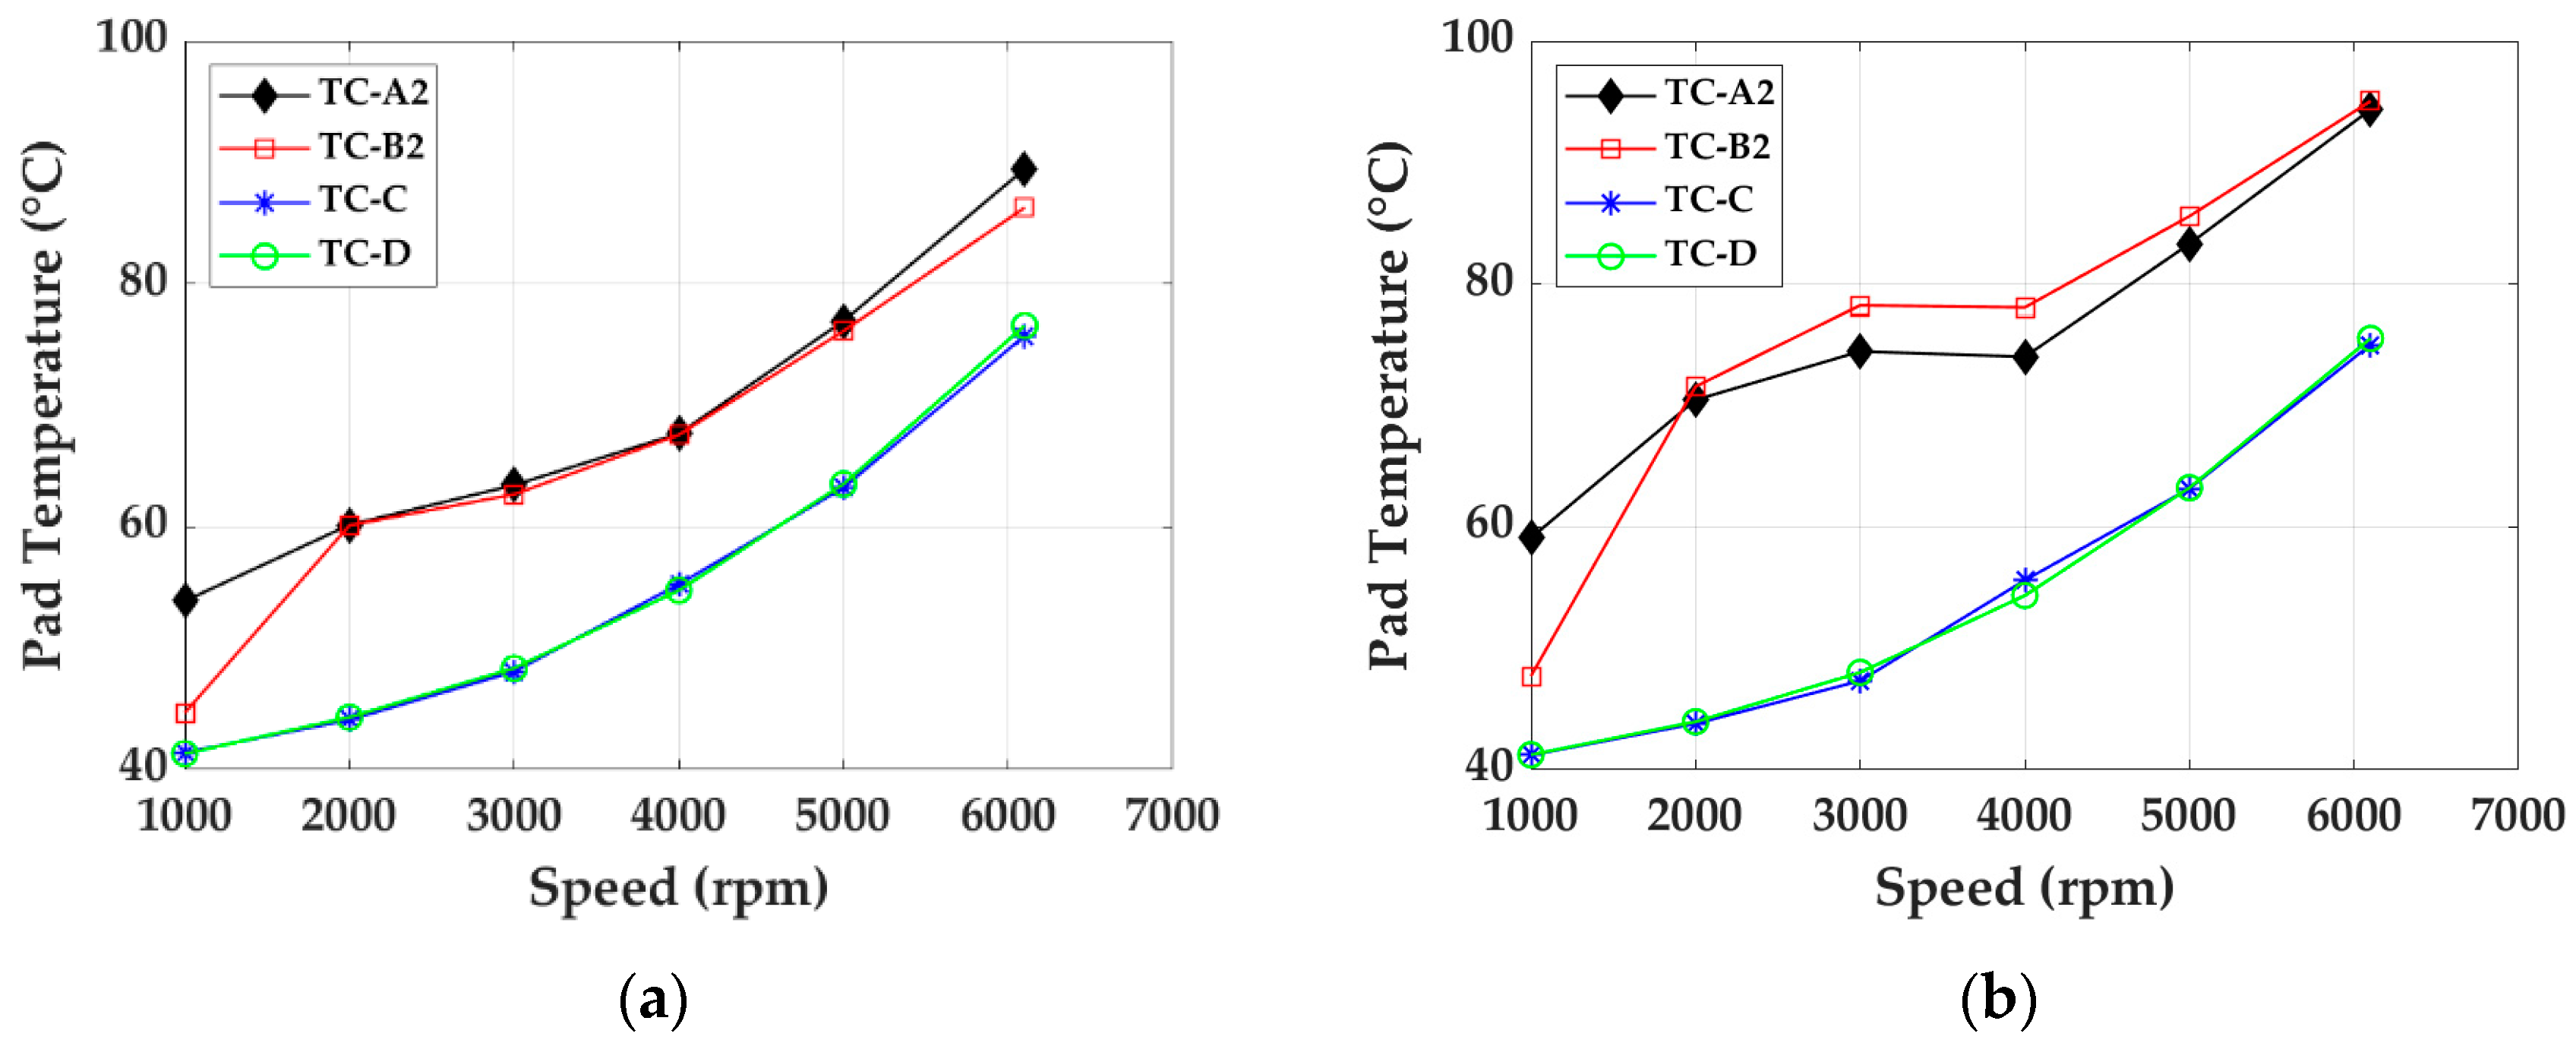
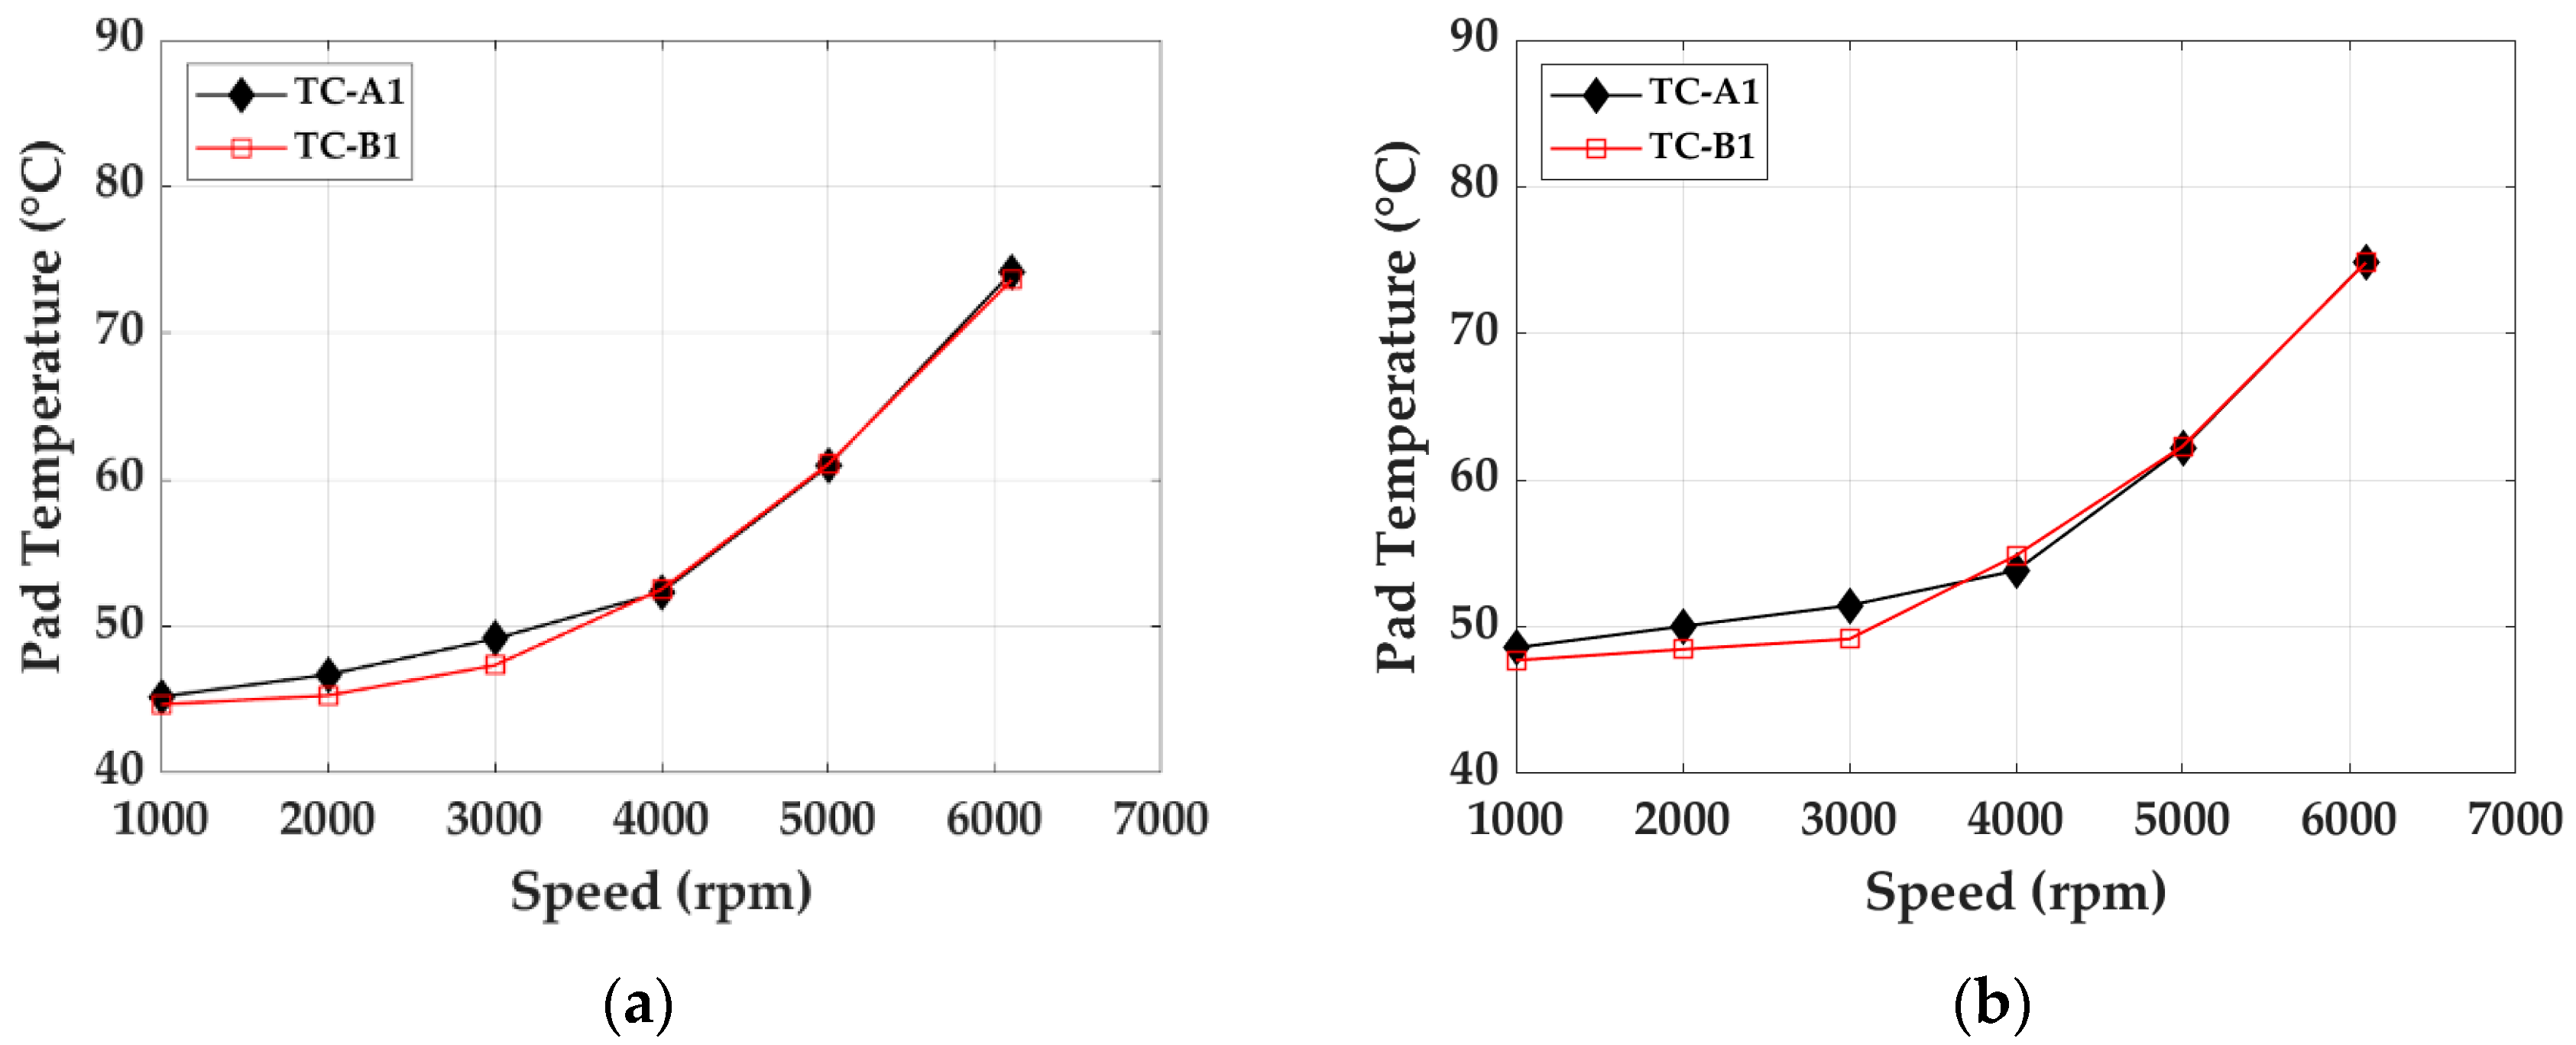
3.1.3. The Pad Temperatures
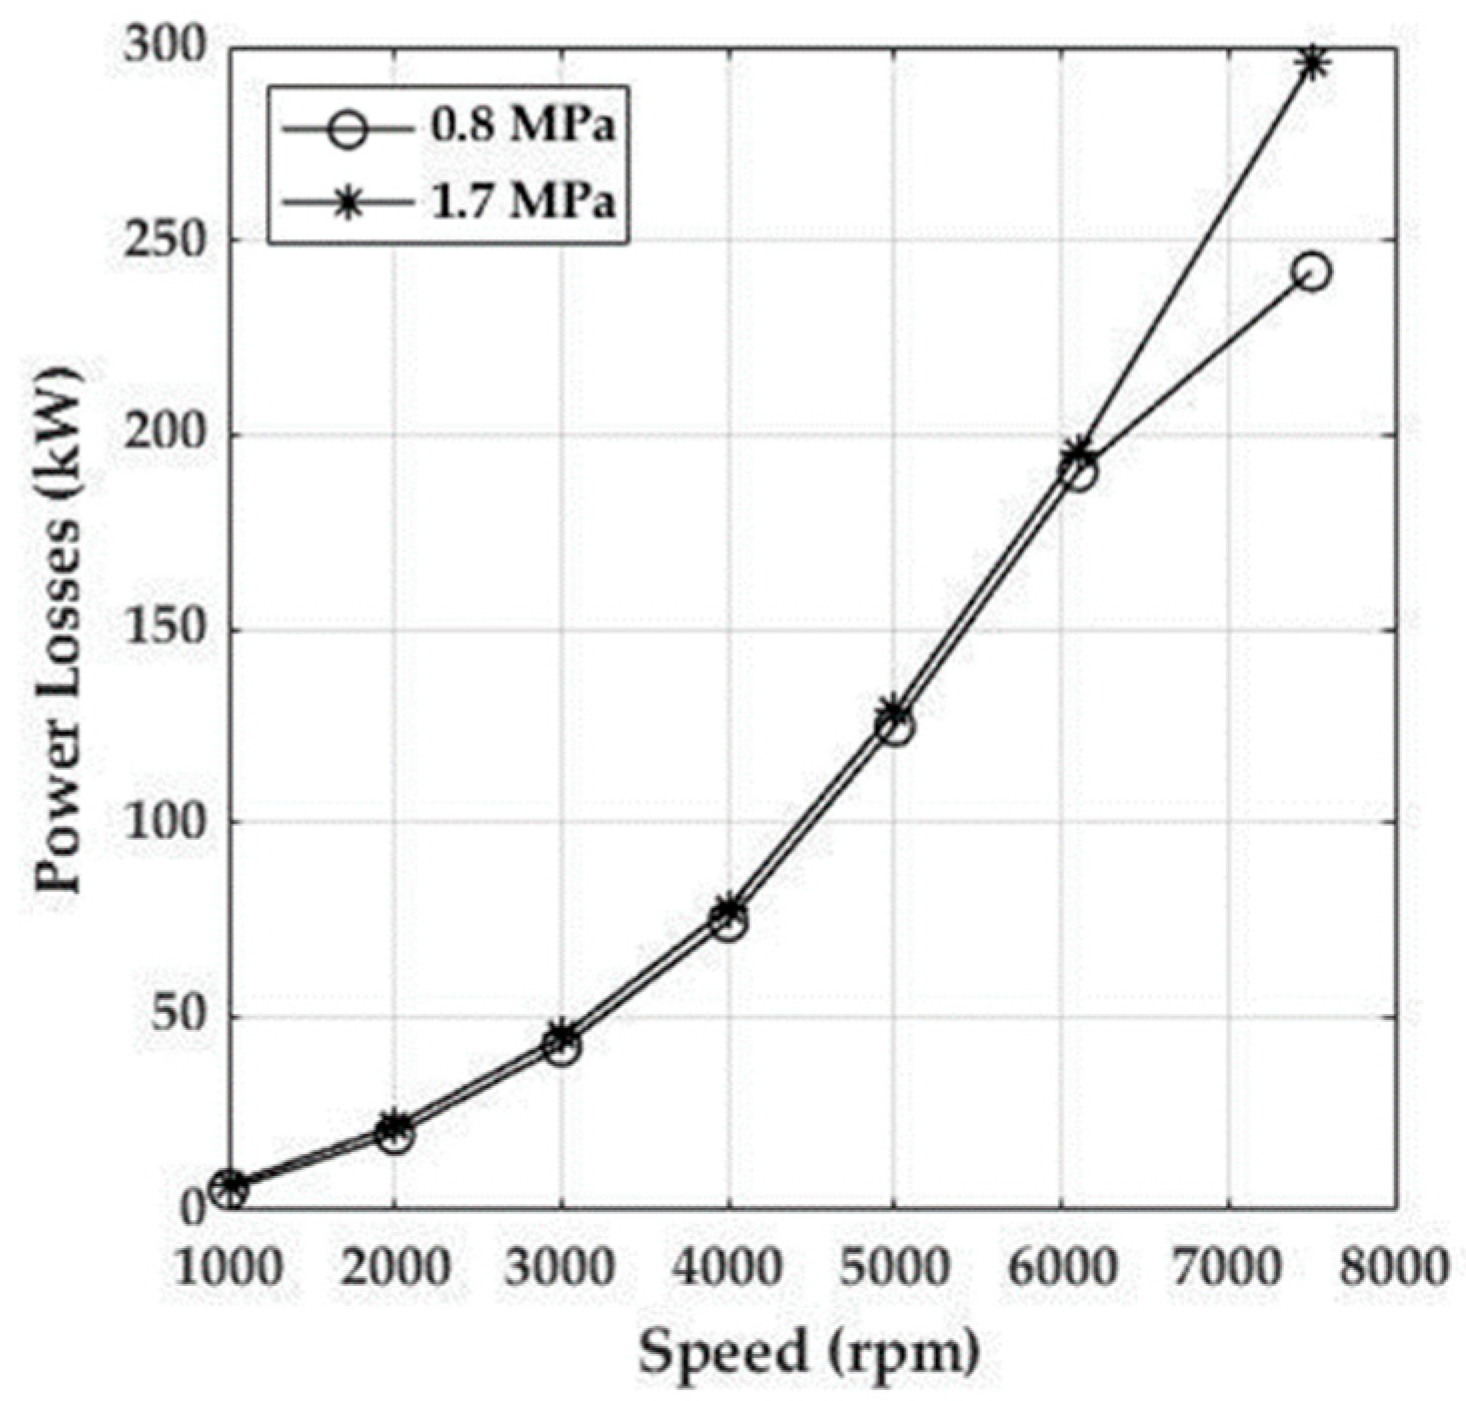
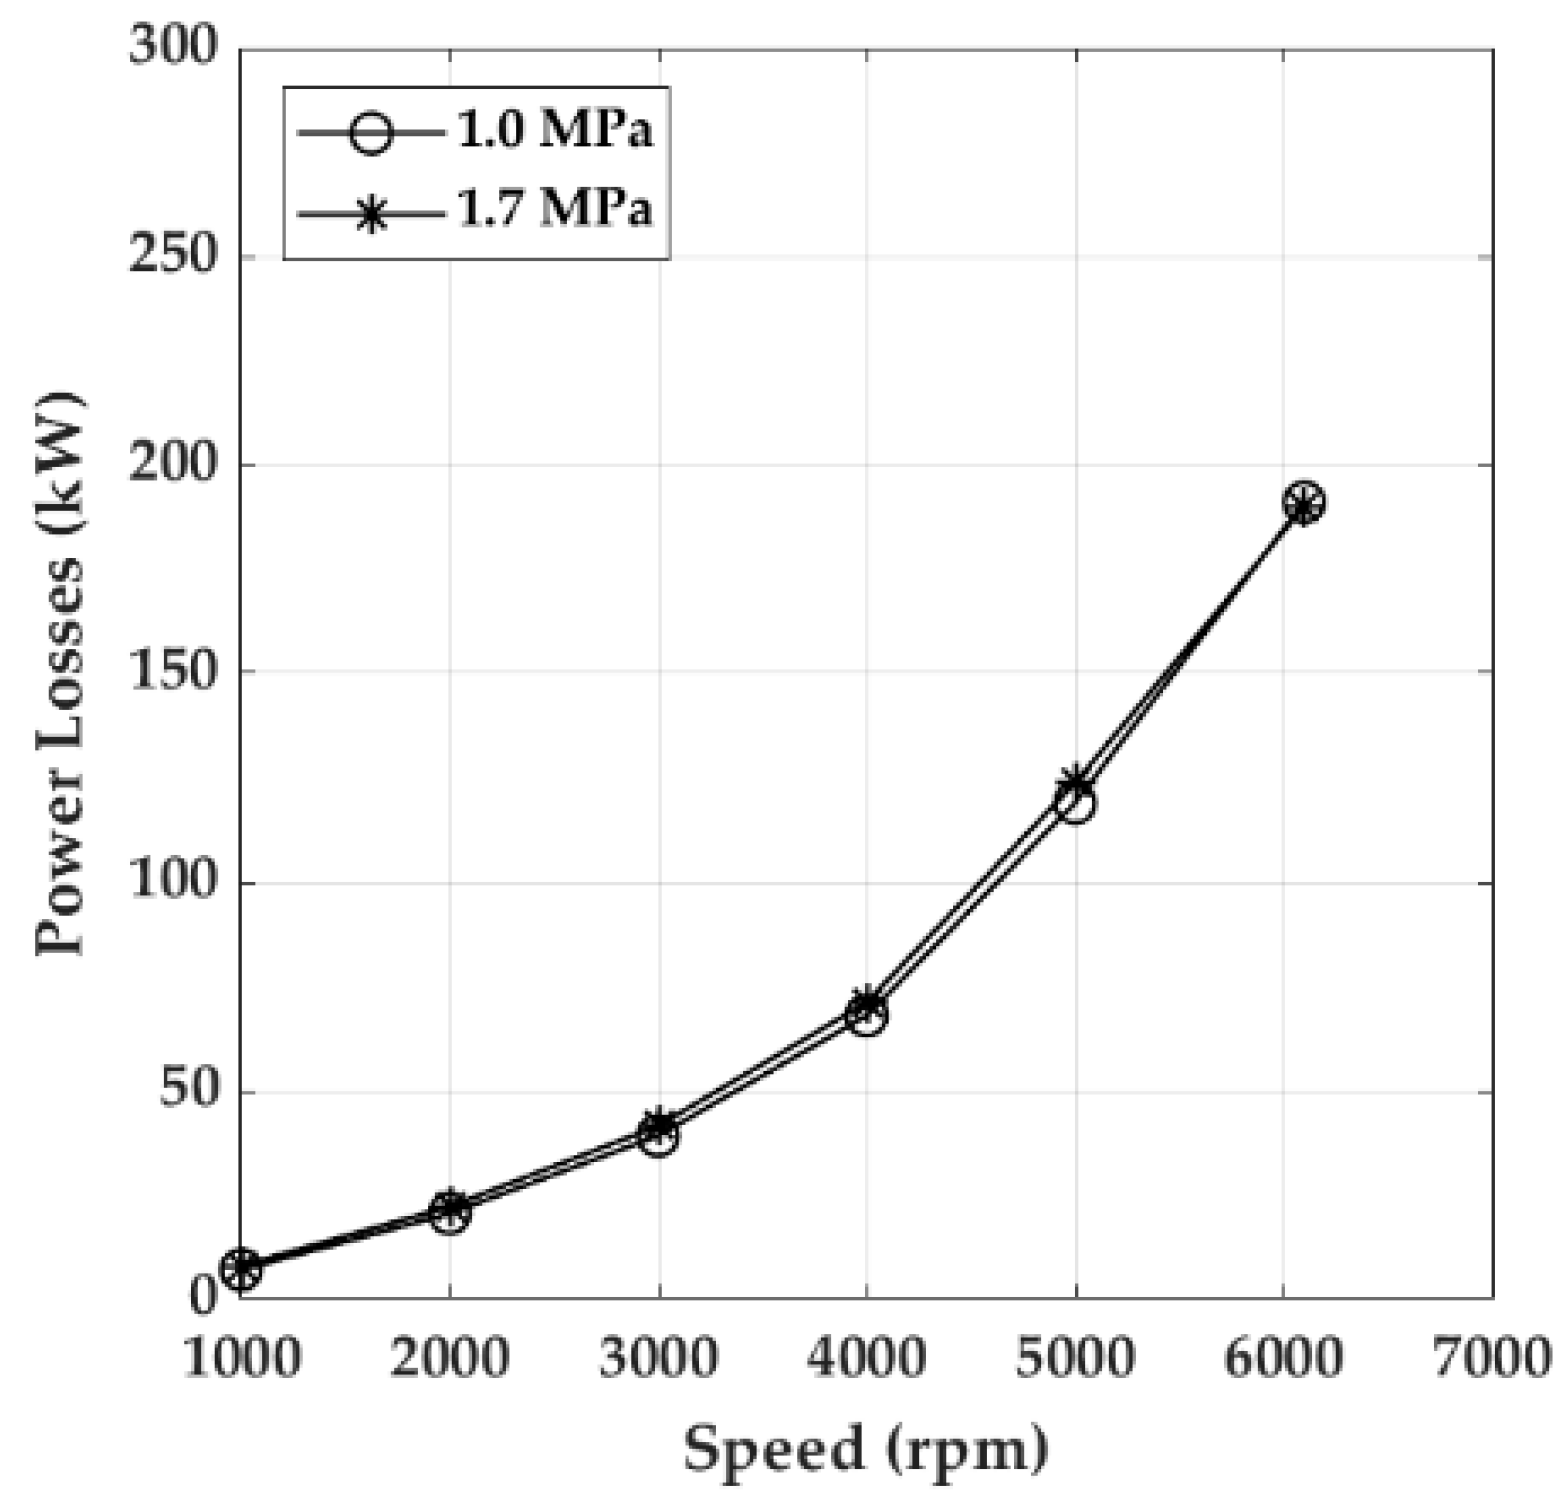
The pad temperatures of the Direct Lube Rocker Pivot bearing (Figure 16 and Figure 17) are characterized by a non-linear trend with speed, with a parabolic trend for the three upper pads and a more complex trend for the two lower loaded pads. The results for the 0.8 and 1.7 MPa tests are shown, respectively, in Figure 16a,b and Figure 17a,b. Refer to Figure 7 for thermocouple position.
For the high load condition, the temperature differences among the loaded and unloaded pads are higher than in the low load case due to the higher eccentricity of the former one. The difference is less marked at 0.25 offset probe locations where the hydrodynamic film is quite far from its minimum thickness point.
Figure 18 and Figure 19 show the pad temperatures of the Flooded Rocker Pivot bearing as function of speed. Refer to Figure 8 for thermocouple position.
For the three upper pads, the temperature increases non-linearly with the speed, with an almost parabolic trend and the static load has a minor impact. The two lower and most loaded pads have more complex trends, markedly different from one another and mainly non-monotonic. Higher temperature values are measured at the higher offset probe locations. Moreover, Pad A exhibits higher temperature at mid-range speeds where the laminar to turbulent transition starts to occur. As the load increases the temperatures of the lower pads increase with a maximum of about 20% for pad A, at the higher offset probe location.
Figure 20 and Figure 21 show the pad temperatures of the Flooded Ball & Socket Pivot bearing as function of speed. Refer to Figure 9 for thermocouple position.
In this case, the pad temperatures increase non-linearly with speed. In low load conditions, the lower pads (Figure 20a) are characterized by almost coincident monotonic trends with speed while in the higher load condition (Figure 20b), the lateral movement of the shaft center towards the right determines higher pad temperature read by the TC-B2 sensor placed in the most loaded pad with respect to the other lower pad. Differences can be neglected for the lower offset probe locations (Figure 21).
The temperatures of the upper pads are almost unaffected by the load intensity (Figure 20).

3.1.4. Power Losses

The mechanical power losses were derived from the measured values of torque and rotational speed. The tested bearing power losses were obtained subtracting the rolling bearings calculated power losses from the mechanical power.
Figure 22 shows the trend of the power losses, respectively, at 0.8 MPa and 1.7 MPa specific bearing load values for the Direct Lube Rocker Pivot bearing. The two power losses curves are characterized by an analogous trend up to 6000 rpm (88 m/s), then for the higher load condition, the curve exhibits another huge increase up to 7800 rpm (about 110 m/s) while for the low load conditions, the slope of the power loss curve is reduced. This particular behavior was not observed in the other test campaigns performed on flooded bearings where the speed did not exceed 6000 rpm and the main factor determining the power losses values was only the rotor speed with negligible differences between different load conditions (Figure 23 and Figure 24). In the latter cases the power losses increase with the speed can be observed, and no deviations are visible in respect to the exponential trend as we can expect in normal operating conditions.
The power losses of the Flooded Rocker Pivot bearing are lower than the Direct Lube Rocker Pivot ones, with the difference increasing with speed, because of the lower L/D ratio of the former bearing.
The power losses of the Flooded Ball & Socket Pivot bearing are similar to the Direct Lube Rocker Pivot bearing ones, which have the same L/D ratio, even if the number of pads and applied loads are different.
In general, the tests have indicated a negligible influence of load on the power losses except for very high speeds, where turbulence effects have been observed, and a high load condition, as shown by the Flooded Rocker Pivot.

3.2. Dynamic Performance

In the present section, the dynamics results are shown in terms of asynchronous and synchronous coefficient.

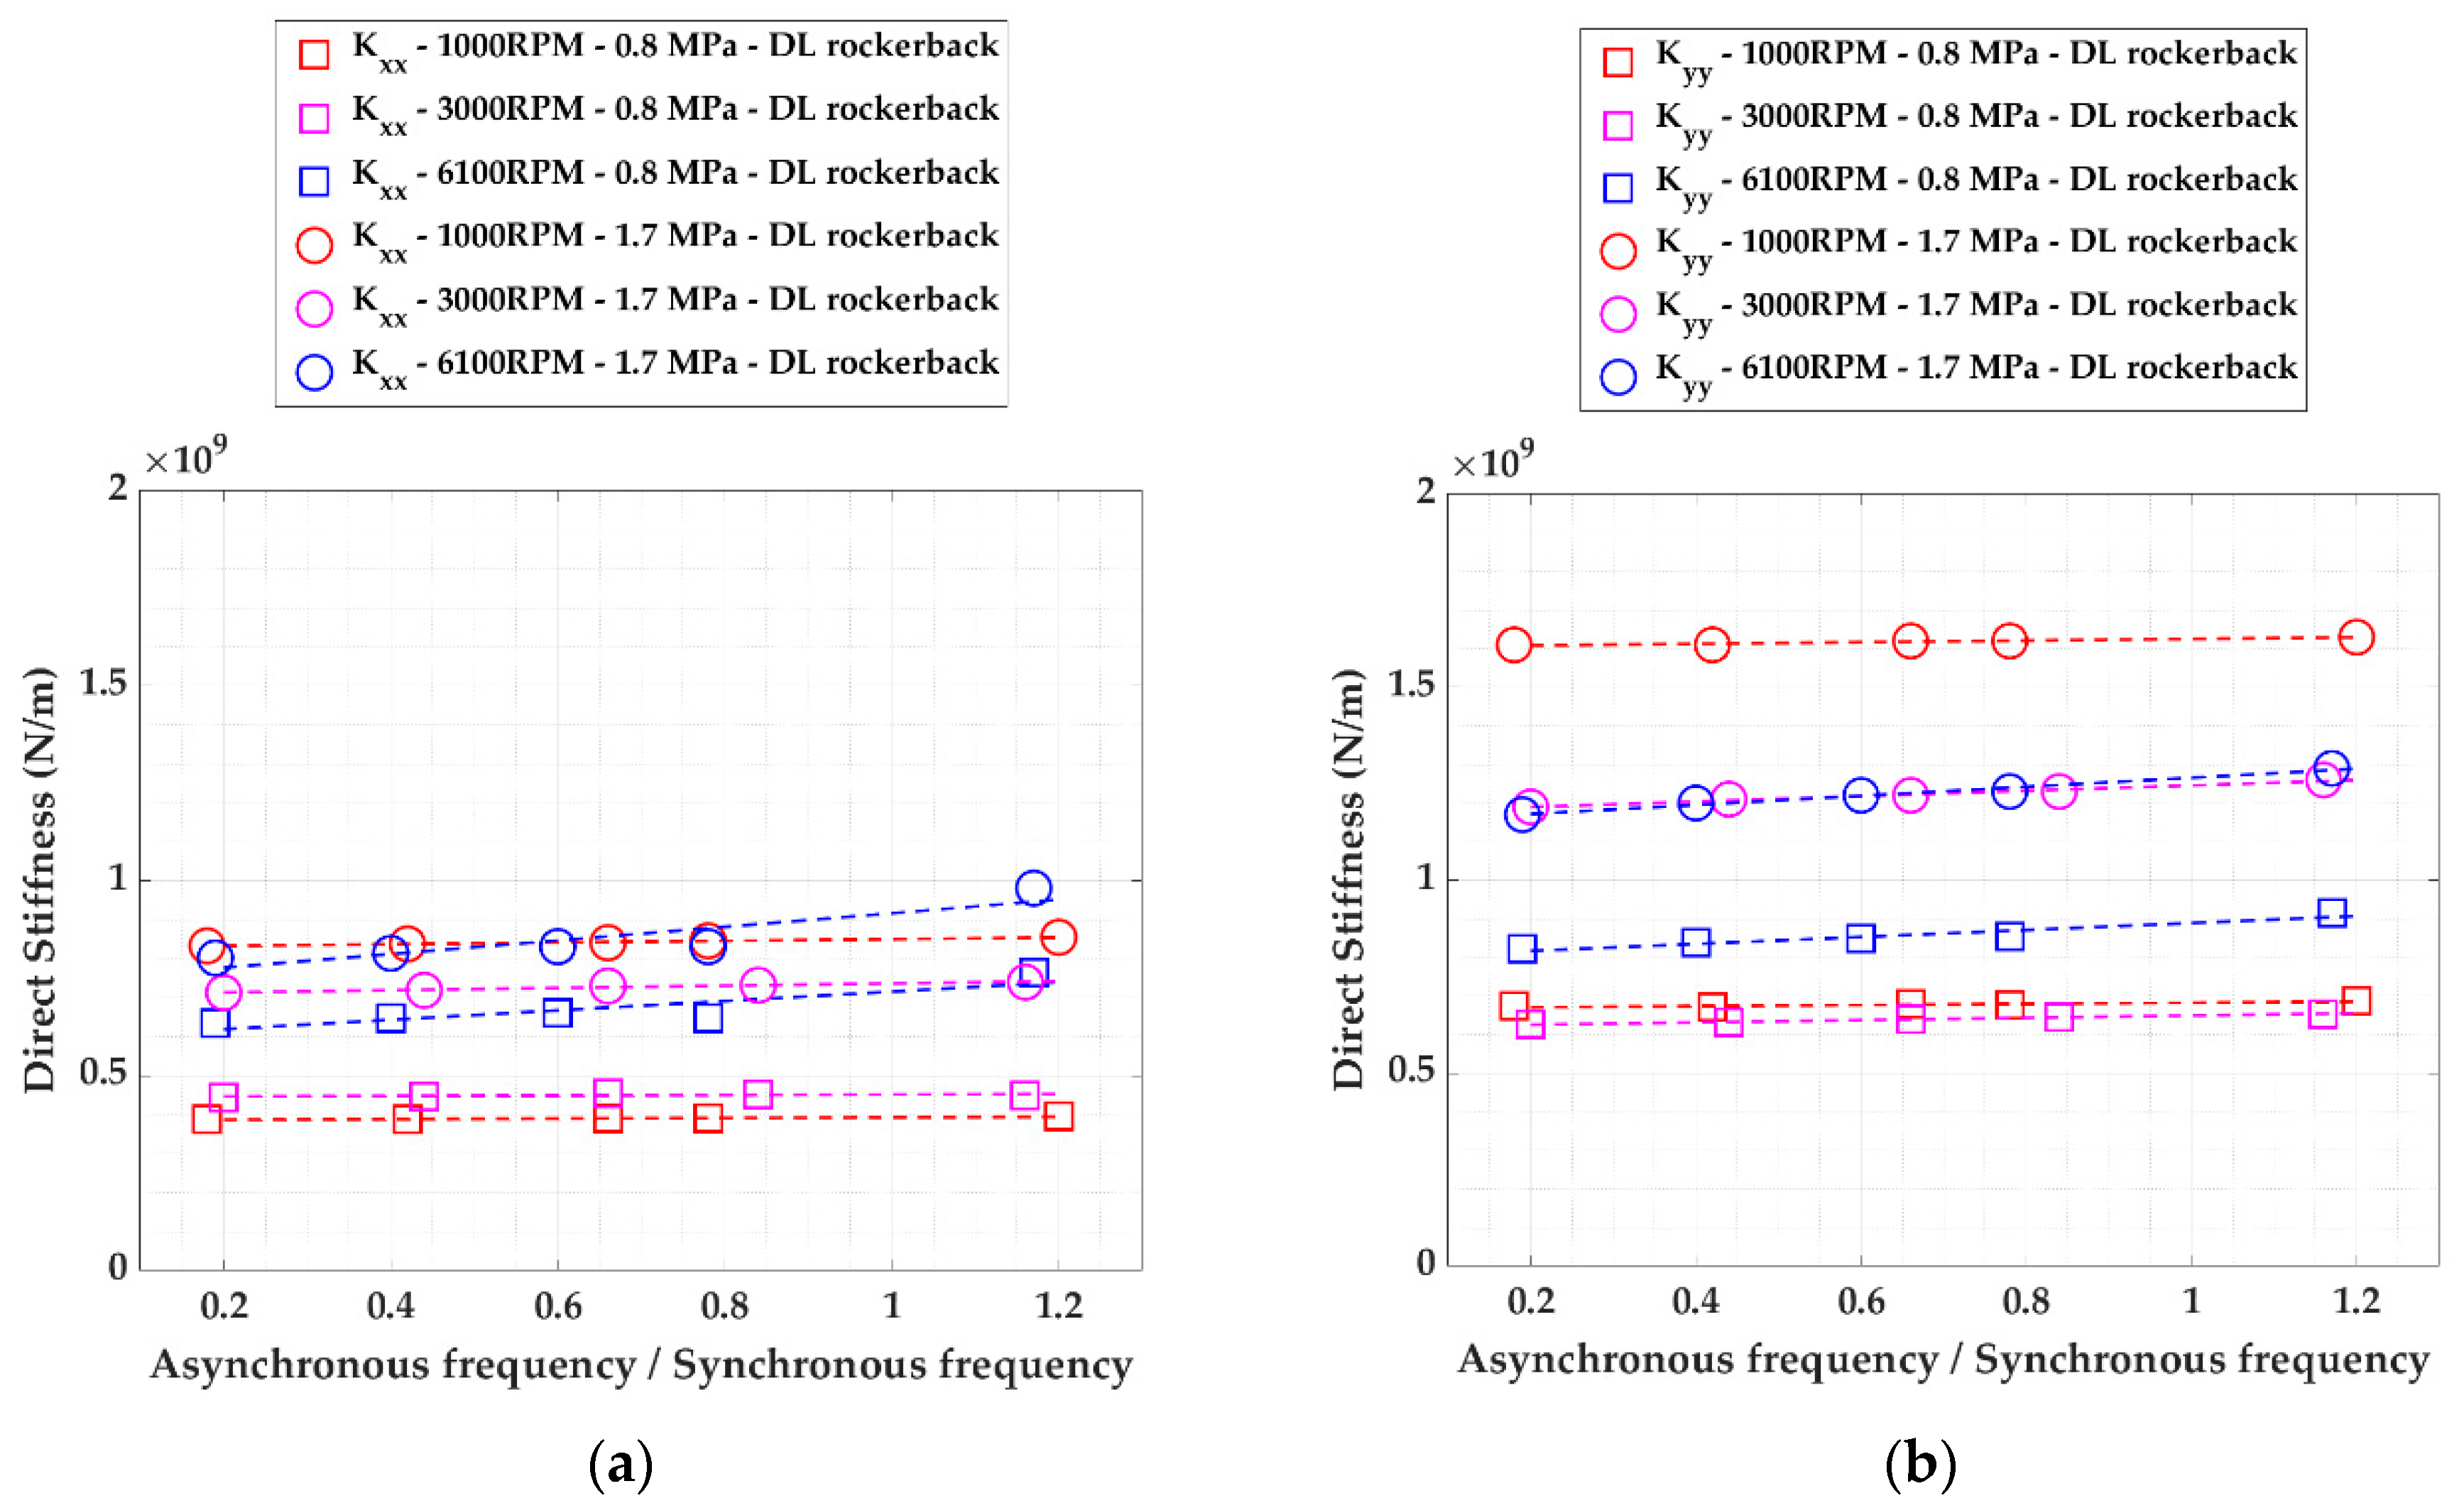
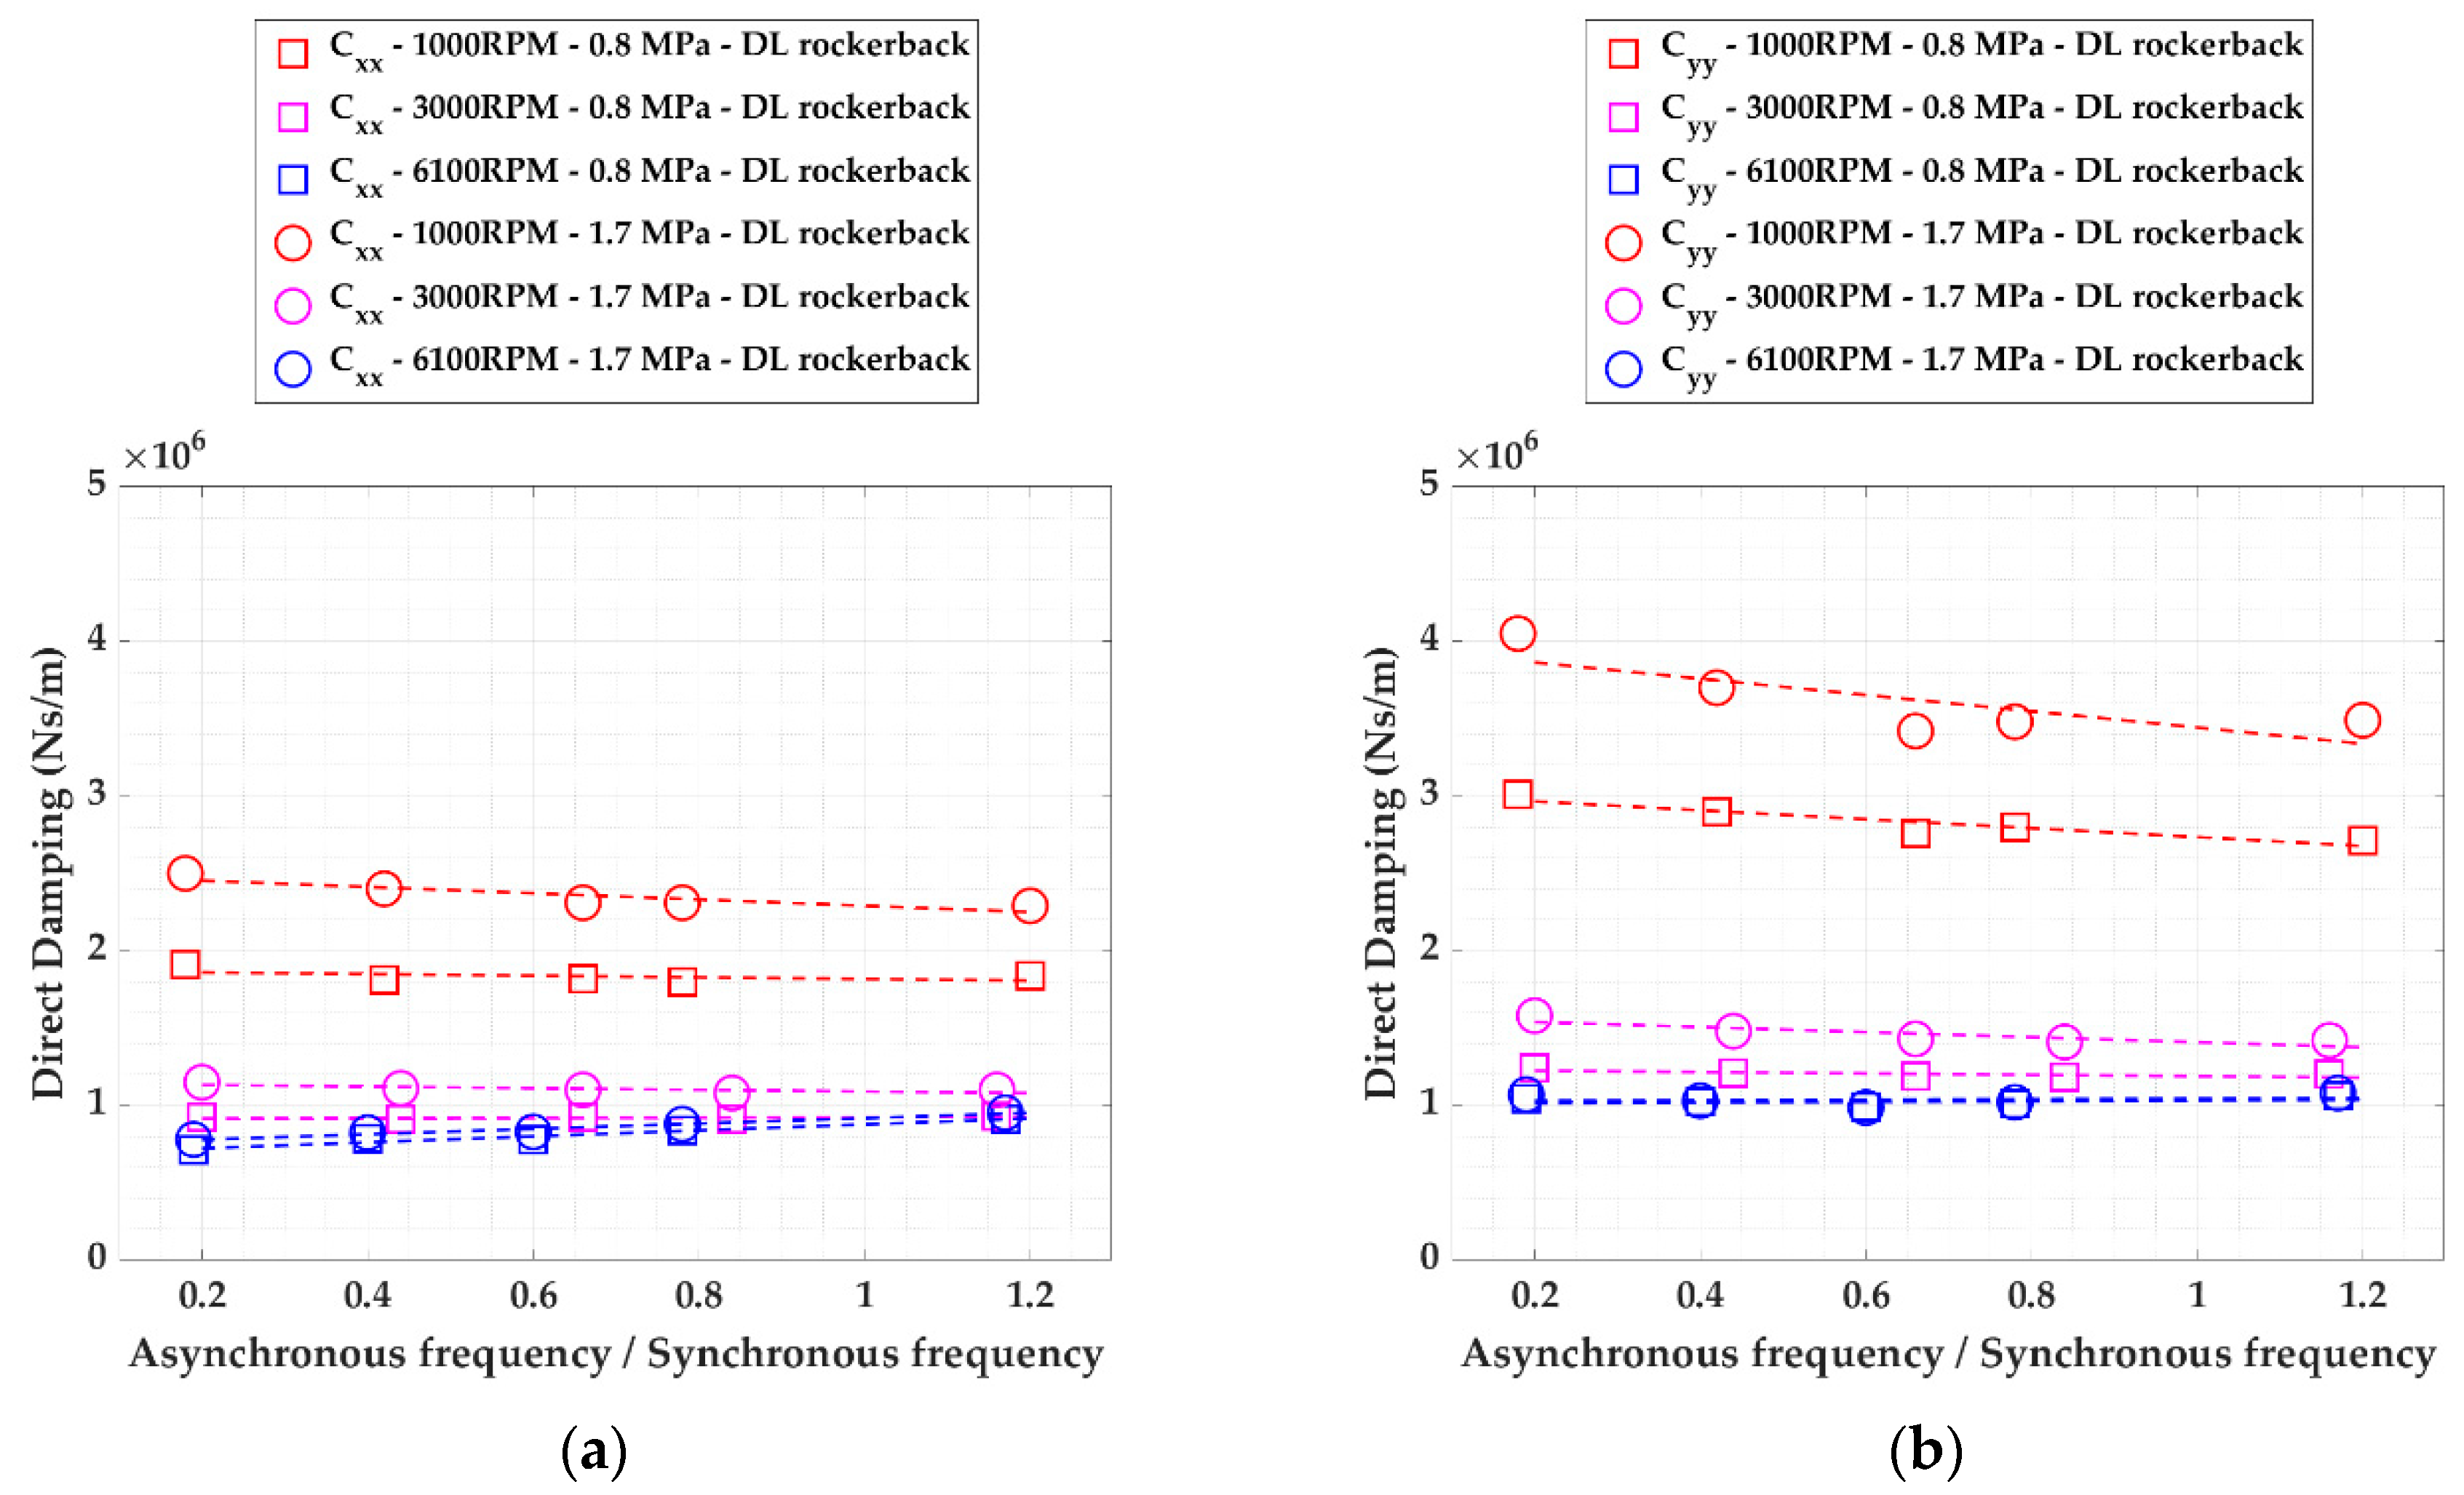
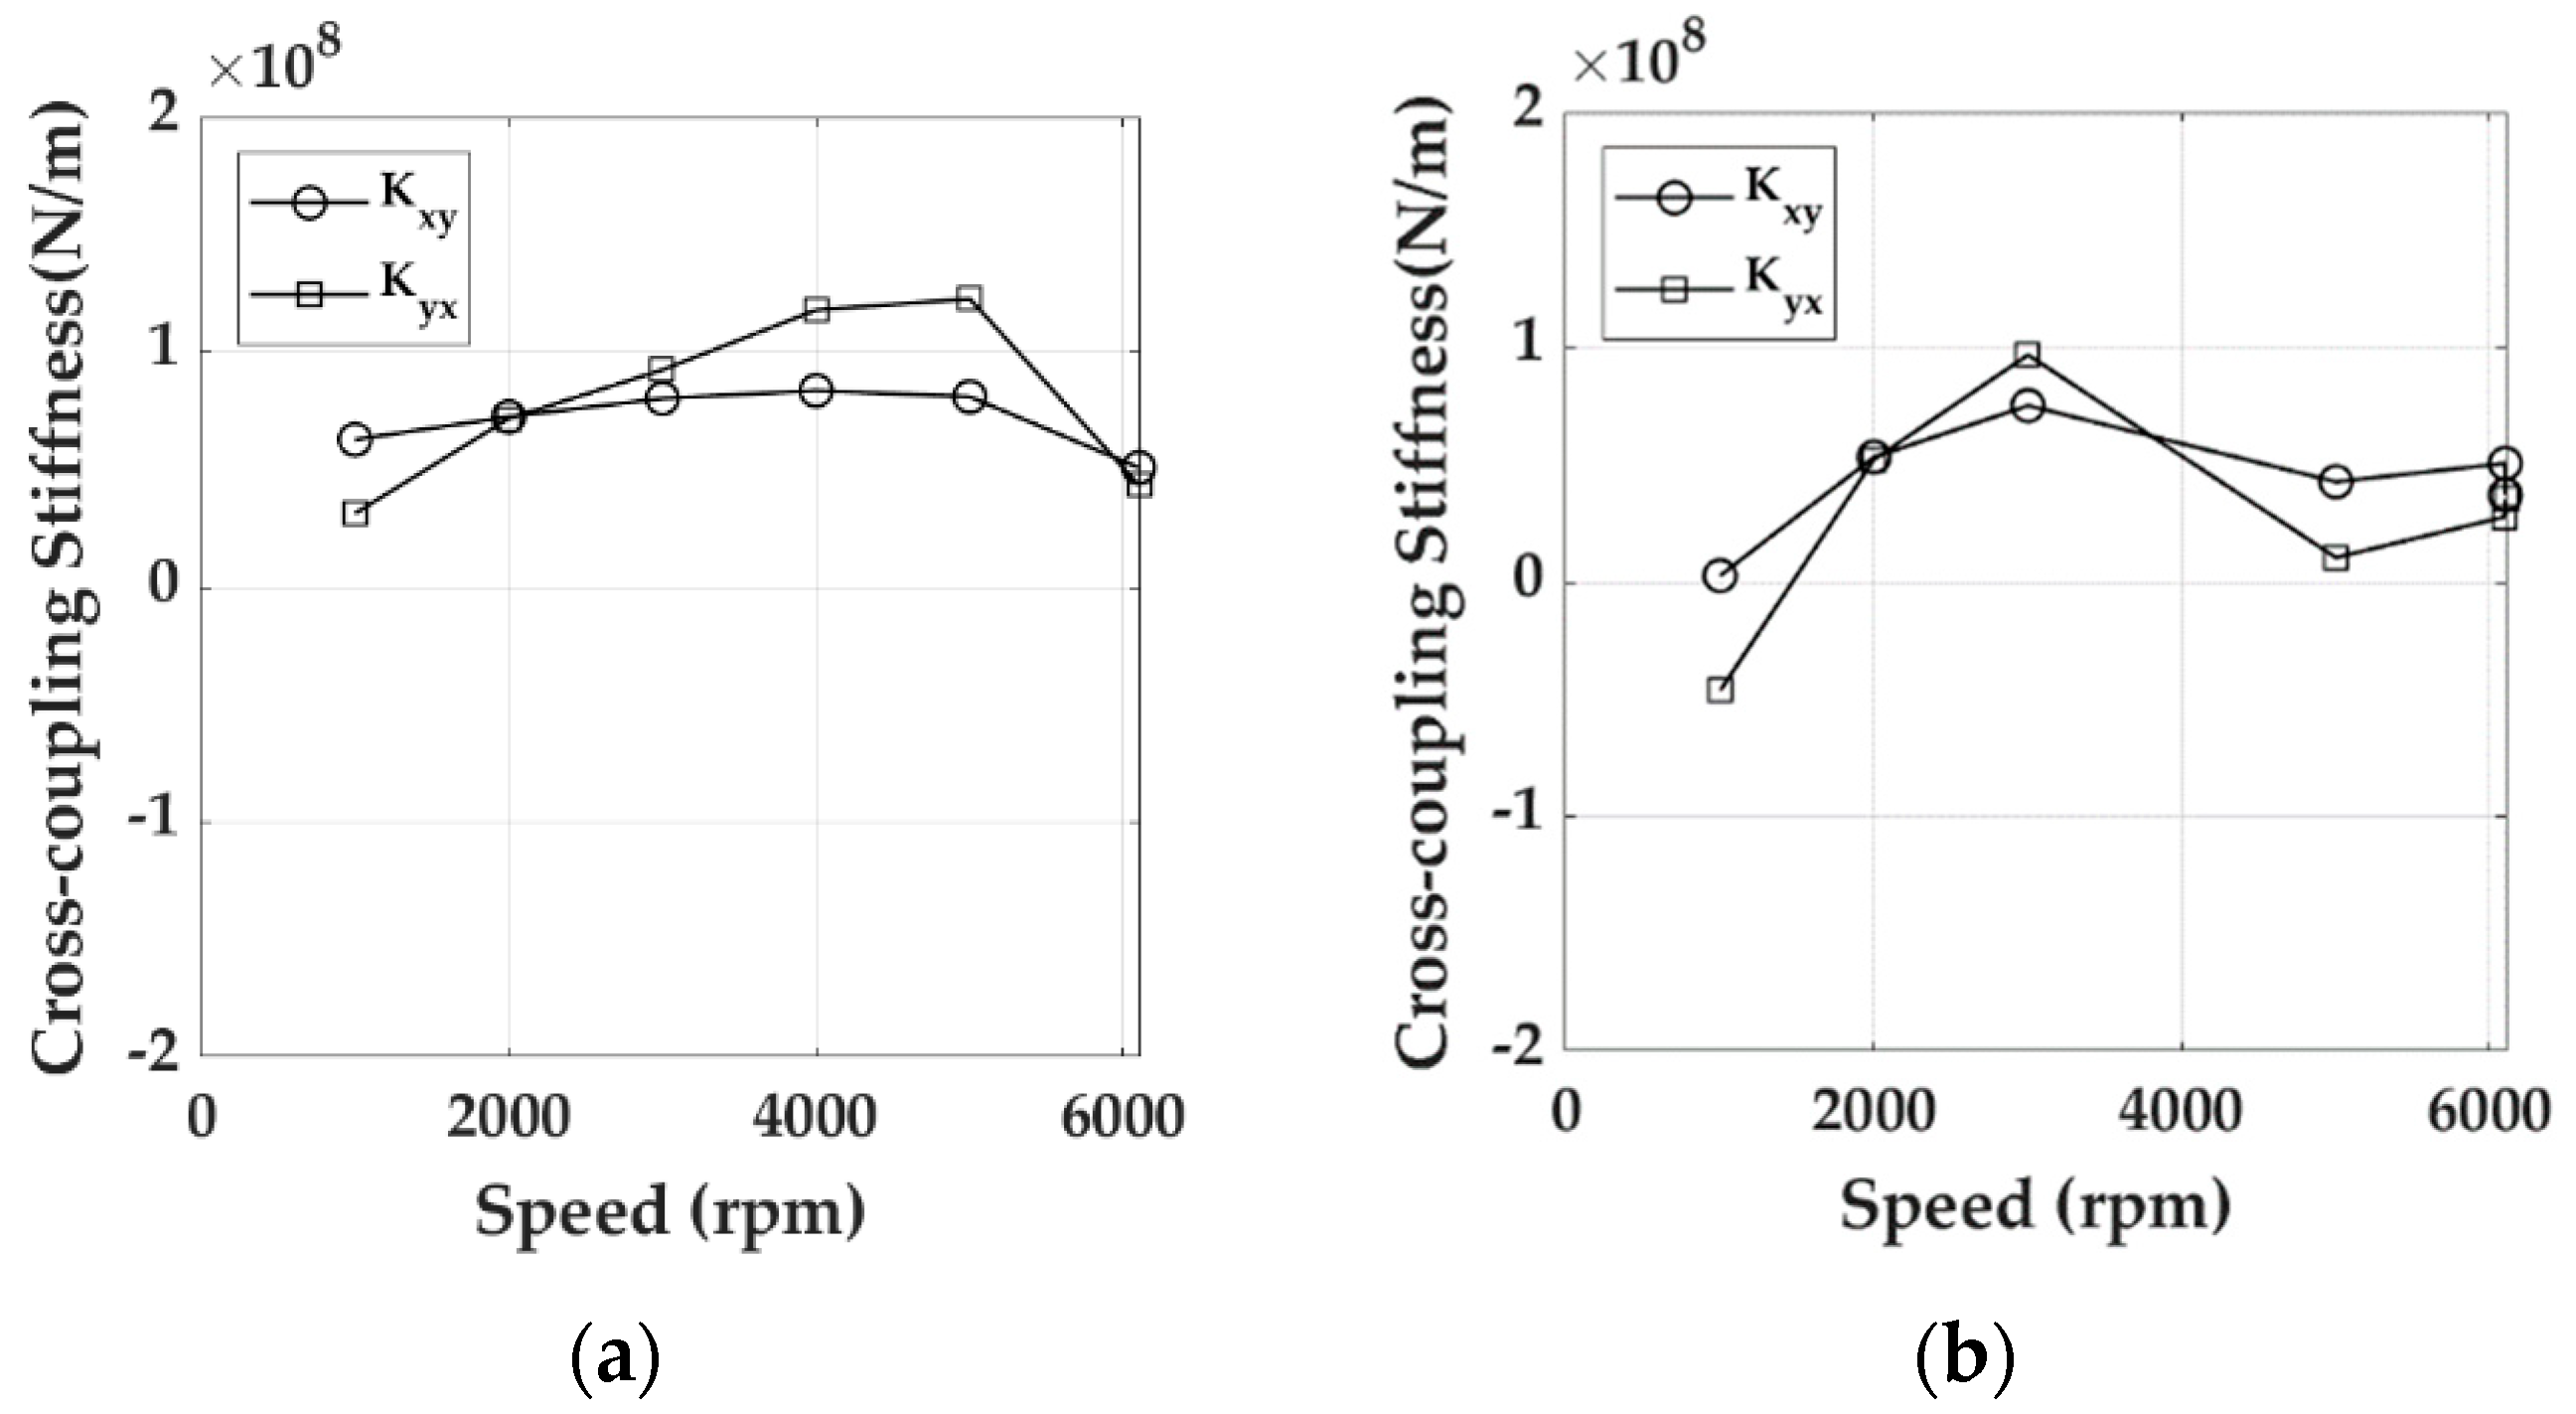
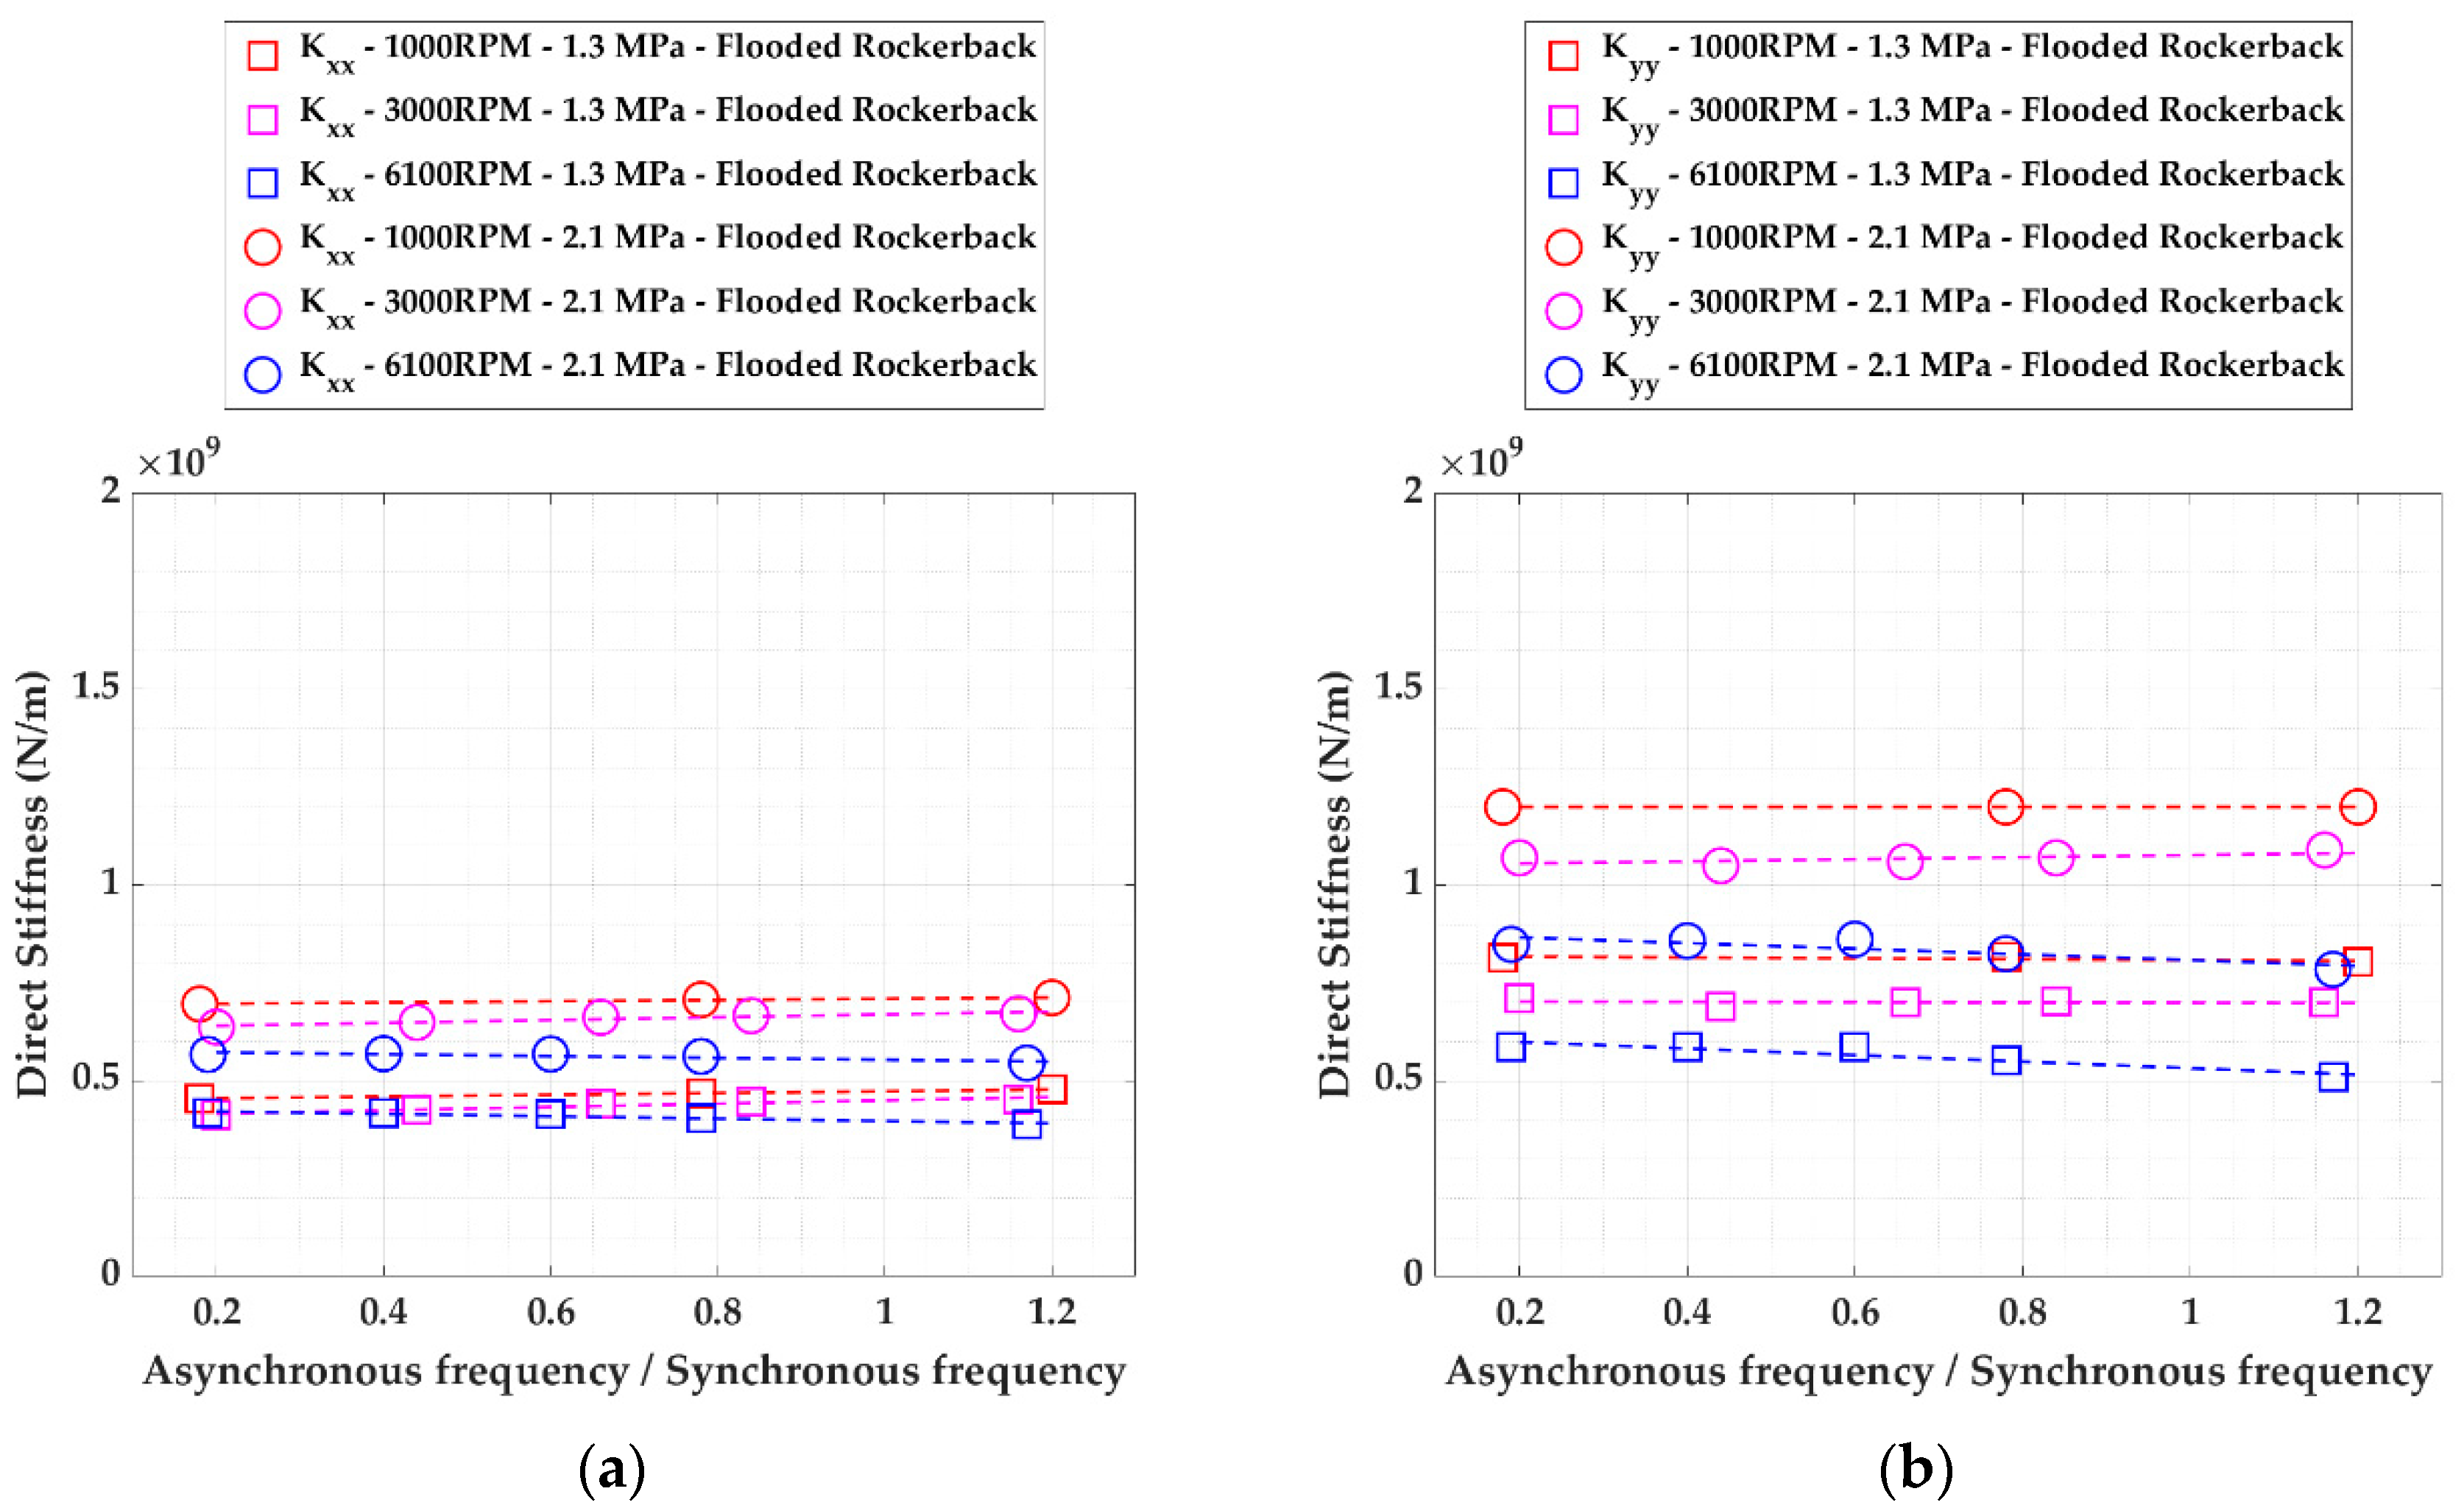
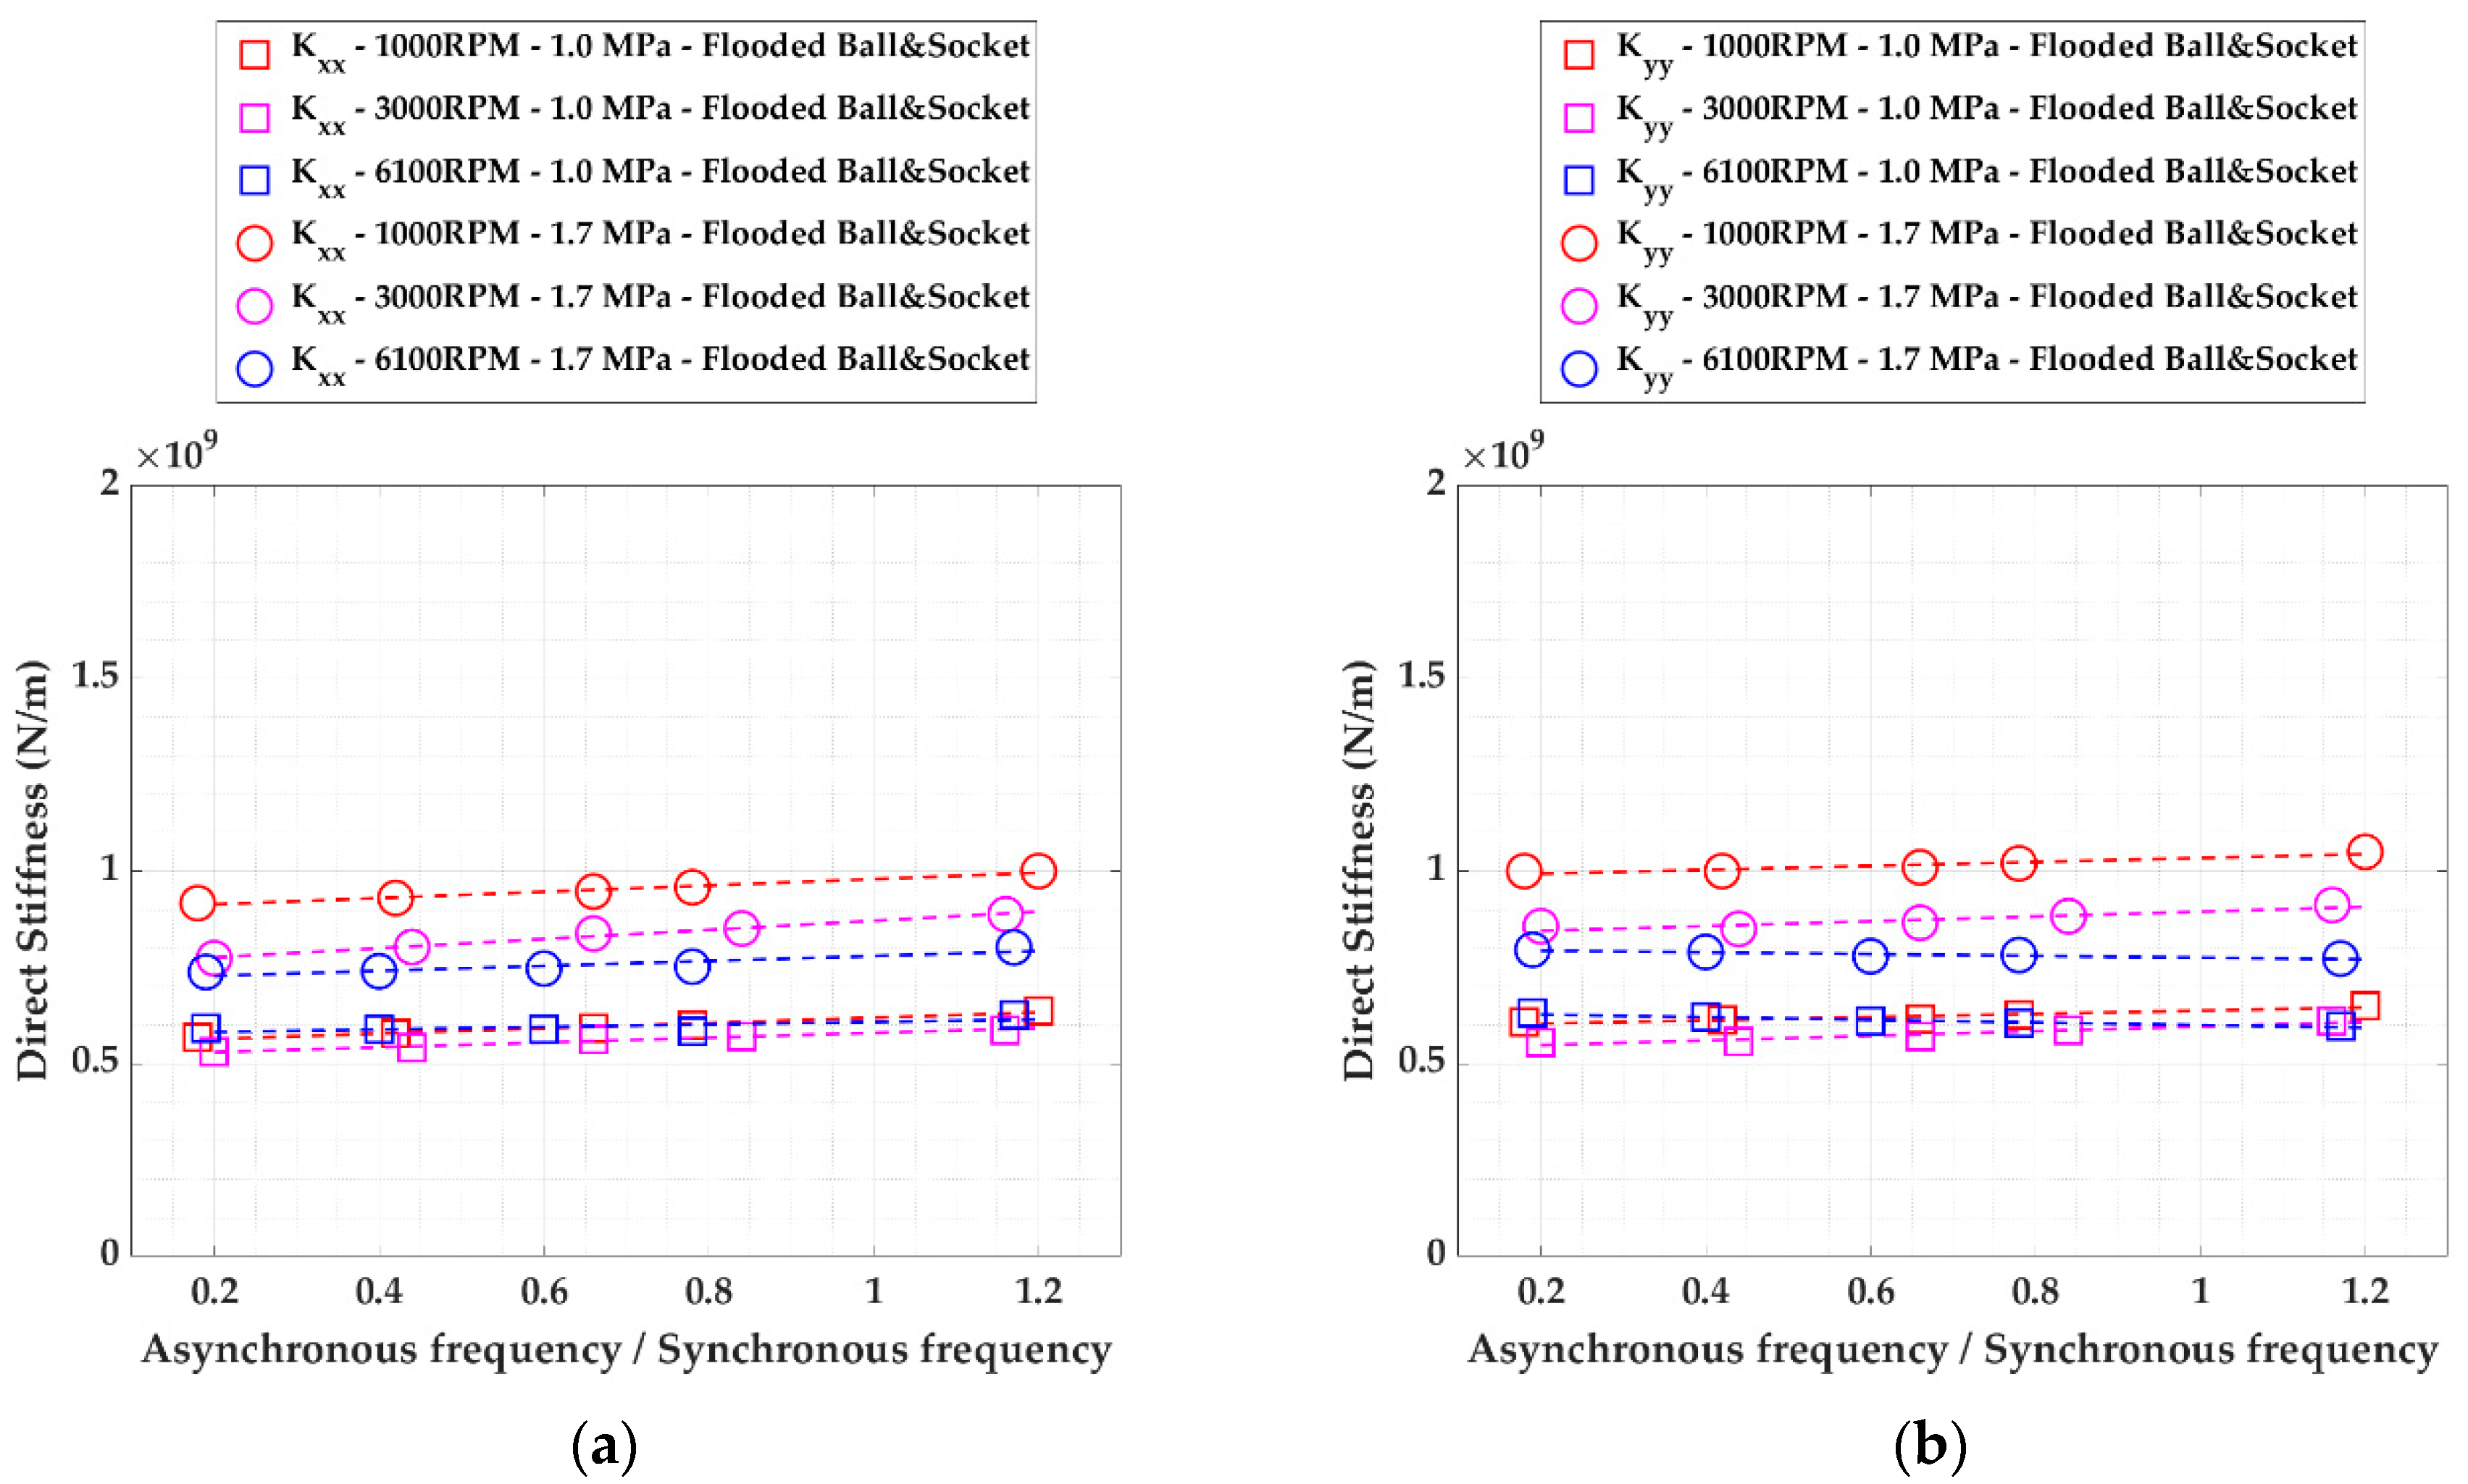
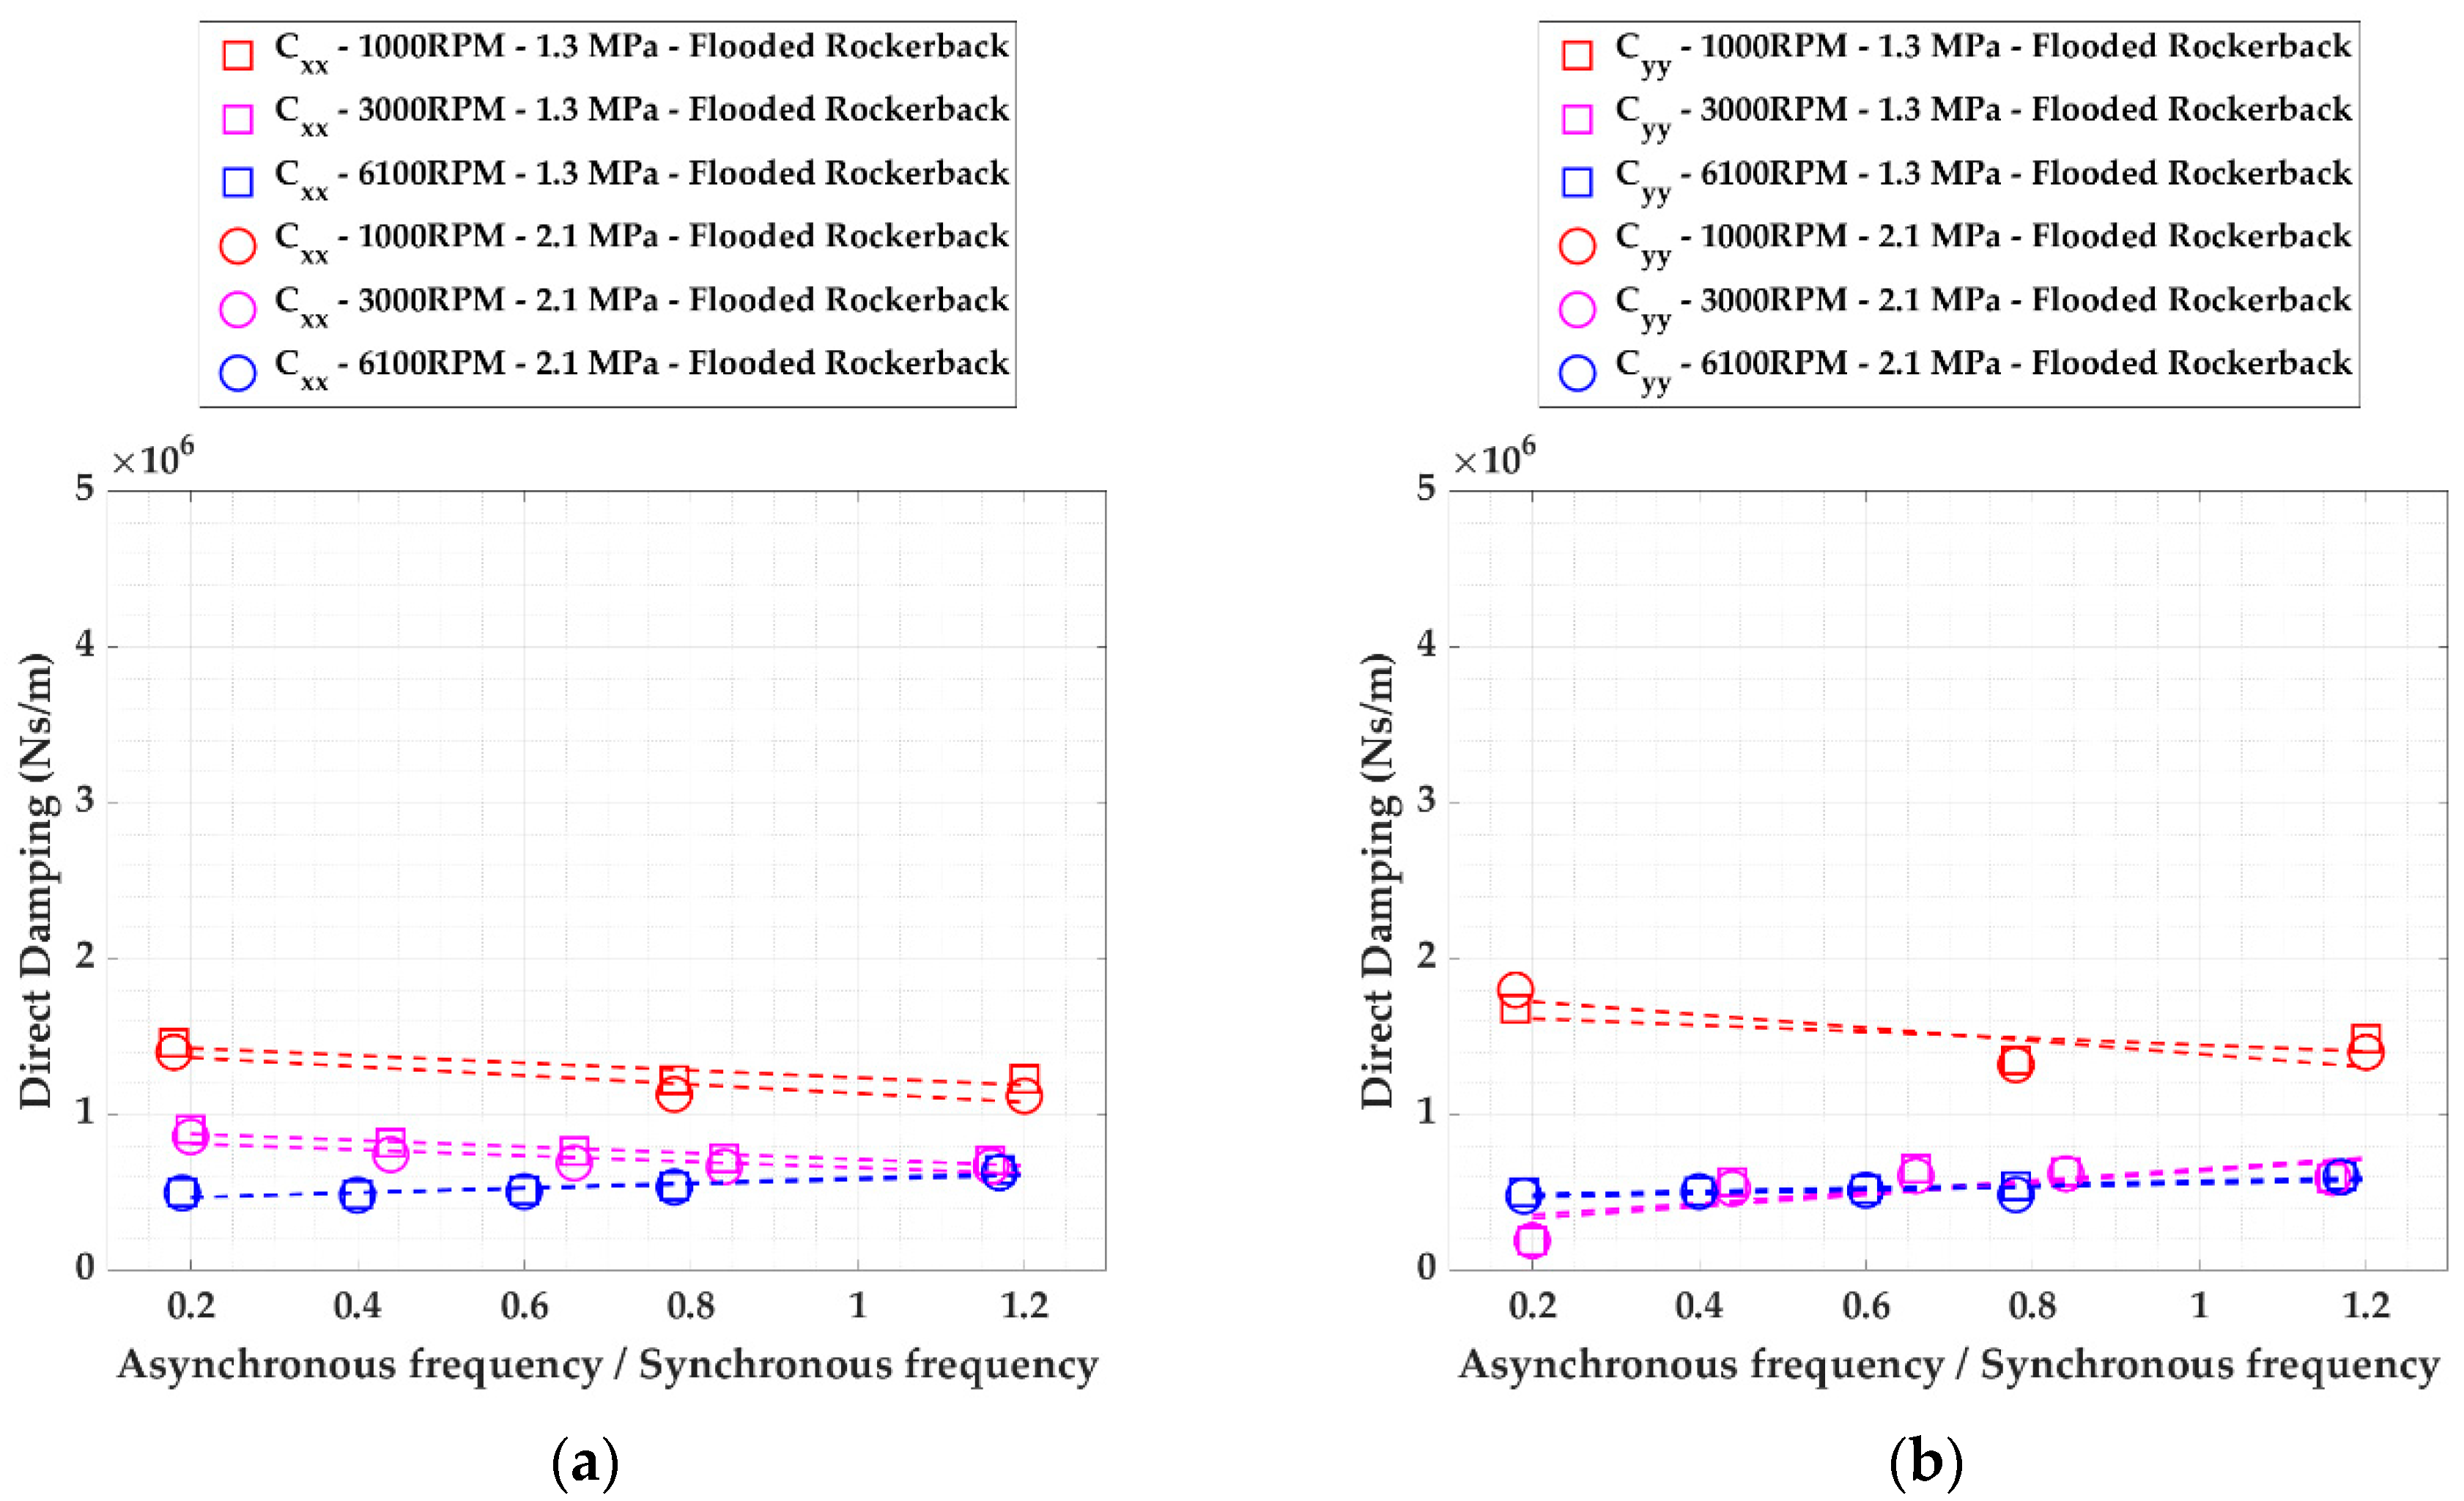
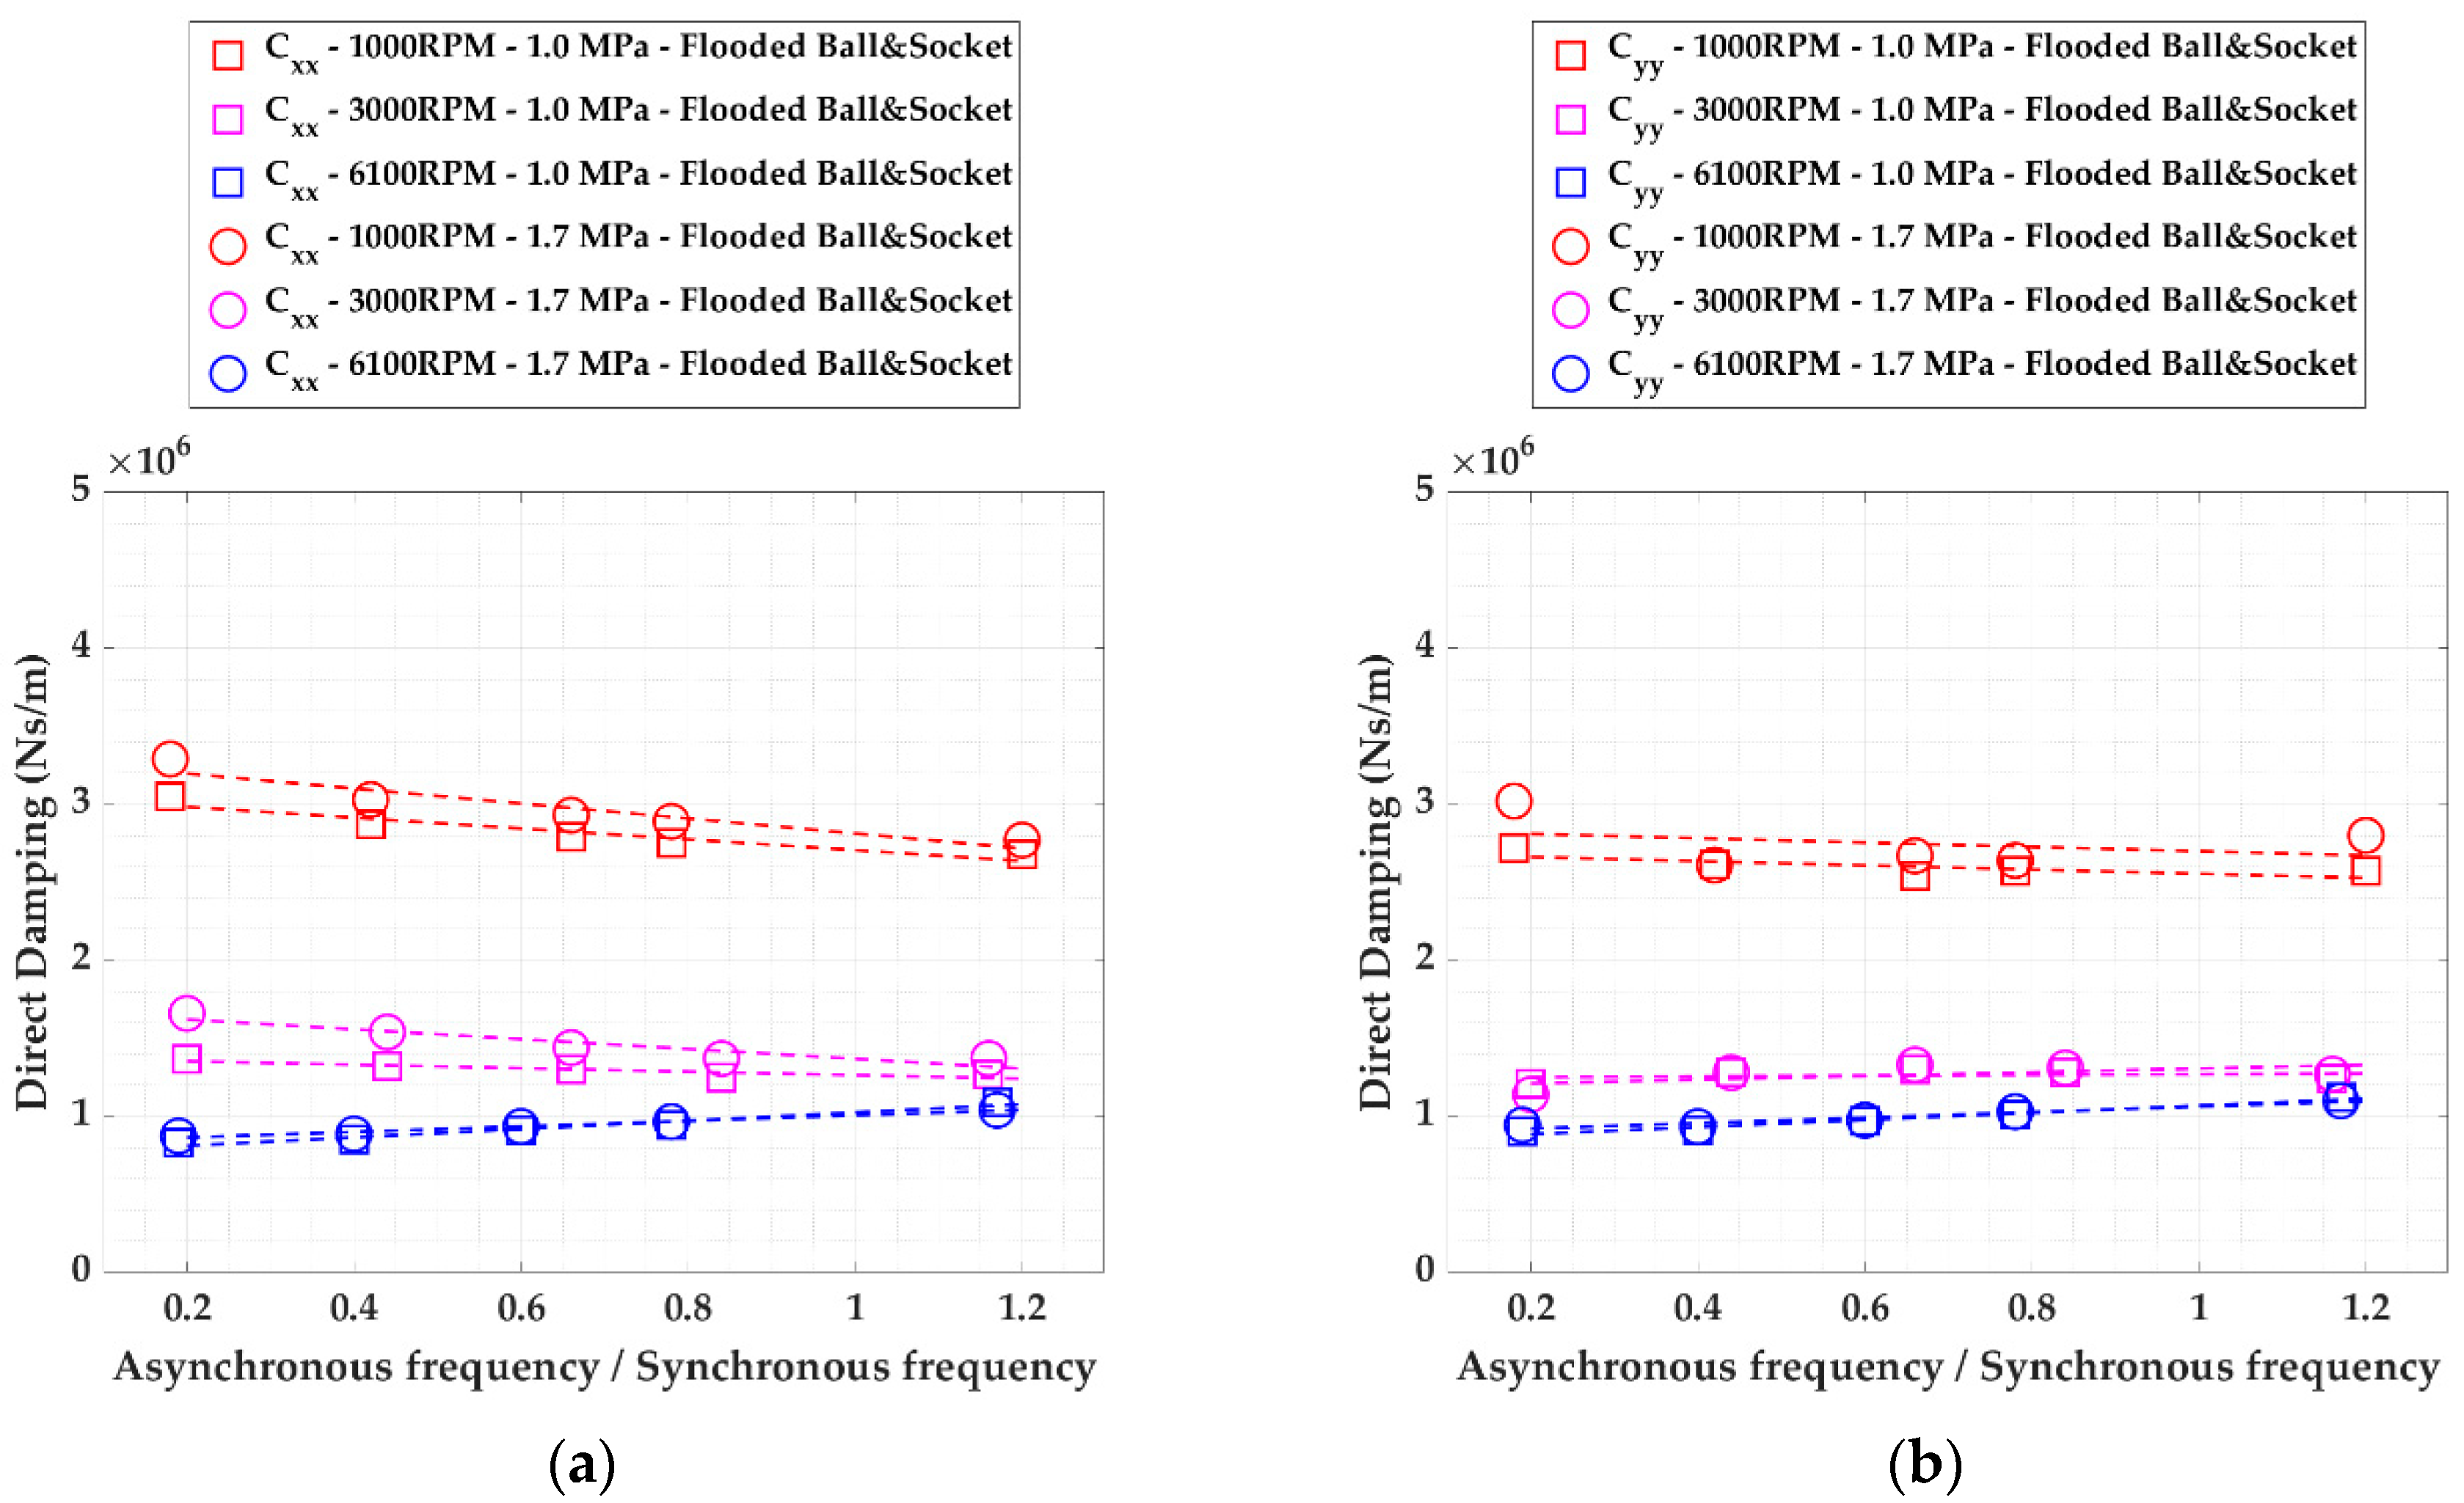
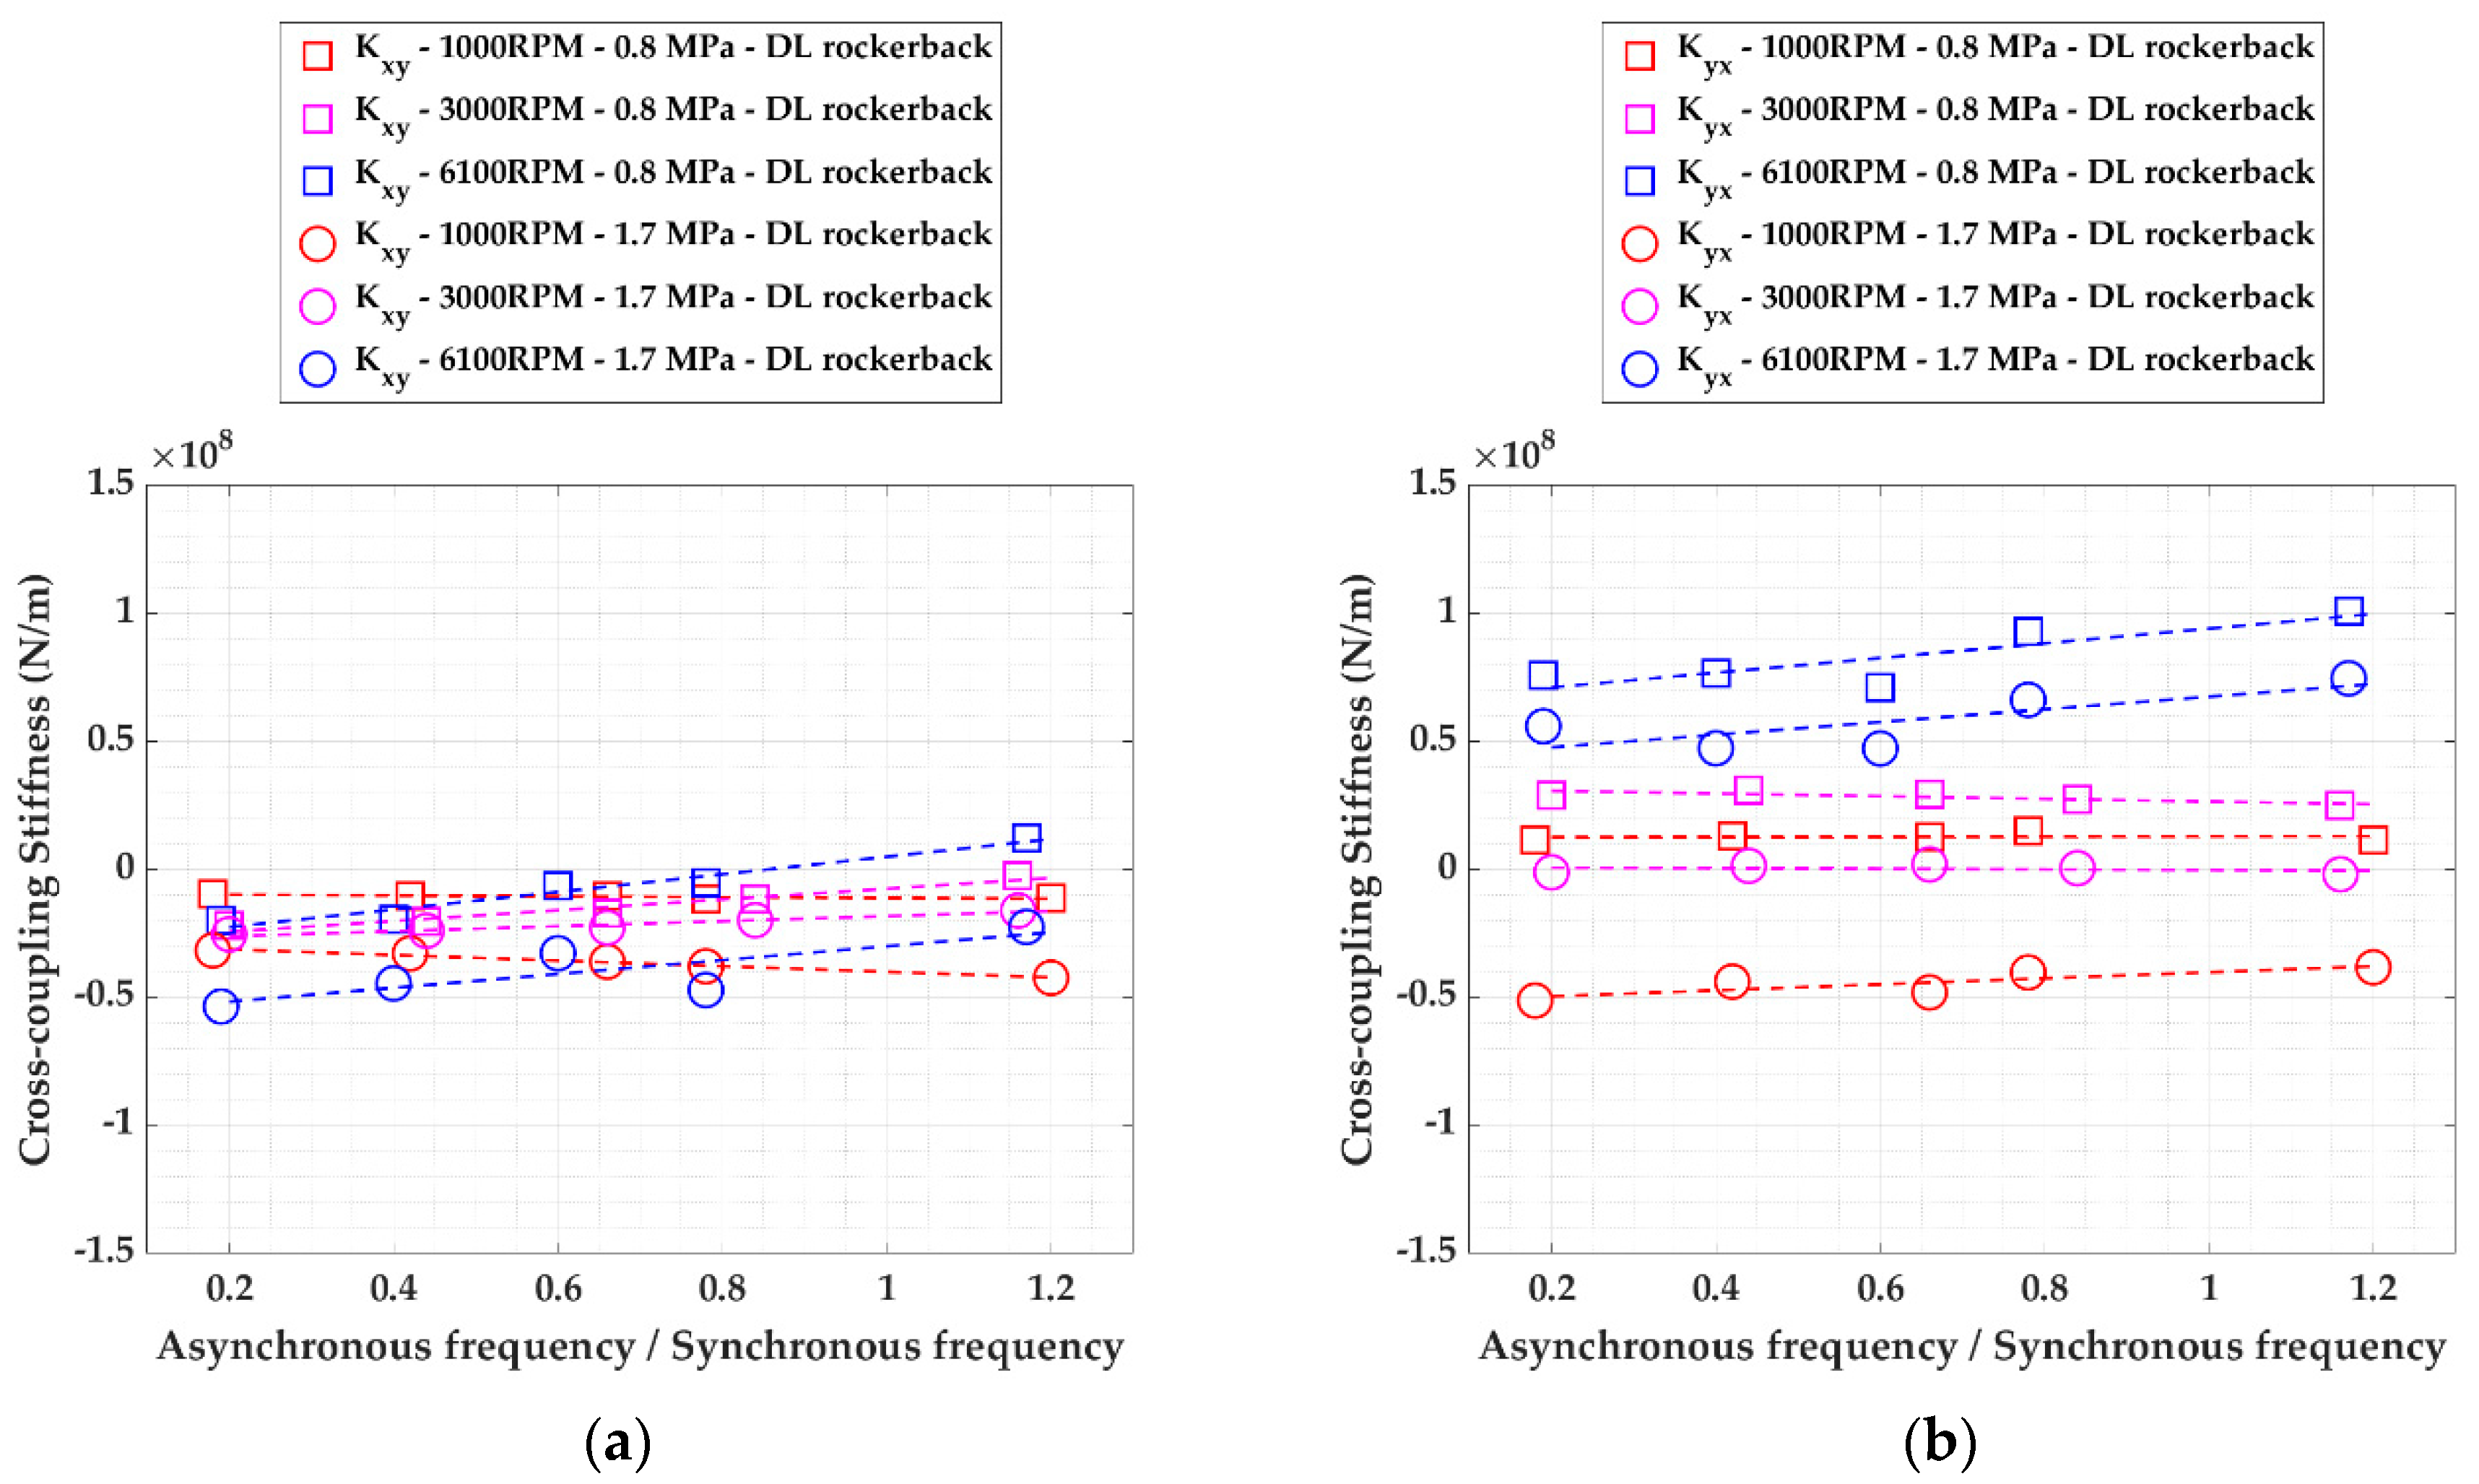
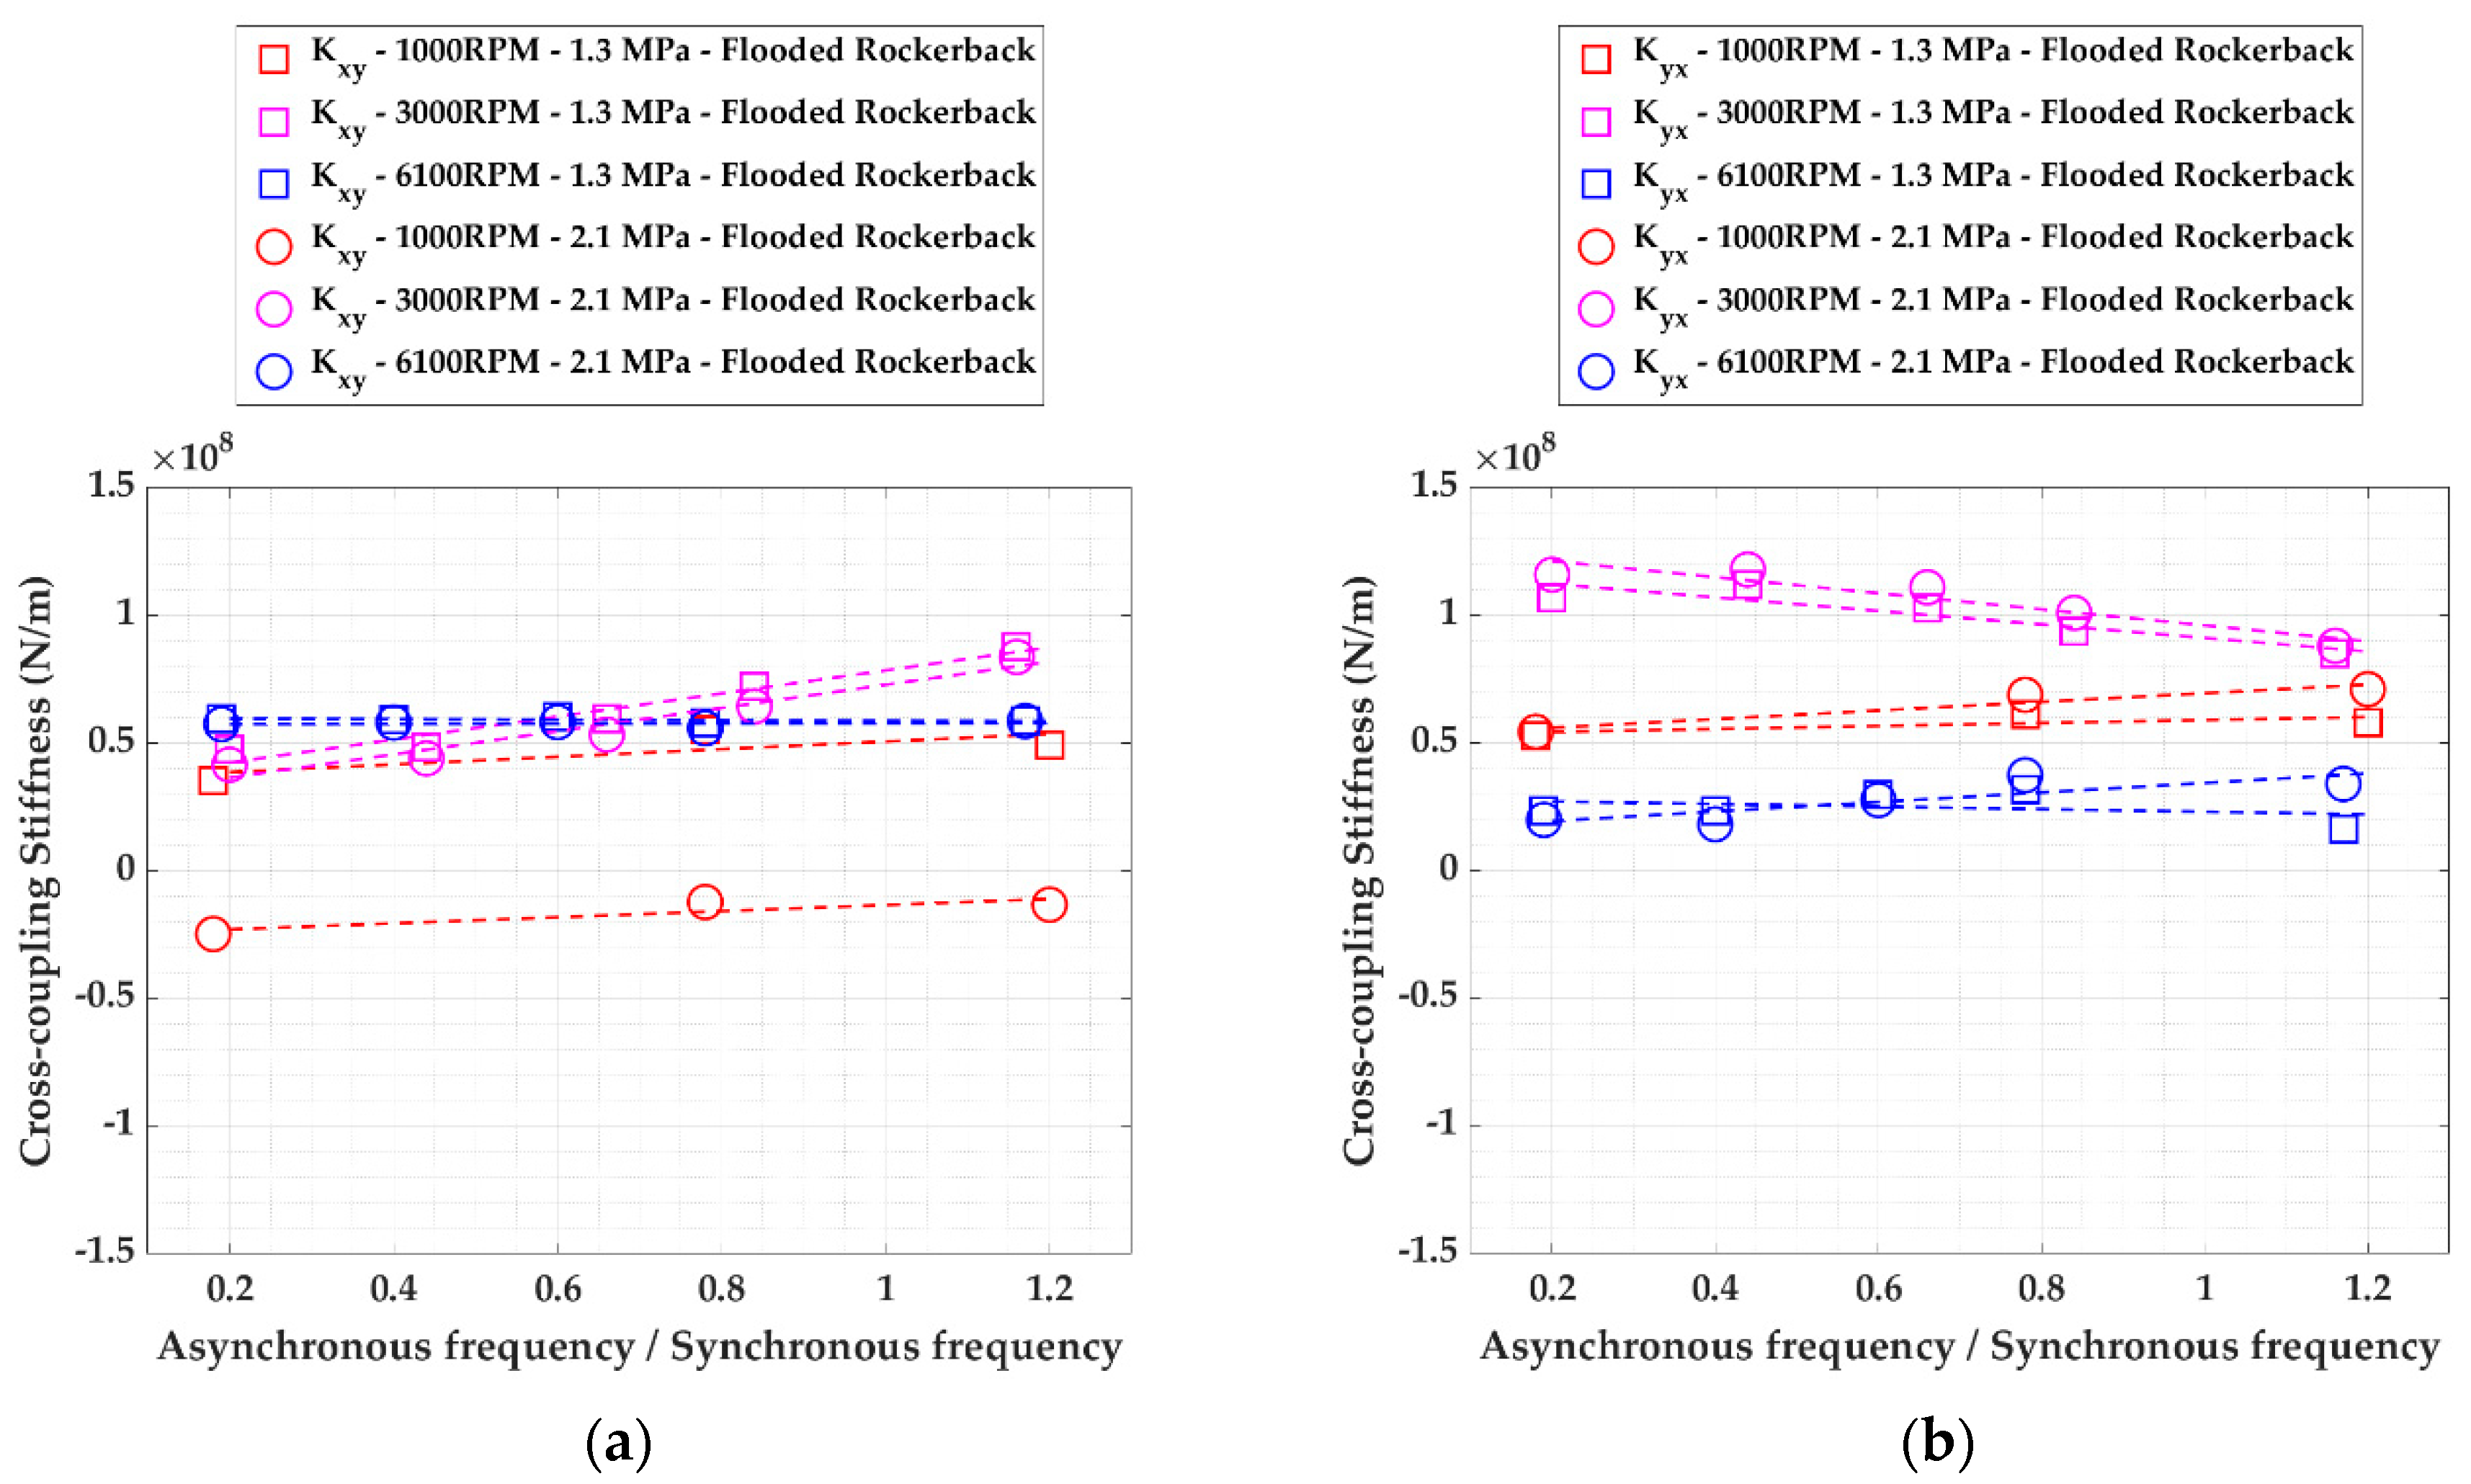
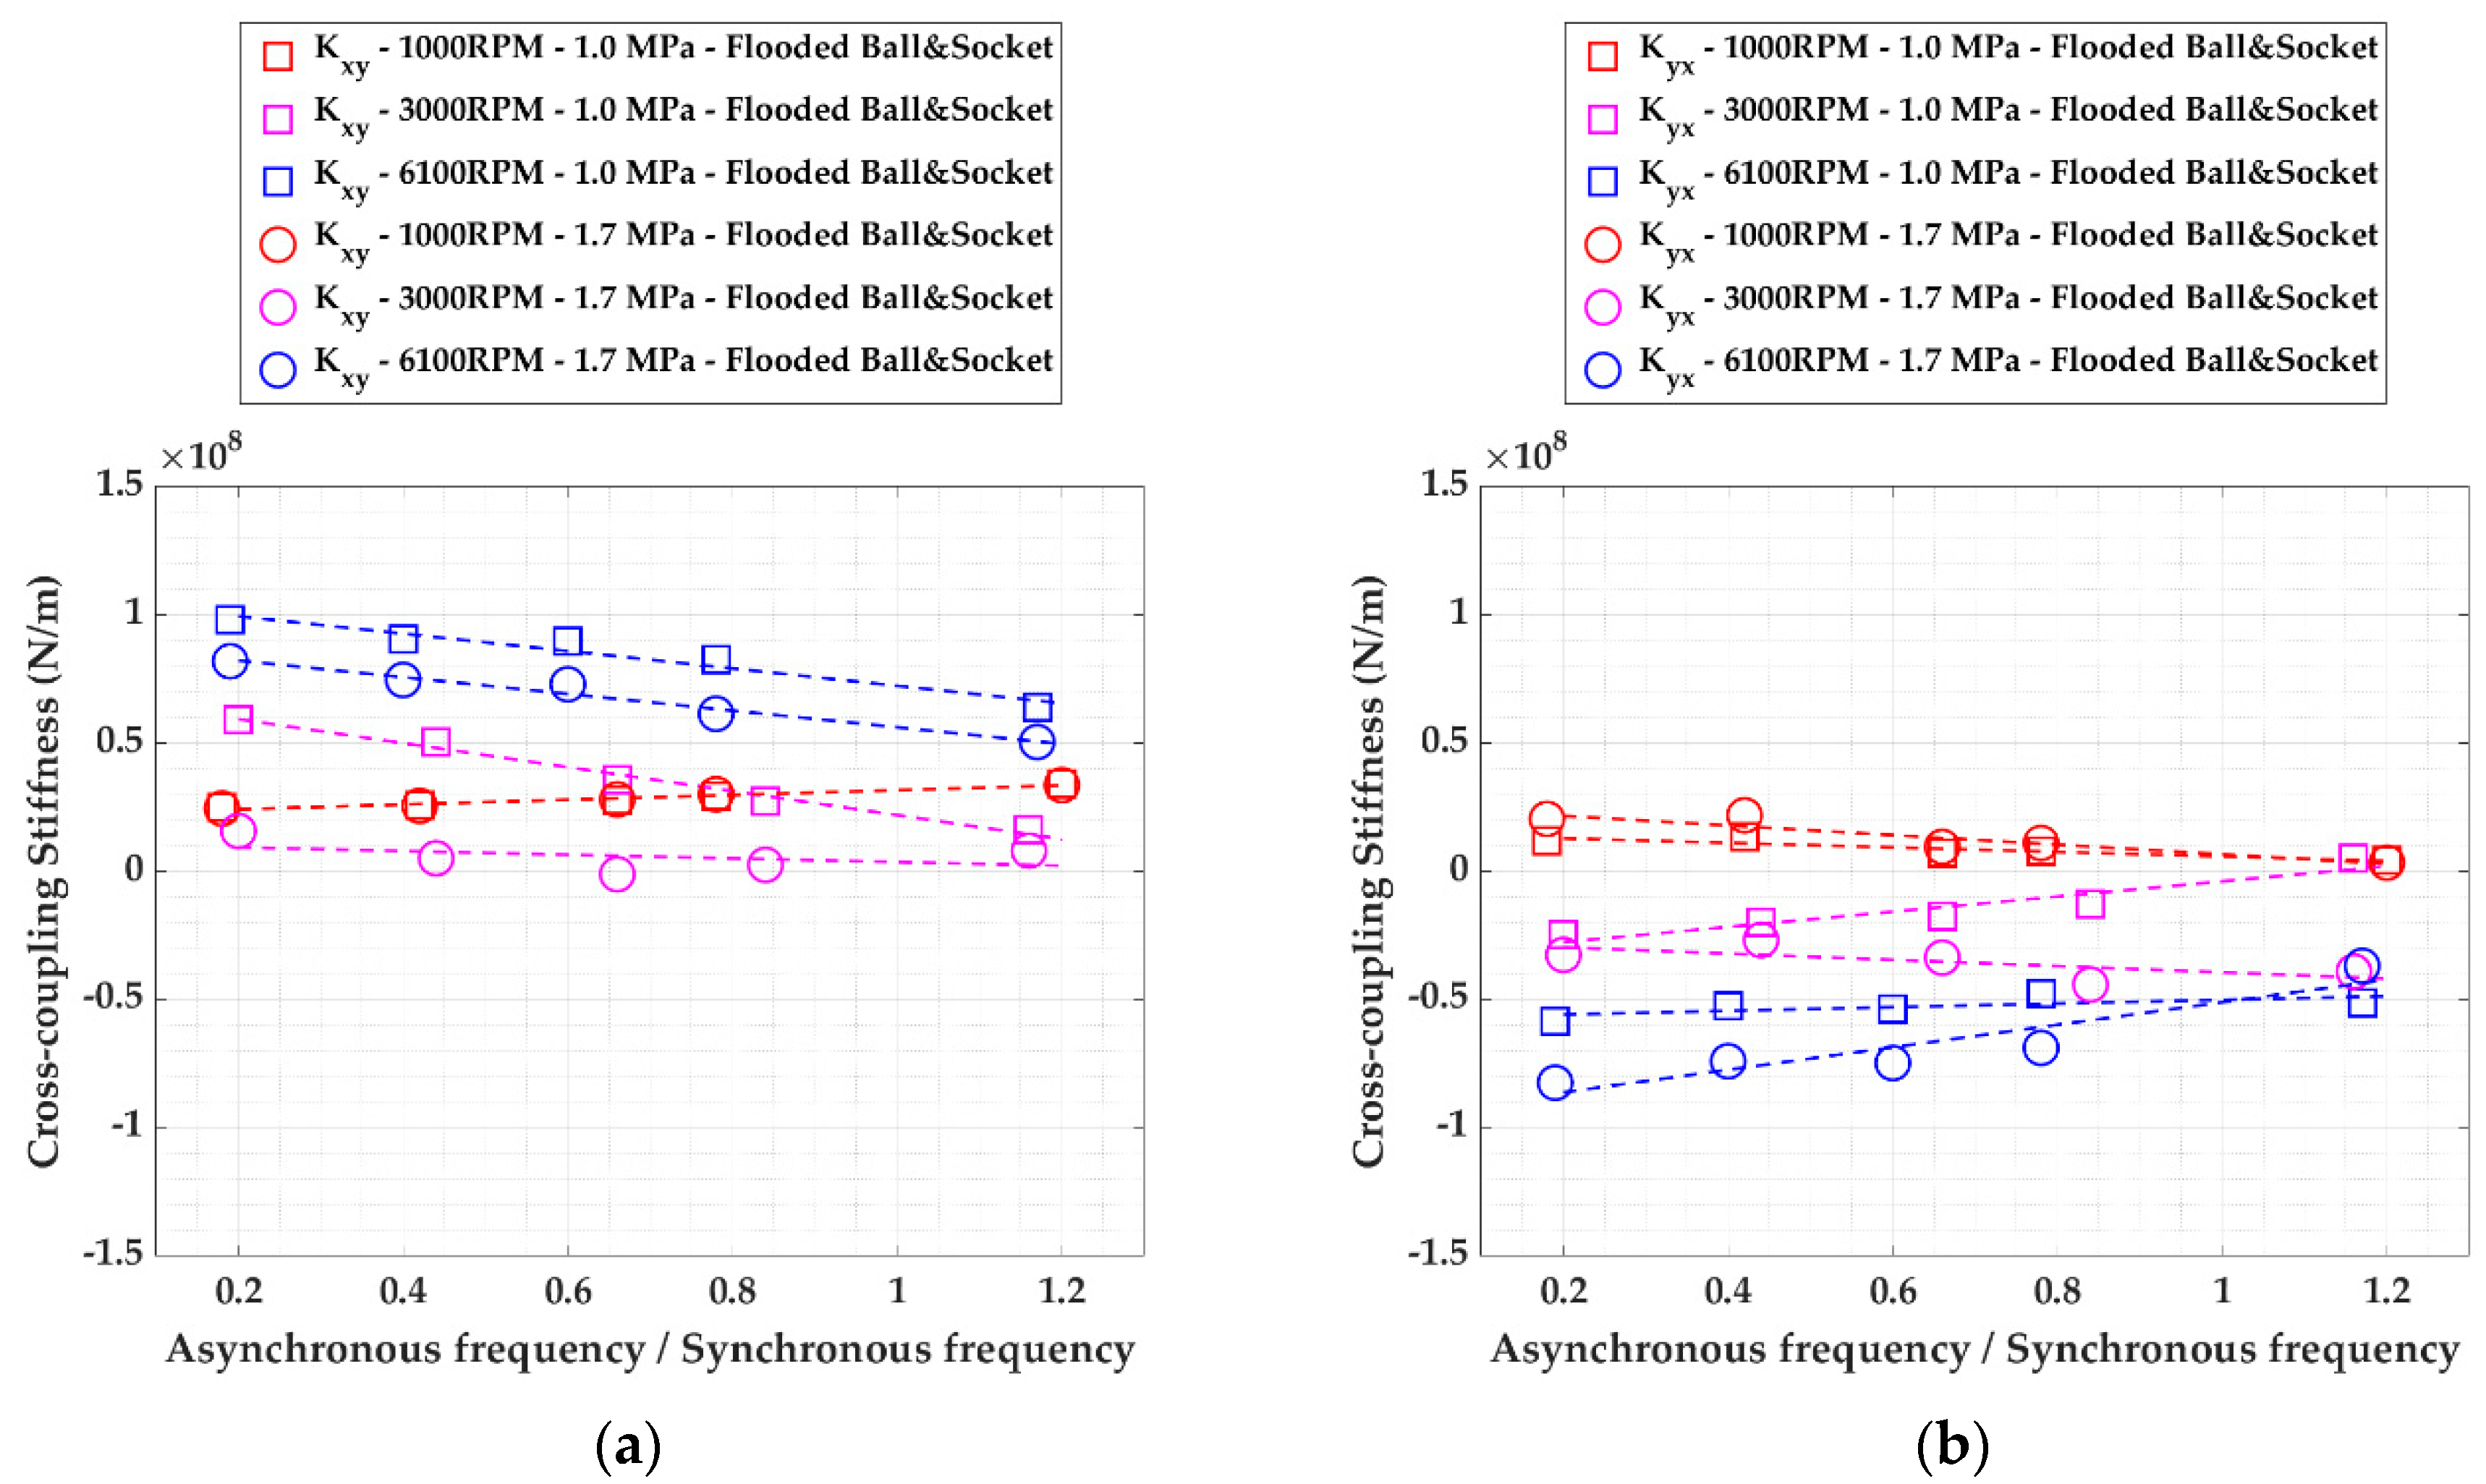
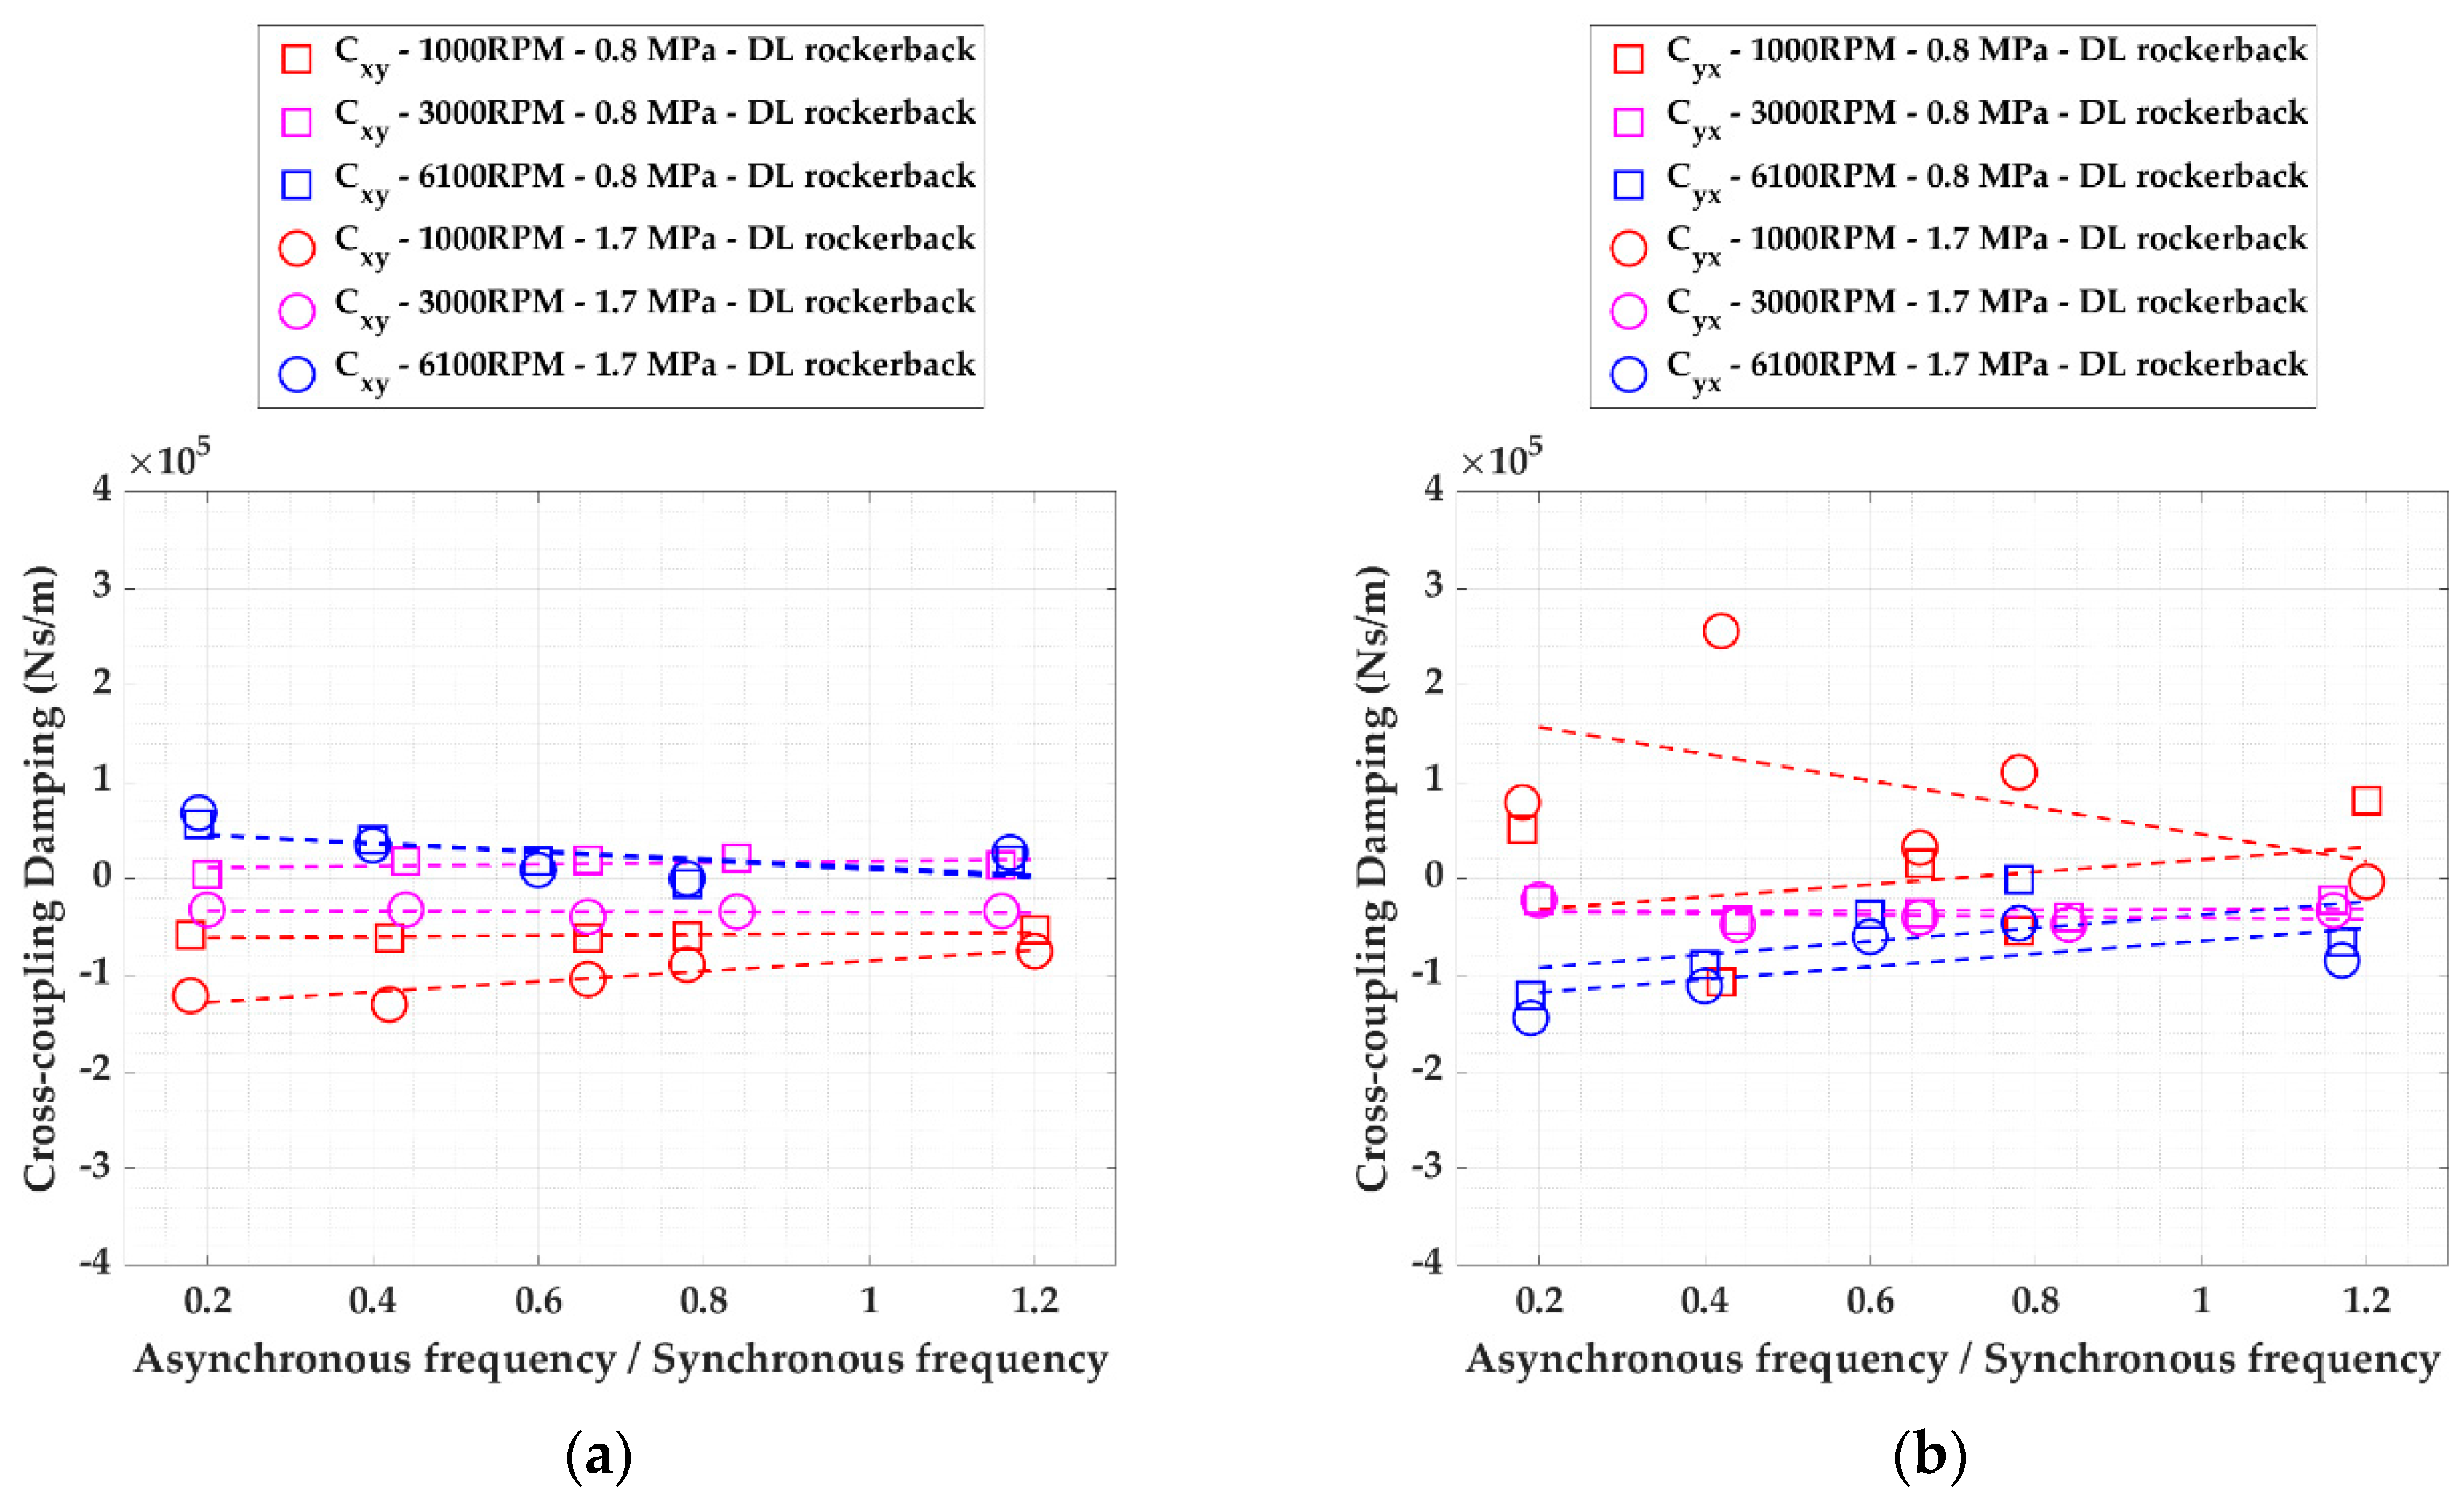
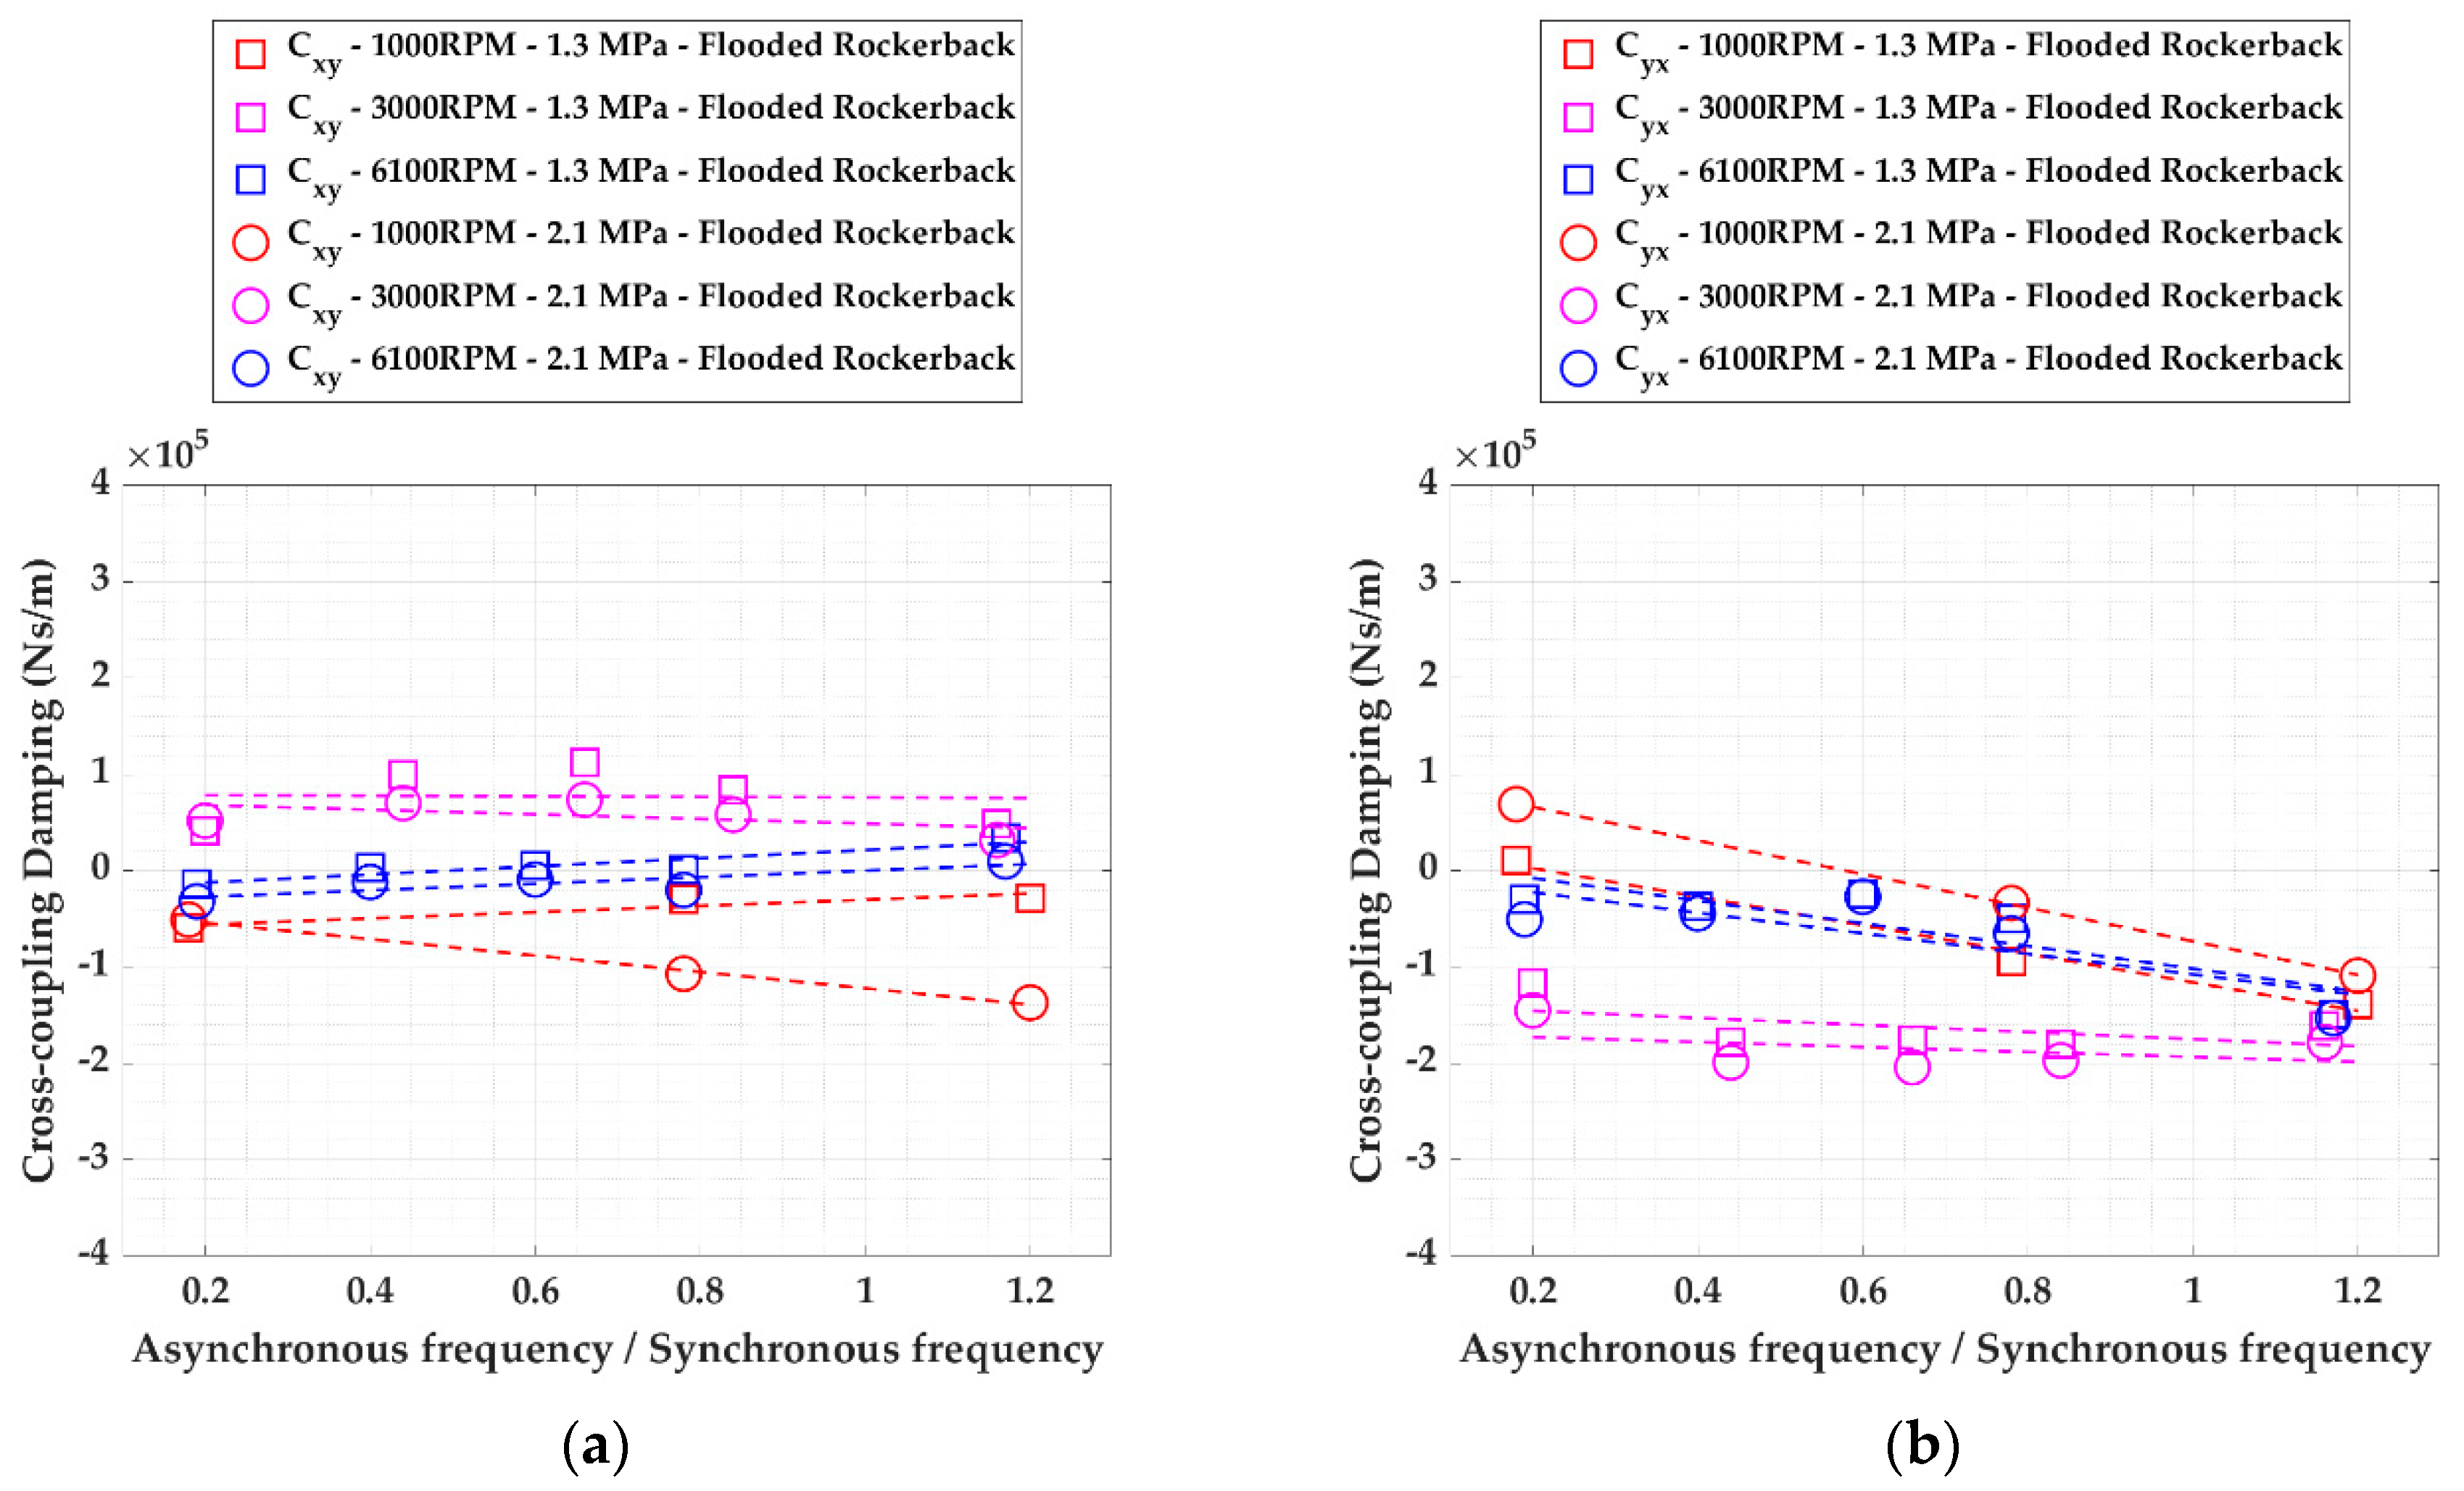
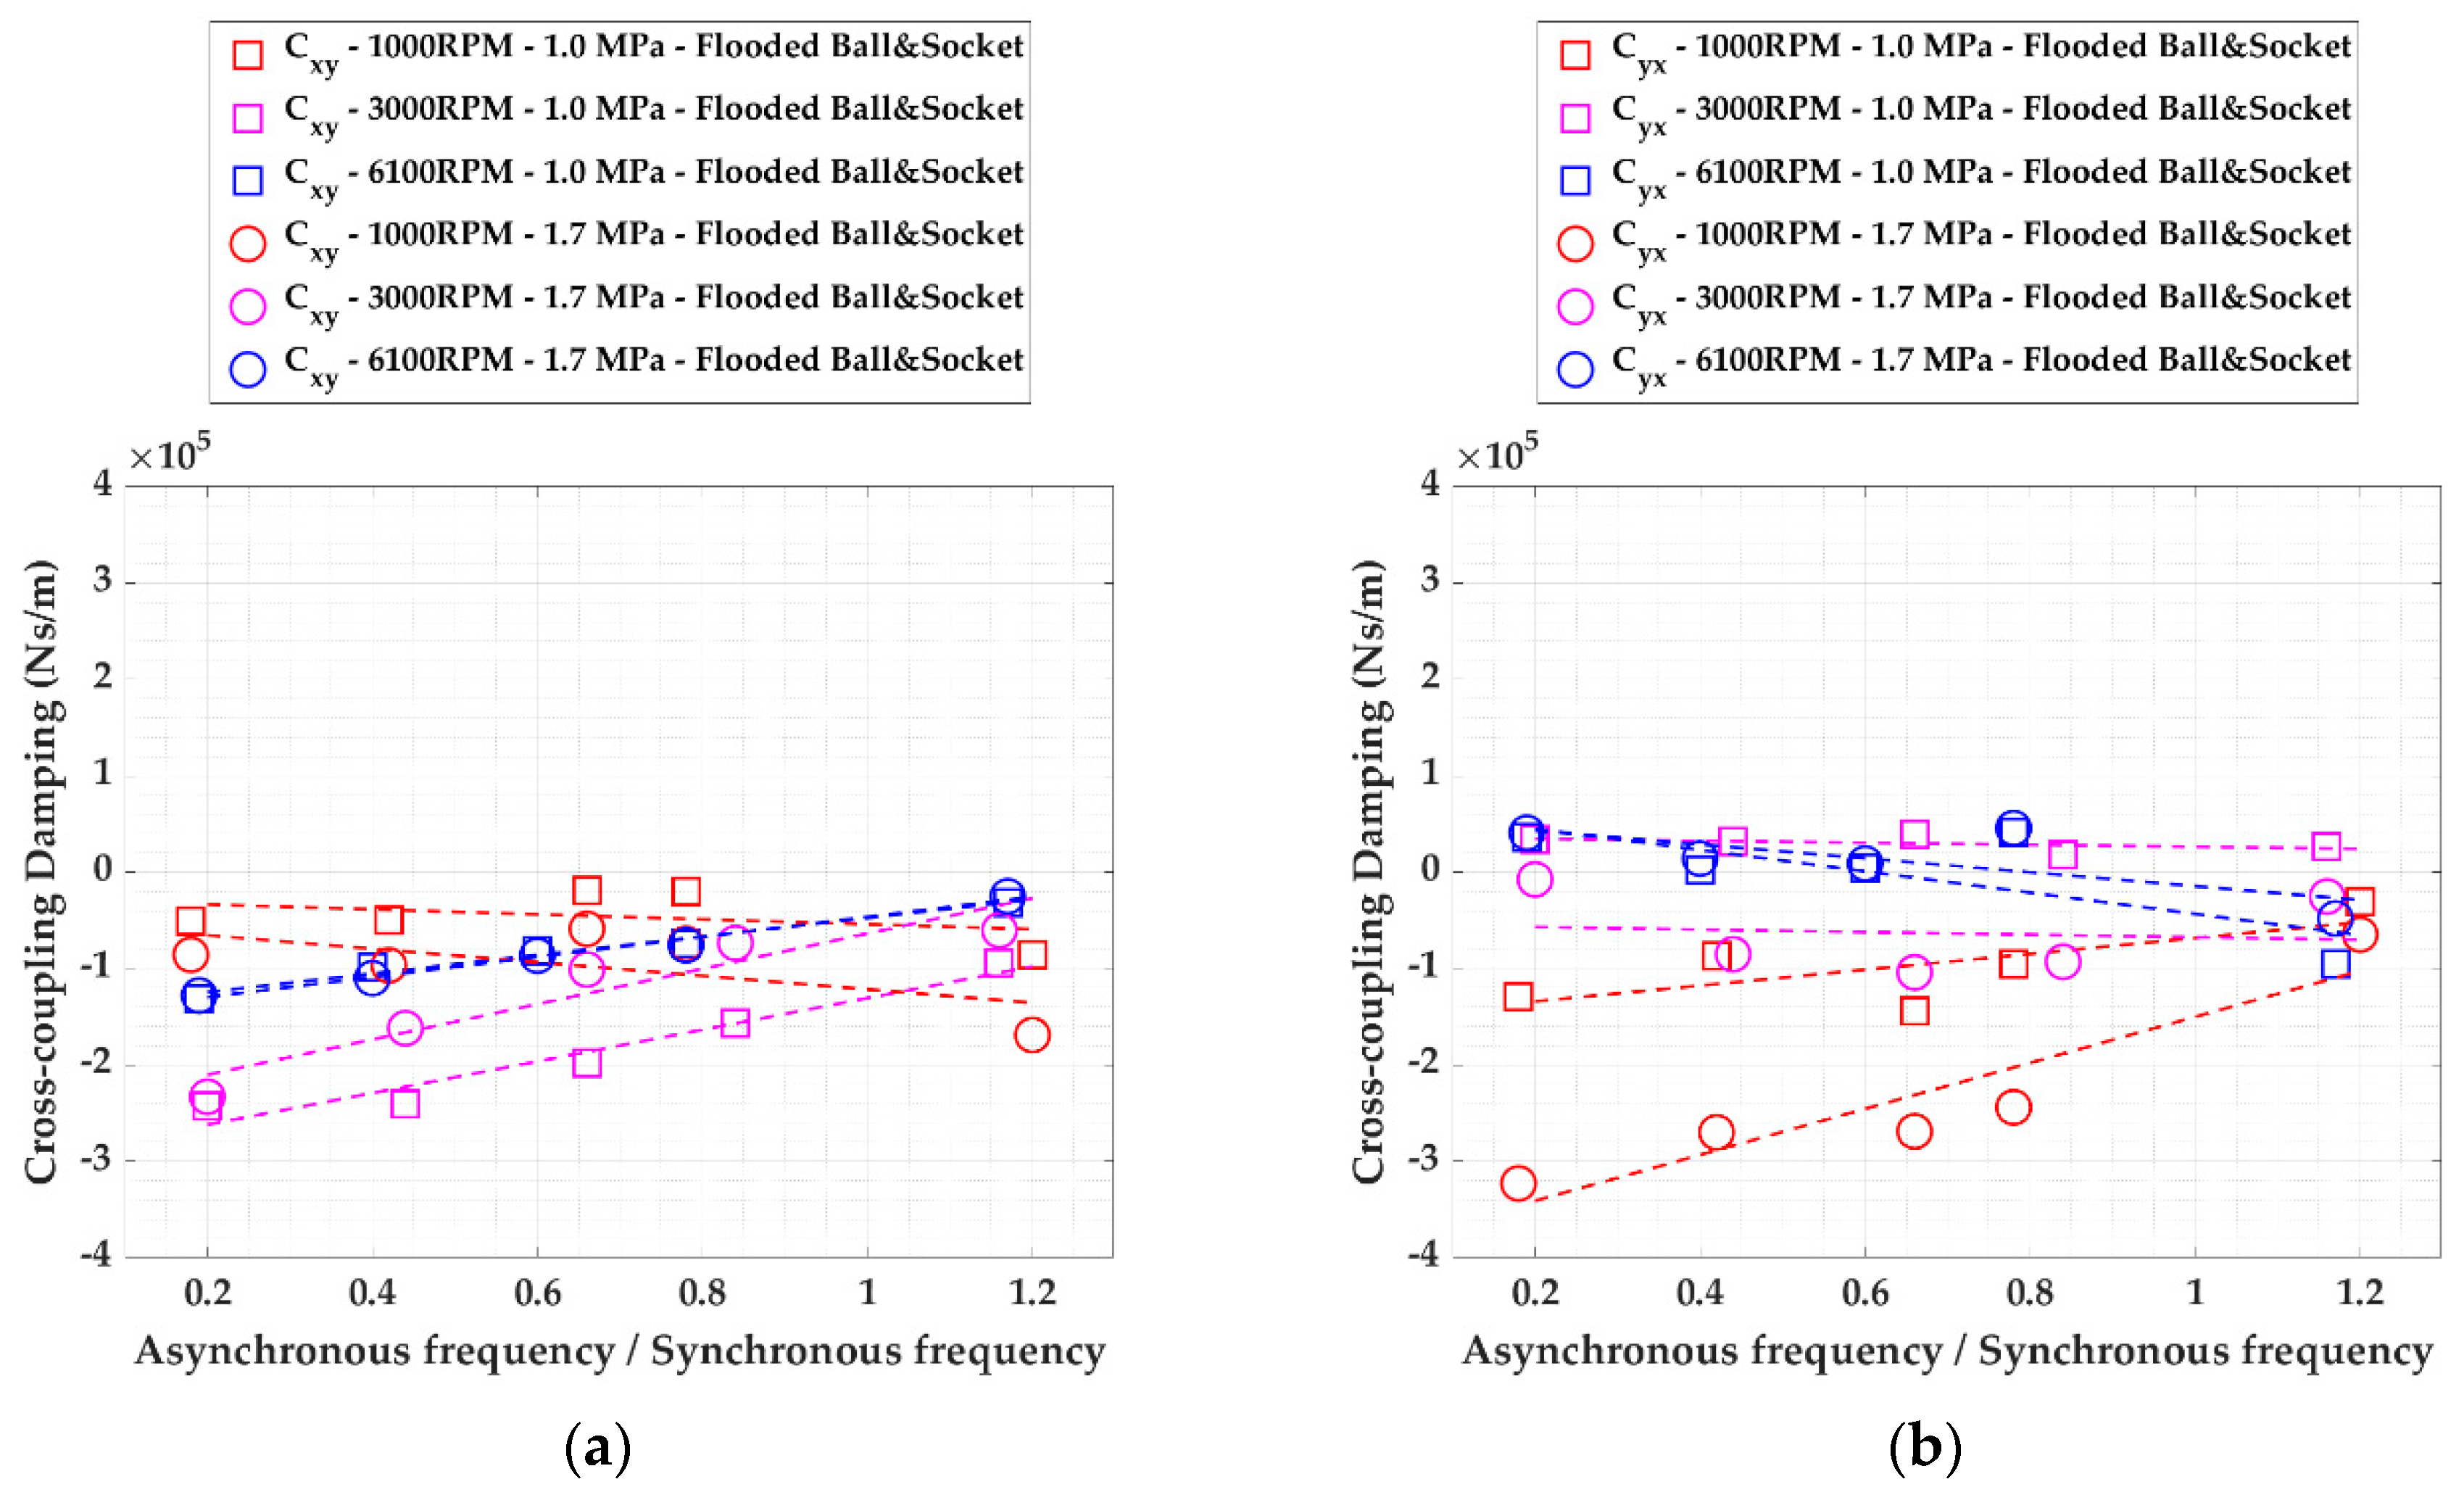
3.2.1. Asynchronous Coefficients

Examples of the plots of asynchronous dynamic coefficients as function of excitation frequency are shown in Figure 25 and Figure 26. In particular, direct stiffness and damping coefficients Kxx, Kyy, Cxx, and Cyy, for the Direct Lube Rocker Pivot bearing are reported in this section. The plots of the other coefficients can be found in Appendix A (Figure A1, Figure A2, Figure A3, Figure A4, Figure A5, Figure A6, Figure A7, Figure A8, Figure A9 and Figure A10). For each term, the measured stiffness at each excitation frequency is shown and compared with the line of best fit. Each picture presents the results of the two tested load conditions for three different speed values.
It can be noticed that the asynchronous coefficients trend is well represented through a linear interpolation and it is slightly influenced by frequency.
The influence of speed and static load will be more apparent in the plots of the synchronous coefficients in the next section but here also one can see that while the direct stiffness coefficients are more influenced by load, the direct damping ones are more influenced by speed.

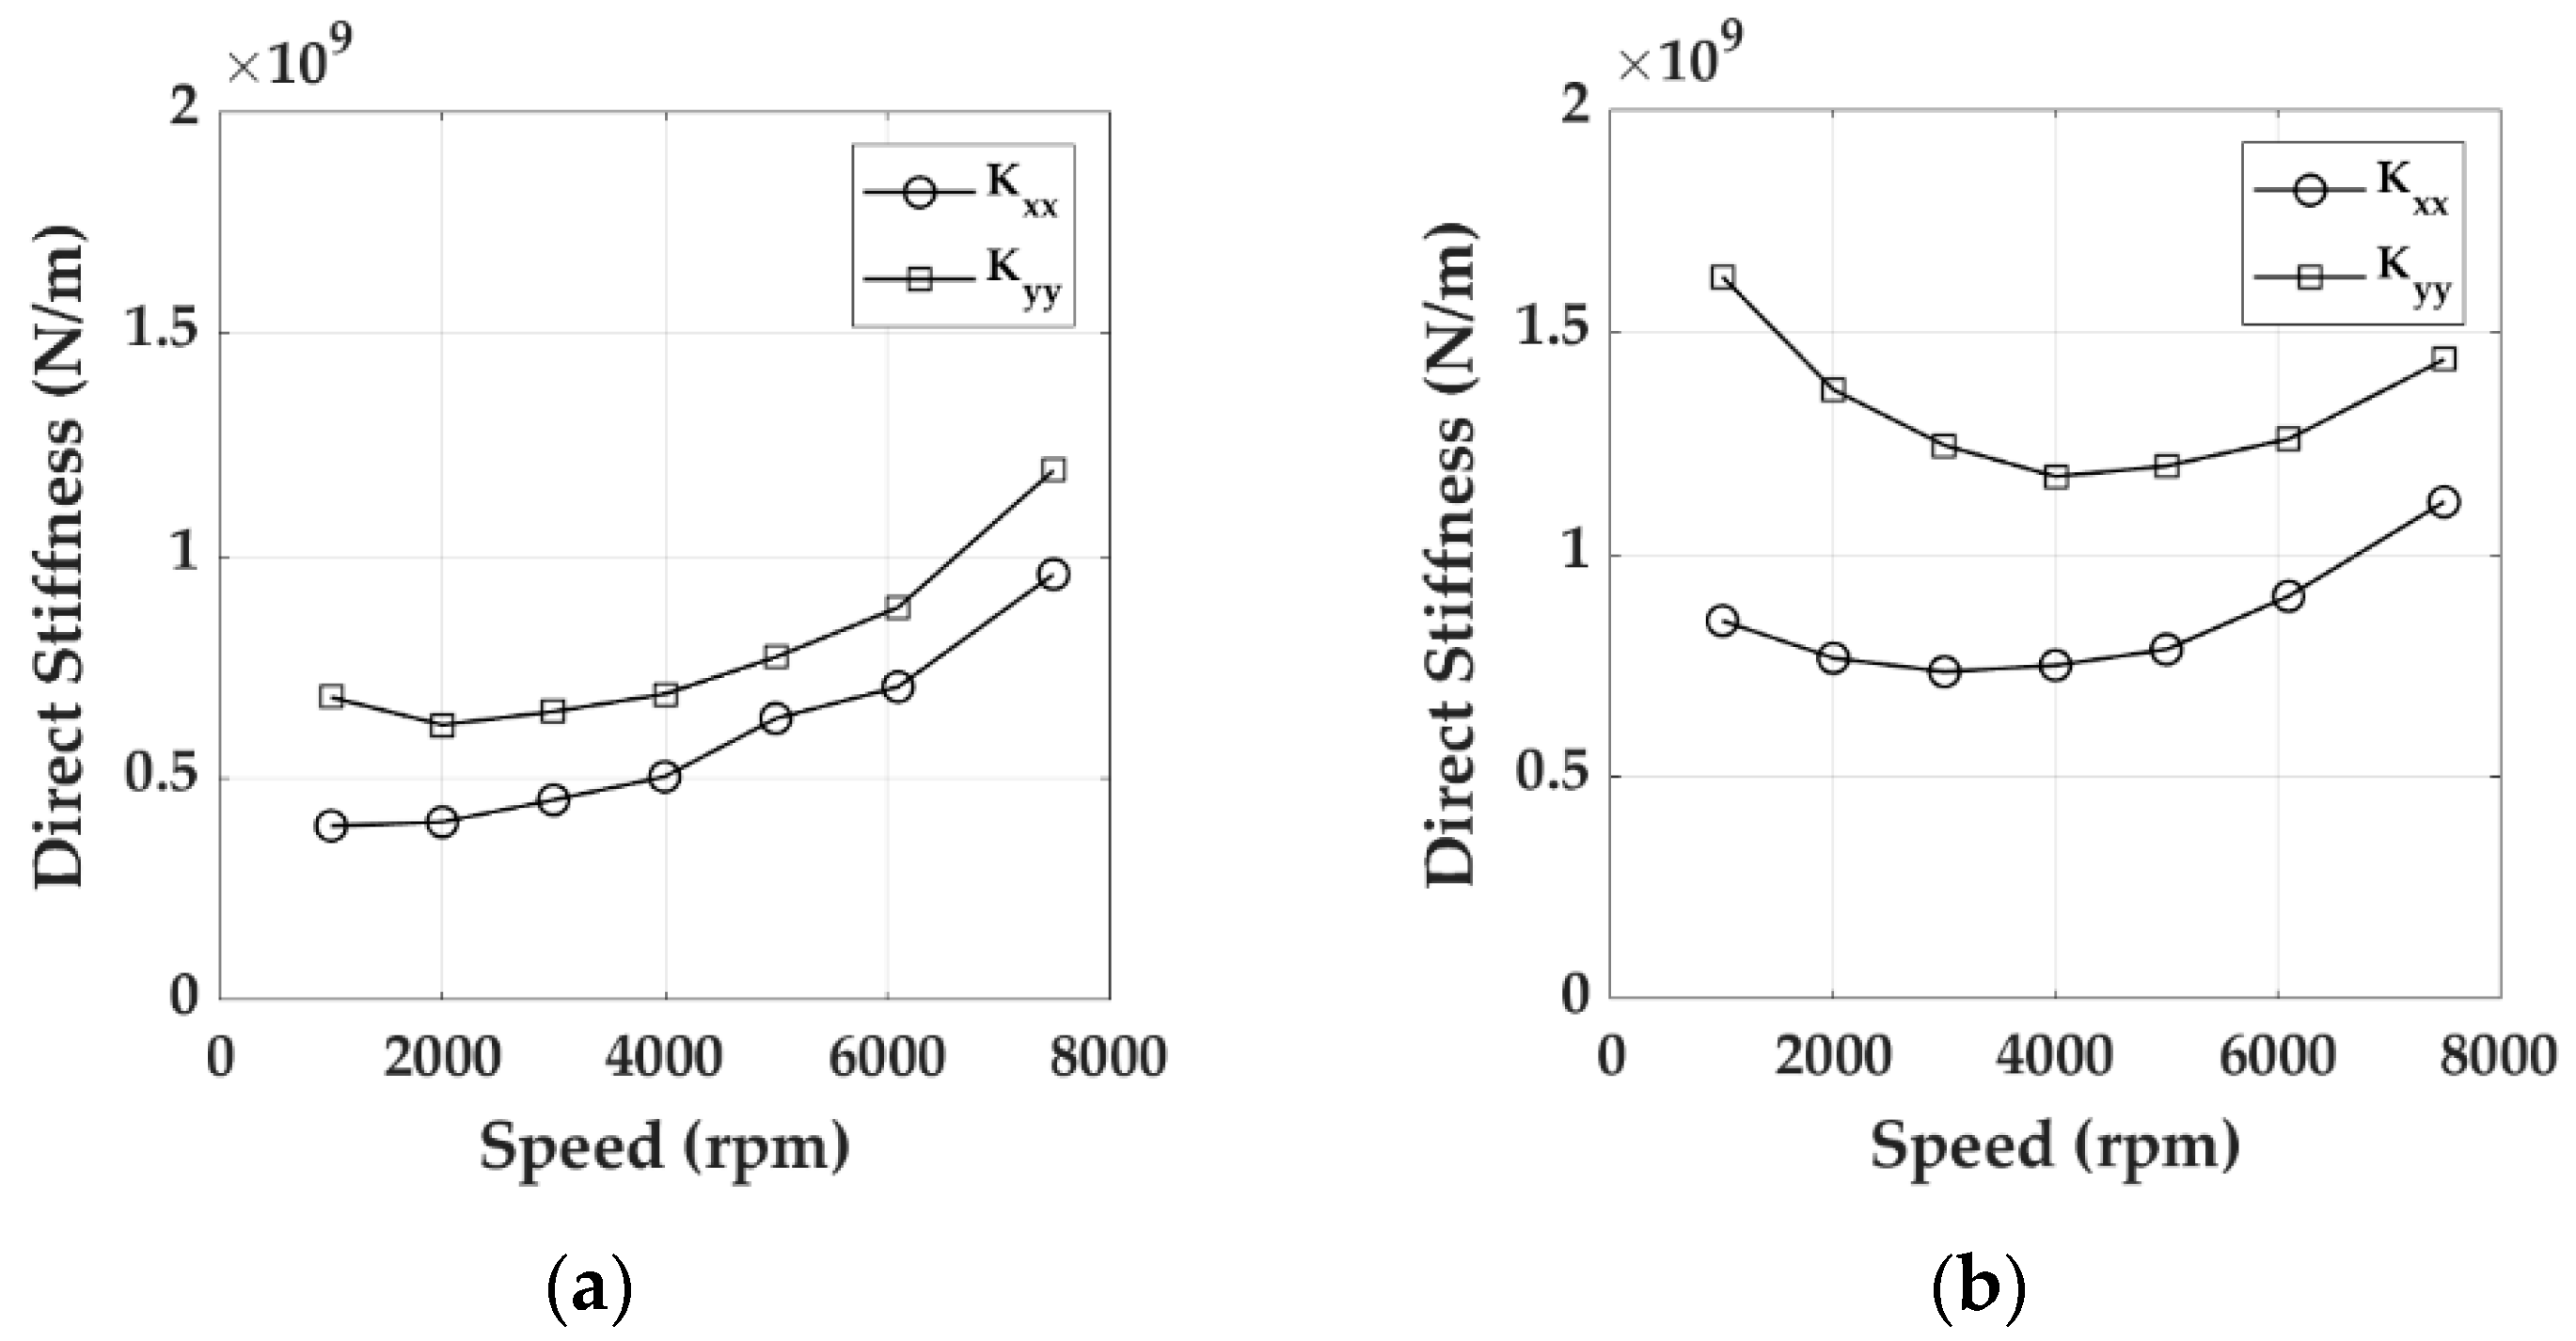
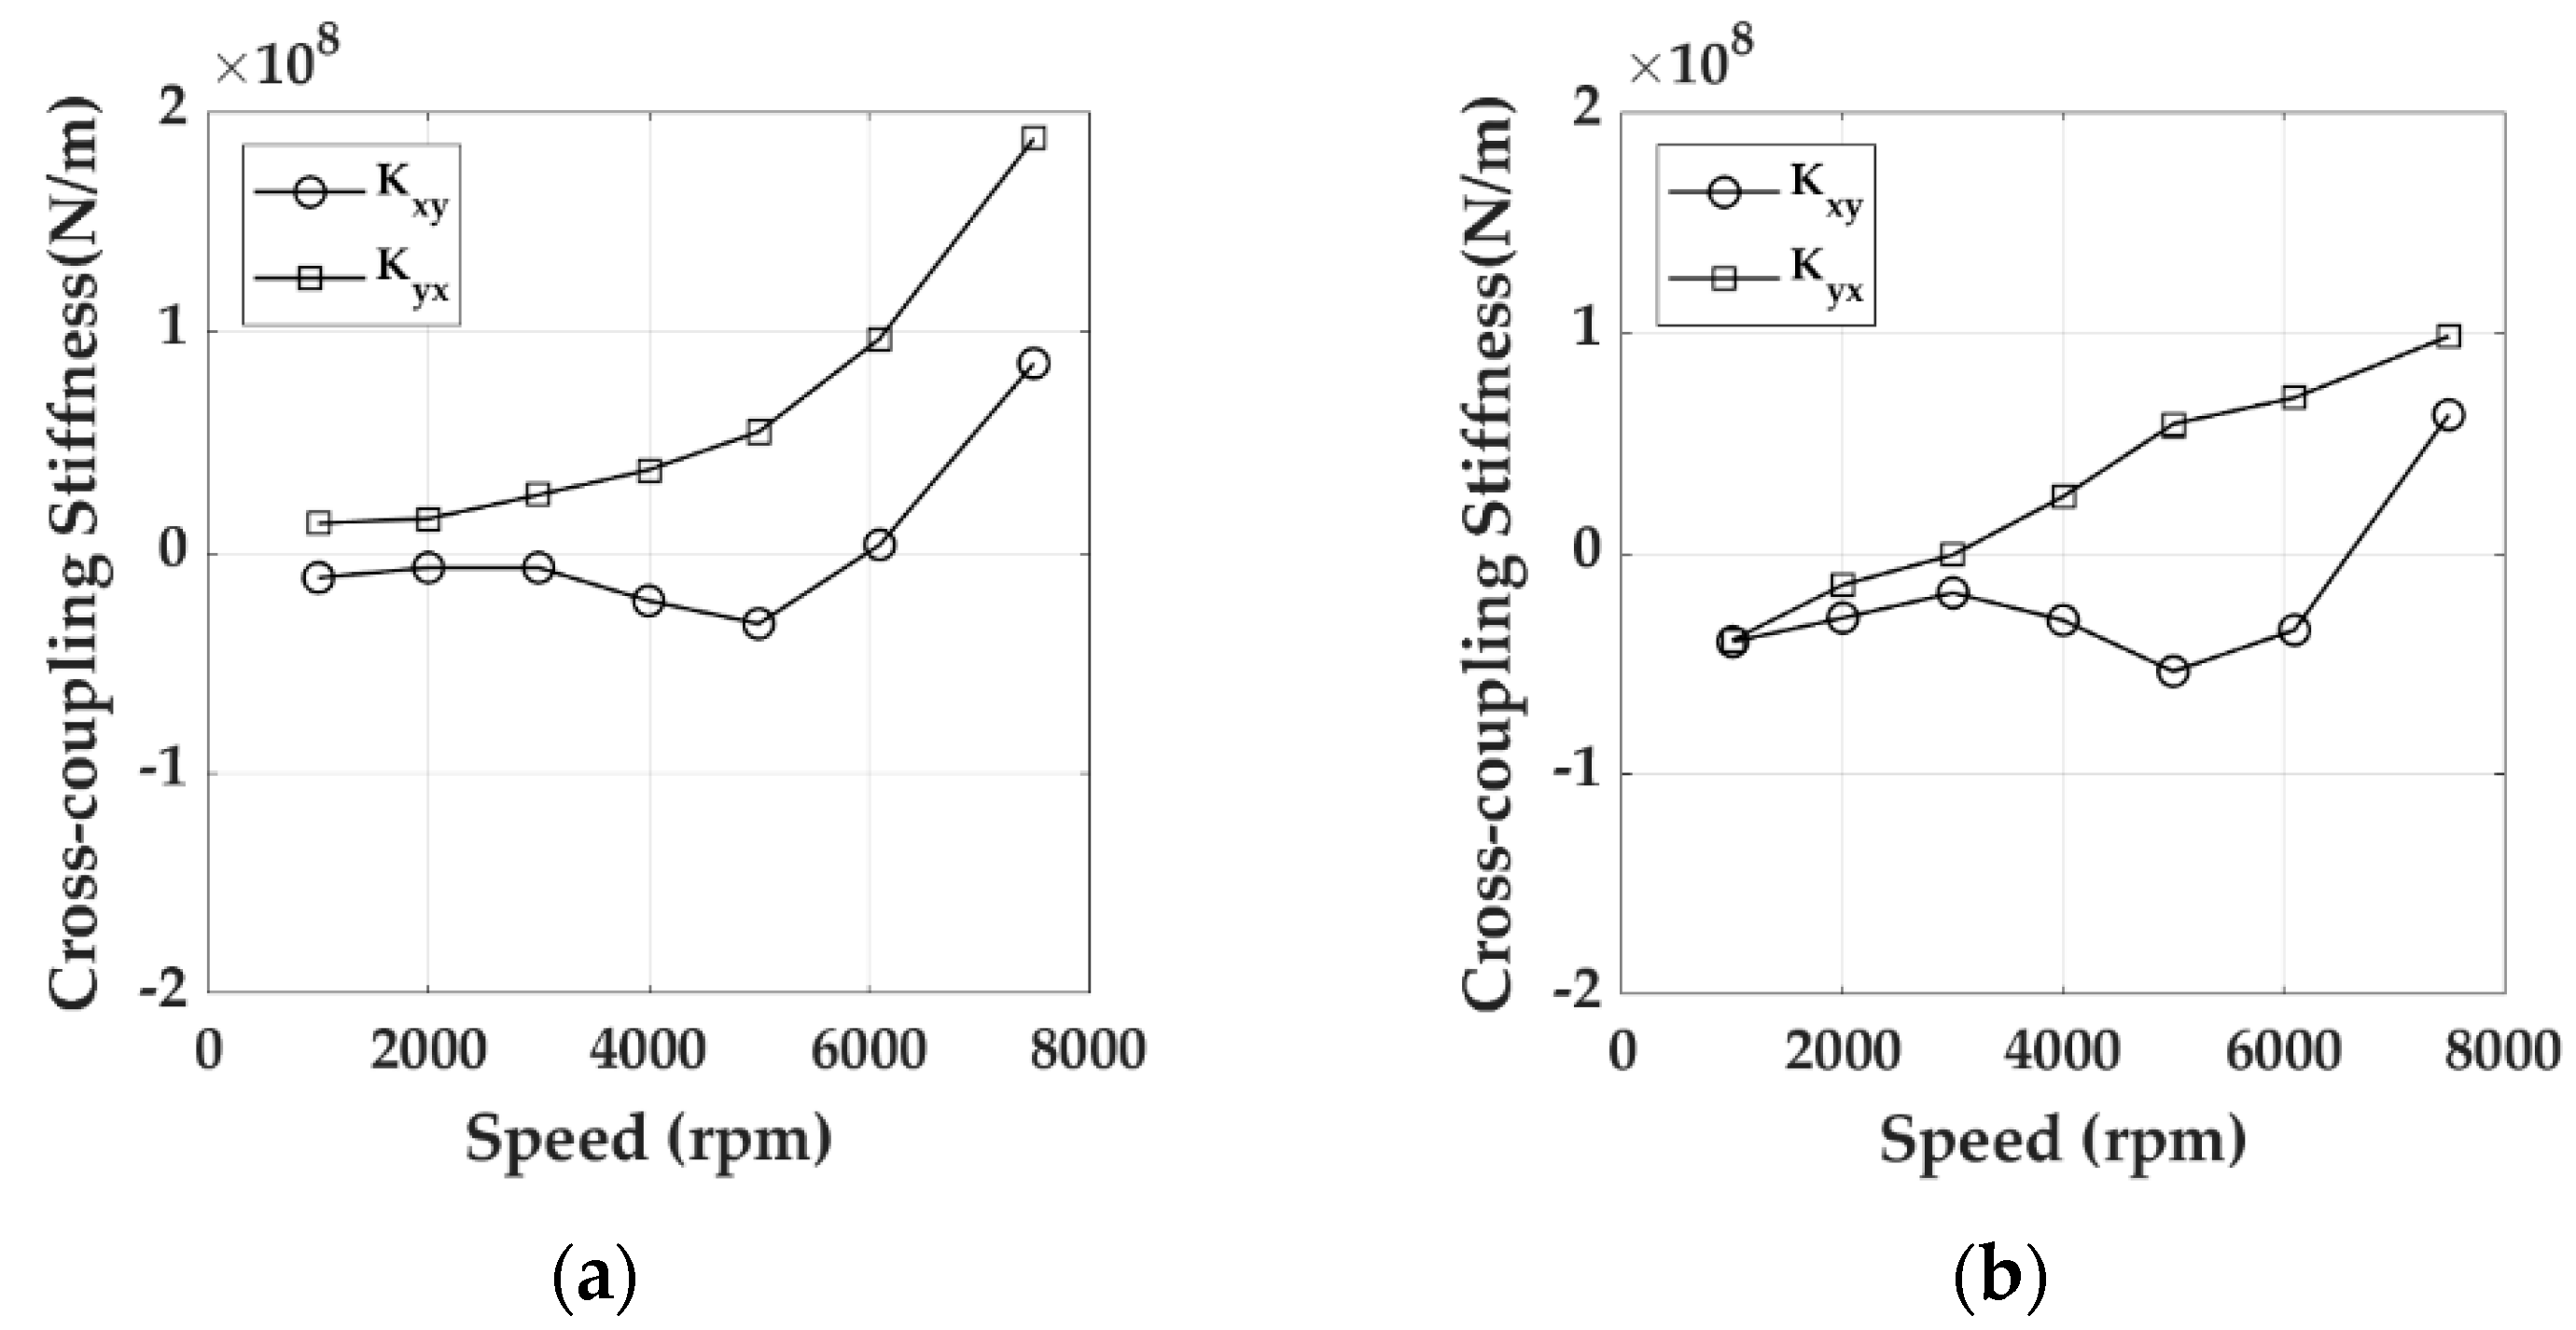
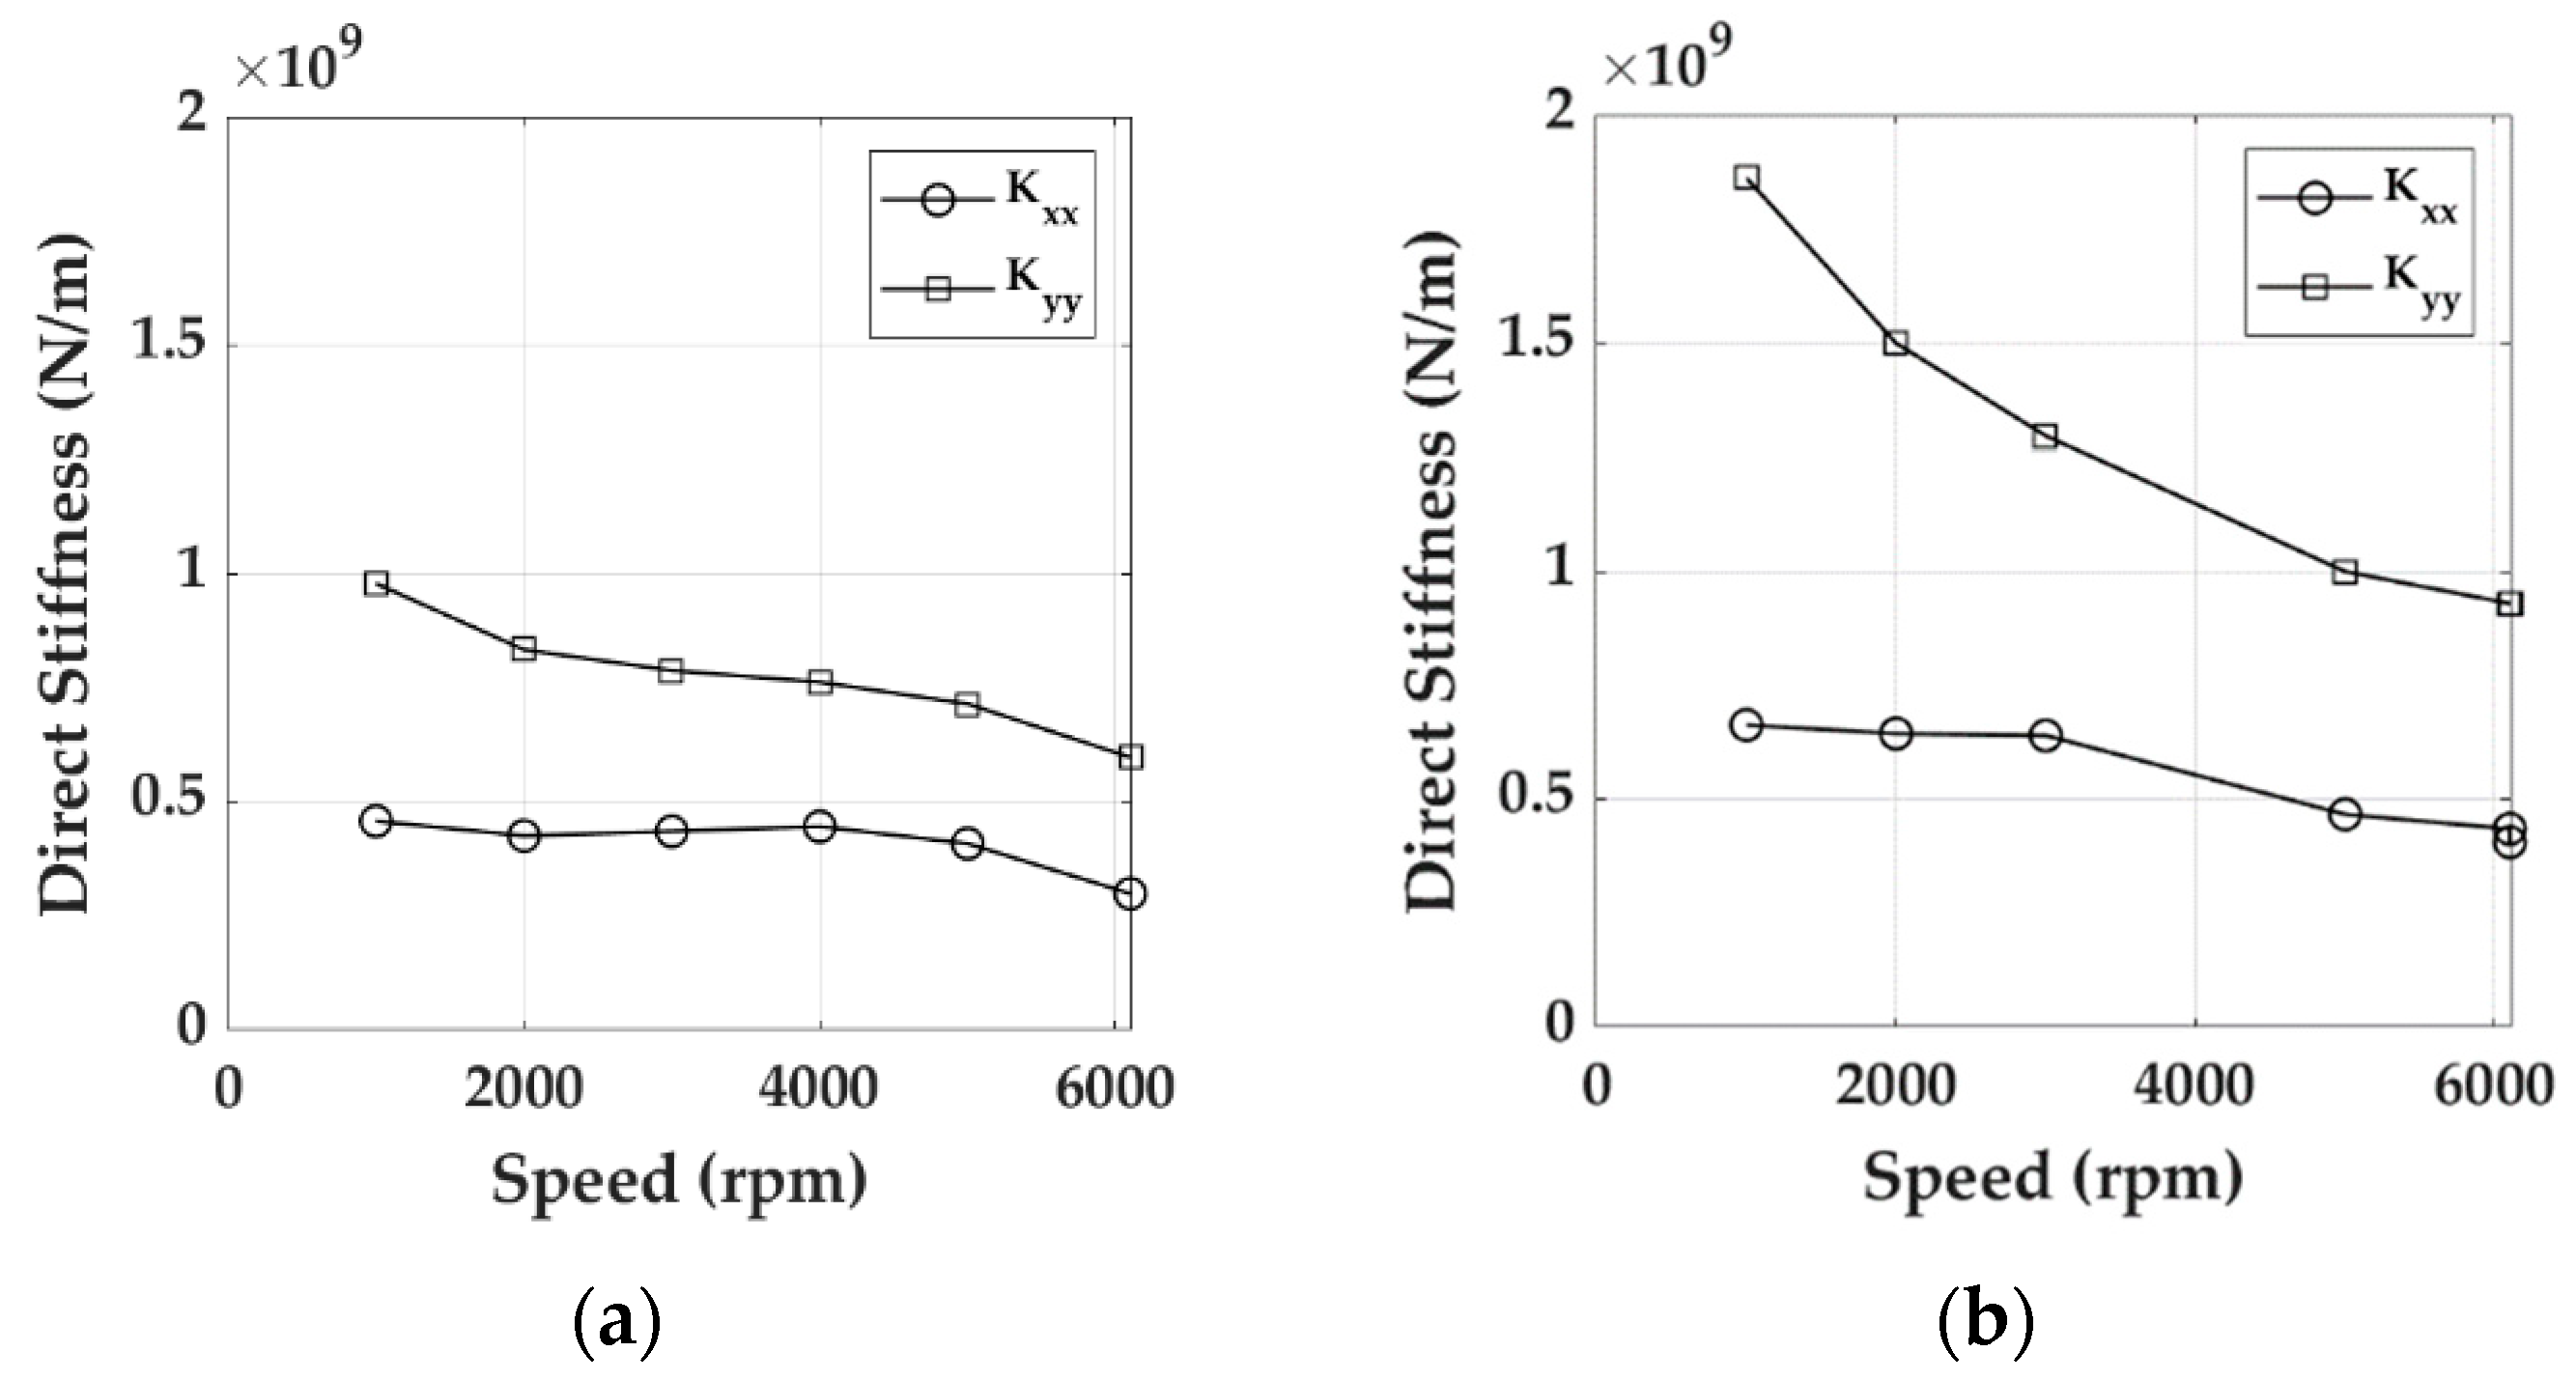
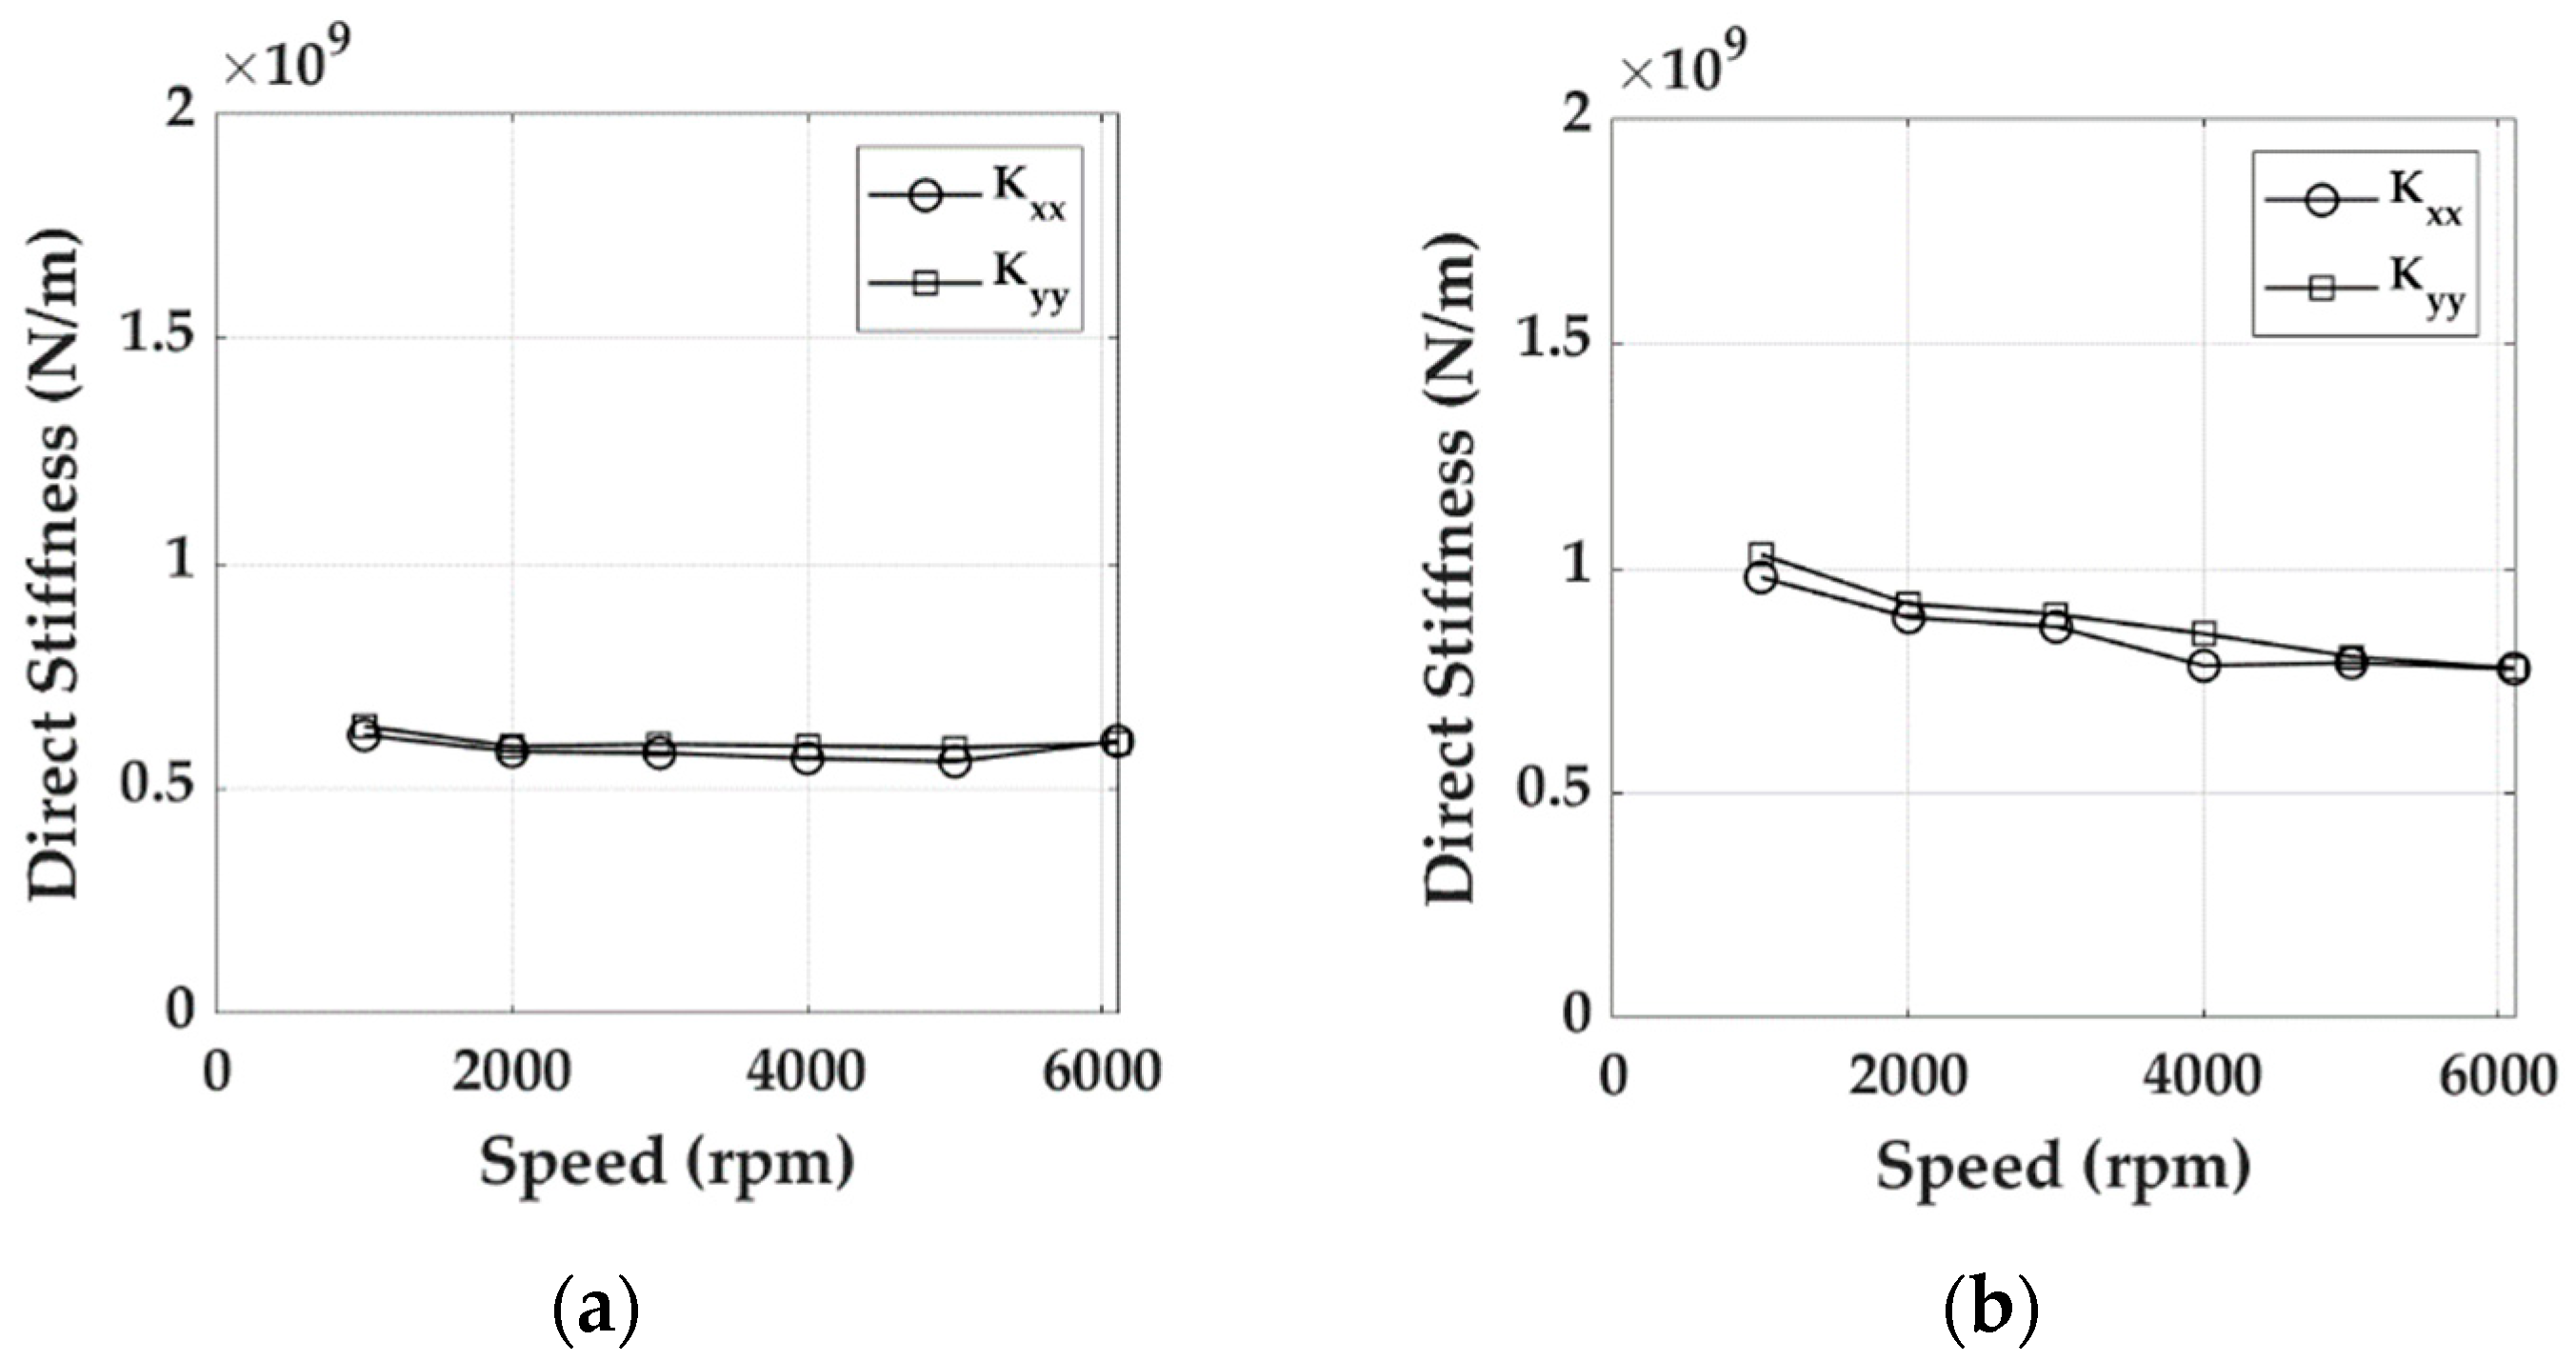
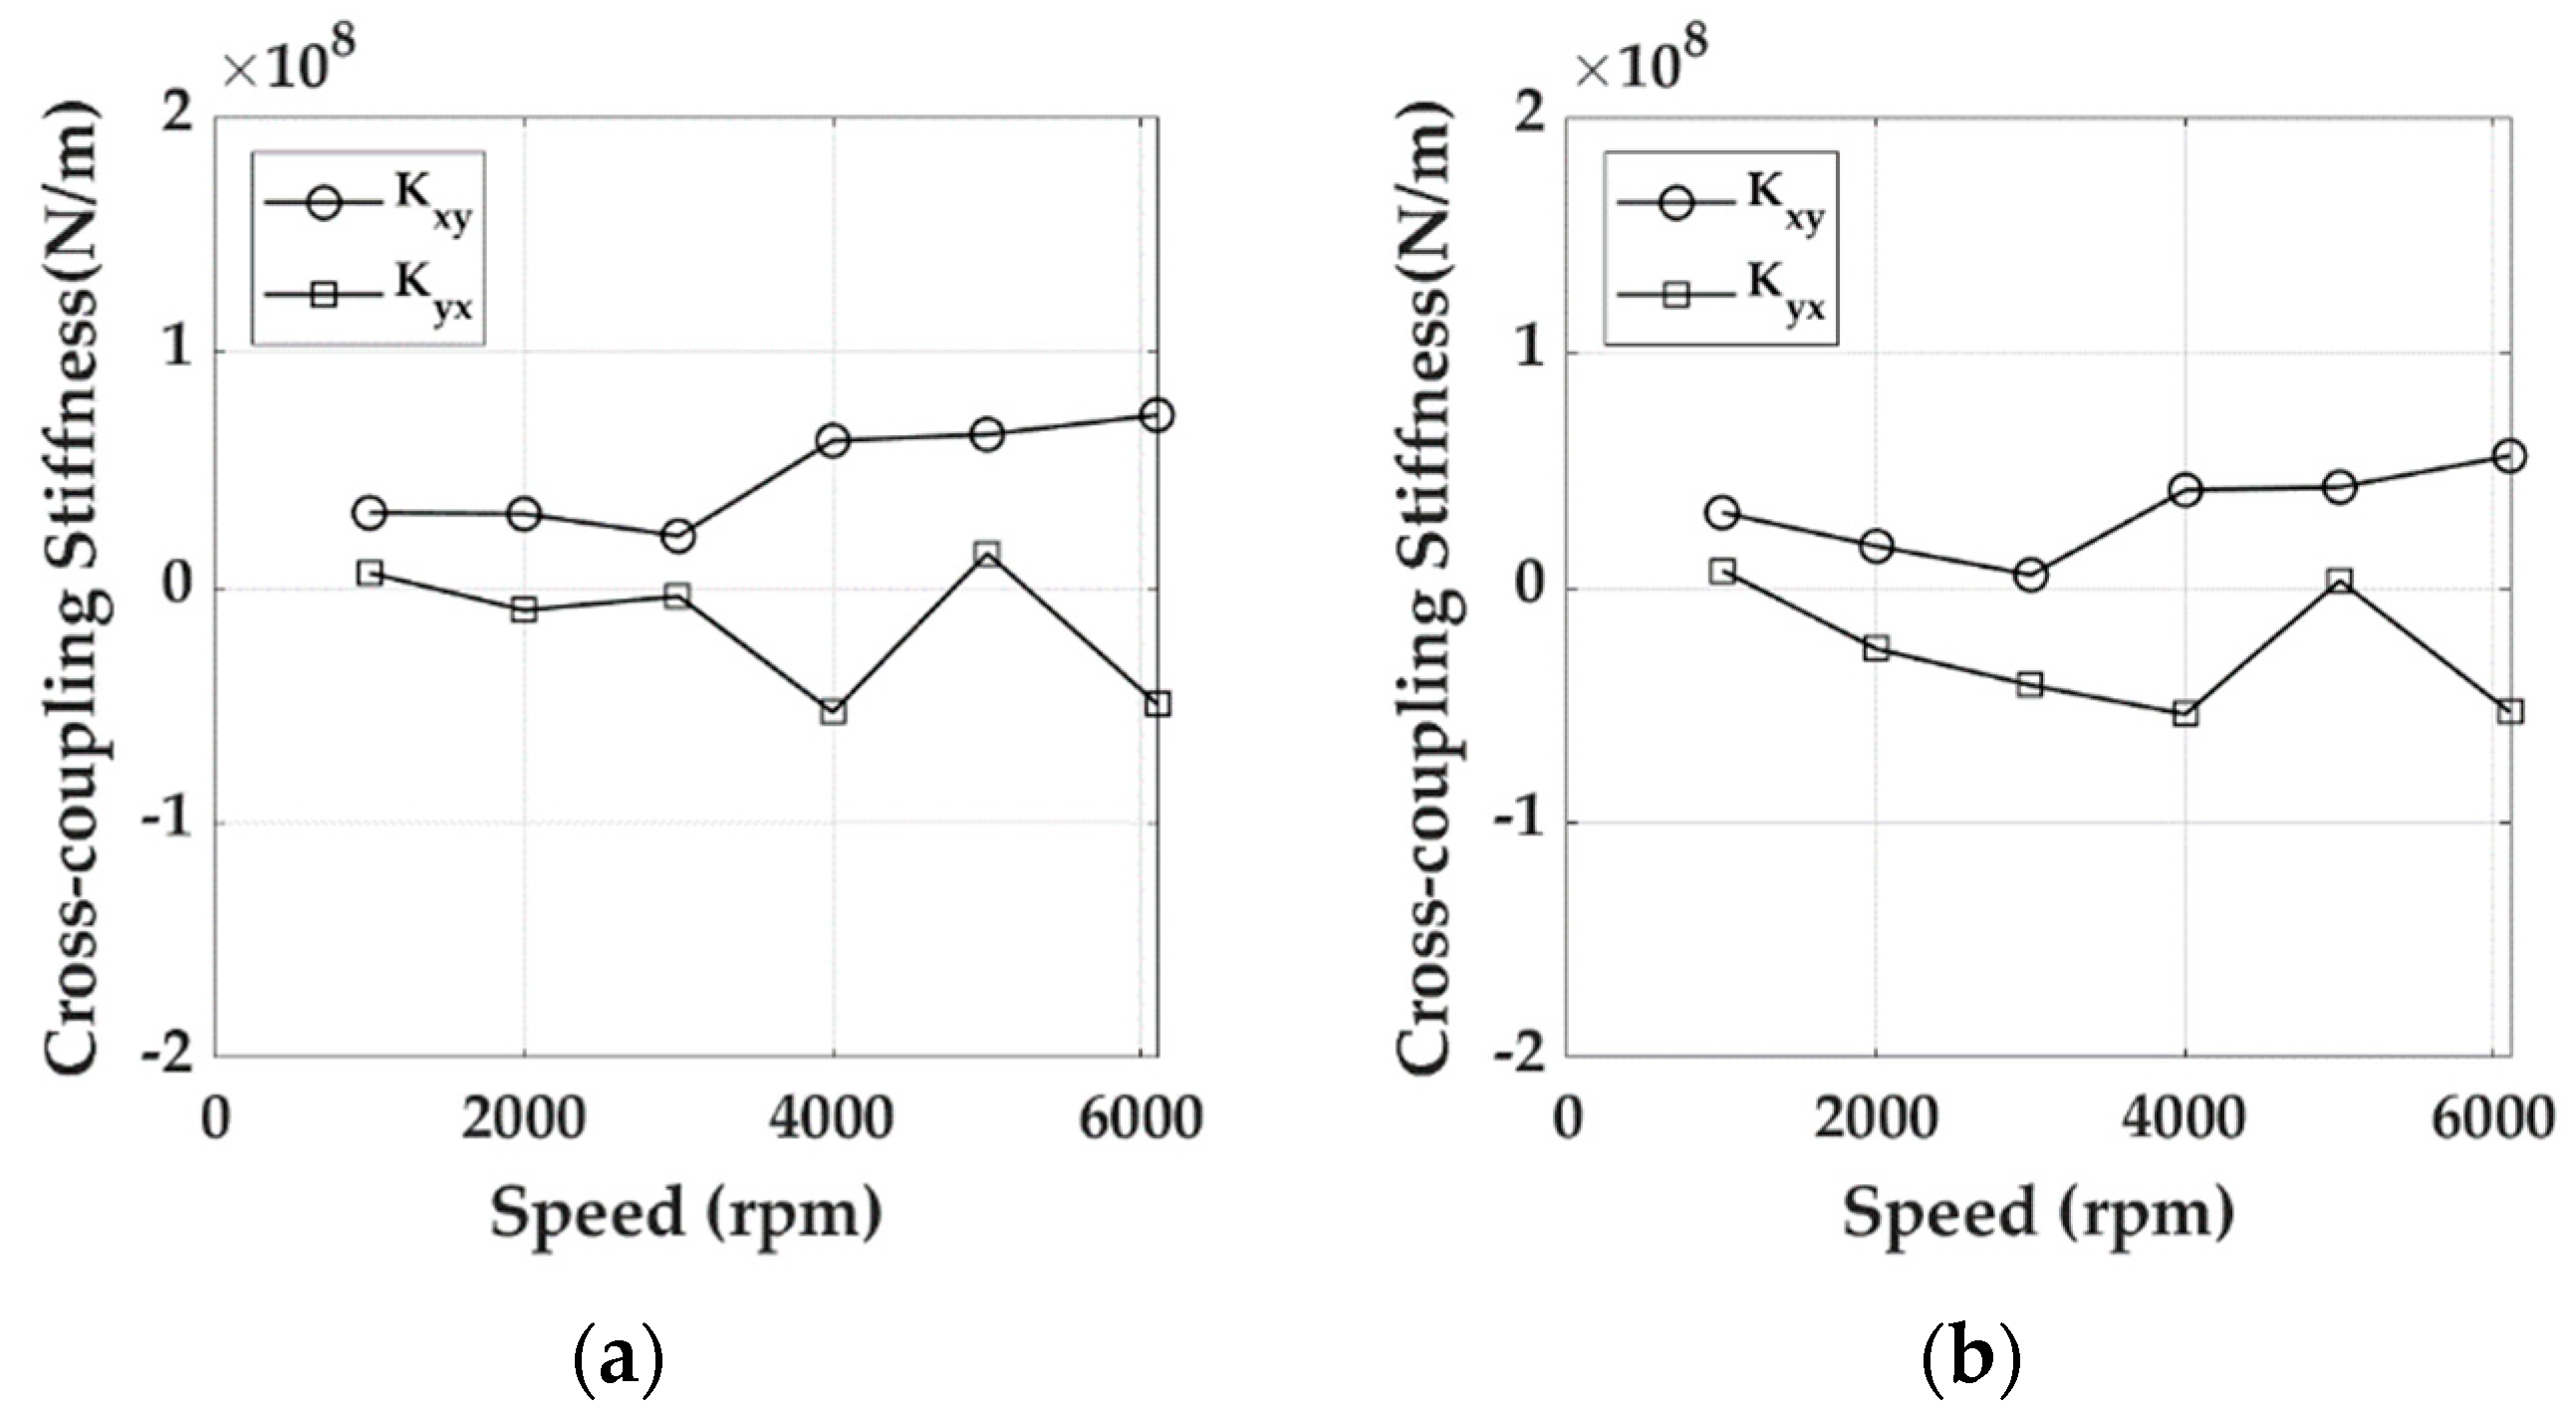
3.2.2. Synchronous Stiffness Coefficients

The synchronous stiffness coefficients were evaluated by averaging the asynchronous values at the excitation frequencies approximately equal to 0.8 and 1.2 the rotational frequency.
The dynamic results for the Direct Lube Rocker Pivot bearing in terms of synchronous direct stiffness coefficients are illustrated for the two load conditions in Figure 27 while the synchronous cross-coupling stiffness coefficients are plotted in Figure 28.
The asymmetric characteristics of the 5-pad-LBP bearing determines the anisotropy behavior with higher Kyy terms with respect to Kxx in both configurations (Figure 27). In the low load configuration, the dynamic direct stiffness coefficients are characterized by an increasing trend when the rotor speed is increasing. Such a trend is the result of the contribution of the upper pads that develop higher pressure profiles as the shaft eccentricity decreases with the speed. In the high load configuration, very high stiffness values are observed for low-speed values due to the noticeable contribution of the pivot stiffness to the total one. As the shaft position moves towards the center of the bearing, the direct stiffness values start to decrease until the 4000 rpm, where the laminar to turbulent transition occurs and an increasing trend of the dynamic stiffness properties with respect to speed can be observed.
As regards cross-coupling stiffness coefficients (Figure 28) they are one order of magnitude smaller than the direct ones. Kyx has a monotonic trend, increasing with speed while Kxy has a non-monotonic trend. The two coefficients have the opposite sign below 6000 rpm in both load cases and below 3000 rpm in the higher load case.
The dynamic results for the Flooded Rocker Pivot bearing in terms of synchronous direct stiffness coefficients are illustrated for the two load conditions in Figure 29 while the synchronous cross-coupling stiffness coefficients are plotted in Figure 30.
As highlighted for the previous bearing, an asymmetric behavior between Kxx and Kyy coefficients is observed (Figure 29) due to the intrinsic characteristics of the 5-pad-LBP configuration. Differently from the previous case, in both low (1.3 MPa) and high (2.1 MPa) load configurations, the dynamic stiffnesses are characterized by a decreasing trend when the rotor speed is increasing. Due to the high eccentricity values in both cases, the upper pads do not develop a high-pressure film.
As regards cross-coupling stiffness coefficients (Figure 30), again, they are one order of magnitude smaller than the direct ones. The plot of the lower load conditions shows how the cross-coupling stiffnesses increase in magnitude with the speed until 5000 rpm and then decrease quickly. A similar behavior is observed for a higher load, but in this case, the peak in the cross-coupling coefficients is located close to 3000 rpm. Both coefficients are positive except below 2000 rpm for the higher load condition where they have the opposite sign.
The dynamic results for the Flooded Ball & Socket Pivot bearing in terms of synchronous direct stiffness Kxx and Kyy are shown for the two load conditions in Figure 31.
The symmetric behavior of the 4-pad-LBP bearing solution determines the almost isotropic behavior of the direct stiffnesses in both configurations. In the low load configuration, the Kxx and Kyy dynamic stiffness are characterized by an almost constant trend when the rotor speed is increasing. In the high load configuration, small differences are observed between the two direction terms with the Kxx characterized by a higher value that can be explained with the higher pivot stiffness in the vertical direction. A change in decrease rate can be observed in the range between 3000 and 4000 rpm where the laminar to turbulent regime transition is expected to occur.
As regards cross-coupling stiffness coefficients (Figure 32), again, they are one order of magnitude smaller than the direct ones and have a non-monotonic trend with speed. In almost the entire speed range, they have the opposite sign.

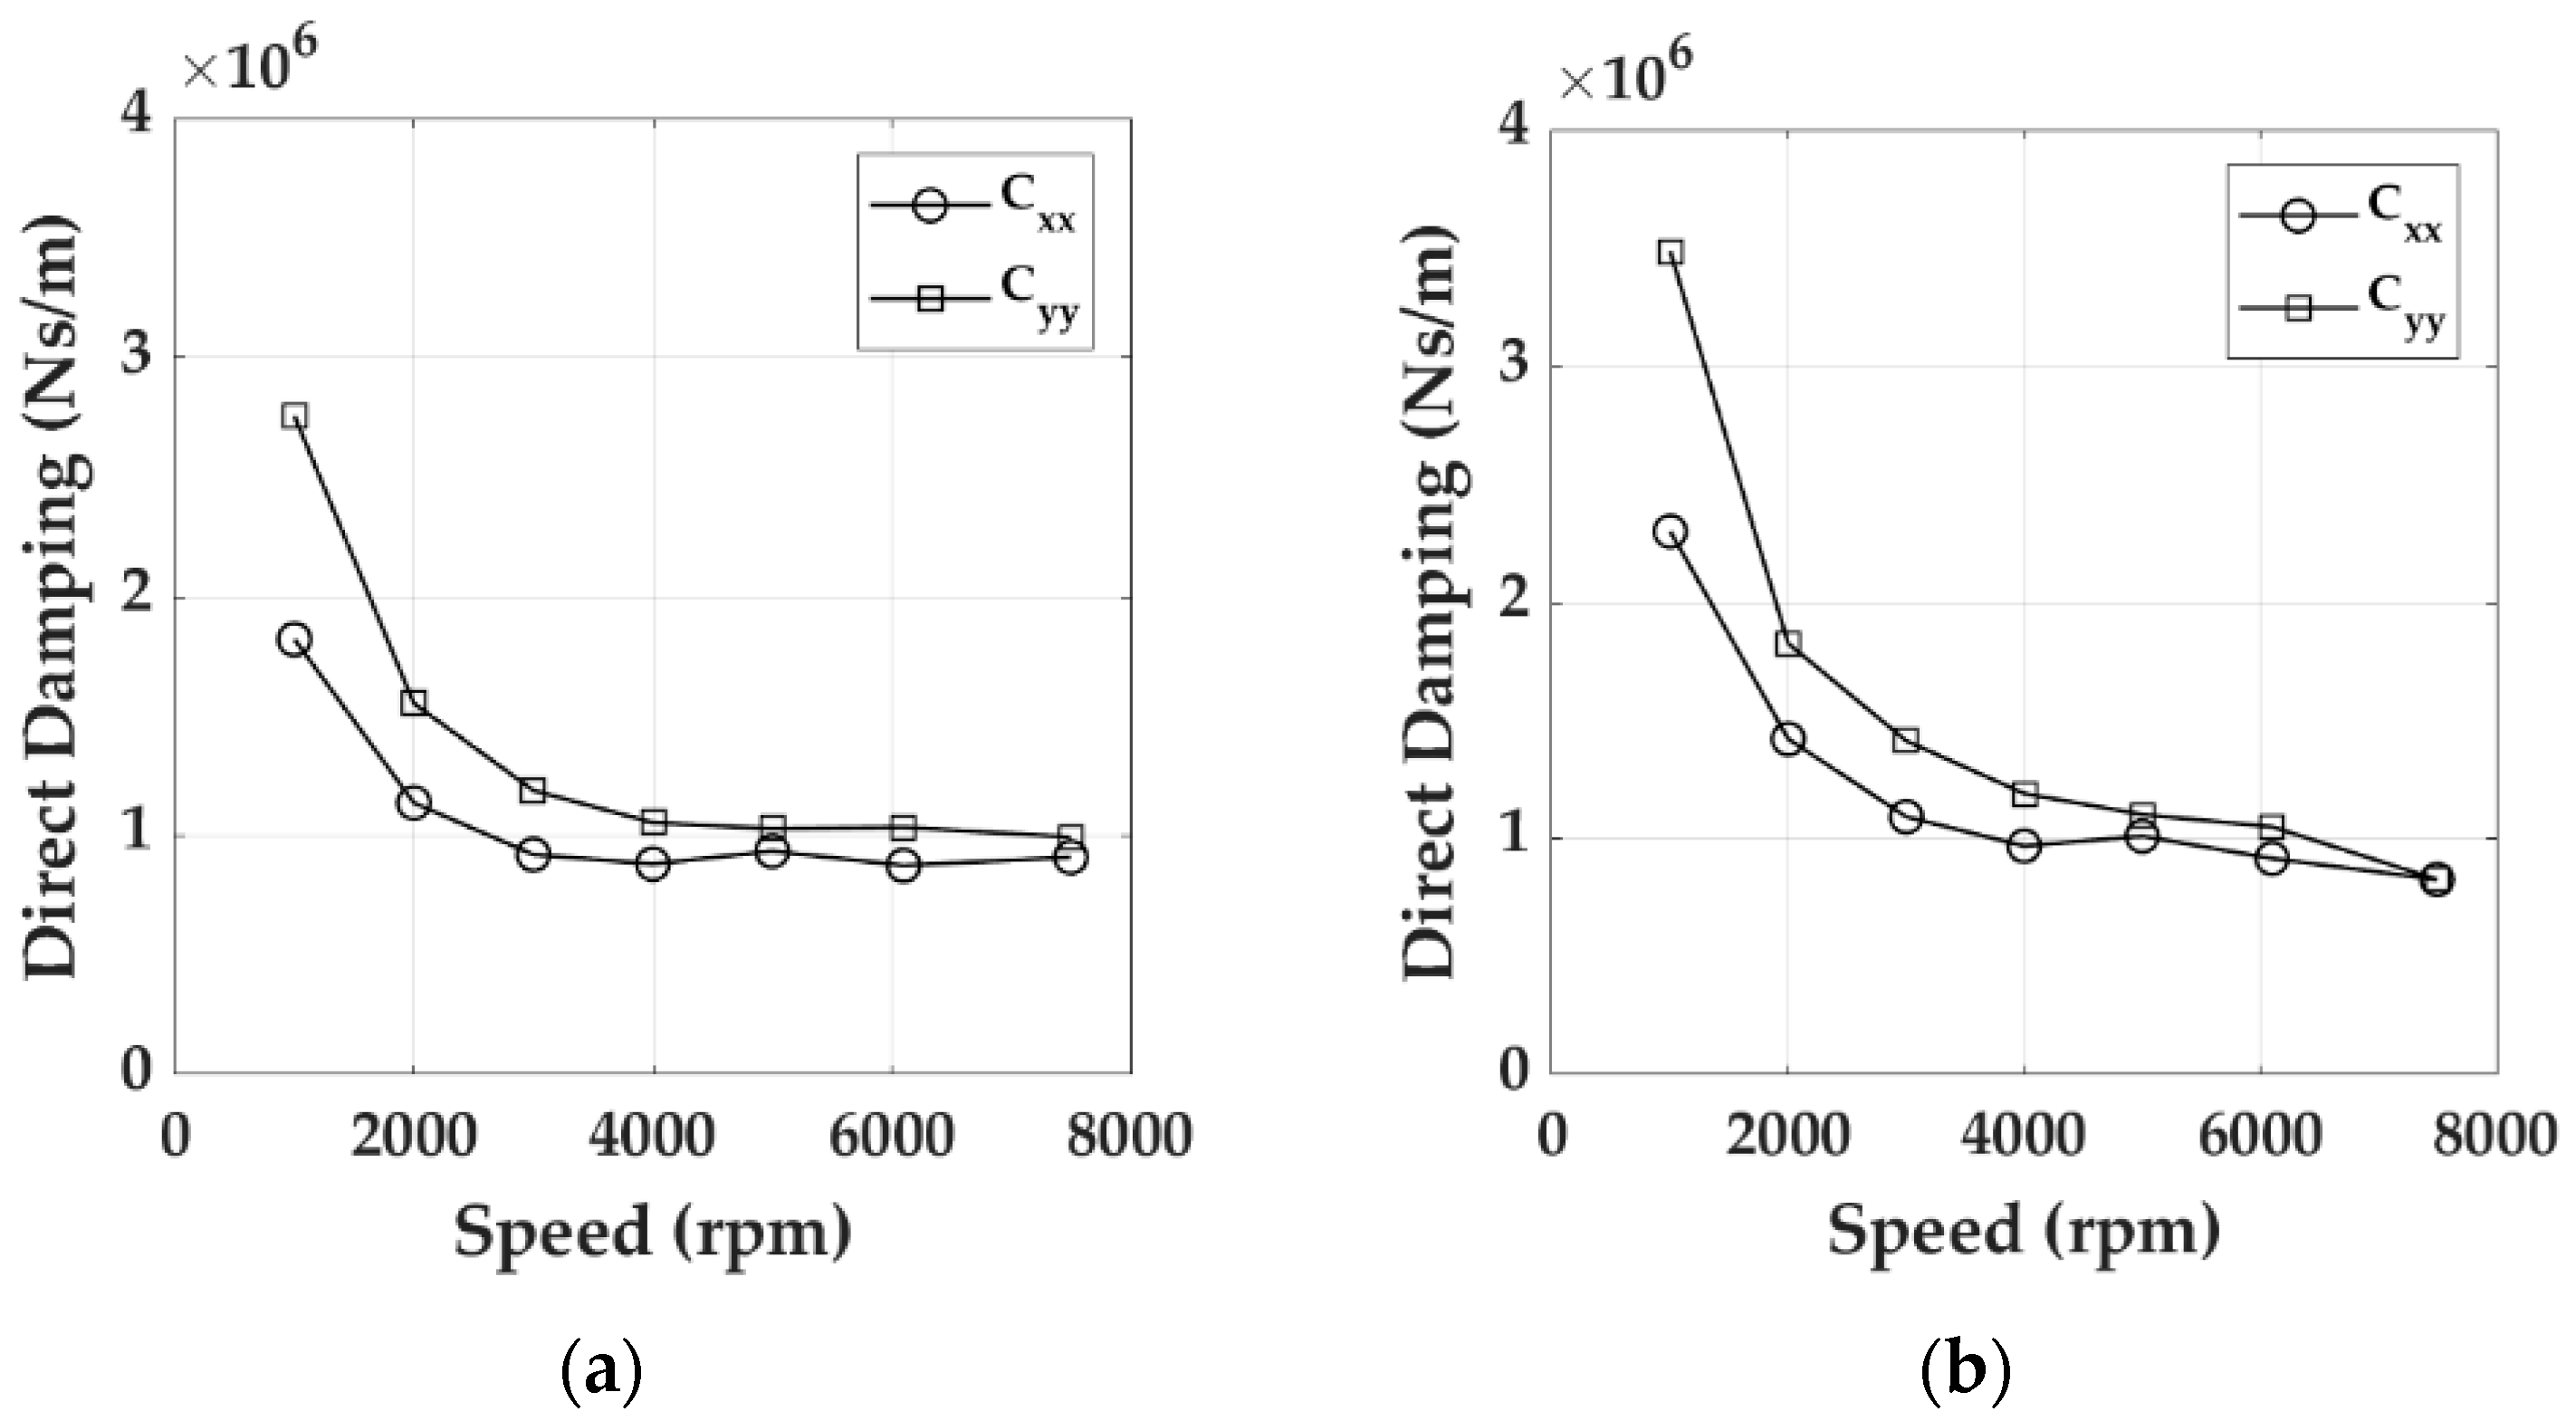
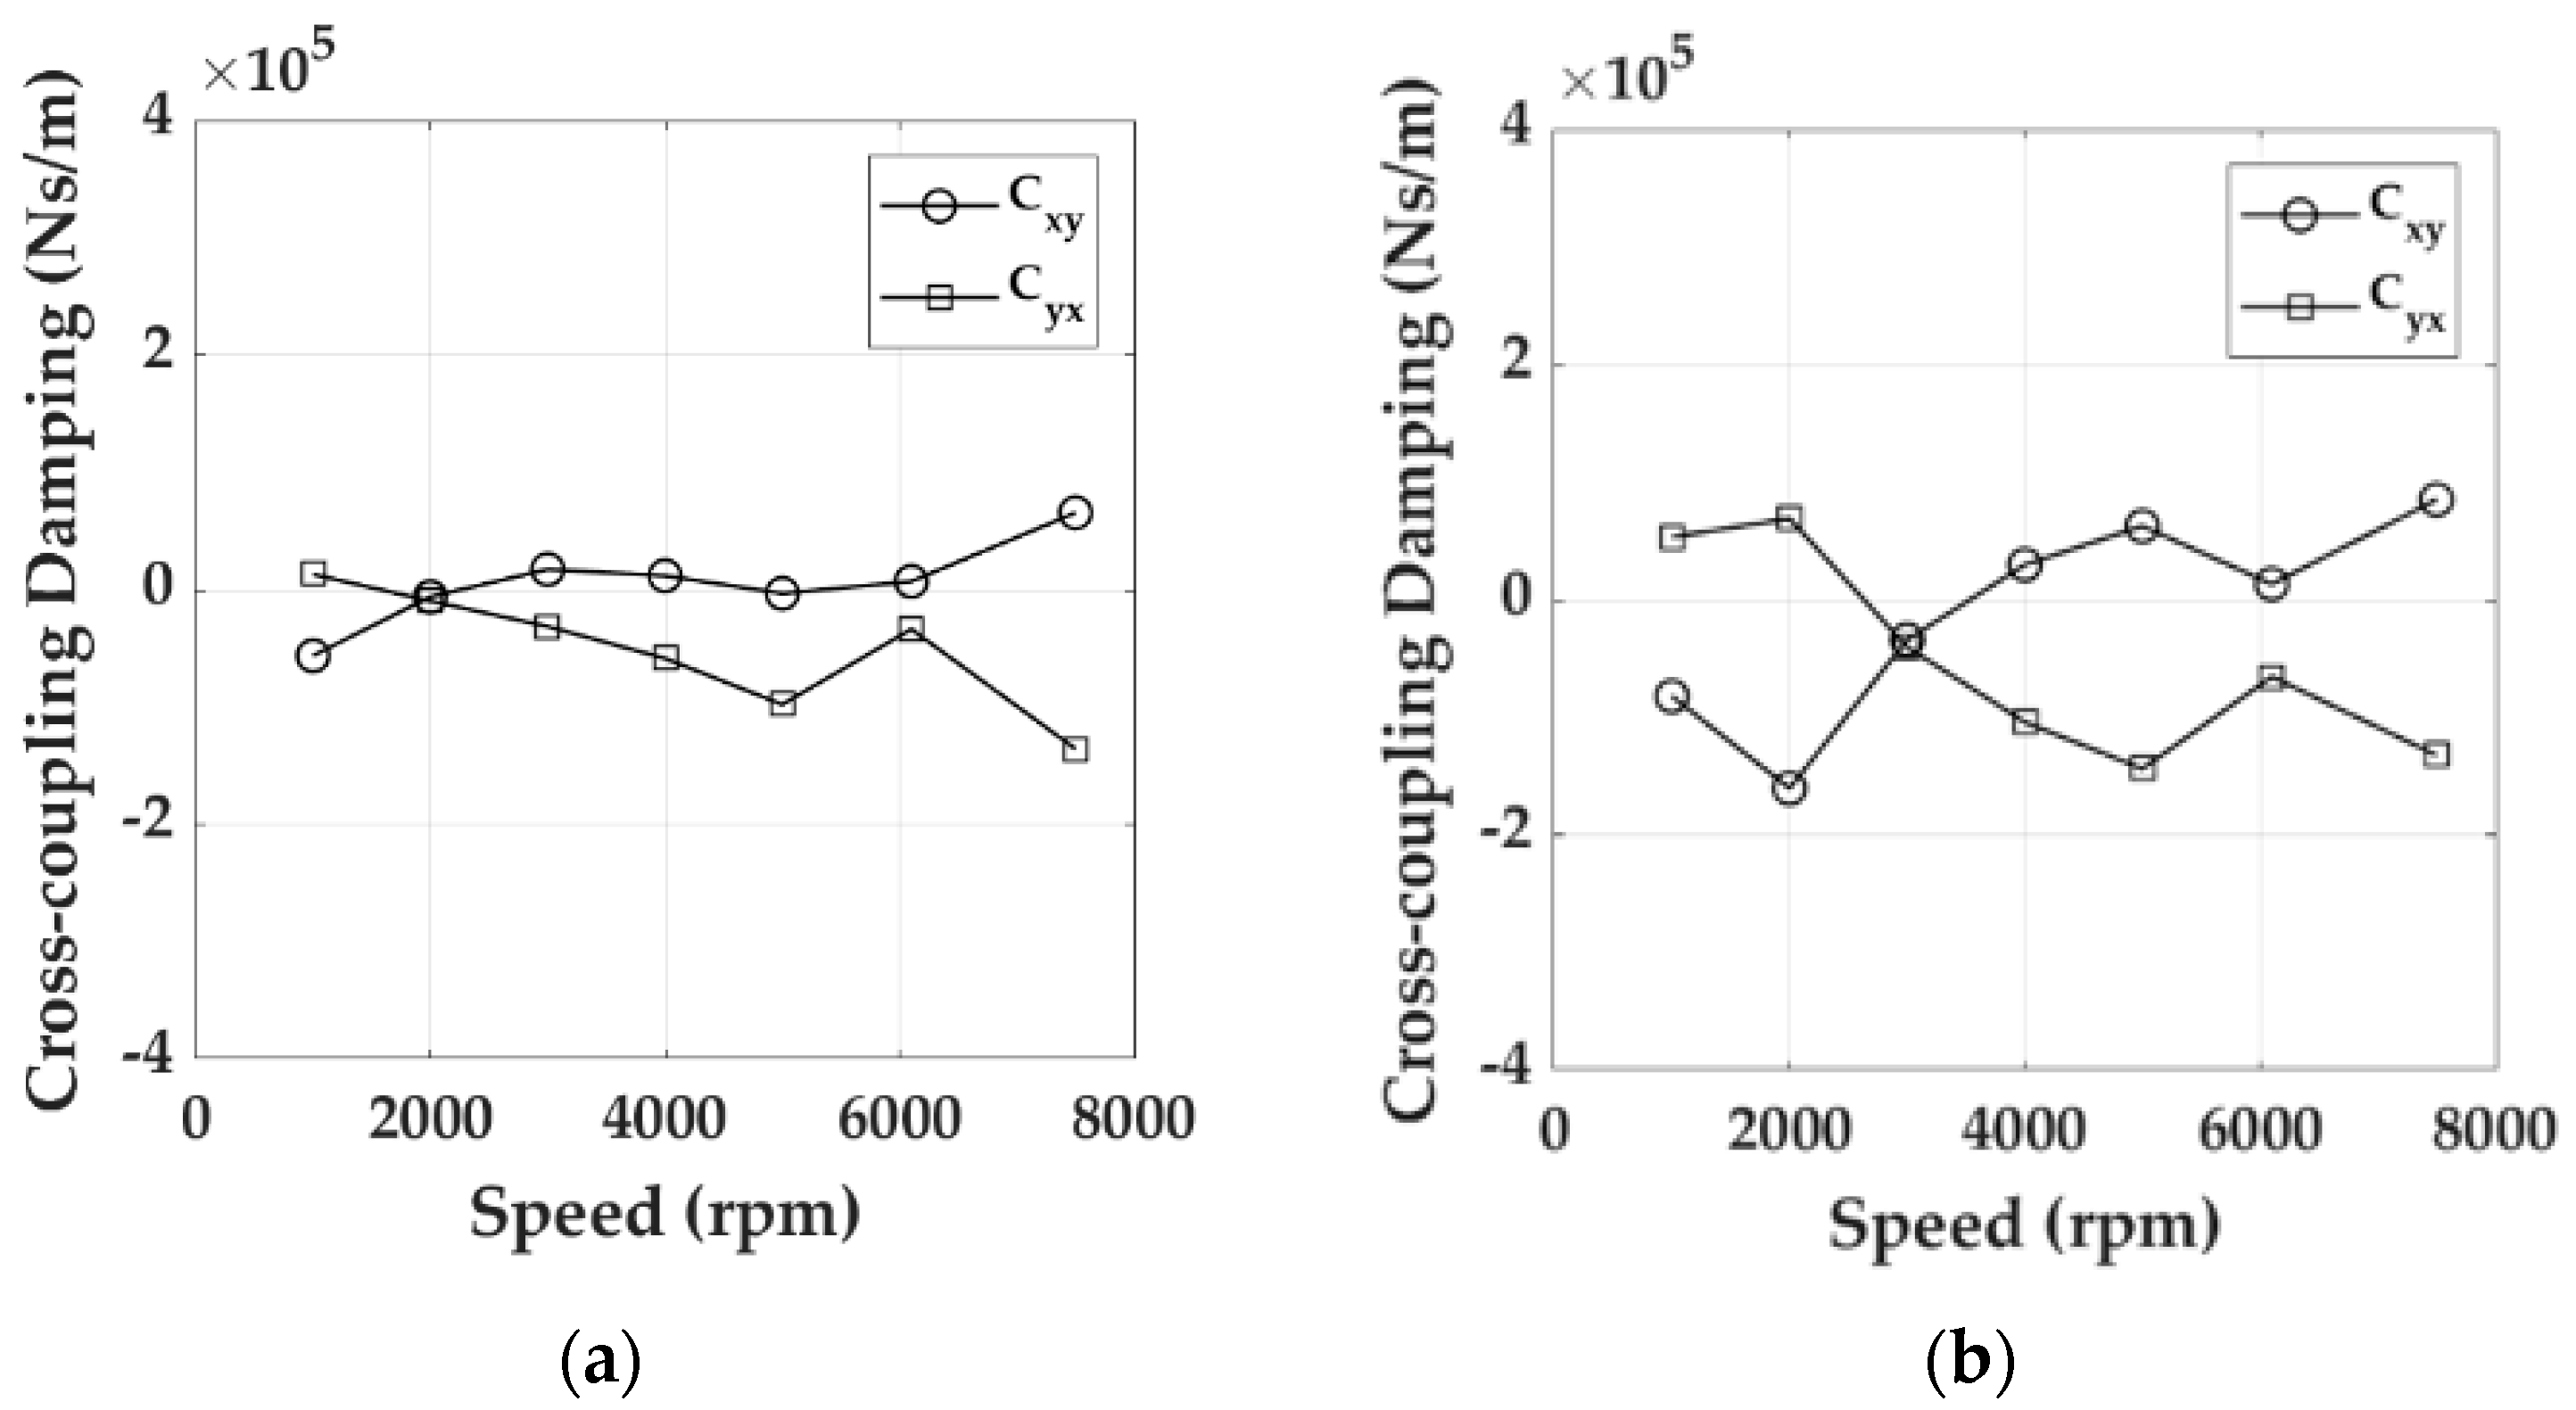
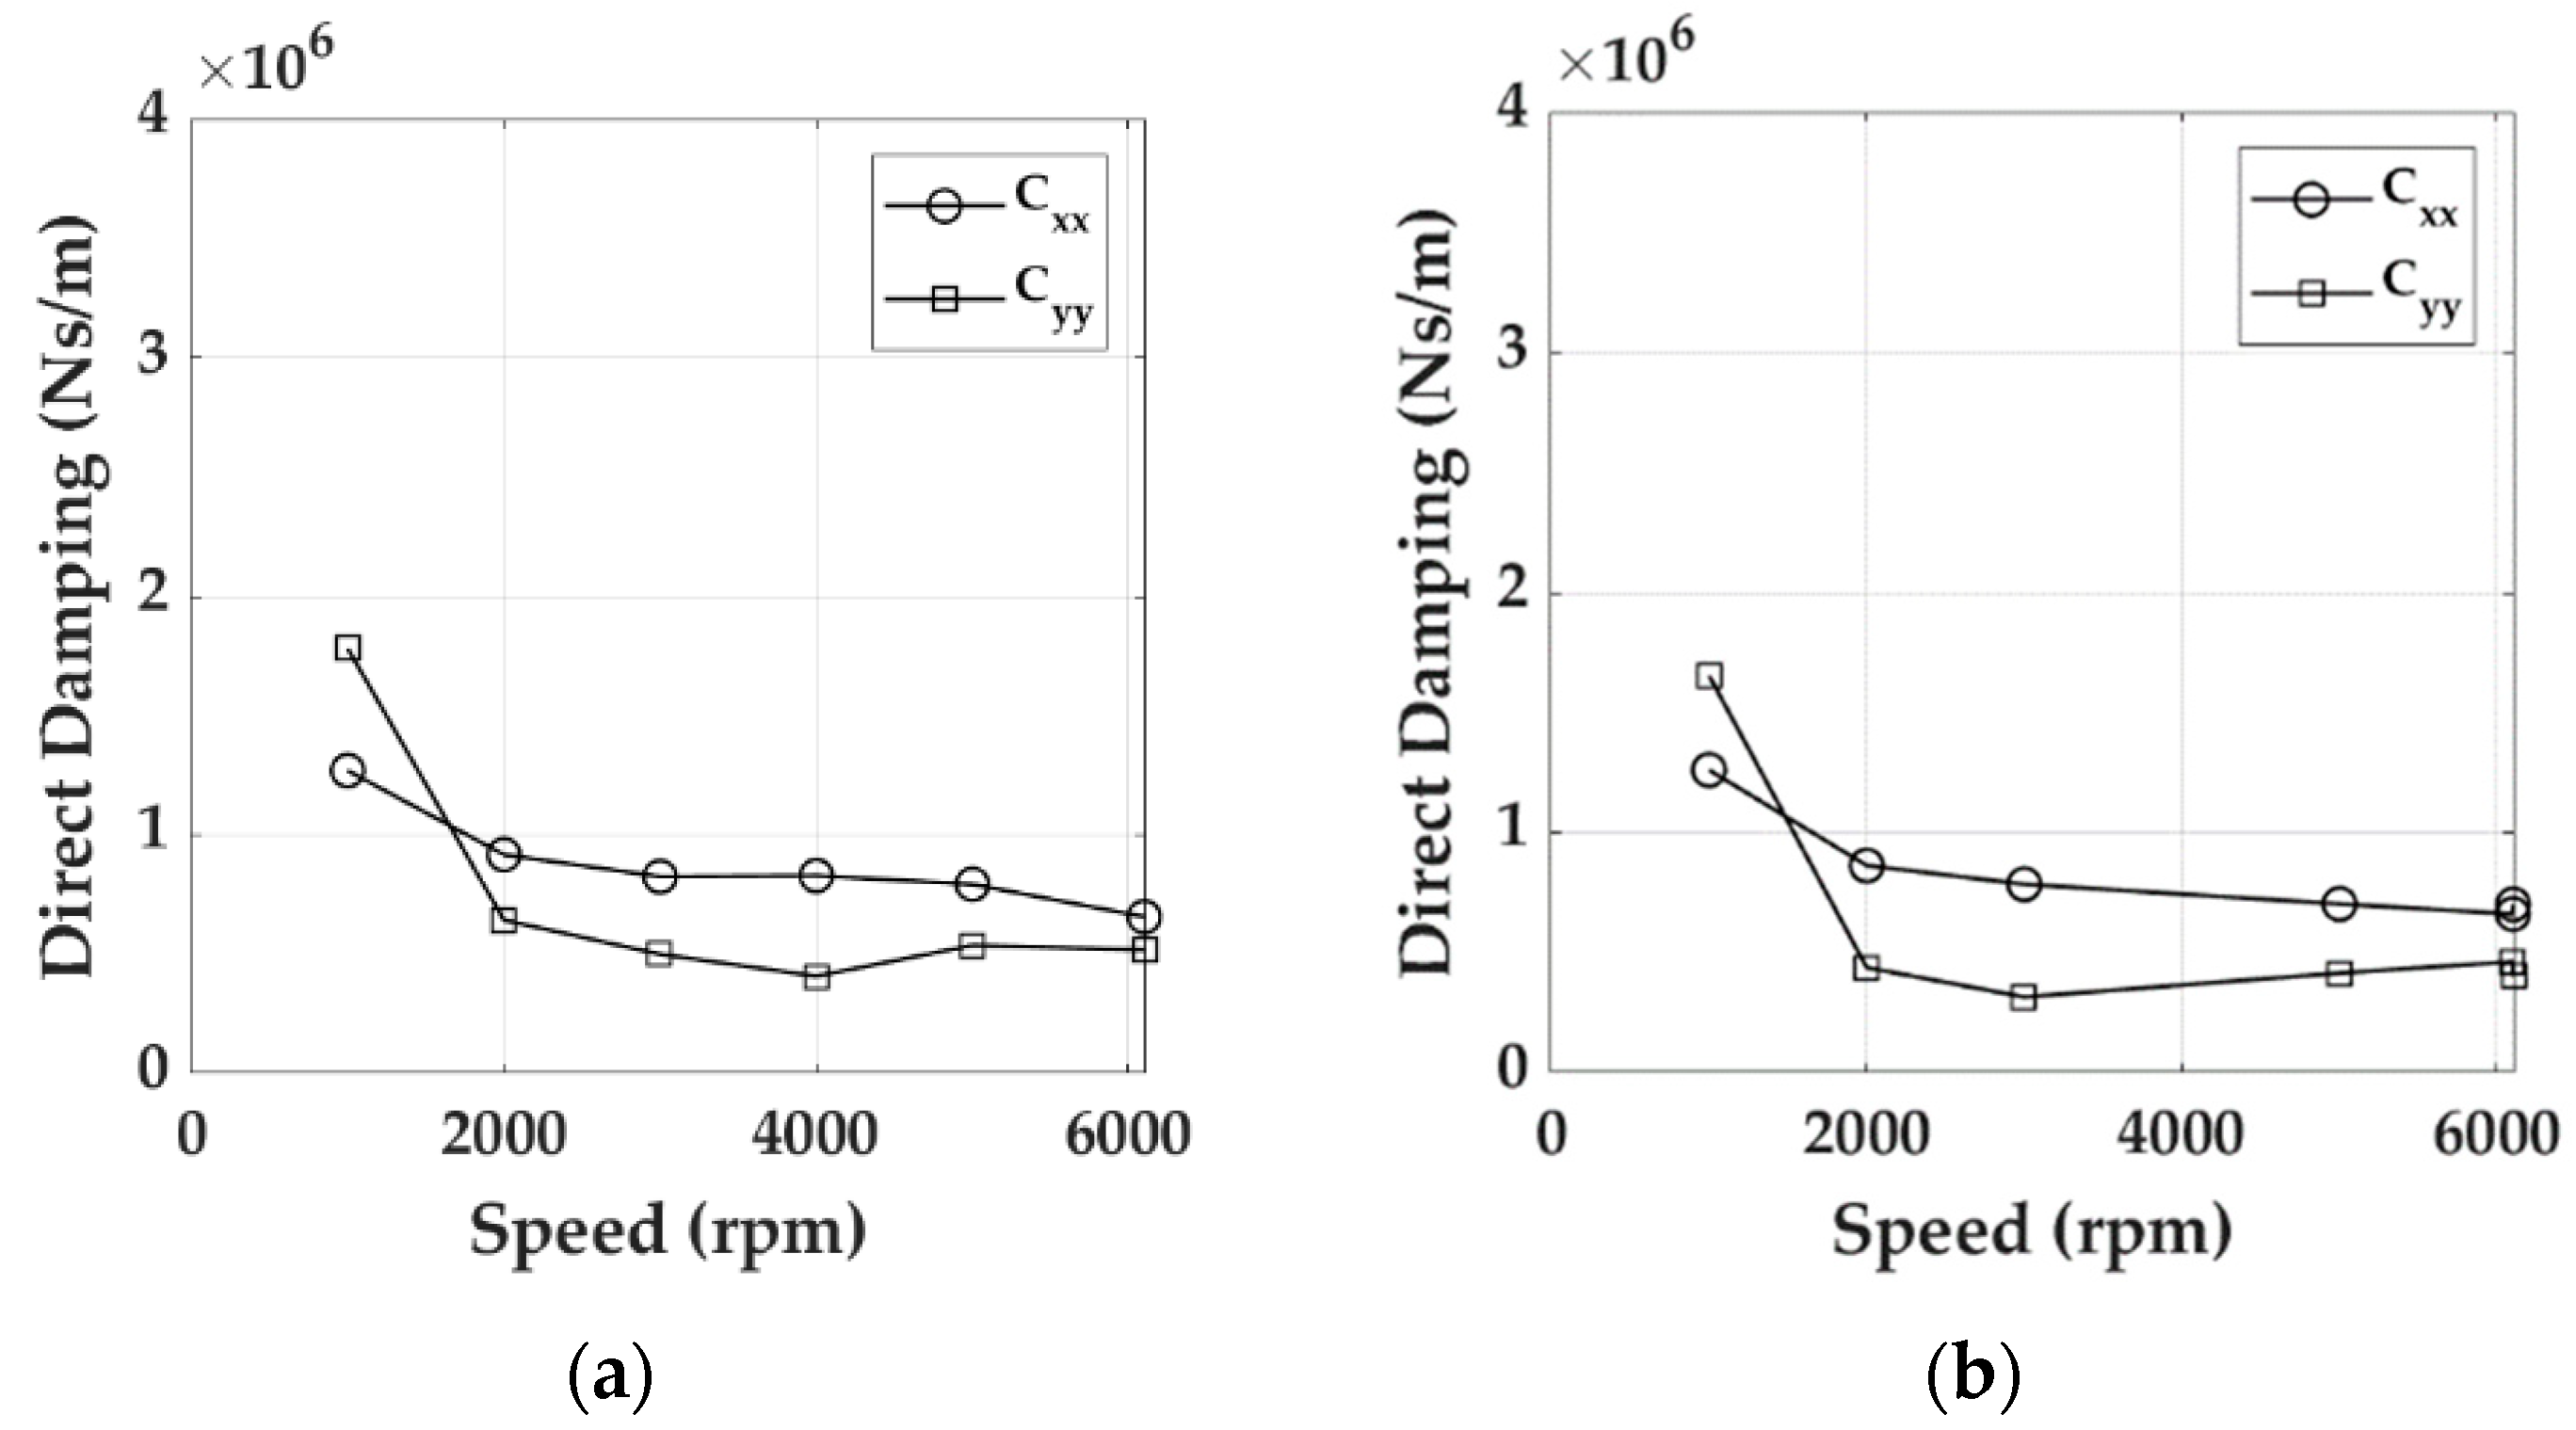
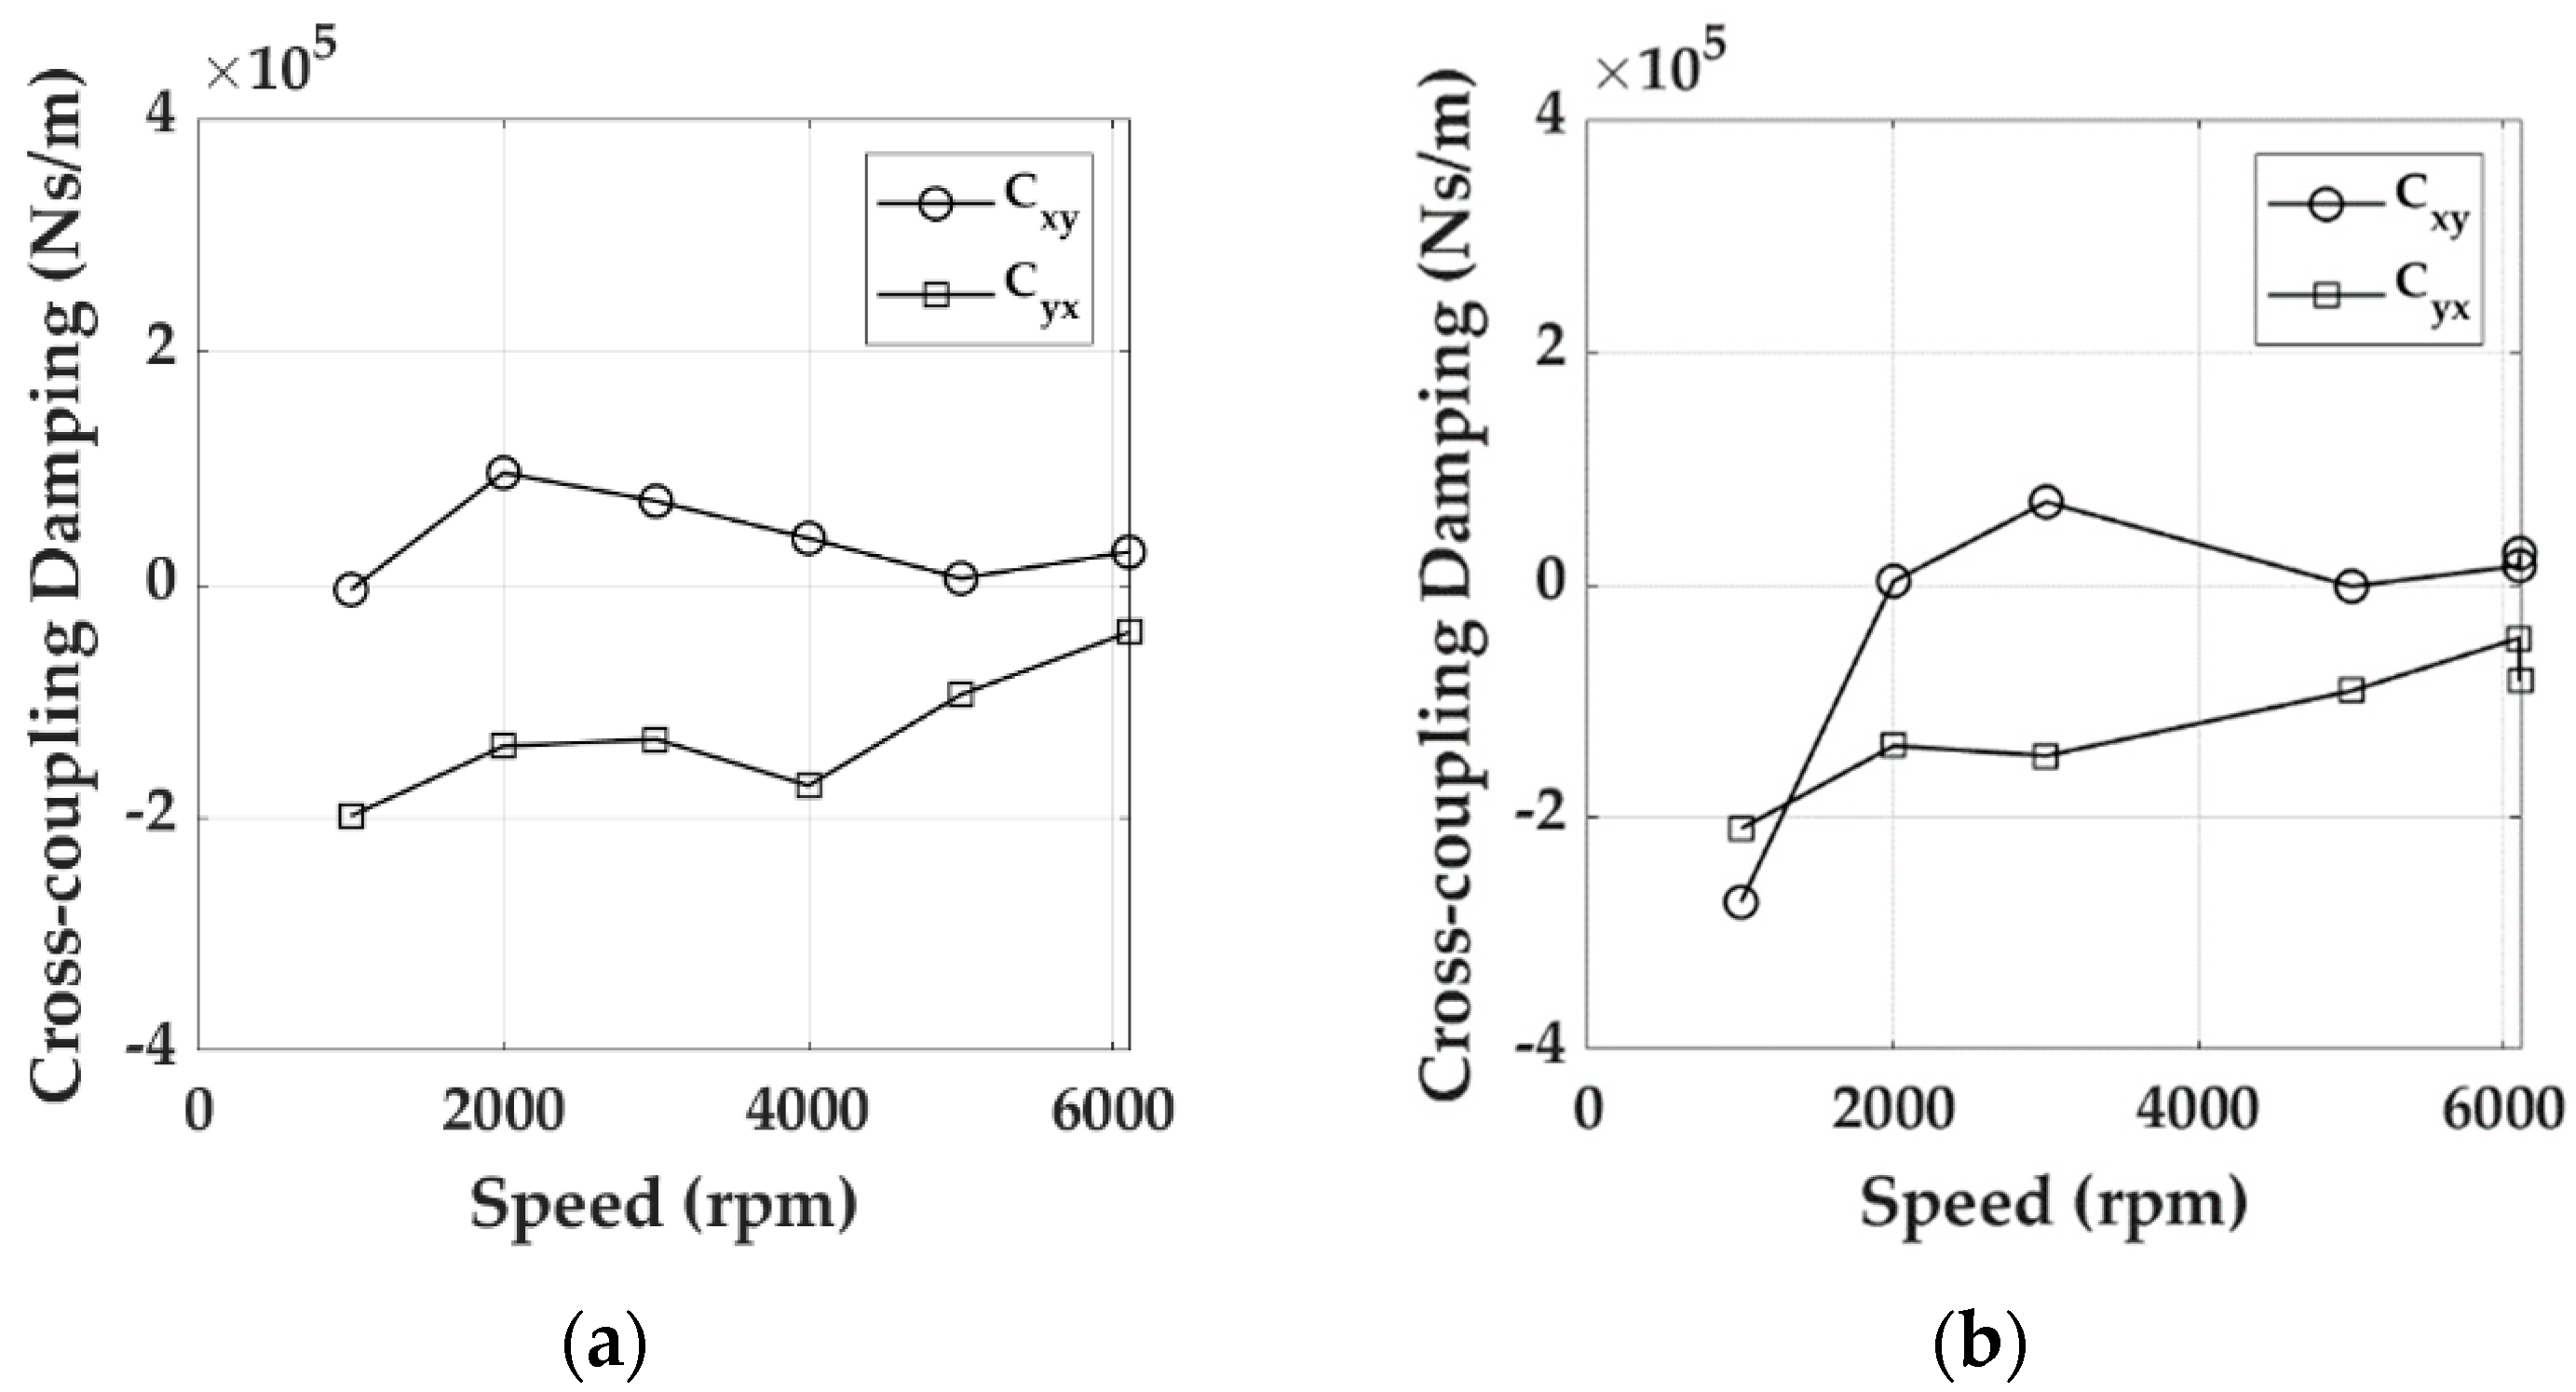
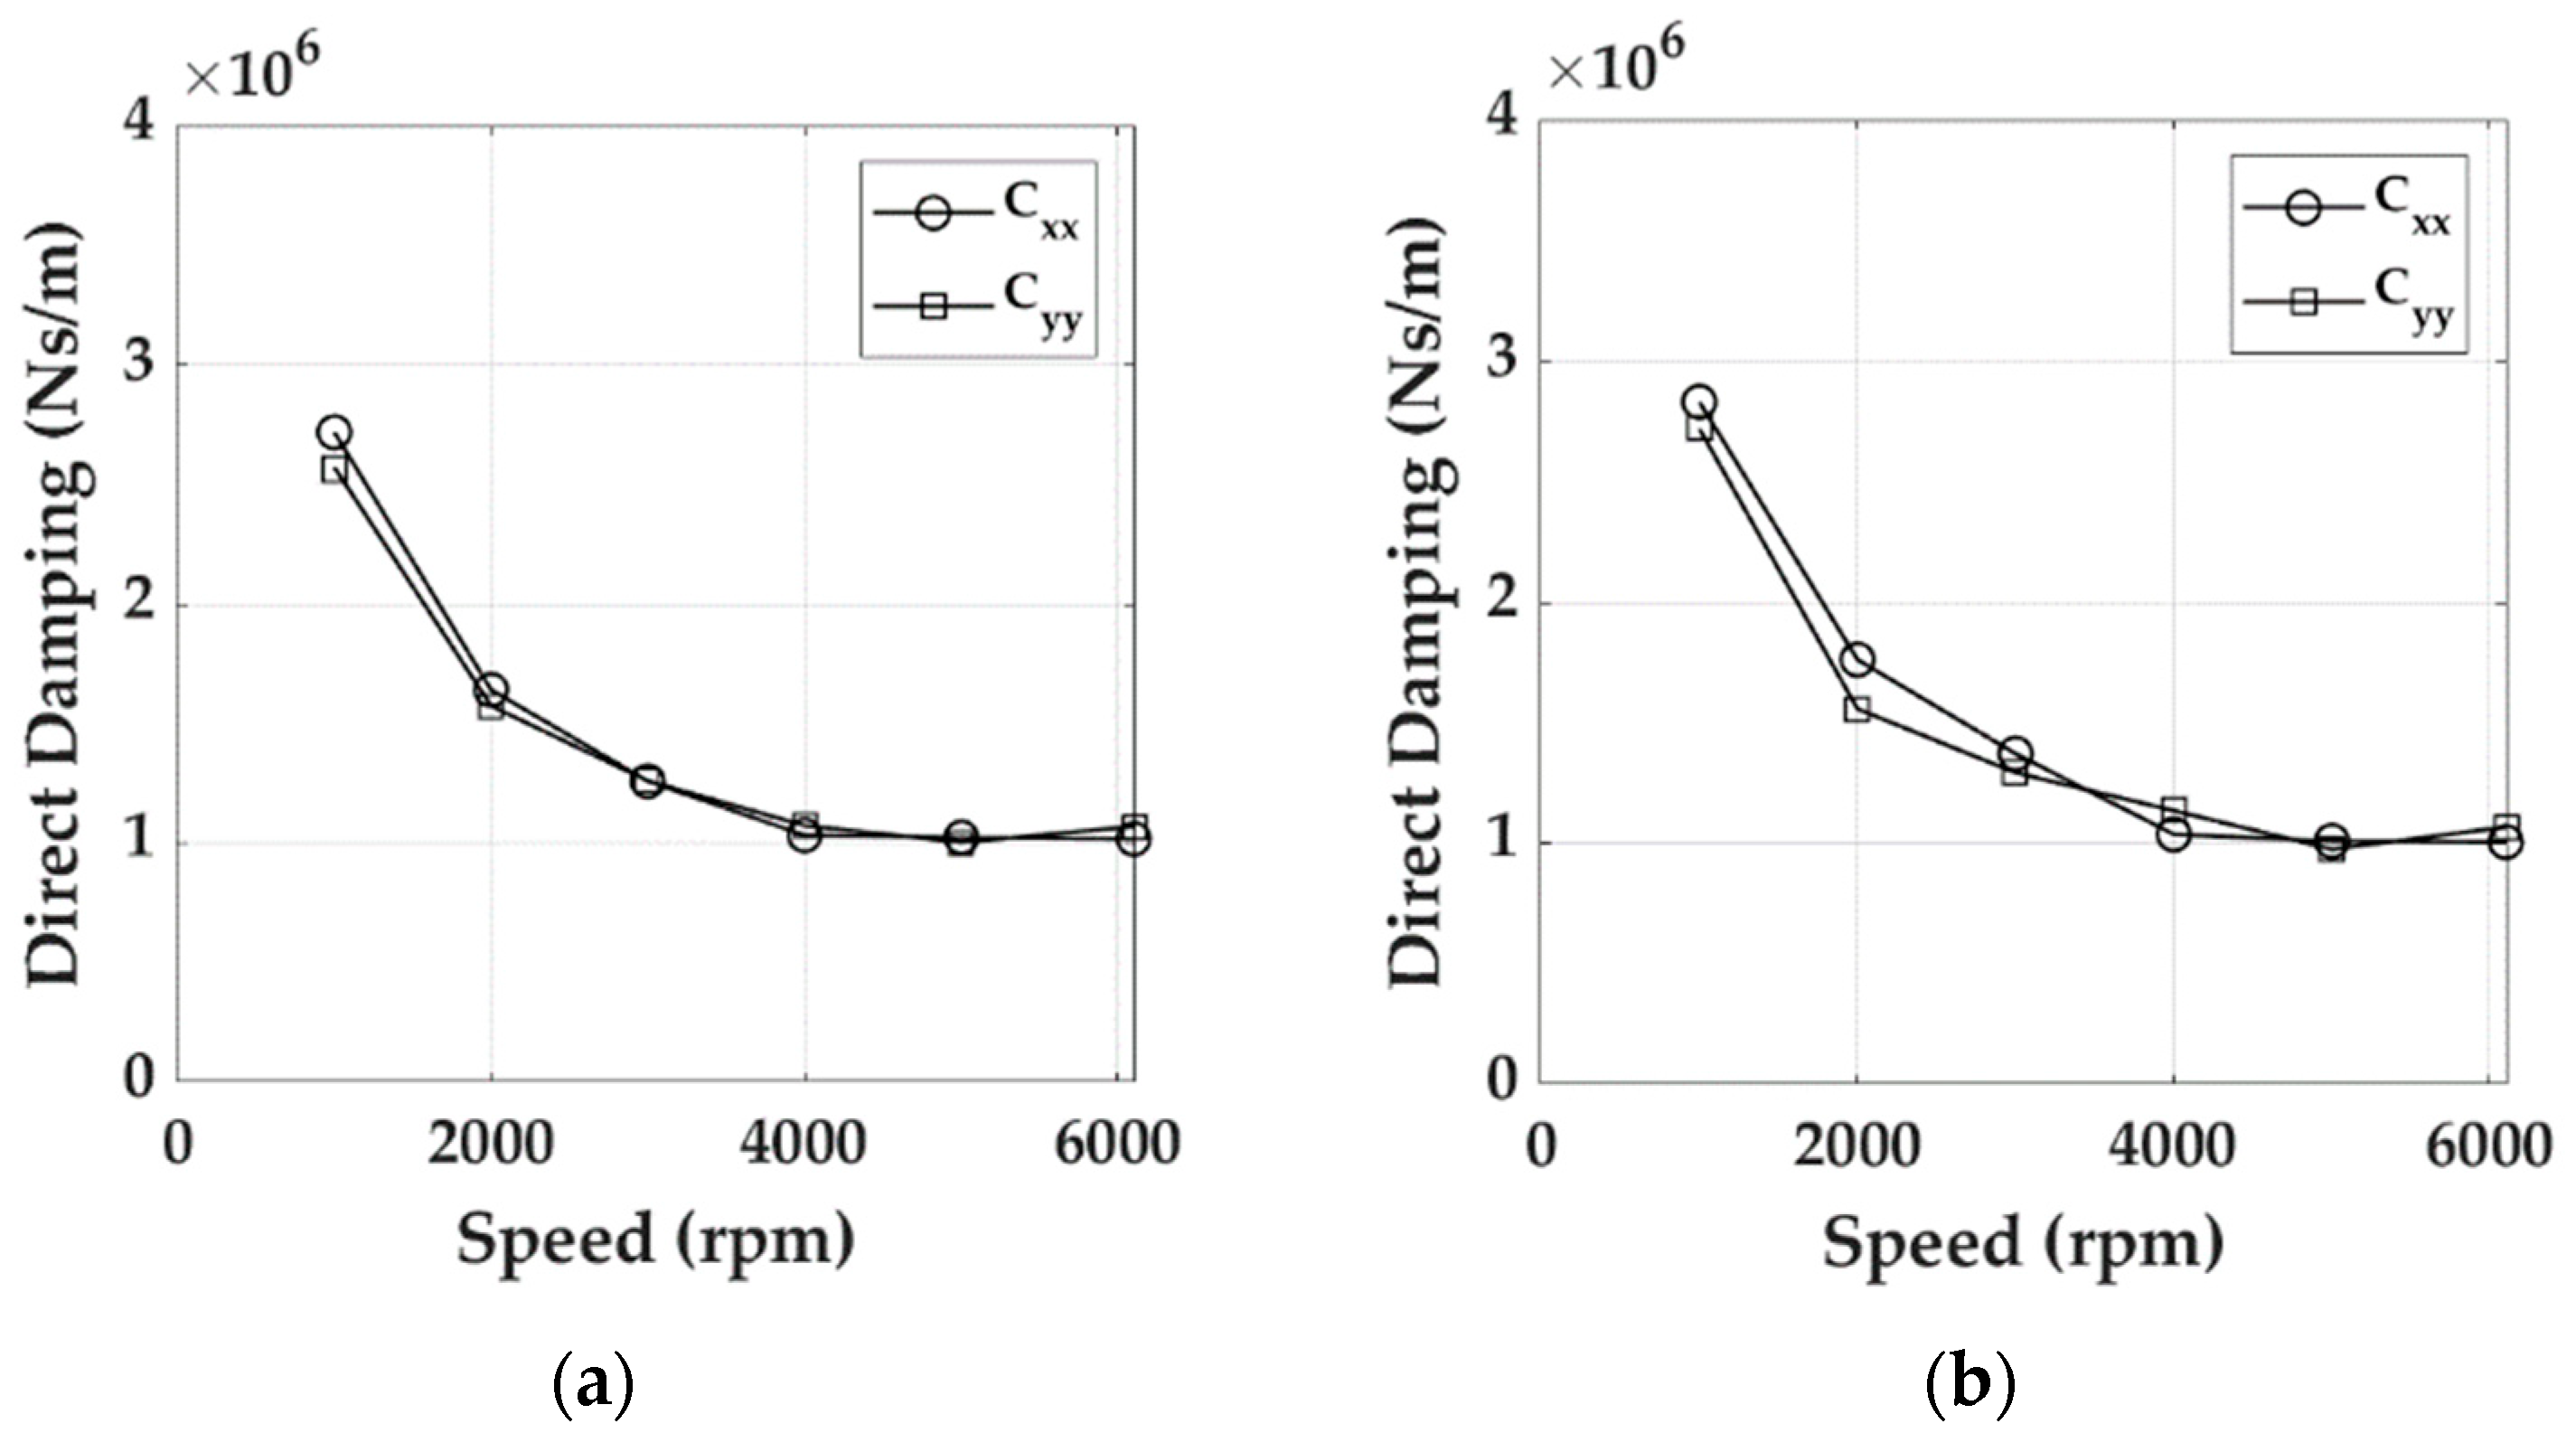
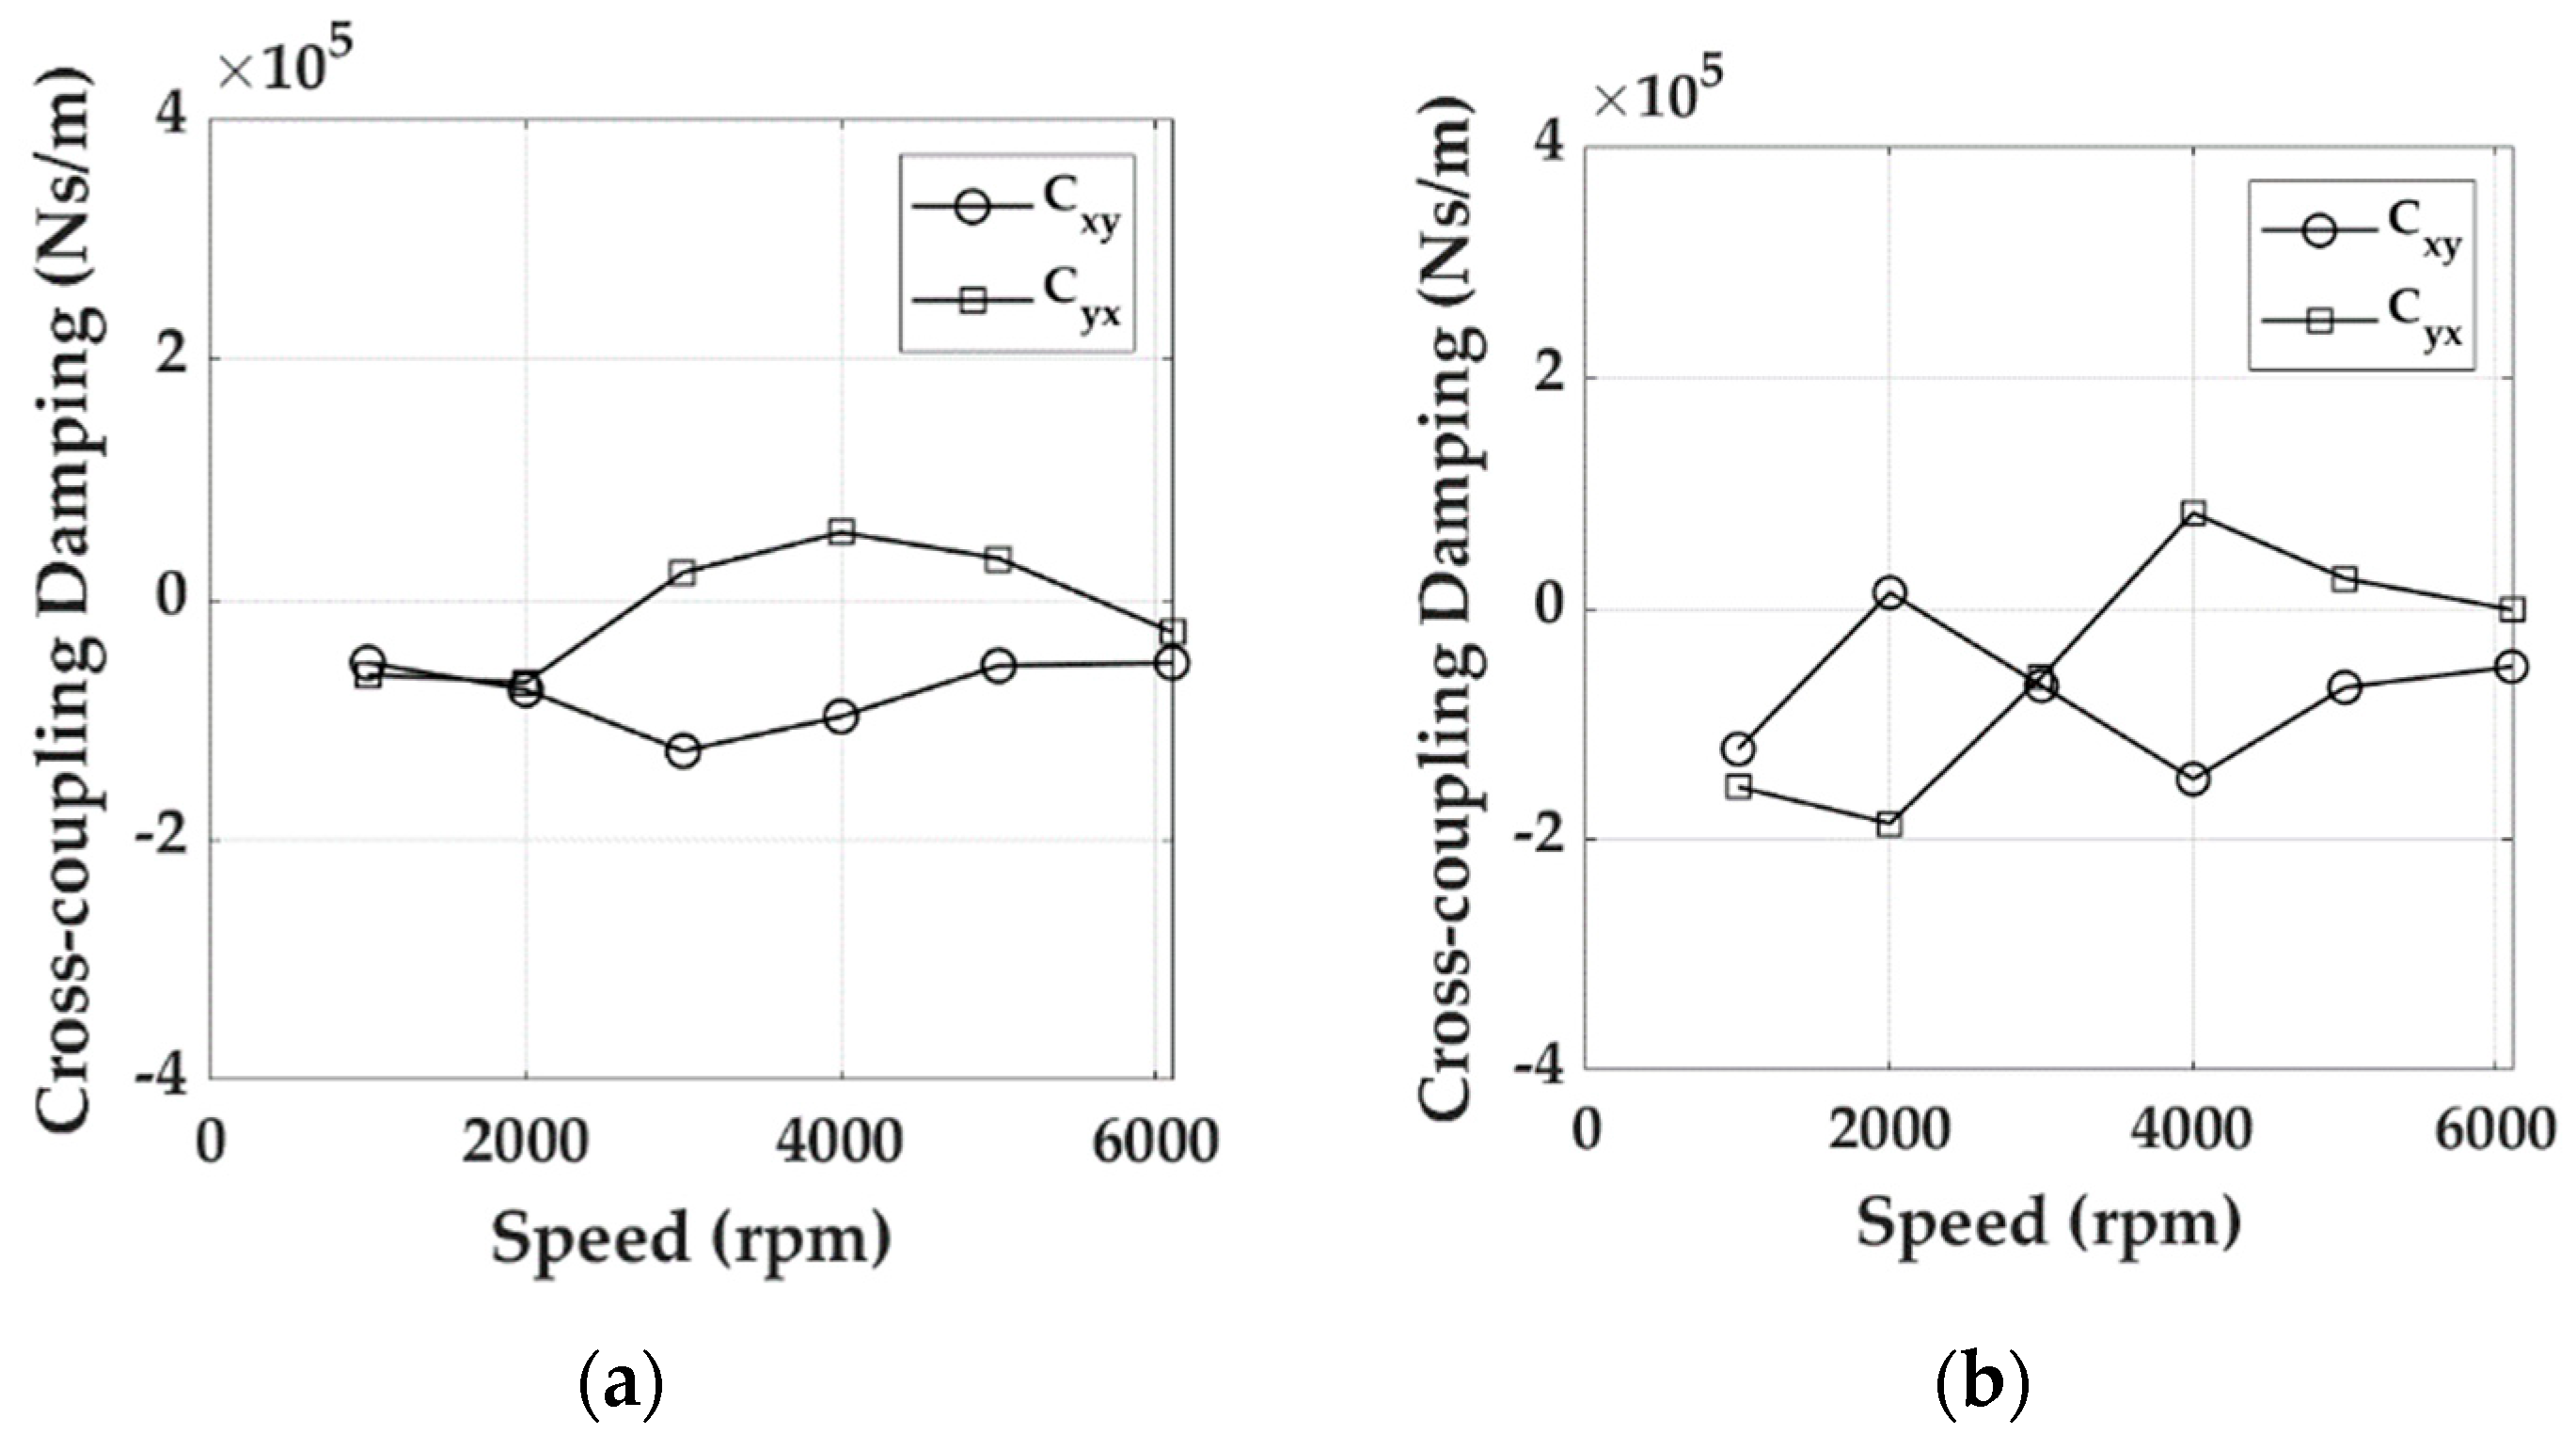
3.2.3. Synchronous Damping Coefficients

The synchronous damping coefficients were calculated similarly to the synchronous stiffness ones. Figure 33 and Figure 34 show, respectively, the synchronous direct and cross-coupling damping coefficients in both load conditions, for the Direct Lube Rocker Pivot bearing.
The direct damping coefficients decrease with increasing speed, with a decreasing slope, and appear slightly affected by load. Direct damping is higher in the vertical direction. The cross-coupling damping coefficients are one order of magnitude lower than the direct ones and for almost all speeds are of opposite sign one another.
Figure 35 and Figure 36 show, respectively, the synchronous direct and cross-coupling damping coefficients in both load conditions, for the Flooded Rocker Pivot bearing.
The direct damping coefficients decrease with increasing speed with a decreasing slope and are slightly affected by load. In this case, direct damping is higher in the horizontal direction. The cross-coupling damping coefficients are one order of magnitude lower than the direct ones and are of opposite signs except below 2000 rpm for the higher load condition where they are both negative.
Figure 37 and Figure 38 show, respectively, the synchronous direct and cross-coupling damping coefficients in both load conditions, for the Flooded Ball & Socket Pivot bearing.
The direct damping terms in the two orthogonal directions x and y, as for the stiffness ones, are similar, and they are not influenced by load. They are characterized by a decreasing trend with speed up to a rotational speed value of about 5000 rpm. The cross-coupling damping coefficients are one order of magnitude lower than the direct ones and with an opposite trend to one another and an average negative value.

3.2.4. The Rotordynamic Behavior

To investigate the effect of the cross-coupling on its effective damping, a comparative numerical rotordynamic analysis with the measured coefficients was performed. The rotor adopted for the evaluation is a large flexible dummy rotor built and tested in the particular configuration presented in [26]. It was realized in order to be dynamically equivalent to a large specific centrifugal compressor. The dummy rotor (Figure 39) is a six meters length shaft, carrying five dummy disks reproducing the impeller inertial properties, two external sleeves representing the dry-gas seal rotating parts, a dummy balance drum and a dummy coupling hub. The main rotordynamic parameters are summarized in [26]. A damped eigenvalue analysis was performed for each bearing type, taking into account the experimental data relative to the static load condition nearest to the effective rotor static loads: 0.8/1.3/1.0 MPa, respectively, for Direct Lube Rocker Pivot/Flooded Rocker Pivot/Flooded Ball & Socket Pivot bearings.
The damped eigenvalue analysis results for each bearing are shown in Table 6. For each bearing solution, the results in terms of synchronous modes and 1st mode logarithmic decrement are presented.
It is worth noticing that the first mode frequency is unaffected by the bearing solution. The Direct Lube Rocker Pivot/Flooded Ball & Socket Pivot bearings are the ones showing the higher logarithmic decrement value, coherently with the higher direct damping values with respect to the Flooded Rocker Pivot bearing solution. These results confirm the design choice of adopting higher L/D on those rotors for which it is necessary to minimize the amplification of the first critical speed.
The contribution of direct damping and cross-coupling stiffness behavior at high speeds lead to a higher stability behavior of the Flooded Ball & Socket Pivot bearing with respect to the Direct Lube Rocker Pivot one.
The same considerations hold for the 2nd mode of the rotor (Table 7) where none of the proposed bearing solution can be adopted to guarantee the API 617 [27] rotordynamics requirements compliance. It must be highlighted that the Flooded Rocker Pivot bearing behavior on this type of rotor is totally expected since this kind of bearing has been designed, in these particular L/D configurations, for a different type of rotor.

4. Discussion and Conclusions

This paper deals with the results of an extensive experimental test campaign performed on different 280 mm diameter tilting pad journal bearings through the joint effort of the University of Pisa, Baker Hughes, and AM Testing. Although the three TPJBs present many different features, some comparative observations can be made on the different or similar trends of their performances, focusing on the influence of the operating parameters and configurations.
First of all, as regards the static characteristics, the Flooded Ball & Socket Pivot bearing has the greatest shaft sink due to its geometric configuration; thus, with a lower static stiffness, especially at higher loads.
The oil supply system of the Direct Lube Rocker Pivot bearing guarantees lower temperatures to the pads at the same peripheral speed of the Flooded Ball & Socket Pivot, where the same load is applied during the test. This effect is related to the cool oil supplied to the pad inlet, minimizing the recirculation of hot pad outlet oil.
All the bearings show the temperature trends of the unloaded pads increasing monotonically with speed. The trend for the loaded pads depends on the bearing type, with a monotonic increasing trend for Direct Lube Rocker Pivot bearings and Flooded Ball & Socket Pivot in the case of low applied load, with a non-monotonic trend for the Flooded Rocker Pivot bearing. Flooded bearings trends highlight a temperature peak close to 4000 rpm, especially at high load, where the transition to turbulent regime occurs. This effect confirms to use flooded bearings in medium load and medium peripherical speed applications.
The L/D ratio is one of the most influential parameters on power losses, while the influence of static load is negligible. Reducing the L/D ratio, the influence of the load on the power losses estimation increases as highlighted in the Flooded Rocker Pivot.
As far as the dynamic characteristics are concerned, for all bearings, asynchronous direct stiffness coefficients appear slightly dependent on frequency.
The Direct Lube Rocker Pivot bearing exhibits direct stiffness coefficients that increase with speed at low loads while have a minimum value at high loads and medium speed; the Flooded Rocker Pivot bearing has direct stiffness coefficients decreasing with speed, the highest vertical stiffness at high load particularly affected by speed; the Flooded Ball & Socket Pivot bearing has an isotropic direct stiffness, lower than the other bearings and slightly affected by speed. This effect suggests the use of the Flooded Ball & Socket in applications, where it is not necessary to have high stiffness but a steady value in a wide range of speed.
Cross-coupling stiffness coefficients have a nonlinear trend with speed for all tested bearings. For the Flooded Rocker Pivot bearing they have the same sign in almost all tested conditions. Vice versa both Flooded Ball & Socket Pivot bearing and Direct Lube Rocker Pivot bearing have coefficients of opposite sign over most of the tested speed range.
As regards the effect of the bearing selection on rotordynamics, the results confirm the design choice of adopting higher L/D on those rotors for which it is necessary to minimize the amplification of the first and second critical speeds.
Some observed aspects, such as turbulence effects on the bearing performance, will be, in the intention of the authors, the object of future in-depth study by means of pads equipped with advanced sensors.

Author Contributions

Conceptualization, E.C., P.F., A.I., and R.F.; formal analysis, A.I. and M.N.; investigation, M.N.; data curation, M.N.; writing—original draft preparation, E.C., P.F., and A.I.; writing—review and editing, E.C., P.F., A.I., and R.F.; visualization, A.I. and M.N.; supervision, E.C.; project administration, E.C. All authors have read and agreed to the published version of the manuscript.

Funding

This research was funded by Baker Hughes Company through contracts with the University of Pisa and AM Testing.

Institutional Review Board Statement

Not applicable.

Informed Consent Statement

Not applicable.

Data Availability Statement

Restrictions apply to the availability of these data. Data belong to Baker Hughes and are available from the authors with the permission of Baker Hughes.

Acknowledgments

The authors acknowledge the support of Eng. Francesco Maestrale in the experimental activity.

Conflicts of Interest

The authors declare no conflict of interest.

Appendix A

This appendix presents the plots of the asynchronous direct stiffness and damping coefficients for the flooded bearings and cross-coupling stiffness and damping coefficients for all bearings as a function of excitation frequency.
Figure A1. Flooded Rocker Pivot bearing asynchronous direct stiffness coefficients at various speeds for 1.3 MPa and 2.1 MPa: (a) Kxx, (b) Kyy.
Machines 09 00273 g0a1
Figure A2. Flooded Ball & Socket Pivot bearing asynchronous direct stiffness coefficients at various speeds for 1.0 MPa and 1.7 MPa: (a) Kxx, (b) Kyy.
Machines 09 00273 g0a2
Figure A3. Flooded Rocker Pivot bearing asynchronous direct coefficients at various speeds for 1.3 MPa and 2.1 MPa: (a) Cxx, (b) Cyy.
Machines 09 00273 g0a3
Figure A4. Flooded Ball & Socket Pivot bearing asynchronous direct coefficients at various speeds for 1.0 MPa and 1.7 MPa: (a) Cxx, (b) Cyy.
Machines 09 00273 g0a4
Figure A5. Direct Lube Rocker Pivot bearing asynchronous cross-coupling stiffness coefficients at various speeds for 0.8 MPa and 1.7 MPa: (a) Kxy, (b) Kyx.
Machines 09 00273 g0a5
Figure A6. Flooded Rocker Pivot bearing asynchronous cross-coupling coefficients at various speeds for 1.3 MPa and 2.1 MPa: (a) Kxy, (b) Kyx.
Machines 09 00273 g0a6
Figure A7. Flooded Ball & Socket Pivot bearing asynchronous cross-coupling coefficients at various speeds for 1.0 MPa and 1.7 MPa: (a) Kxy, (b) Kyx.
Machines 09 00273 g0a7
Figure A8. Direct Lube Rocker Pivot bearing asynchronous cross-coupling damping coefficients at various speeds for 0.8 MPa and 1.7 MPa: (a) Cxy, (b) Cyx.
Machines 09 00273 g0a8
Figure A9. Flooded Rocker Pivot bearing asynchronous cross-coupling damping coefficients at various speeds for 1.3 MPa and 2.1 MPa: (a) Cxy, (b) Cyx.
Machines 09 00273 g0a9
Figure A10. Flooded Ball & Socket Pivot bearing asynchronous cross-coupling damping coefficients at various speeds for 1.0 MPa and 1.7 MPa: (a) Cxy, (b) Cyx.
Machines 09 00273 g0a10

References

  1. Dimond, T.W.; Sheth, P.N.; Allaire, P.E.; He, M. Identification methods and test results for tilting pad and fixed geometry journal bearing dynamic coefficients—A review. Shock Vib. 2009, 16, 13–43. [Google Scholar] [CrossRef]
  2. Dimond, T.; Younan, A.; Allaire, P. A review of tilting pad bearing theory. Int. J. Rotating Mach. 2011, 2011, 908469. [Google Scholar] [CrossRef] [Green Version]
  3. Childs, D.W.; Hale, K.A. Test Apparatus and Facility to Identify the Rotordynamic Coefficients of High-Speed Hydrostatic Bearings. J. Tribol. 1994, 116, 337–344. [Google Scholar] [CrossRef] [Green Version]
  4. Ha, H.C.; Yang, S.H. Excitation Frequency Effects on the Stiffness and Damping Coefficients of a Five-Pad Tilting Pad Journal Bearing. J. Tribol. 1999, 121, 517–522. [Google Scholar] [CrossRef]
  5. Ikeda, K.; Hirano, T.; Yamashita, T.; Mikami, M.; Sakakida, H. An Experimental Study of Static and Dynamic Characteristics of a 580 mm (22.8 in.) Diameter Direct Lubrication Tilting Pad Journal Bearing. J. Tribol. 2006, 128, 146–154. [Google Scholar] [CrossRef]
  6. Wygant, K.; Flack, R.D.; Barrett, L.E. Measured Performance of Tilting Pad Journal Bearings over a Range of Preload—Part. I: Static Operating Conditions. Tribol. Trans. 2004, 47, 576–584. [Google Scholar] [CrossRef]
  7. Bang, K.B.; Kim, J.H.; Cho, Y.J. Comparison of power loss and pad temperature for leading edge groove tilting pad journal bearings and conventional tilting pad journal bearings. Tribol. Int. 2010, 43, 1287–1293. [Google Scholar] [CrossRef]
  8. Ciulli, E.; Forte, P.; Libraschi, M.; Nuti, M. Set-up of a novel test plant for high power turbomachinery tilting pad journal bearings. Tribol. Int. 2018, 127, 276–287. [Google Scholar] [CrossRef]
  9. Chatterton, S.; Pennacchi, P.; Dang, P.V.; Vania, A. A test rig for evaluating tilting–pad journal bearing characteristics. In Proceedings of the 9th international conference on rotor dynamics (IFToMM), Milan, Italy, 22–25 September 2014; pp. 921–930. [Google Scholar]
  10. Dang, P.V.; Chatterton, S.; Pennacchi, P.; Vania, A. Effect of the load direction on non-nominal five-pad tilting pad journal bearings. Tribol. Int. 2016, 98, 197–211. [Google Scholar] [CrossRef]
  11. Dang, P.V.; Chatterton, S.; Pennacchi, P. The Effect of the Pivot Stiffness on the Performances of Five-Pad Tilting Pad Bearings. Lubricants 2019, 7, 61. [Google Scholar] [CrossRef] [Green Version]
  12. Vannini, G.; Cangioli, F.; Ciulli, E.; Nuti, M.; Forte, P.; Kim, J.; Livermore-Hardy, R. Experiments on a Large Flexure Pivot Journal Bearing: Summary of Test Results and Comparison with Predictions. ASME J. Eng. Gas Turbines Power 2020, 142, 031004. [Google Scholar] [CrossRef]
  13. Ciulli, E.; Forte, P. Nonlinear Response of Tilting Pad Journal Bearings to Harmonic Excitation. Machines 2019, 7, 43. [Google Scholar] [CrossRef] [Green Version]
  14. Hagemann, T.; Kukla, S.; Schwarze, H. Measurement and Prediction of the Static Operating Conditions of a Large Turbine Tilting-Pad Bearing Under High Circumferential Speeds and Heavy Loads. In Proceedings of the ASME Turbo Expo 2013: Turbine Technical Conference and Exposition. Volume 7B: Structures and Dynamics, San Antonio, TX, USA, 3–7 June 2013; p. V07BT30A019. [Google Scholar] [CrossRef]
  15. Kukla, S.; Hagemann, T.; Schwarze, H. Measurement and Prediction of the Dynamic Characteristics of a Large Turbine Tilting-Pad Bearing Under High Circumferential Speeds. In Proceedings of the ASME Turbo Expo 2013: Turbine Technical Conference and Exposition. Volume 7B: Structures and Dynamics, San Antonio, TX, USA, 3–7 June 2013; p. V07BT30A020. [Google Scholar] [CrossRef]
  16. Hopf, G.; Schüler, D. Investigations on Large Turbine Bearings Working Under Transitional Conditions Between Laminar and Turbulent Flow. J. Tribol 1989, 111, 628–634. [Google Scholar] [CrossRef]
  17. Buchhorn, N.; Stottrop, M.; Bender, B. Influence of Active Cooling at the Trailing Edge on the Thermal Behavior of a Tilting-Pad Journal Bearing. Lubricants 2021, 9, 26. [Google Scholar] [CrossRef]
  18. Sano, T.; Magoshi, R.; Shinohara, T.; Yoshimine, C.; Nishioka, T.; Tochitani, N.; Sumi, Y. Confirmation of performance and reliability of direct lubricated tilting two pads bearing. IMechE J. Eng.Tribol. 2015, 229, 1011–1021. [Google Scholar] [CrossRef]
  19. Mermertas, Ü.; Hagemann, T.; Brichart, C. Optimization of a 900 mm Tilting-Pad Journal Bearing in Large Steam Turbines by Advanced Modeling and Validation. ASME J. Eng. Gas Turbines Power 2019, 141, 021033. [Google Scholar] [CrossRef]
  20. Ciulli, E.; Forte, P.; Libraschi, M.; Naldi, L.; Nuti, M. Characterization of High-Power Turbomachinery Tilting Pad Journal Bearings: First Results Obtained on a Novel Test Bench. Lubricants 2018, 6, 4. [Google Scholar] [CrossRef] [Green Version]
  21. Ciulli, E.; Forte, P.; Libraschi, M.; Nuti, M. Experimental tests on large size tilting pad journal bearings for turbomachinery. In Proceedings of the 10th International Scientific Conference BALTTRIB 2019, Kaunas, Lithuania, 14–16 November 2019; Volume 159364, pp. 79–86. [Google Scholar]
  22. Ferraro, R.; Innocenti, A.; Libraschi, M.; Barsanti, M.; Ciulli, E.; Forte, P.; Nuti, M. Dynamic Identification of 280 mm Diameter Tilting Pad Journal Bearings: Test Results and Measurement Uncertainties Assessment of Different Designs. In Proceedings of the ASME Turbo Expo 2020: Turbomachinery Technical Conference and Exposition, Volume 10A: Structures and Dynamics, Virtual, Online, 21–25 September 2020; p. V10AT25A013. [Google Scholar] [CrossRef]
  23. API Standard 670 Machinery Protection Systems, 5th ed.; API Publishing Services: Washington, DC, USA, 2014.
  24. Nicholas, J.C. Tilting Pad bearing Design. In Proceedings of the Twenty-Third Turbomachinery Symposium, Texas A&M University, Dallas, TX, USA, 13–15 September 1994; pp. 179–194. [Google Scholar] [CrossRef]
  25. Szeri, A. Tribology—Friction, Lubrication & Wear; Hemisphere Pubs.: Washington, DC, USA, 1980. [Google Scholar]
  26. Vannini, G.; Innocenti, A.; Cangioli, F.; Jongsoo, K. Rotordynamic Evaluation of a Large High-Speed Rotor Equipped with Flexure Pivot Journal Bearings and Integral Squeeze Film Damper. In Proceedings of the ASME Turbo Expo 2021: Turbomachinery Technical Conference and Exposition. Volume 9B: Structures and Dynamics, Virtual, Online, 7–11 June 2021; p. V09BT28A001. [Google Scholar] [CrossRef]
  27. API Standard 617 Axial and Centrifugal Compressors and Expander-Compressors, 8th ed.; API Publishing Services: Washington, DC, USA, 2014.
Figure 1. Drawing of the experimental apparatus used for testing TPJB.
Machines 09 00273 g001
Figure 2. Photograph of the test rig.
Machines 09 00273 g002
Figure 3. Section of the test apparatus on a plane orthogonal to the bearing axis.
Machines 09 00273 g003
Figure 4. Section of the test apparatus on a plane containing the bearing axis.
Machines 09 00273 g004
Figure 5. Tested bearings: (a) Direct Lube Rocker Pivot, (b) Flooded Rocker Pivot, (c) Flooded Ball & Socket Pivot. © 2020 Baker Hughes Company—All rights reserved.
Machines 09 00273 g005
Figure 6. Scheme for pivot geometry explanation.
Machines 09 00273 g006
Figure 7. Direct Lube Rocker Pivot bearing with thermocouples position.
Machines 09 00273 g007
Figure 8. Flooded Rocker Pivot bearing with thermocouples position.
Machines 09 00273 g008
Figure 9. Flooded Ball & Socket Pivot bearing with thermocouples position.
Machines 09 00273 g009
Figure 10. Direct Lube Bearing clearance profile from the bump test.
Machines 09 00273 g010
Figure 11. Flooded Rocker Pivot bearing clearance profile from the bump test.
Machines 09 00273 g011
Figure 12. Flooded Ball & Socket Pivot bearing clearance profile from the bump test.
Machines 09 00273 g012
Figure 13. Direct Lube Rocker Pivot bearing shaft centerline with detail on the right.
Machines 09 00273 g013
Figure 14. Flooded Rocker Pivot bearing shaft centerline with detail on the right.
Machines 09 00273 g014
Figure 15. Flooded Ball & Socket Pivot bearing shaft centerline with detail on the right.
Machines 09 00273 g015
Figure 16. Direct Lube Rocker Pivot bearing pad temperatures @ 75% of pad arc: (a) 0.8 MPa, (b) 1.7 MPa.
Machines 09 00273 g016
Figure 17. Direct Lube Rocker Pivot bearing pad temperatures @ 25% of pad arc: (a) 0.8 MPa, (b) 1.7 MPa.
Machines 09 00273 g017
Figure 18. Flooded Rocker Pivot bearing pad temperatures @ 75% of pad arc: (a) 1.3 MPa, (b) 2.1 MPa.
Machines 09 00273 g018
Figure 19. Flooded Rocker Pivot bearing pad temperatures @ 25% of pad arc: (a) 1.3 MPa, (b) 2.1 MPa.
Machines 09 00273 g019
Figure 20. Flooded Ball & Socket Pivot bearing pad temperatures @ 75% of pad arc: (a) 1.0 MPa, (b) 1.7 MPa.
Machines 09 00273 g020
Figure 21. Flooded Ball & Socket Pivot bearing pad temperatures @ 25% of pad arc: (a) 1.0 MPa, (b) 1.7 MPa.
Machines 09 00273 g021
Figure 22. Direct Lube Rocker Pivot bearing pad power losses.
Machines 09 00273 g022
Figure 23. Flooded Rocker Pivot bearing pad power losses.
Machines 09 00273 g023
Figure 24. Flooded Ball & Socket Pivot bearing pad power losses.
Machines 09 00273 g024
Figure 25. Direct Lube Rocker Pivot bearing asynchronous direct stiffness coefficients at various speeds for 0.8 MPa and 1.7 MPa: (a) Kxx, (b) Kyy.
Machines 09 00273 g025
Figure 26. Direct Lube Rocker Pivot bearing asynchronous direct coefficients at various speeds for 0.8 MPa and 1.7 MPa: (a) Cxx, (b) Cyy.
Machines 09 00273 g026
Figure 27. Direct Lube Rocker Pivot bearing synchronous direct stiffness: (a) 0.8 MPa, (b) 1.7 MPa.
Machines 09 00273 g027
Figure 28. Direct Lube Rocker Pivot bearing synchronous cross-coupling stiffness: (a) 0.8 MPa, (b) 1.7 MPa.
Machines 09 00273 g028
Figure 29. Flooded Rocker Pivot bearing synchronous direct stiffness: (a) 1.3 MPa, (b) 2.1 MPa.
Machines 09 00273 g029
Figure 30. Flooded Rocker Pivot bearing synchronous cross-coupling stiffness: (a) 1.3 MPa, (b) 2.1 MPa.
Machines 09 00273 g030
Figure 31. Flooded Ball & Socket Pivot bearing synchronous direct stiffness: (a) 1.0 MPa, (b) 1.7 MPa.
Machines 09 00273 g031
Figure 32. Flooded Ball & Socket Pivot bearing synchronous cross-coupling stiffness: (a) 1.0 MPa, (b) 1.7 MPa.
Machines 09 00273 g032
Figure 33. Direct Lube Rocker Pivot bearing synchronous direct damping: (a) 0.8 MPa, (b) 1.7 MPa.
Machines 09 00273 g033
Figure 34. Direct Lube Rocker Pivot bearing synchronous cross-coupling damping: (a) 0.8 MPa, (b) 1.7 MPa.
Machines 09 00273 g034
Figure 35. Flooded Rocker Pivot bearing synchronous direct damping: (a) 1.3 MPa, (b) 2.1 MPa.
Machines 09 00273 g035
Figure 36. Flooded Rocker Pivot bearing synchronous cross-coupling damping: (a) 1.3 MPa, (b) 2.1 MPa.
Machines 09 00273 g036
Figure 37. Flooded Ball & Socket Pivot bearing synchronous direct damping: (a) 1.0 MPa, (b) 1.7 MPa.
Machines 09 00273 g037
Figure 38. Flooded Ball & Socket Pivot bearing synchronous cross-coupling damping: (a) 1.0 MPa, (b) 1.7 MPa.
Machines 09 00273 g038
Figure 39. Dummy rotor rotordynamic model.
Machines 09 00273 g039
Table 1. Capabilities of the experimental plant.
CharacteristicUnitValue
Electric motor maximum powerkW630
Electric motor maximum rotational speedRpm4000
Electric motor nominal torqueNm3000
Bearing rotor speedRpm0–24,000
Toque meter full scaleNm1000
Static load actuator full scalekN270
Dynamic load actuator full scalekN30
Dynamic load frequencyHz0–350
Bearing oil flow rateL/min125–1100
Bearing oil inlet temperature°C30–120
Bearing storage tank capacityL4000
Pump for the hydraulic jacks maximum pressureBar315
Plant maximum total powerkW1000
Table 2. Measurement range and linearity error for all dynamic sensors. The values of linearity error are the minimum and maximum ones of the installed units for that type of sensor.
SensorTypeRangeLinearity Error (%)
ProximitorEddy-current sensor0–2 mm0.1–1.5
AccelerometerPiezoelectric sensor±250 g
up to 10 kHz
0.1–2.1
Triaxial load cell (axial)Custom Strain gauges sensor±35 kN1–1.5
Triaxial load cell (tangential)Custom Strain gauges sensor±5 kN1.2–2.3
Axial load cell (static load)Commercial Strain gauges sensor0–300 kN1.4
Instrumented stingerCustom Strain gauges sensor±2 kN4.89
Axial load cell (anti-roll arm)Commercial Strain gauges sensor±2 kN0.25
Table 3. Characteristics of the test rig in the present configuration.
CharacteristicUnitValue
Test bearing diametermm250–300
Test bearing length to diameter ratio-0.4–1
Test bearing rotational speedrpm300–12,000
Test bearing peripheral speedm/s5–150
Test bearing maximum applicable torqueNm500
Static loadkN5–270
Dynamic loadkN1–40
Dynamic load frequencyHz1–200
Sampling frequencykHz25–100
Bearing oil inlet temperature°C40–120
Table 4. Test articles data.
CharacteristicDirect Lube Rocker PivotFlooded Rocker PivotFlooded
Ball & Socket Pivot
Pad number554
L/D0.70.550.7
Pad arc545275
Pivot typeCylindricCylindricBall & Socket
Min\Max bearing clearance (o/oo)1.43\1.781.57\1.821.33\1.76
Min\Max bearing clearance (mm)0.400\0.4980.440\0.510.372\0.493
Design load operating conditions (MPa)0.8 and 1.71.3 and 2.11.0 and 1.7
Table 5. Geometric Shaft Sink.
Shaft SinkDirect Lube Rocker PivotFlooded Rocker PivotFlooded
Ball & Socket Pivot
Below centered position, s (mm)0.2870.2940.350
Below bearing clearance, s-cr (mm)0.0460.0390.103
Table 6. Rotordynamics Comparison—1st Mode.
Bearing Data1st Synch Mode
Log Dec
1st Synch Mode
Freq (rpm)
1st Mode
Log Dec @ MCS
Direct Lube Rocker Pivot0.21112360.077
Flooded Rocker Pivot0.04112670.021
Flooded Ball&Socket Pivot0.14312780.091
Table 7. Rotordynamics Comparison—2nd Mode.
Bearing Data 2nd Synch Mode
Log Dec
2nd Synch Mode
Freq (rpm)
AF2
Direct Lube Rocker Pivot0.385 4354.4 8.1
Flooded Rocker Pivot0.176 4275.7 17
Flooded Ball&Socket Pivot0.4574354.86.8
Publisher’s Note: MDPI stays neutral with regard to jurisdictional claims in published maps and institutional affiliations.

