Review

Review of Multiaxial Testing for Very High Cycle Fatigue: From ‘Conventional’ to Ultrasonic Machines

1
IDMEC, Instituto Superior Técnico, University of Lisbon, 1049-001 Lisboa, Portugal
2
School of Engineering and Computer Science, University of Hertfordshire, Hatfield AL10 9AB, UK
3
Atlântica, Escola Universitária, 2730-036 Barcarena, Portugal
4
Department of Design and Engineering, Faculty of Science and Technology, Bournemouth University, Poole BH12 5BB, UK
*
Author to whom correspondence should be addressed.
Machines 2020, 8(2), 25; https://doi.org/10.3390/machines8020025
Submission received: 17 April 2020 / Revised: 7 May 2020 / Accepted: 12 May 2020 / Published: 13 May 2020

Abstract

:
Fatigue is one of the main causes for in service failure of mechanical components and structures. With the development of new materials, such as high strength aluminium or titanium alloys with different microstructures from steels, materials no longer have a fatigue limit in the classical sense, where it was accepted that they would have ‘infinite life’ from 10 million (107) cycles. The emergence of new materials used in critical mechanical parts, including parts obtained from metal additive manufacturing (AM), the need for weight reduction and the ambition to travel greater distances in shorter periods of time, have brought many challenges to design engineers, since they demand predictability of material properties and that they are readily available. Most fatigue testing today still uses uniaxial loads. However, it is generally recognised that multiaxial stresses occur in many full-scale structures, being rare the occurrence of pure uniaxial stress states. By combining both Ultrasonic Fatigue Testing with multiaxial testing through Single-Input-Multiple-Output Modal Analysis, the high costs of both equipment and time to conduct experiments have seen a massive improvement. It is presently possible to test materials under multiaxial loading conditions and for a very high number of cycles in a fraction of the time compared to non-ultrasonic fatigue testing methods (days compared to months or years). This work presents the current status of ultrasonic fatigue testing machines working at a frequency of 20 kHz to date, with emphasis on multiaxial fatigue and very high cycle fatigue. Special attention will be put into the performance of multiaxial fatigue tests of classical cylindrical specimens under tension/torsion and flat cruciform specimens under in-plane bi-axial testing using low cost piezoelectric transducers. Together with the description of the testing machines and associated instrumentation, some experimental results of fatigue tests are presented in order to demonstrate how ultrasonic fatigue testing can be used to determine the behaviour of a steel alloy from a railway wheel at very high cycle fatigue regime when subjected to multiaxial tension/torsion loadings.

Graphical Abstract

1. Introduction

Fatigue is an inevitable process that occurs in structural parts subjected to variable loads. If ignored, it can lead to catastrophic failure with inevitable economic costs and threat to human life. It is estimated that about 90% of all metallic failures are due to fatigue [1]. The pioneering research work performed by Wohler in the middle of the 19th century when investigating failure causes of railway axles, led to the concept of endurance limit and the early rules for fatigue design [2].
The emergence of new technologies and manufacturing processes, together with the need to increase the lifetime and safety of mechanical systems, led to the need to increase the fatigue life of load-bearing mechanical components [3]. For example, spaceships will be launching passengers from New York to Shanghai in 29 min by 2030, says the Swiss bank UBS [4]. Thus, updated fatigue data is necessary to design mechanical components that will be subjected to extended lifetimes in comparison to the past [5]. Moreover, the emergence of additive manufacturing (AM) materials, which can present anisotropy and heterogeneous microstructure, brought new challenges to material testing and characterisation [6]. This is the case of the high-quality standards of manufacturing industries using AM materials, which demand predictability of material properties for static and dynamic load cases.
With the development of new materials, such as high strength aluminium or titanium alloys with different microstructures from steels, materials are not expected to have a fatigue limit in the classical sense, where it was accepted that the fatigue limit is the stress level such that there is no fracture up to 10 million (107) cycles [3,7]. This limit, referred to as ‘infinite’ fatigue life, has already been dismissed [8,9]. This led to the need to improve S-N (stress vs. cycles to failure) curves and eliminate the endurance limit by extending the concept of fatigue to over 1 billion cycles (109) [10]. However, in classical testing, the low operating frequencies require lengthy times for the completion of tests. For example, servo-hydraulic machines working at 50 Hz would take 8 months to complete 109 cycles, if no interruptions were made. The recent development of ultrasonic fatigue testing (UFT) machines where frequencies can go above 20 kHz enabled tests to be extended to ranges greater than 109 in a matter of hours or days, which is an advantage to industries wanting to deploy new materials into their products. This area of study, which is gaining increased notoriety [8] largely due to the appearance of UFT machines [11], is now known as gigacycle or Very High Cycle Fatigue (VHCF).
Most of the fatigue test equipment are uniaxial test machines [12], in the sense that the state of stress created is unidirectional. However, it is generally recognised that multiaxial stresses occur in many full-scale structures, being rare the occurrence of pure uniaxial stress states [2]. This includes critical components used in the aerospace, automotive, naval, medical or oil and gas industries, which are usually subjected to multiaxial loads [13,14]. Two of the existing machines for biaxial fatigue testing are the combined tension-torsion (which includes compression-torsion) and combined in-plane tension-tension (which includes tension-tension, tension-compression, or compression-compression). The first method uses solid and thin-walled cylinder specimens (tubes), whereas the second one employs cruciform specimens [12]. The combined tension-torsion test is commonly used to assess the fatigue life of shafts and similar components. However, besides allowing for only a few stress states to be simulated, it requires the material to come in the form of circular tubes, being difficult to be applied to rolled sheet and composite materials [12]. Nevertheless, recently, Costa et al. presented a new specimen and horn design for combined tension—torsion ultrasonic fatigue testing in the VHCF regime [15]. Results show that it is possible to carry out tension-torsion loading fatigue tests at very high frequencies. Typical biaxial in-plane fatigue machines require symmetry to ensure that the centre of the specimen does not move during the test, meaning that the four actuators must be precisely synchronised [12,16]. Furthermore, even if electric actuators have lately been replacing servo-hydraulic ones, most available in-plane biaxial machines still use the latter. Thus, in most cases, the installation and maintenance costs are prohibitive for most of the laboratories, even if a lower capacity is required [12]. Moreover, these machines are not good candidates to be used in VHCF due to the low operating frequencies. This results in lengthy lead times (usually unfeasible) for tests to be completed up to 109 cycles.
As already mentioned, most UFT in the literature is based on uniaxial tension-compression machines [17,18,19], although pure torsion UFT machines have also been developed [20,21,22]. More recently, the concepts of biaxial and VHCF fatigue were combined with the development of cylindrical specimens for tension/torsion UFT [15,23]; cruciform specimens for tension/tension in-plane UFT [24,25,26]; and disc-shaped specimens for multiaxial bending UFT [27].
This paper presents a review of recent developments on multiaxial UFT, including descriptions of the main equipment, instrumentation, and specimens. Original experimental results of UFT conducted on a Steel alloy from a Railway wheel and on an aluminium alloy are also presented in order to demonstrate the capability of multiaxial loading testing in the VHCF regime. The paper starts with an overview of what UFT is and how it is implemented, with a focus on uniaxial test specimens. Then, a review of multiaxial fatigue using ‘conventional’ test methods and speeds is presented, so that the integration of both multiaxial testing and UFT can be better understood.

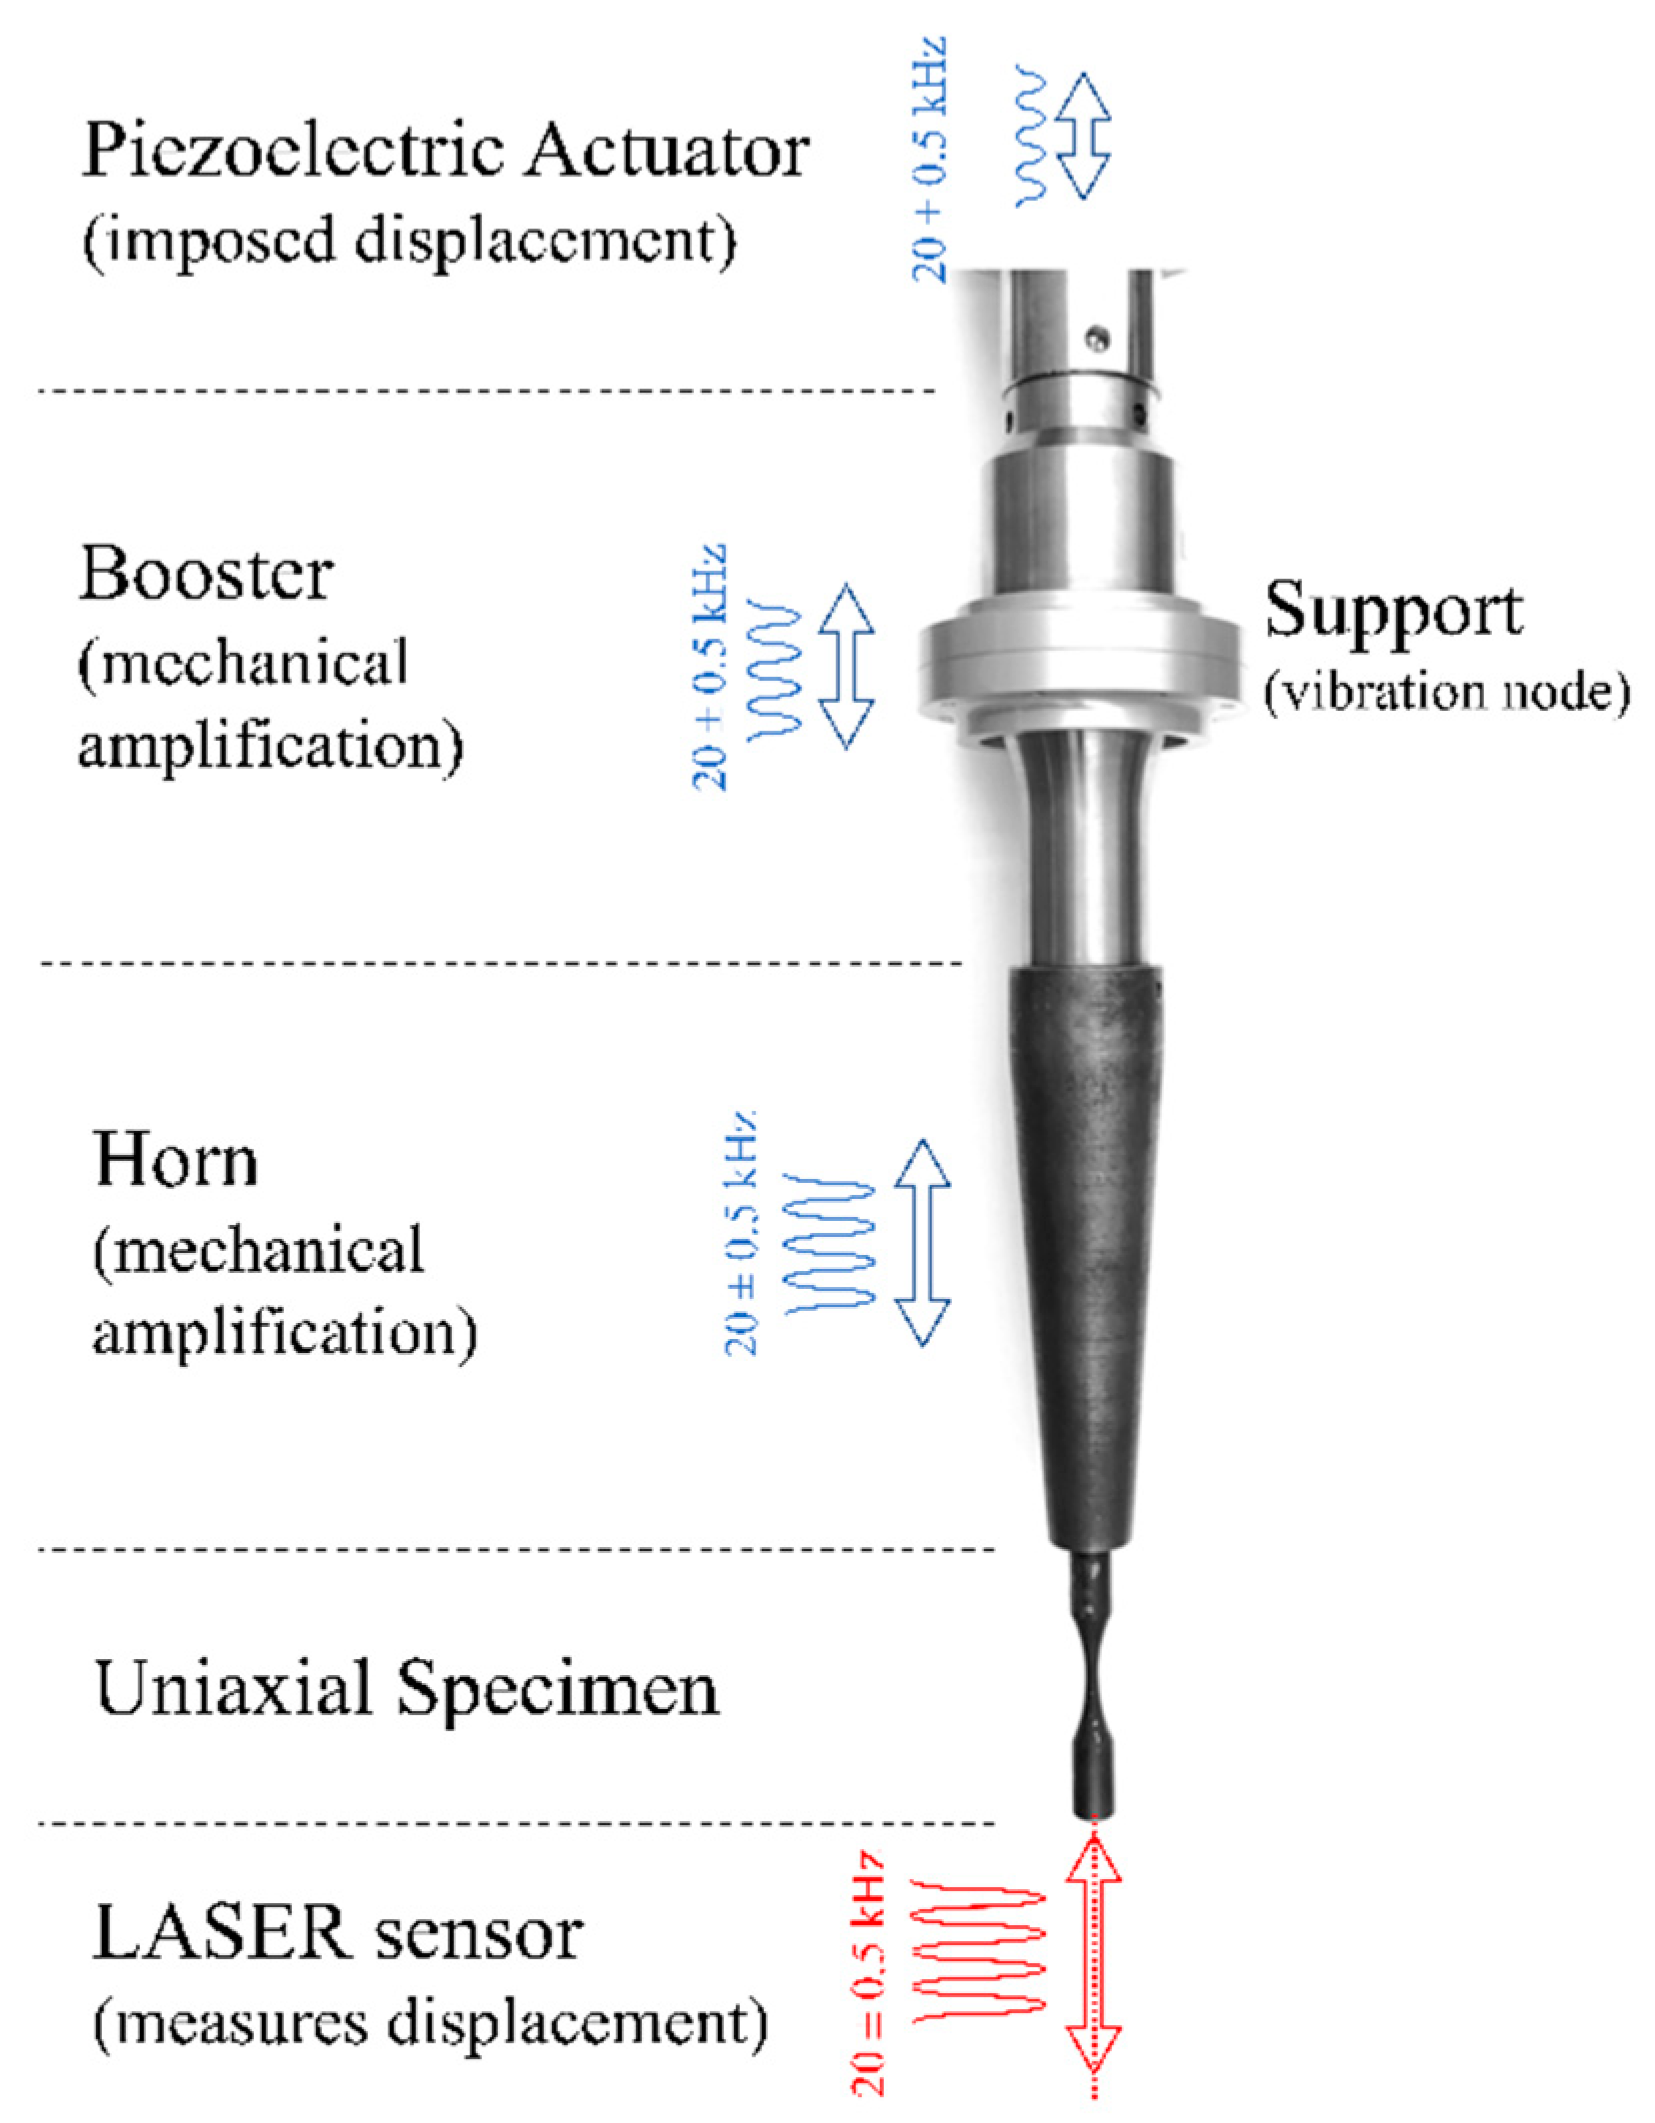
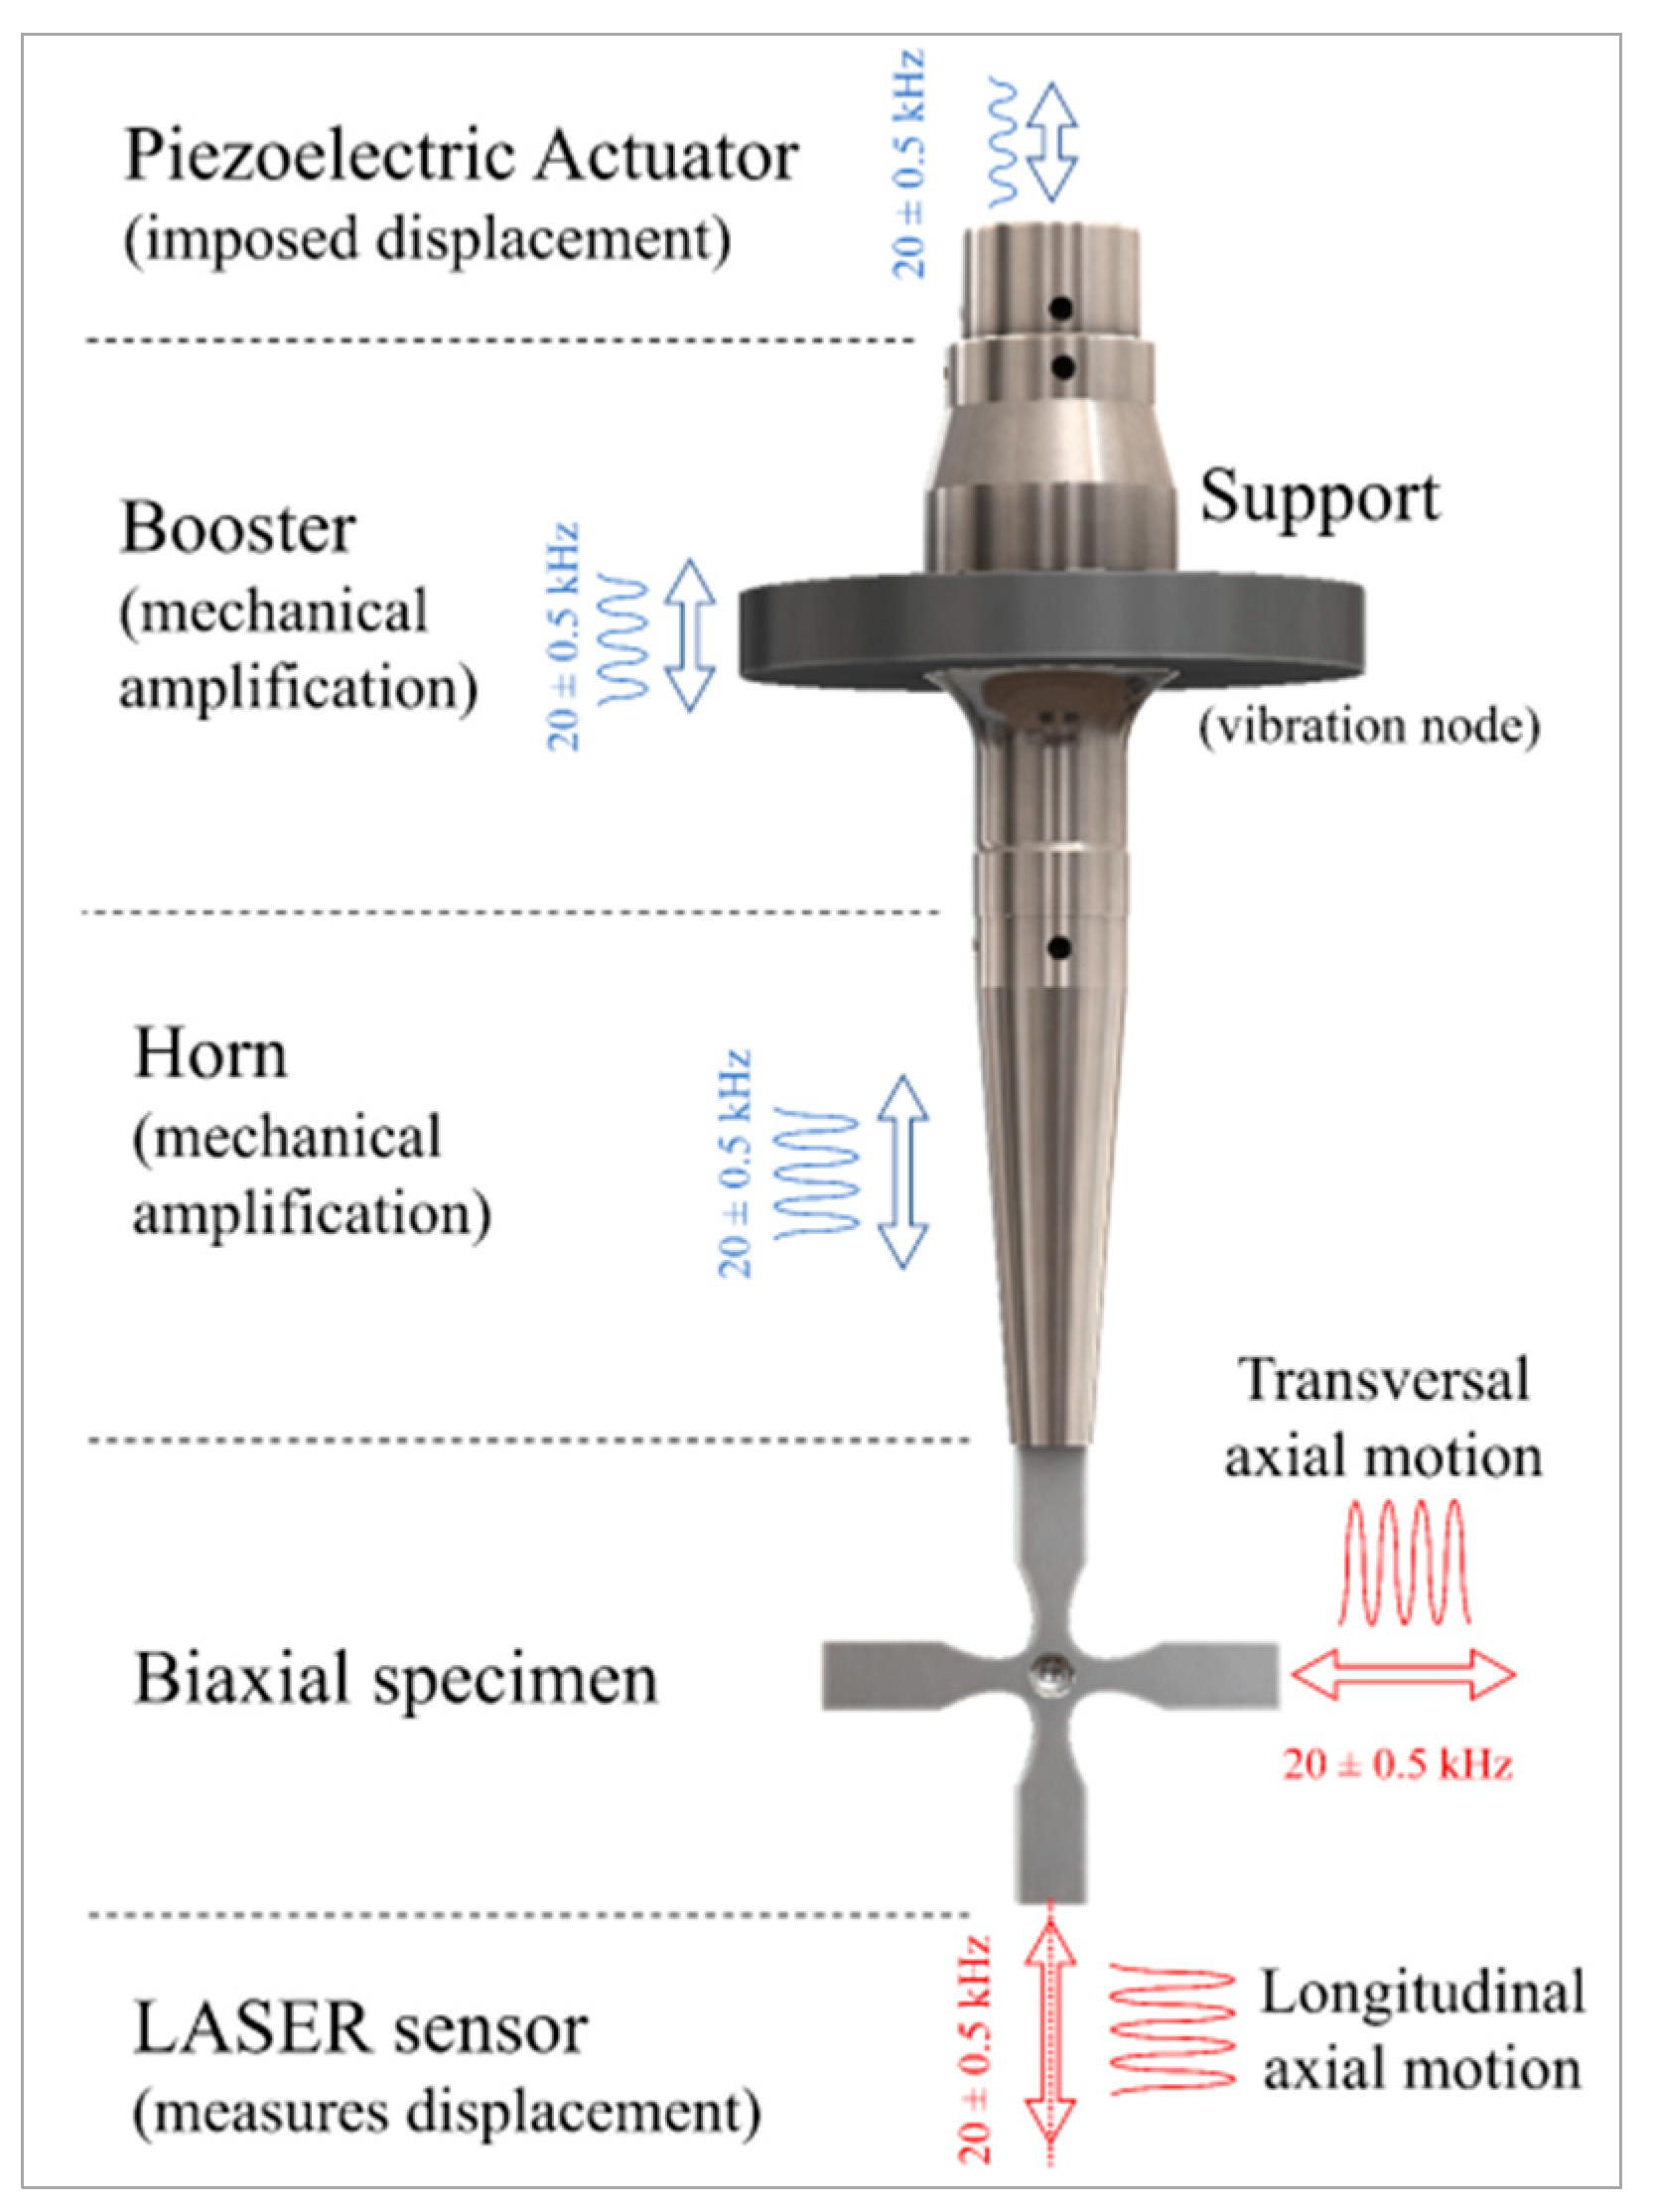
2. Ultrasonic Fatigue Testing at Very High Number of Cycles

The advantages of UFT, associated with the improvements in piezoelectric devices, made these fatigue testing methods an attractive technique to establish S-N curves in VHCF. Research into the VHCF range was largely facilitated over the last seven decades thanks to the massive improvement of the technology available for testing. The development started with Hopkinson at the beginning of the 19th century with testing frequencies around 116 Hz and continuously evolved until 1950, when Mason introduced the concept of ultrasonic machine operating at 20 kHz [3,10,28,29]. The piezoelectric technique at 20 kHz was established as the frequency testing norm [30]. Other machines operating at higher frequencies were presented but the difficulties to correlate results and experiments slowed down the development of this technique. Presently [10], with the development of new sensors, new computational methods, and faster and more efficient control systems, VHCF gained increasing popularity as many of the challenges in the past could be addressed from incorporating technological innovation.
In classical fatigue testing, the machines’ low operating frequencies require unfeasible lengths of time for the completion of tests up to 109 cycles. For example, typical rotating bending machines operate at frequencies up to 30 Hz, servo-hydraulic machines work at frequencies up to 50 Hz and resonant fatigue machines work at up to 150 Hz [25]. This means that to achieve 109 cycles, ‘conventional’ testing may require a machine to be operating between 2 months to more than 1 year, and this is 24/7, i.e., without any interruptions (see Table 1). The recent development of UFT machines where frequencies can go as high as 20 kHz (or more) enabled tests to be extended to ranges larger than 109 in a fraction of the time, as little as 14 h (in theory), if no interruptions had to be made. Therefore, as demonstrated in Table 1, one can highlight a remarkable time and money-saving aspect which allows tests to take up to 400 times less time than with ‘conventional’ methods [31,32,33,34,35]: from days to minutes, from months to hours, from years to days, from decades to weeks. Another attractive facet of this testing method is the great versatility offered for testing different types of fatigue such as tension [17,18,19], torsional [20,21,22], bending or flexural [23,27], fretting [23,27] and even corrosion fatigue [36]. The effects of diverse temperature environments, hot [37,38] or cold [11], or loading patterns [26,39] with different stress and biaxiality ratios can also be investigated to try and replicate real-life field conditions.
Figure 1 shows a servo-hydraulic ‘conventional’ machine and an UFT machine, both being used to test uniaxial steel specimens. One interesting thing to notice, and which will be important to understand for the development of multiaxial UFT, is that the UFT machine does not require both ends of the specimen to be attached as the ‘conventional’ machine requires. UFT specimens are designed to have a particular mode shape vibrating at a given frequency: the operating frequency of the machine, usually 20 kHz. Therefore, if we take the principles of Single-Input-Multiple-Output (SIMO) Modal Analysis, the only requirement is that the connection between the machine and the specimen is done at a coordinate that is an anti-node of that particular mode shape [25].
The resonant system is composed by a piezoelectric actuator, a booster, a horn, and the specimen sequentially assembled together in series by screw connections. These four elements form the resonant system of the testing machine (Figure 2). The mechanical vibration generated by the piezoelectric actuator is meant to reproduce a pure sine wave with a frequency of 20 ± 0.5 kHz (Figure 2). This wave is transmitted from element to element down to the bottom of the specimen with the displacement and stresses schematically shown in Figure 3. The principle of operation of the vibration system is based on free vibration resulting in a minimum of force contact between the elements. The booster and horn (typically, a conical sonotrode) are also used to amplify the amplitude of the vibrations transmitted to the test specimen.
Besides the resonant system just described, UFT machines should also include (Figure 4):
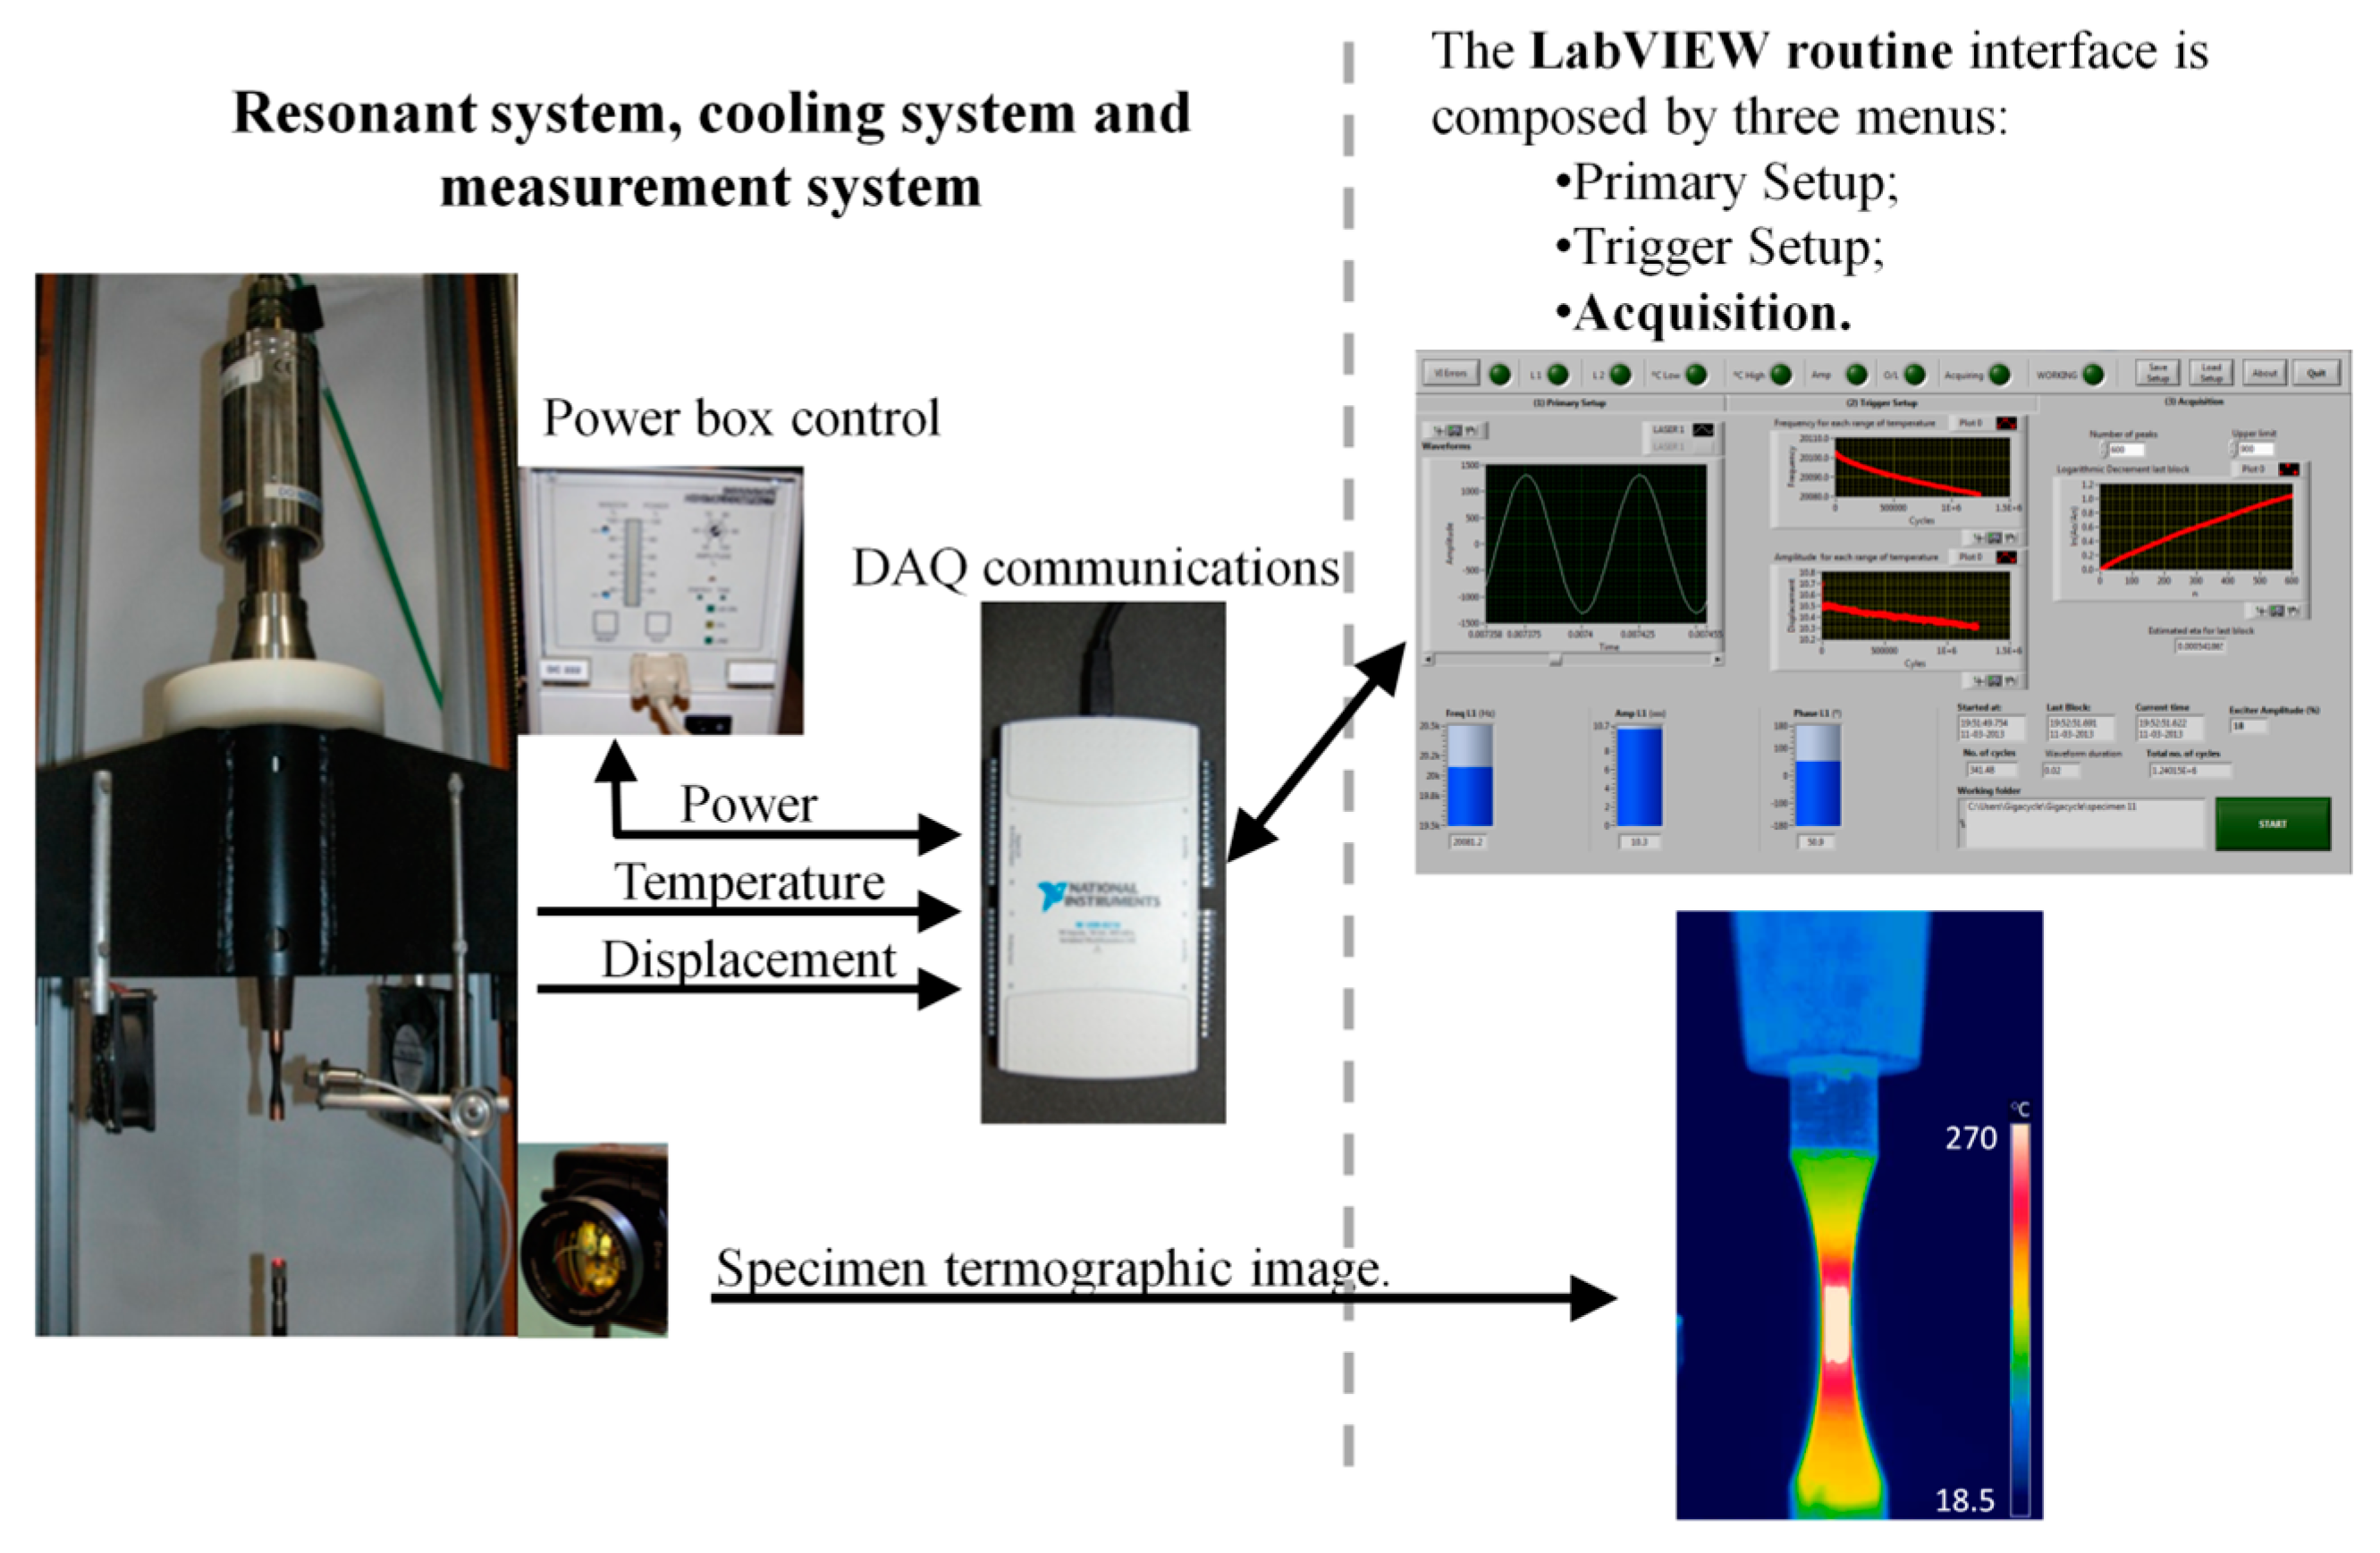
  • A measurement or data acquisition system which can be made of various instrumentation devices from strain gauges, laser doppler vibrometers, thermocouples, infrared cameras, and other data-gathering transducers. Here, different configurations can be found due to resources’ limitations (usually budget related) or the objectives of the experiments being conducted;
  • A control or safeguarding system which monitors and maintains suitable conditions for the experiment through the implementation of a feedback control loop system, for example. This system is usually responsible for avoiding the overheating of the test specimen, which has is one of the greatest problems in UFT.
A fairly sizeable amount of work has been done over the years in VHCF testing with very satisfactory results in uniaxial testing [10,40,41,42]. The vast majority of that research was conducted with uniaxial test specimens. The most popular test methodologies tend to make use of fatigue specimens in the shape of a dumbbell [32,43,44], Gaussian curve [45] or hourglass [10,33,34], where the thinner middle part acts as a stress concentrator as depicted in Figure 5.

3. Multiaxial Fatigue Testing

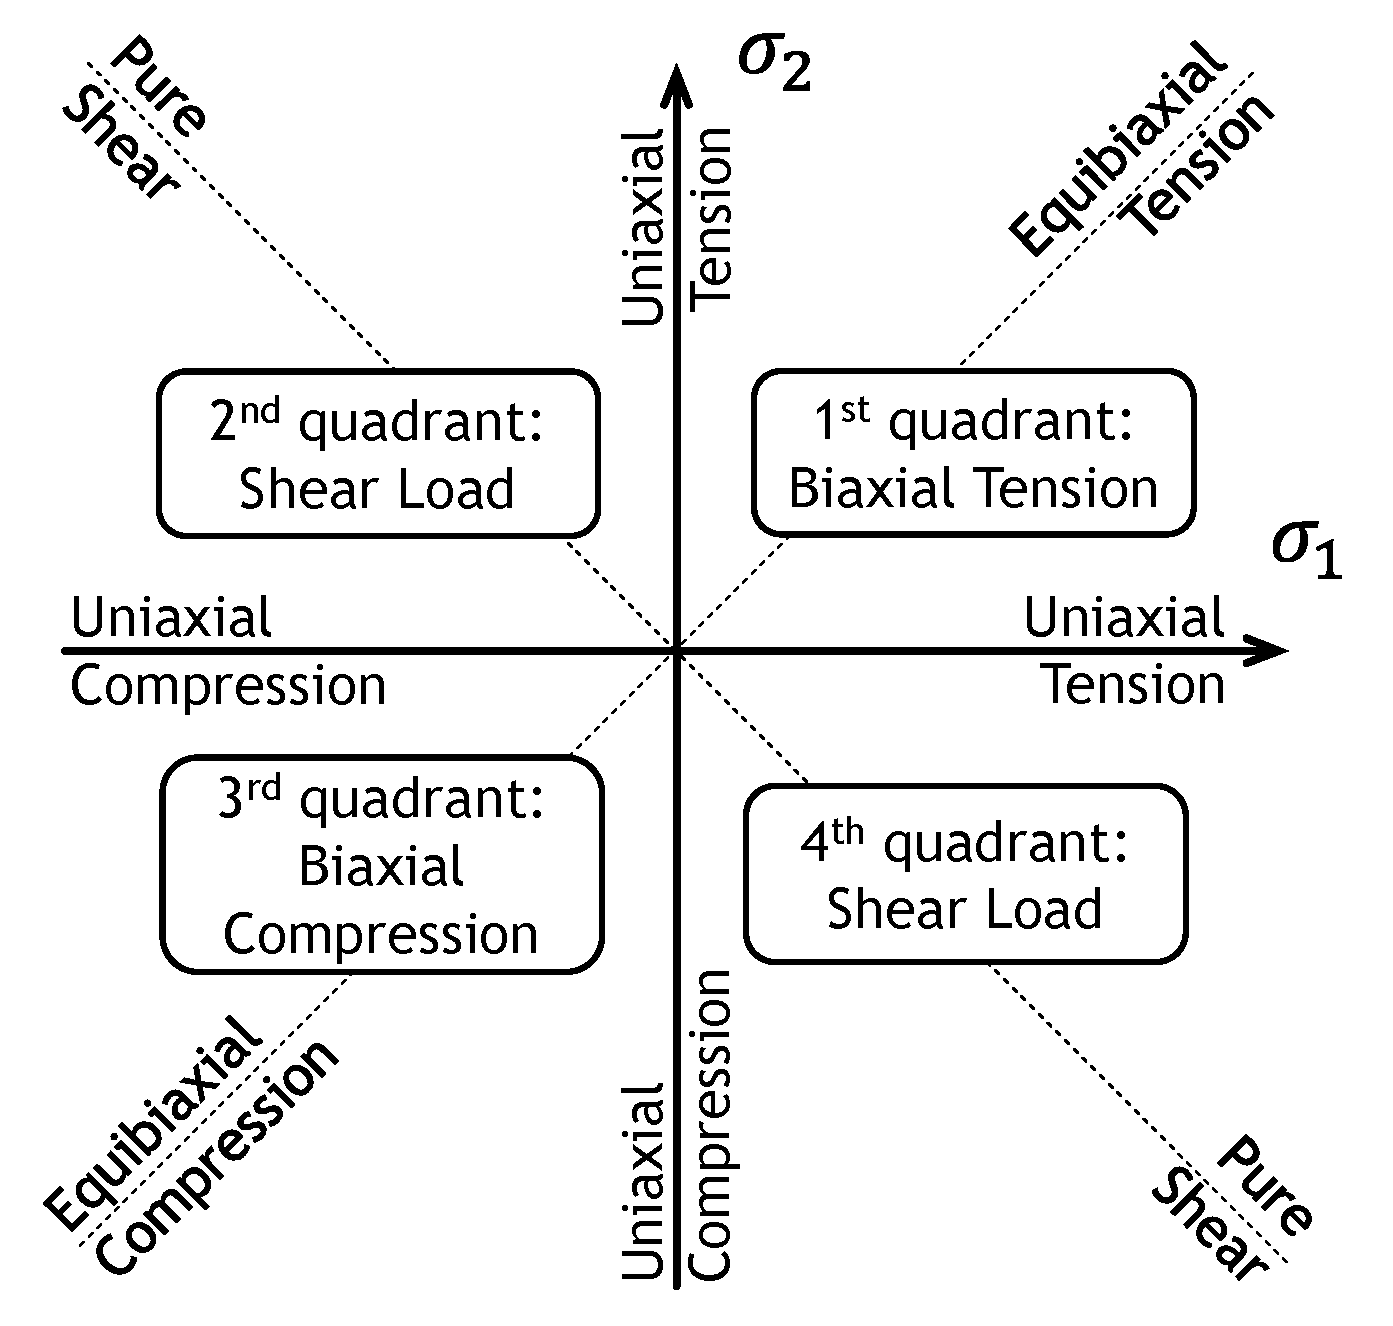
3.1. Multiaxial Stress States

Most fatigue testing today still uses uniaxial loads; however, real critical parts are usually exposed to multiaxial loads. This is the case, for example, of the fuselage and wings of aircraft which are subjected to in-plane biaxial states of stress [26], a drive shaft under combined bending and twisting [46] or tension in three directions where several parts are welded together. In the latter case, for example, static failure can appear as brittle, because the deviatoric stresses, which are related to plastic slip, can be relatively low even if the hydrostatic stress components are high [47,48].To respond to the challenges imposed by the introduction of new material manufacturing techniques, such as metal AM, multiaxial fatigue testing is developing to become a standard procedure in material testing. By performing multiaxial fatigue testing, a better experimental reproduction of the stresses experienced by materials in real life can be achieved [49]. By the same token, different material behaviour traits and failure modes can be explored [43,50,51,52]. It is considered that biaxial loading of a sample would give a more versatile experimental procedure and a better representation of the true strain field at the tip of a fatigue crack [53]. However, the area of multiaxial UFT is still only just burgeoning with a limited number of publications on the topic.
The term multiaxial fatigue is generally accepted in the literature but indeed it may not be the adequate one since it includes a triaxial stress state which is rarely found in service. Moreover, at the surface of the material, where a large majority of fatigue crack initiation occurs, the stress state is biaxial. Nevertheless, in the present paper both terms biaxial or multiaxial fatigue will be used since they are mentioned in a large majority of the literature and in the International Conference series of multiaxial fatigue and fracture [2].
In many industries, such as aerospace, automotive, maritime, and so on, critical components are generally subjected to complex multiaxial loading conditions. It is important to characterise and develop constitutive models to predict the mechanical behaviour of structural materials under real service loading conditions. Biaxial loading is one particular load case that can be found in many of the industries, being necessary to quantify and clarify the yield criteria and constitutive equations of a particular material. For biaxial fatigue testing, there are currently two methods of producing biaxial stresses in material for different types of specimens [2]. The first method employs thin-walled cylinder tube specimen subjected to combined tension–torsion loading, whereas the second method uses cruciform specimens subjected to the biaxial tension-tension loadings.
To investigate the combination effects of biaxial loading, the general stress state case is considered, Equation (1):
σ x x = σ x x , a sin ( ω t ) + σ x x , m σ y y = σ y y , a sin ( ω t + δ y y ) + σ y y , m σ x y = σ x y , a sin ( ω t + δ x y ) + σ x y , m
where σ x x and σ y y are the normal stresses in the x and y directions, respectively; σ x y is the shear stress; the subscript a refers to the amplitude of the alternating component of the stress; the subscript m refers to the mean value of the stress, ω is the angular frequency of application of the load, and δ y y and δ x y are the phase shifts of the applied stresses with respect to σ x x .
Figure 6 represents schematically the range of biaxial principal stress states, σ 1 and σ 2 , in the four quadrants. It shows the range of possible combination of stresses, from in-plane biaxial stress states in the first and third quadrants to the presence of shear stresses in the second and fourth quadrants.

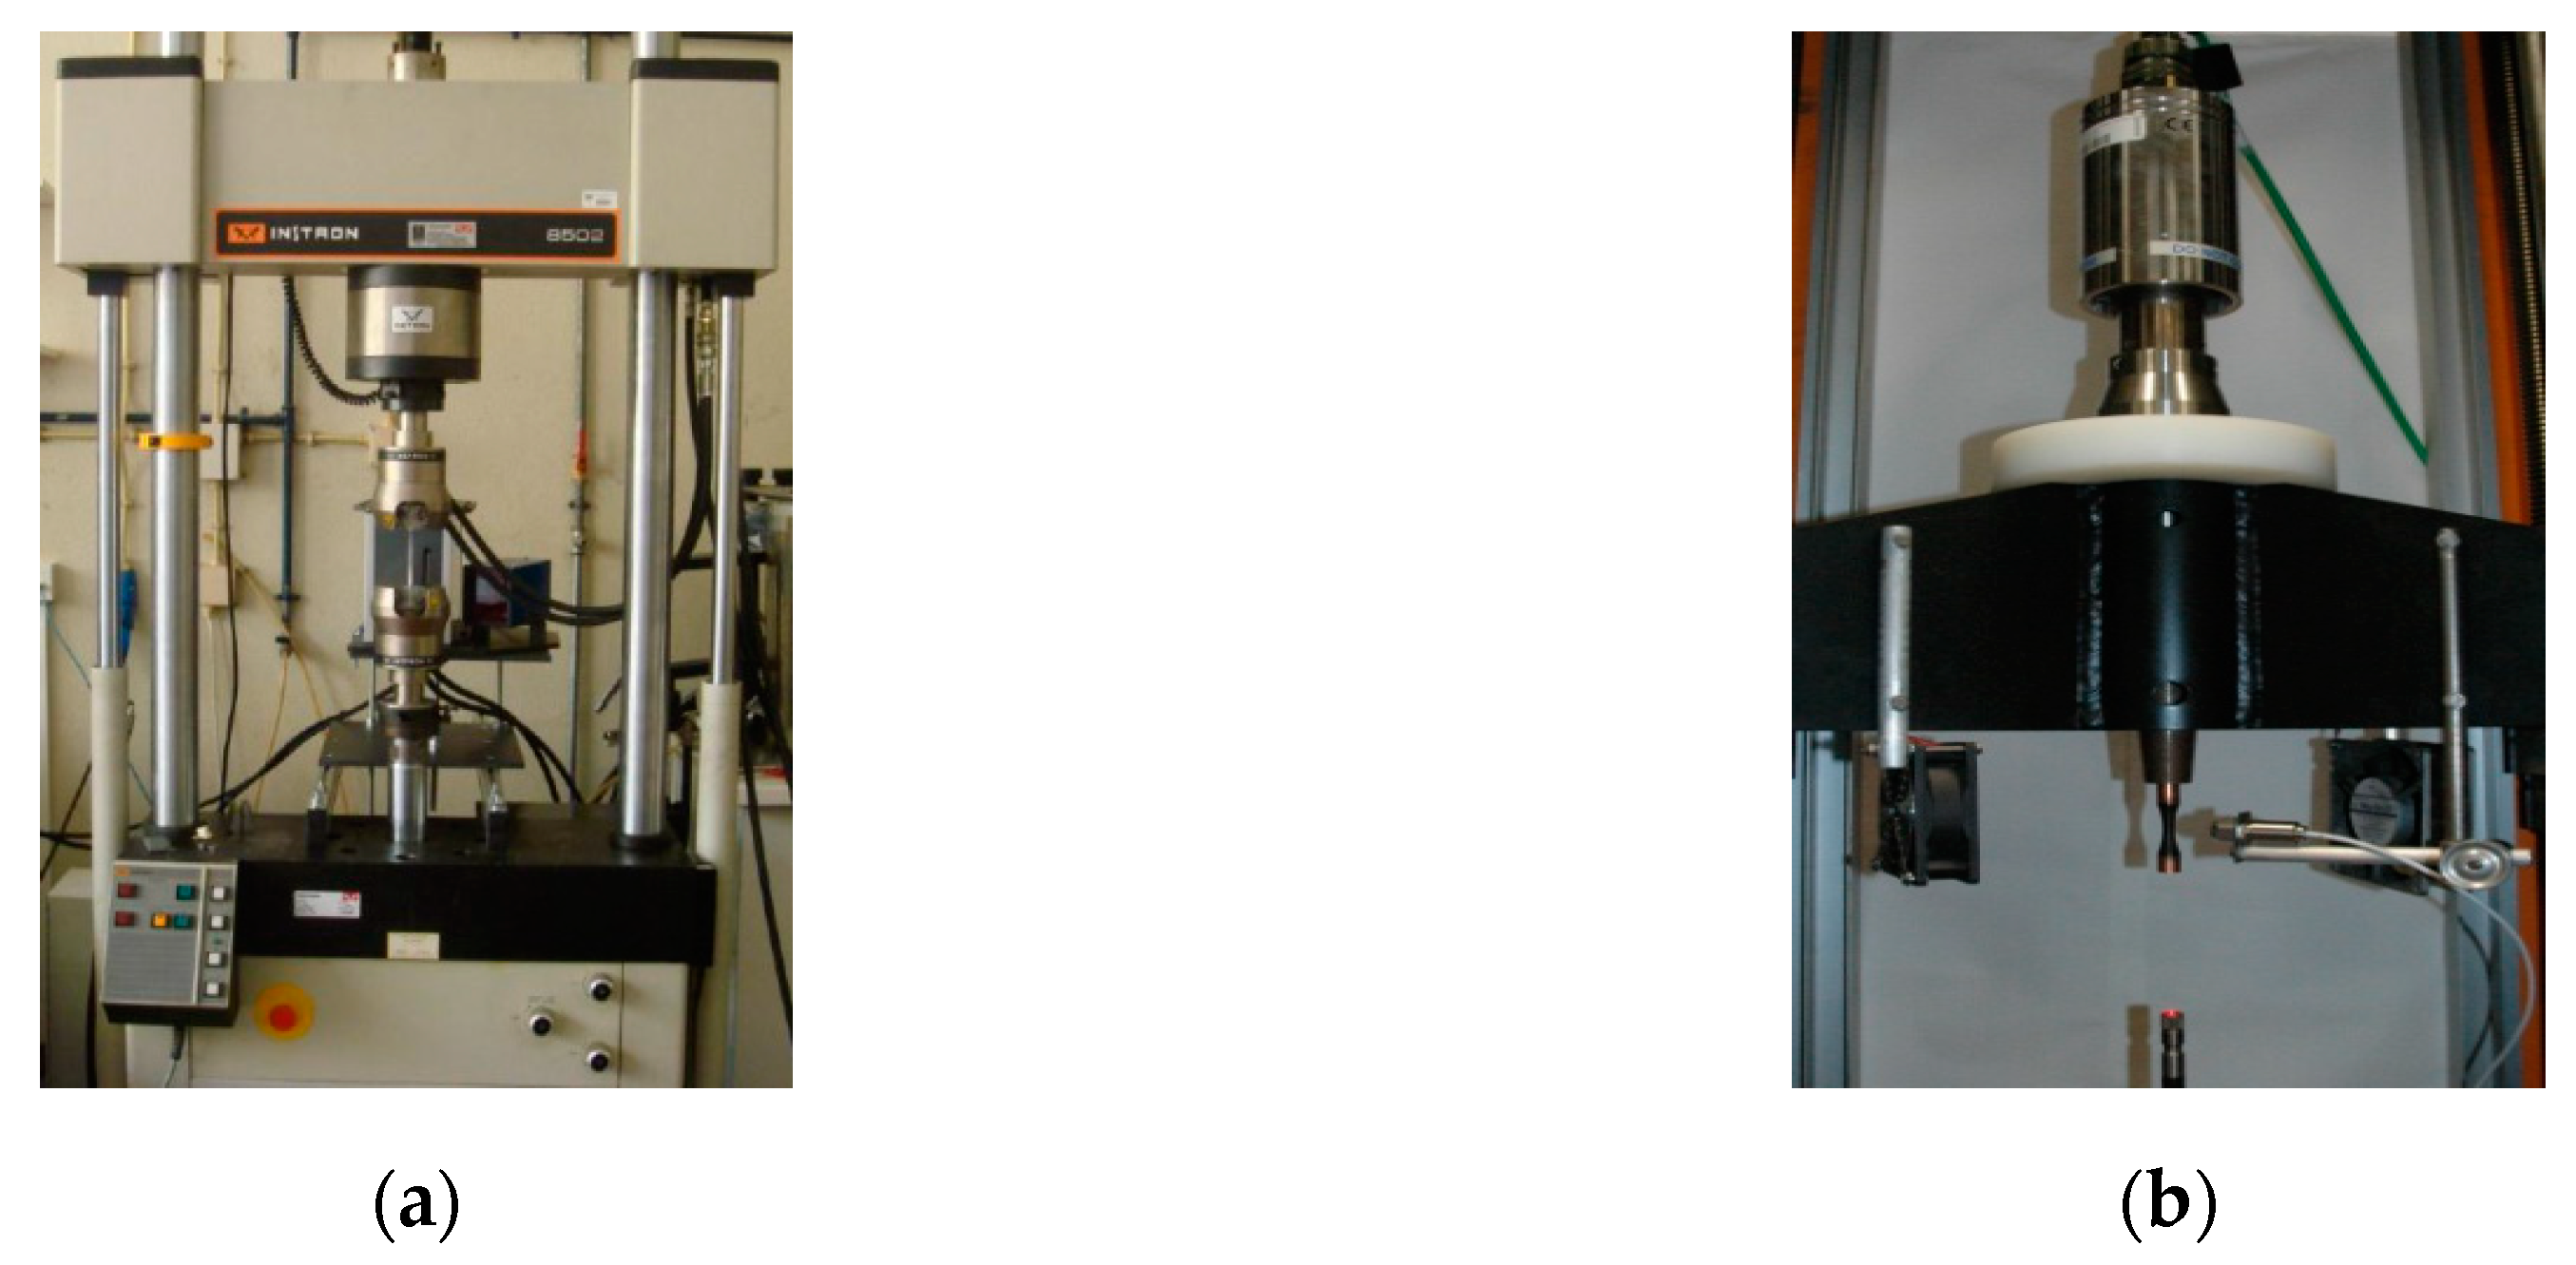
3.2. General Testing Procedures and Machines

Currently most of the experimental fatigue tests are performed in rotating bending or in servo-hydraulic testing machines [2]. Actuators are used to stress test specimens by reproducing any reference signal (waveforms, random spectra, etc.) at frequencies that in some cases can exceed 200 Hz (generally for most of the fatigue tests the working frequency ranges from 5–20 Hz) [2]. However, especially for servo-hydraulic test machines, an enormous amount of energy is lost in the form of heat, which has consequences in running and maintenance costs.
With the development of new technology, most important brands of fatigue testing machines started incorporating electrical linear actuators in their uniaxial testing machines. This can be found in the catalogues of some brands, such as Bose® ElectroForce®, Instron® ElectroPuls™ or MTS®. The commercial success of these actuators is mainly due to the much lower operating costs and many other advantages, such as: little consumables needed, lower electrical consumption, less heat generation, no noise, high cleanliness and almost no wear. The principal drawback is the limitation in load capacity, in which the most powerful machines can only go up to 10 kN (with more than one linear motor in tandem). This is much lower than what can be achieved with hydraulics, but enough to test small samples of most engineering materials [12].
The combined tension–torsion test is popular for biaxial testing. It can be used, for example, to simulate the stress states of driving shafts. In many cases, this is achieved with an accessory that is used in uniaxial servo-hydraulic test machines. However, only some stress states can be simulated by this test type [2]. It means that the biaxial tension (and biaxial compression) stress states cannot be simulated by the combined tension–torsion test system. Another disadvantage is that it requires the material to be in the form of a cylinder or tube, being difficult to be applied to rolled sheet materials and most composite shapes. Therefore, cruciform specimens were introduced instead.
Biaxial in-plane ‘conventional’ fatigue tests usually require at least four actuators to ensure that the centre of the specimen does not move during the test, due to deformation, to ensure symmetry. The servo-hydraulic actuator type is the most common option available in the market for biaxial in-plane fatigue tests. These machines are normally large and can exceed 500 kN of load. The installation and maintenance costs are prohibitive for most laboratories [54], even if a lower capacity is required. Bose® ElectroForce® has an alternative to servo-hydraulic actuators for in-plane biaxial fatigue tests using linear actuators. However, the biaxial testing machine presented in their catalogue has a low capacity of 200 N, being only appropriated to test materials such as soft tissues. Recently, a novel low cost and efficient in-plane biaxial fatigue testing machine, based on linear electrical motors and with an innovative guiding system (using pneumatic bearings) was proposed. This machine can reach up to 1 kN with an operating frequency of 20 Hz, which is suitable to test most metal alloys. With this new fatigue testing machine, together with the development of guidelines for cruciform specimen design, an extensive programme to test several specimens under different combinations of in-plane biaxial loads at a relatively low cost was presented [55,56].
Biaxial fatigue testing on metals tries to replicate a loading situation that would be closer to real-life applications than uniaxial testing. As a matter of fact, rarely would a piece of component be stressed in a singular direction during operation. One would expect materials to be extended or compressed in complex and various manners, which can only be approximated by multiaxial experimental testing [57].
Another primary reason to consider biaxial testing would be because of the high level of anisotropy exhibited by rolled metal sheets. Also, since uniaxial tensile tests and fatigue tests only produce results pertaining to unidirectional loading, those test results might not be adequately suited to properly characterise a multi-directionally formed component. In fact, it has to be noted that in a biaxial loading case, failure can occur at a lower stress level than would have been expected in a uniaxial loading scenario, therefore it is not possible to make a straightforward like for like comparison between uniaxial and biaxial cases [57,58,59,60].
It was shown that in VHCF biaxial testing, the picture is still incomplete. It is, therefore, not surprising to find that most of the study done on biaxial fatigue was undertaken at lower fatigue regimes. Many researchers have even unanimously reported a lack of standardisation for biaxial fatigue testing. There is an absence of standards in the testing methodology and more importantly in the testing specimens [43,50]. This is in stark contrast with uniaxial testing where a large number of standards exist [61].
Despite the fact that the testing procedure can be similar to the uniaxial fatigue cases, applying more than one load complicates matters a lot more. Indeed, in order to have a successful biaxial test, three basic elements need to be present [61]:
  • A machine suitable for applying multiaxial loads and with reliable instrumentation capable of handling complex experimental conditions (temperature, vibrations, etc.);
  • A specimen capable of producing the desired level of biaxiality required across the area of interest which will be the origin of the fatigue failure. This aspect is far from straightforward mainly due to the various spots of stress concentrations encountered with biaxial specimens. Besides, the gauge area is usually fairly limited which can make achieving a good homogenous biaxial stress state a rather thorny task;
  • A test configuration or measuring system which allows for the recording of the necessary data (displacement, stresses, temperature, etc.). Therefore, there needs to be a free or easy access to the surface of the specimen for acquiring data.
Therefore, faced with a multitude of testing rigs and complex methods available, coupled to the difficulty of finding the right specimen for the job, not all existing designs are suitable candidates to be adapted for gigacycle testing.

3.3. Specimens for ‘Conventional’ Multiaxial Fatigue Testing

Considering only research on crack initiation and early crack growth, a large variety of specimens that can be applied in experimental research on multiaxial fatigue [2] include solid cylindrical specimen, tubular specimens, and cruciform specimens. All these specimens can have either notched or unnotched versions. Also, sheet specimens with straight or inclined cracks can be used for mixed mode crack growth research.

3.3.1. Cylindrical Solid and Tubular Biaxial Fatigue Specimens

Toroidal (Figure 7a) and tubular specimens (Figure 7b) are used to carry out tension or bending with torsion fatigue tests, for stress states represented on quadrants 2 and 4 of Figure 6.
Biaxial fatigue testing using cylindrical specimens appears to have been among the most popular methods of biaxial fatigue testing in the early years [62,63,64]. It was highlighted that they provide a very useful flexibility in terms of the type of loads that can be used in the testing [61,64]. This biaxial fatigue test makes use of the capacity of a cylinder to be loaded under a combination of tension or bending with torsion. Hollow specimens can also be loaded by applying internal/external pressure in the specimens, additionally to the tension and torsion applied loading [2]. Tubular cylindrical fatigue testing is rare, mainly due to the difficulty of the apparatus of the multiaxial fatigue testing machine, but indeed it is the only fatigue test that allows the characterisation of the material behaviour with the multiaxial stresses described in Equation (1) [2,65].
Thick-walled tubular specimens are used to replicate real-life structures such as bridge girders [66], high pressure containers, and deep submersibles in power plants or even as protective oil casing conduits in oil and natural gas extraction [67]. On the other hand, thin-walled test pieces appear to be suitable for simulating the loading that could be experienced by shell structures such as a pressure vessel or piping [63], a bicycle frame or even an aircraft wing [68]. However, due to the very nature of their cylindrical shape, these specimens suffer one major drawback: because of the thickness and the fact that the surface of the specimen is curved, the stress state recorded all over the specimen is not constant [63]. The thickness and curvature of the specimen have the debilitating effect of causing a stress gradient to exist across the specimen [61], whether it is solid or tubular. Due to the presence of a stress gradient between the surface and the centre of cylindrical specimens, when bending and/or torsion loadings are applied, it is mandatory that solid cylindrical specimens (Figure 7a) shall be used only in the elastic regime, therefore they are only used to characterise S-N curves where maximum stresses are below the yield stress of the material [2]. However, cylindrical specimens, as shown in Figure 7b, may be used in low cycle fatigue where plasticity is present in order to have a full characterisation of the material’s plastic strain. Due to fact that these specimens are curved, internal/external pressure will have an undesired effect of introducing radial stress into the material [63]. Those radial stresses have more impact on the stress state of the specimen in the thick-wall rather than the thin-wall one where they are conventionally ignored as thin-walled specimens develop a state of plane stress. These observations showed that in some occurrences biaxial thick-wall tubular test specimens tend to fail under triaxial loading rather than the originally intended biaxial loading [69,70,71].
Finally, these cylindrical specimens do not lend themselves very well to rolled and flat sheet materials. As a consequence, the experimental results obtained from biaxial tests on cylindrical specimens cannot be directly applied to flat sheet materials [70,72].

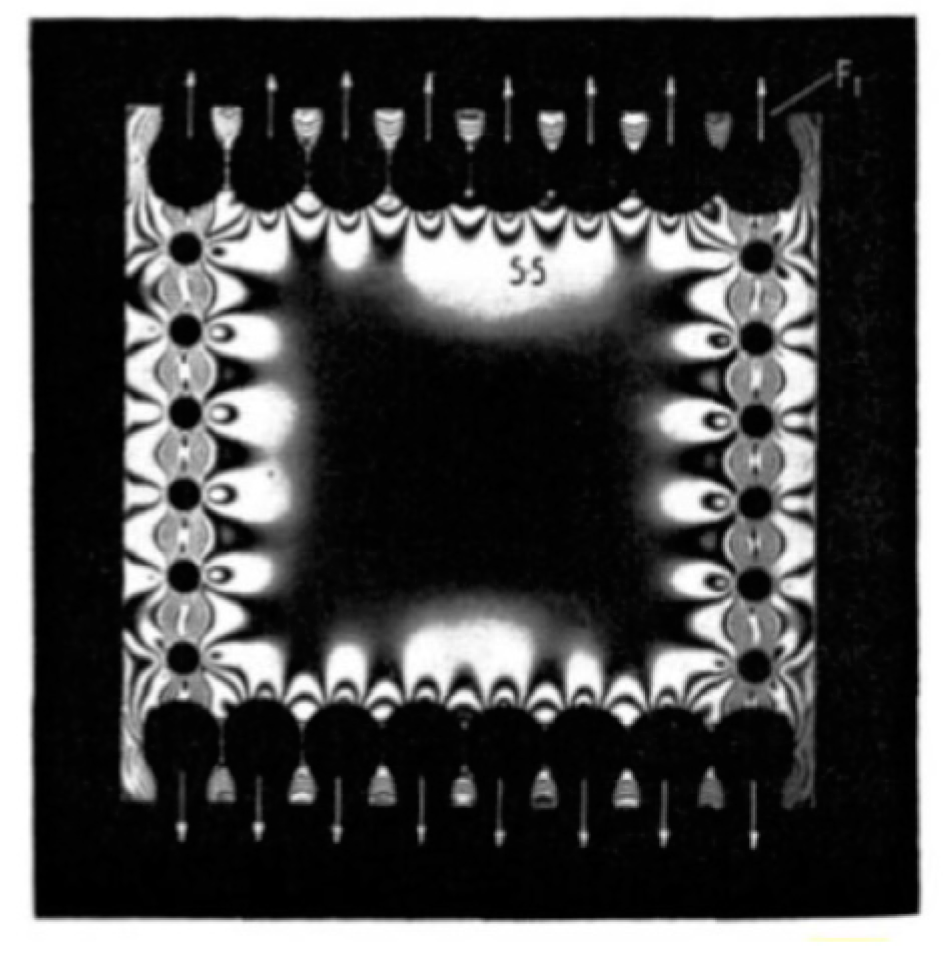
3.3.2. Flat Square Biaxial Specimen or Flat Coupons

The biaxial testing making use of a flat square test piece [73] was presented as one of the simplest multiaxial testing methods available. The test piece consists of a flat piece of material in the shape of a square. Several holes are drilled around the periphery to provide the necessary anchor to grip the specimen to the machine. The number and placement of holes all around the specimen wasshown to be a source of great difficulty with this type of test. Too few holes and inadequately placed will result in a distortion of the edges of the specimen upon loading called free edge effect. To counteract that effect, the main course of action has been to increase the number of load application points so as to produce as a uniform loading scenario as possible. Despite the fact that this made it possible to apply more uniformly the desired load across the edges of the specimen, unwanted compression areas were observed between the load application points and the free edges. These compression areas which can be seen in Figure 8, have the negative effect of disturbing the stress uniformity that ought to have developed at the centre of the specimen, especially when the specimen is relatively small. The field of uniform stress can be somewhat improved in this type of specimen by decreasing the influence of compression zones [74], locating them far from the center and increasing the number of load application spots, as is done in [75] with 1220 × 1220 mm specimen plates [73,75].

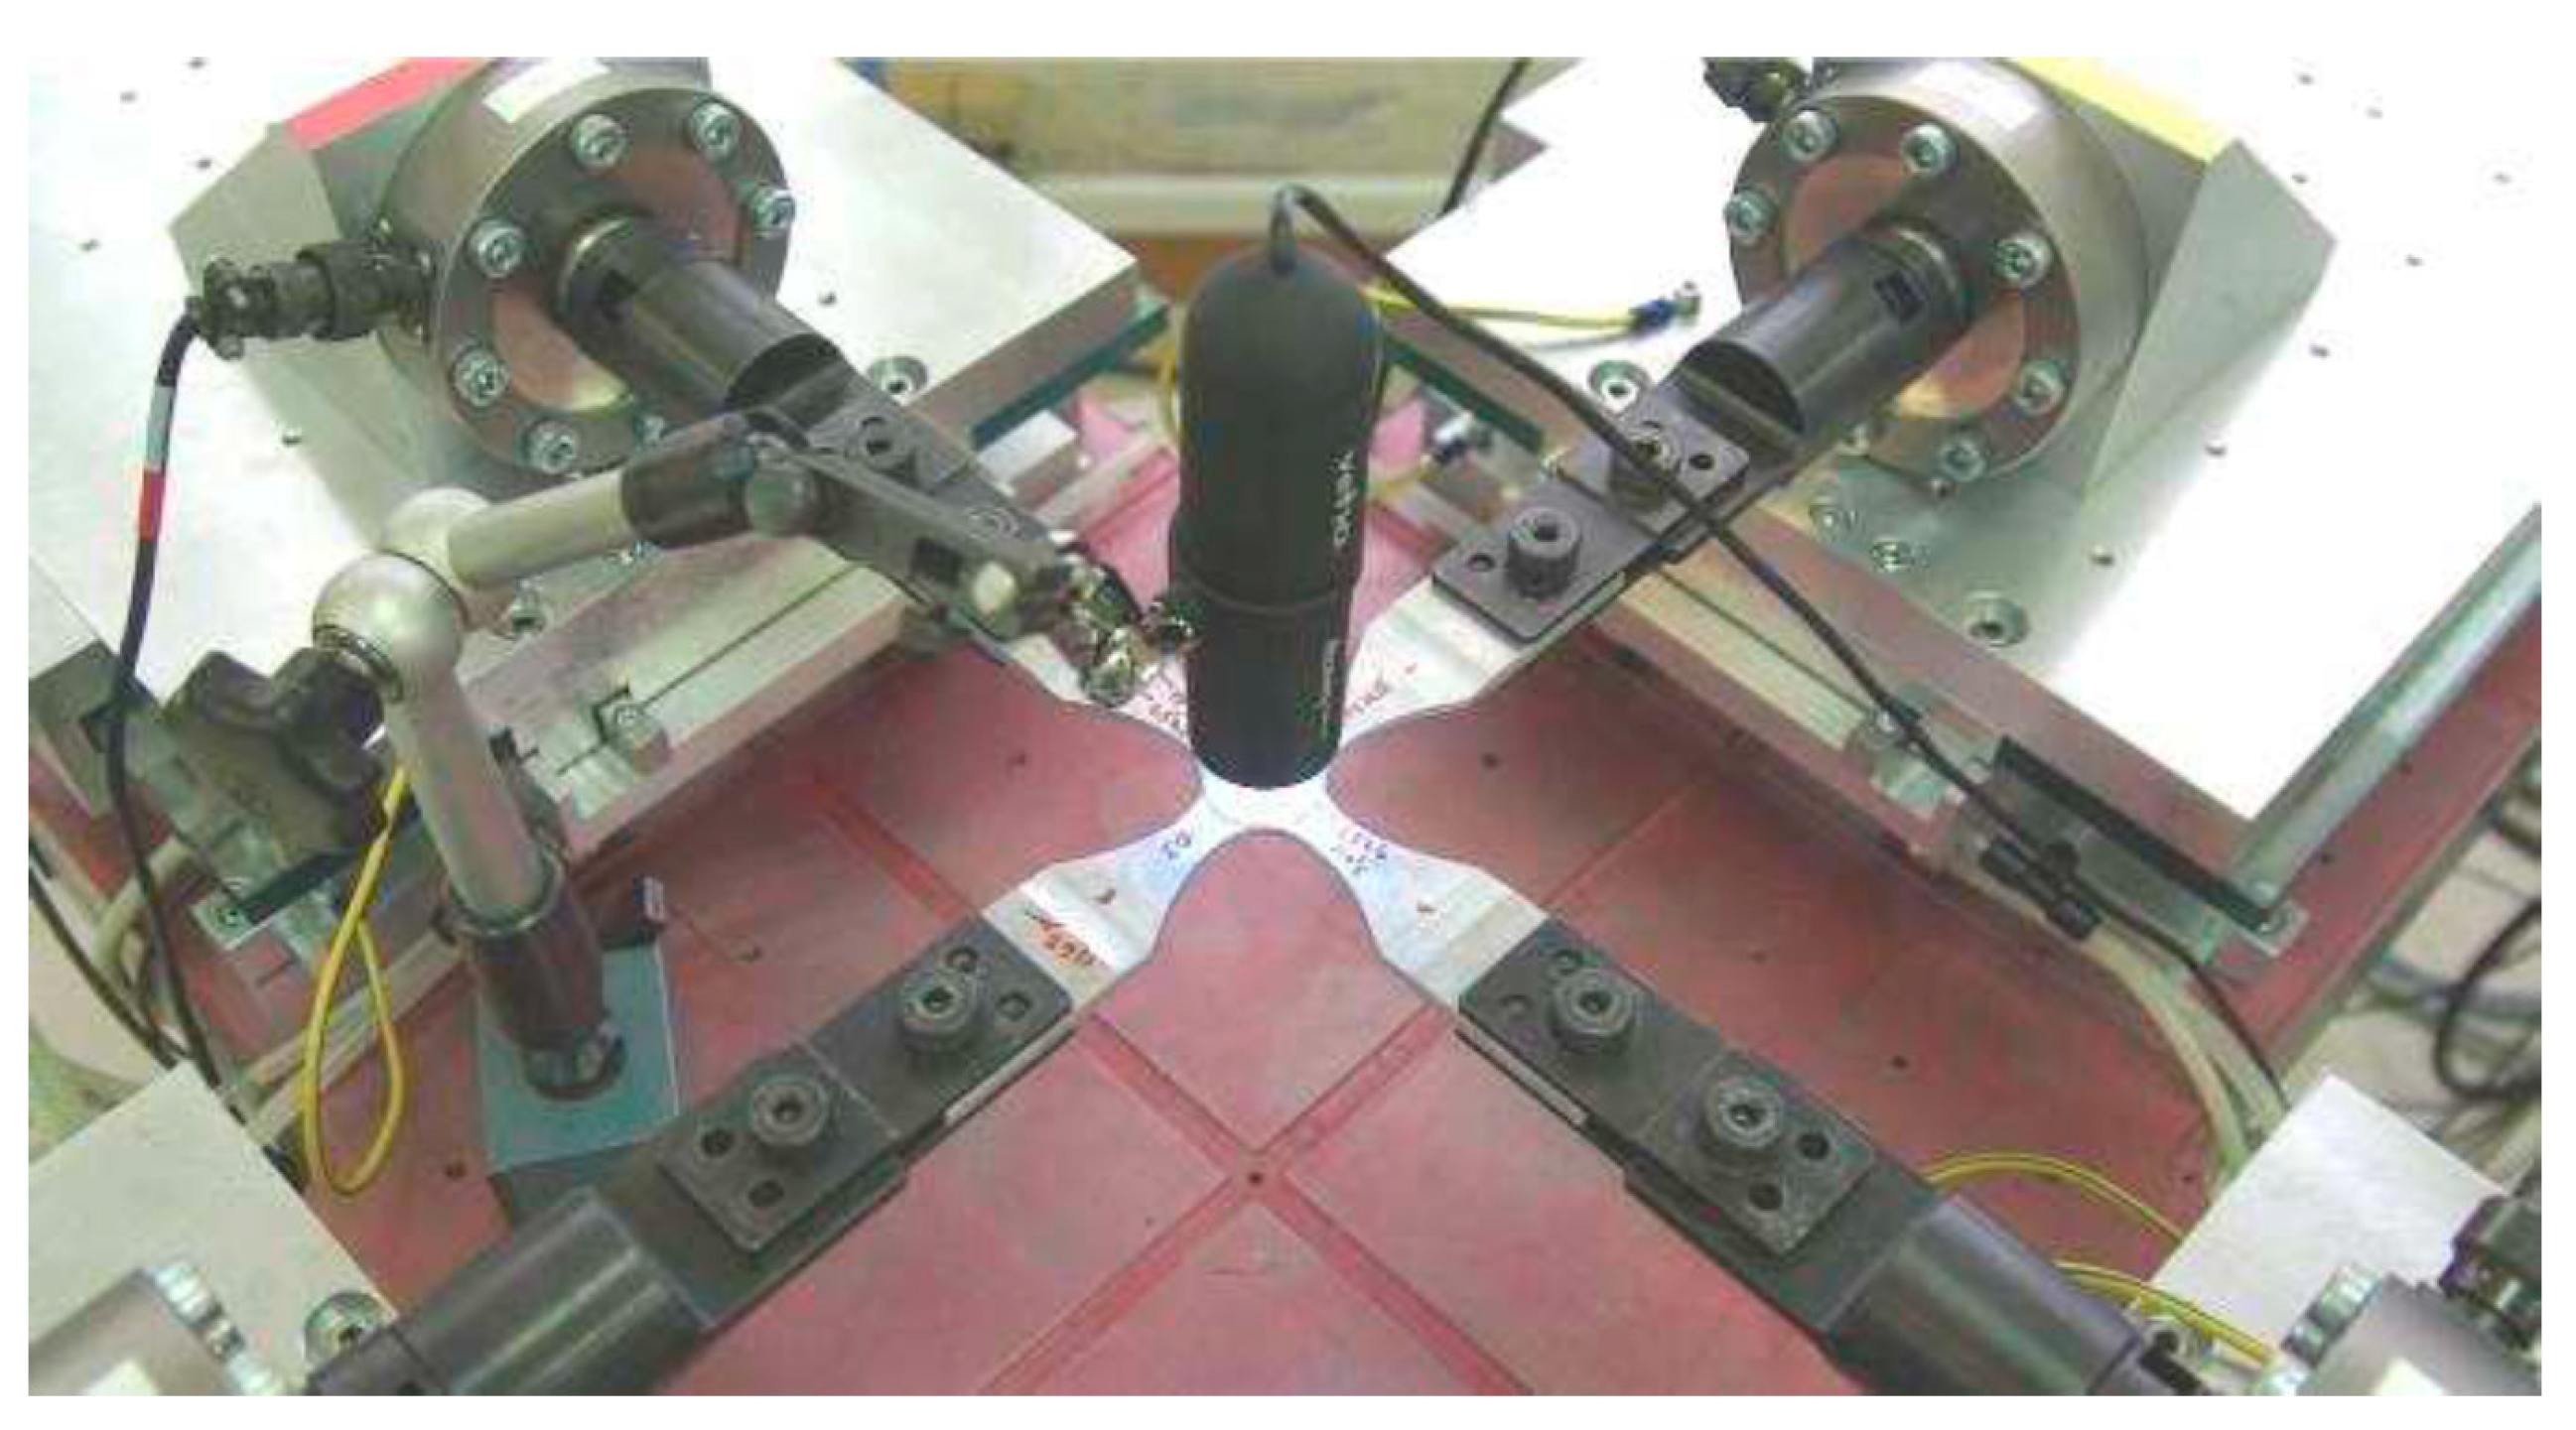
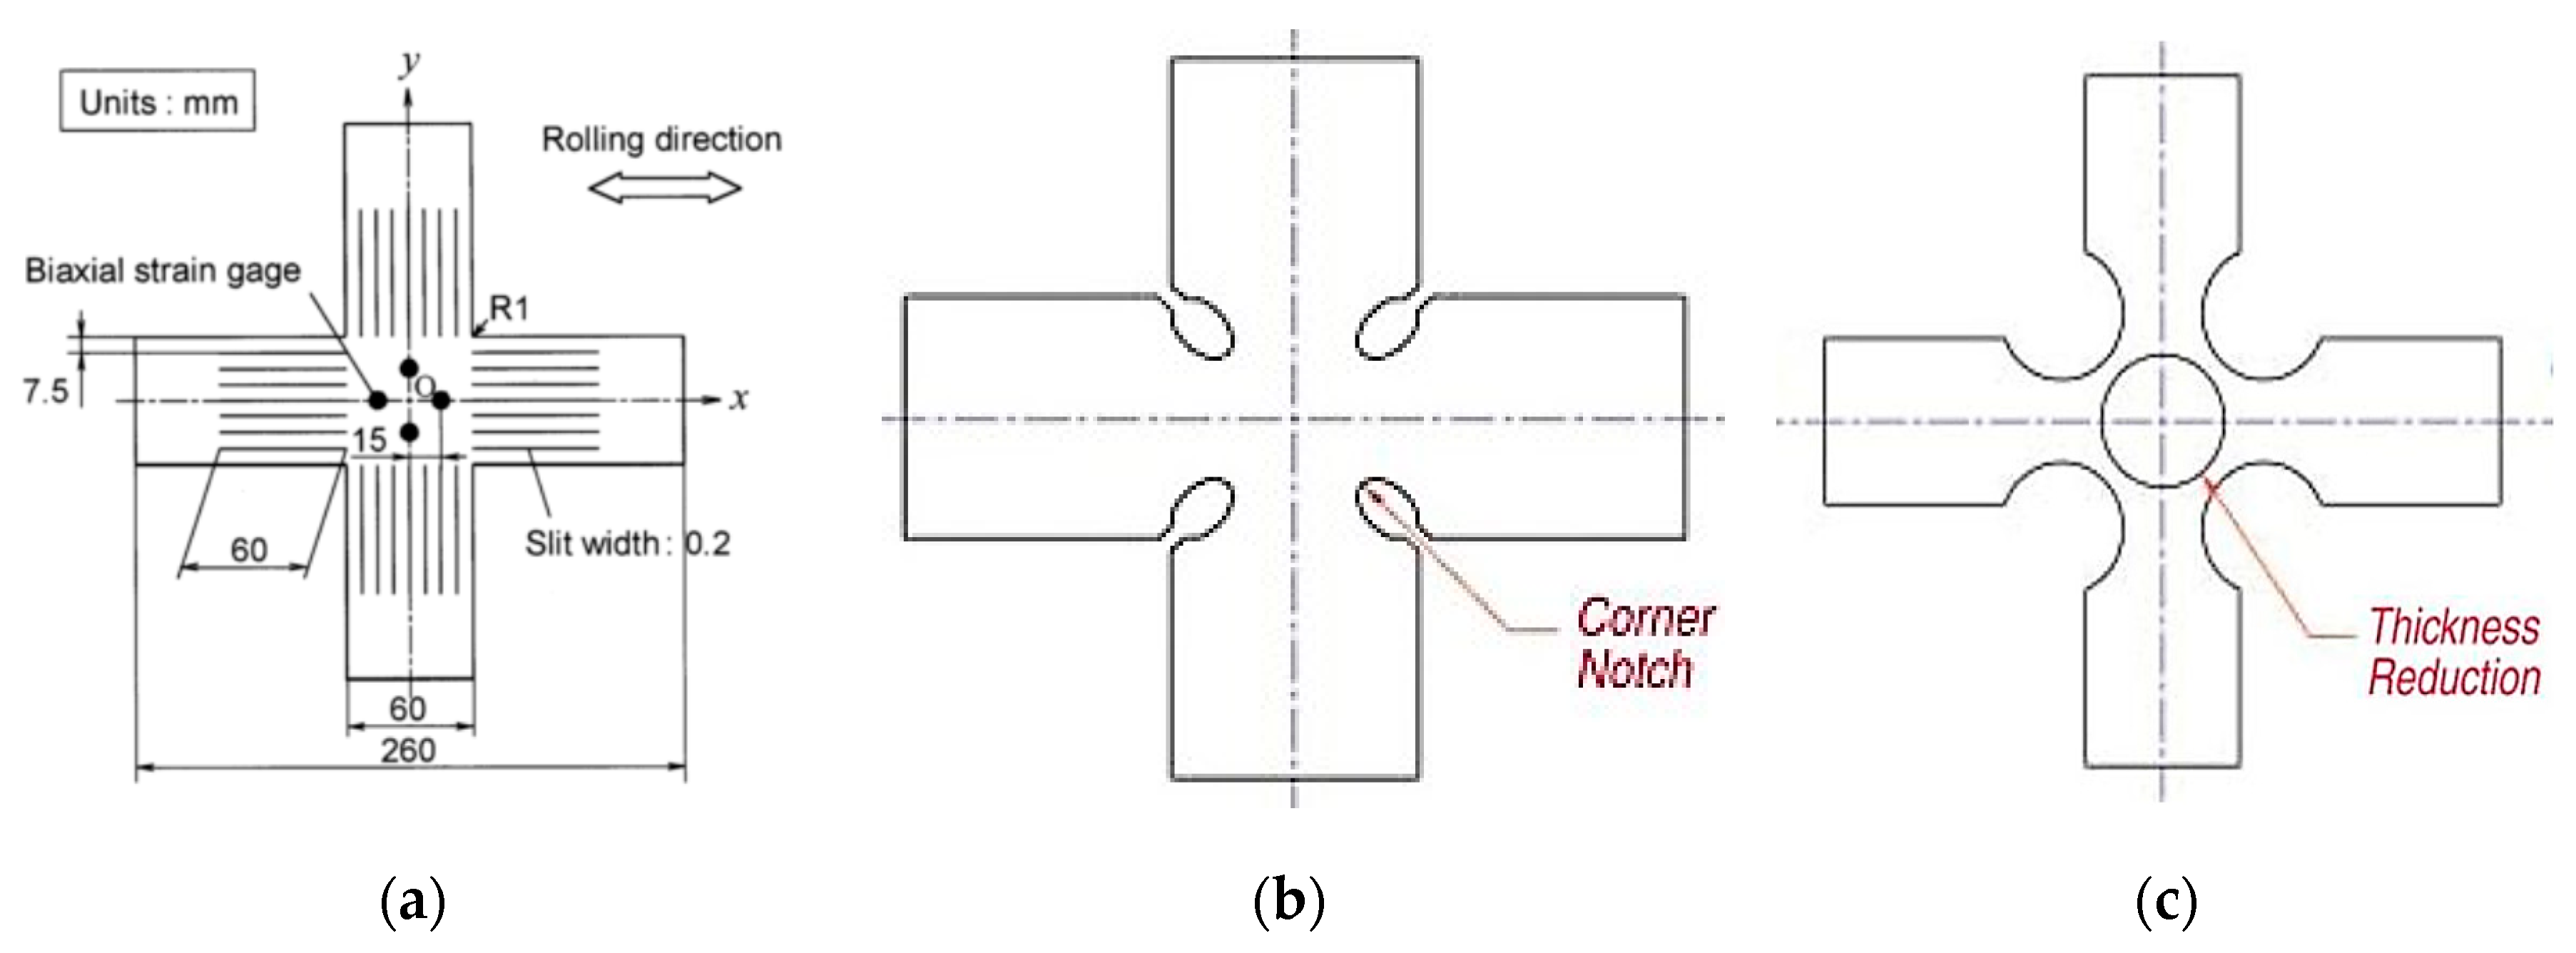
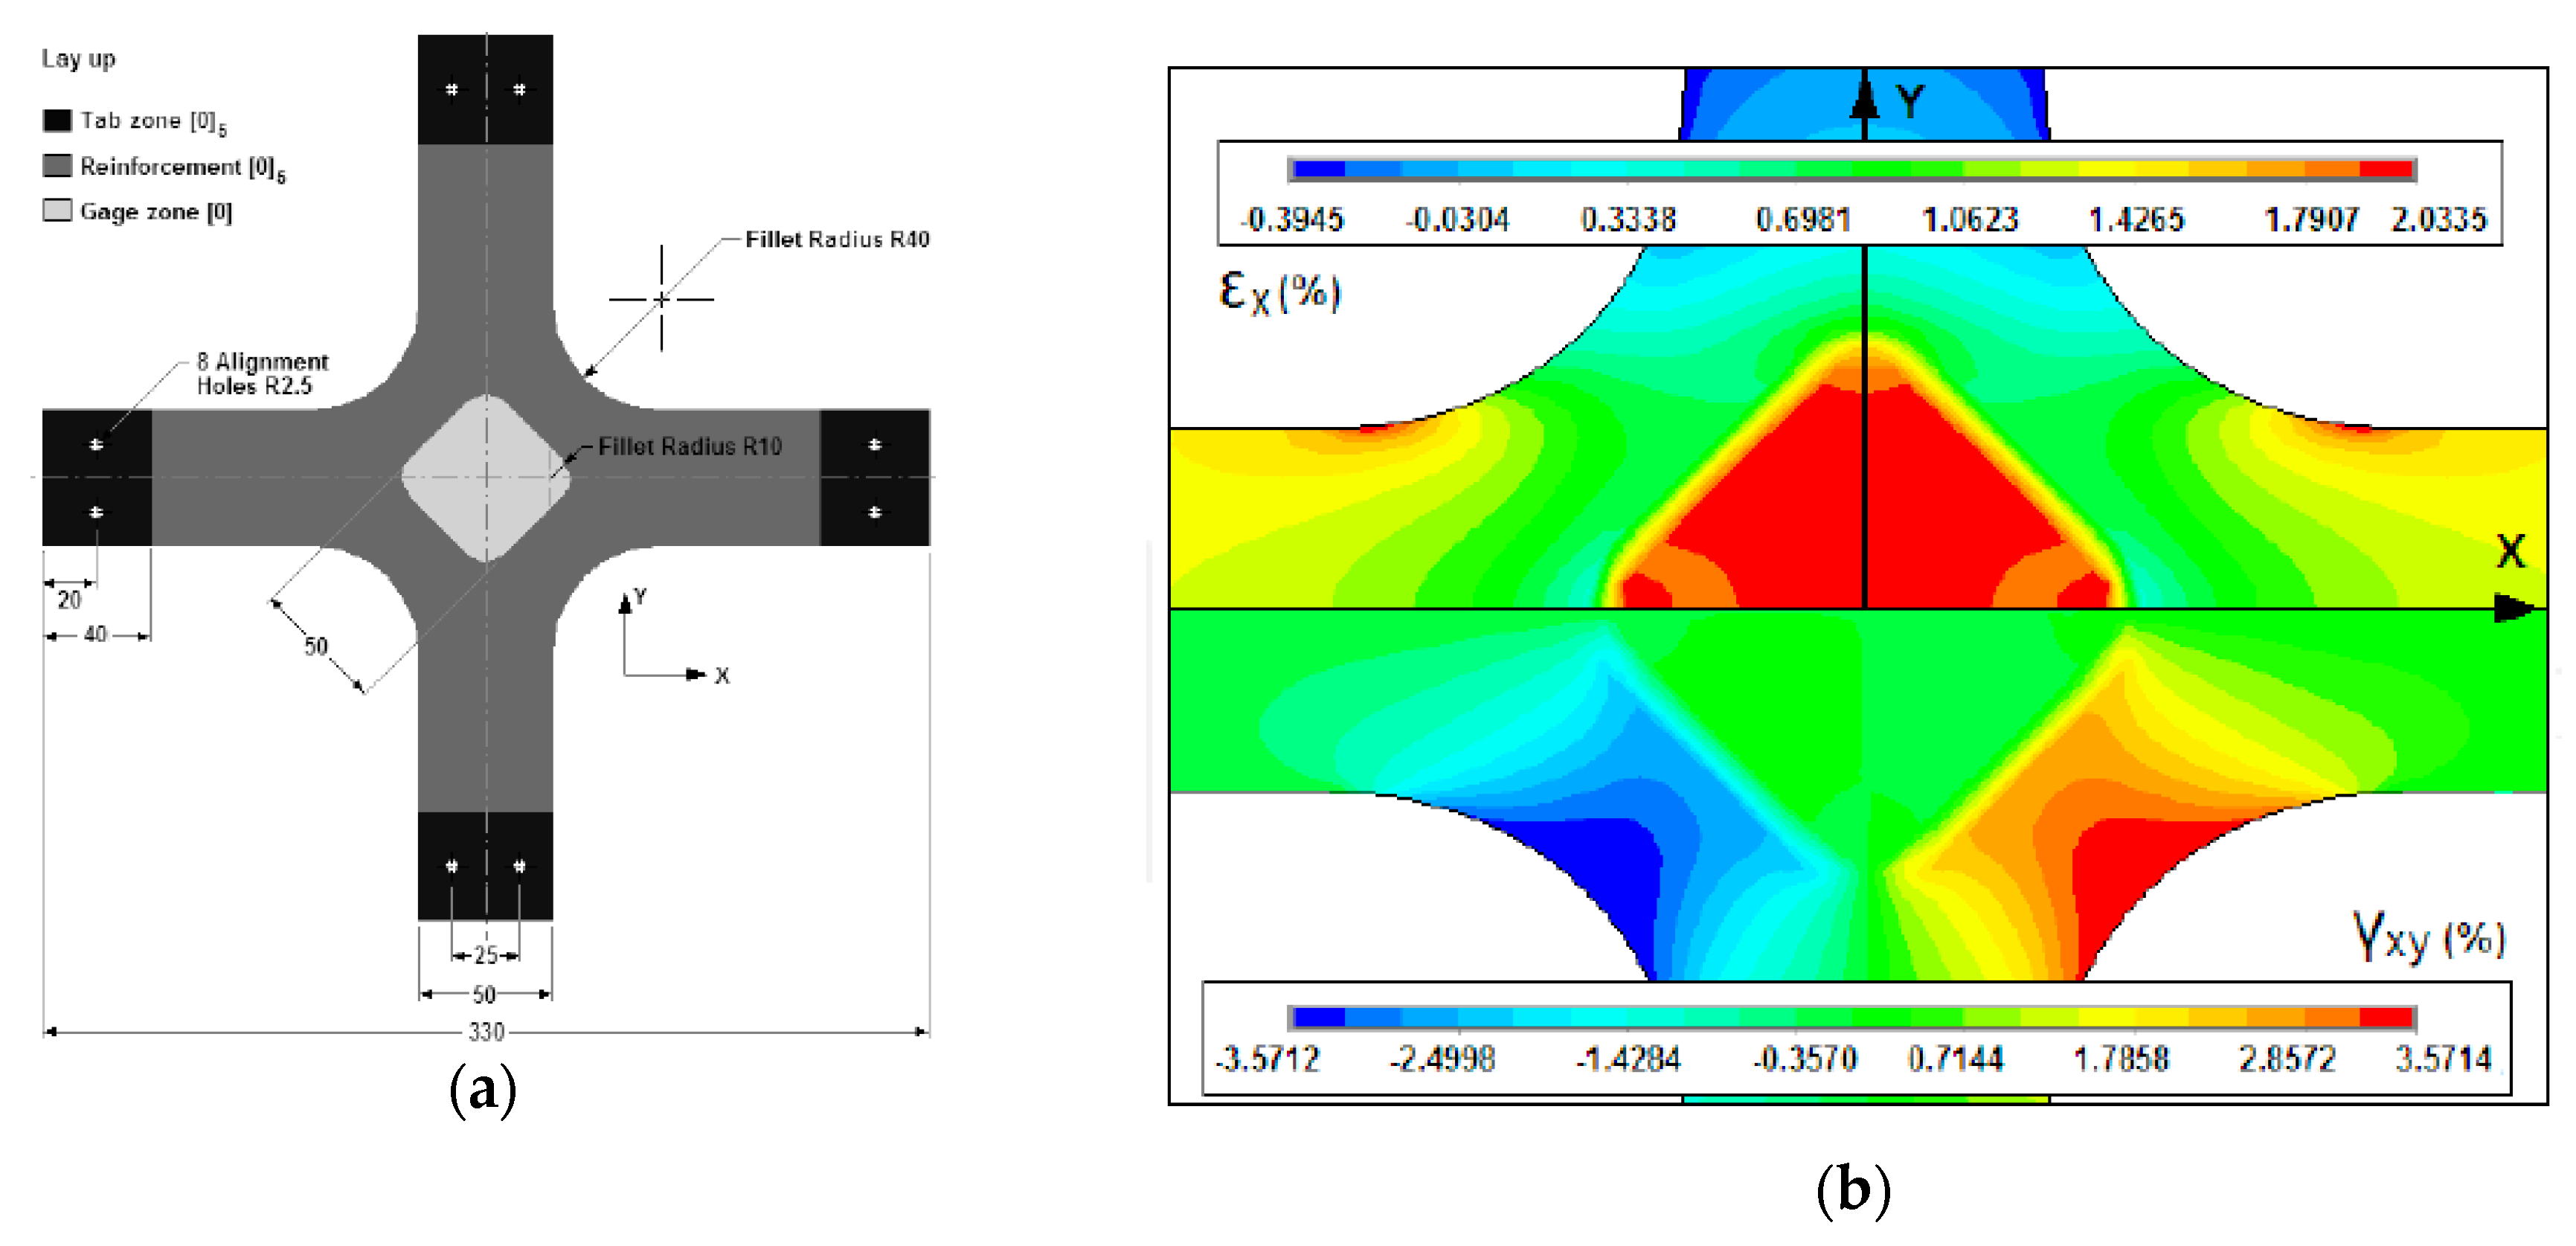
3.3.3. Cruciform Biaxial Specimens

Cruciform biaxial specimens were reported by many researchers as the best option to reproduce an accurate and stable biaxial loading scenario as would be expected in a real-life application [52,62,70,76]. In its loading pattern and specimen behaviour, this test is very analogous to the flat coupon. Of all the biaxial testing procedures, this one seems to provide the most realistic stress state because of the application of in-plane stresses and strains on the perpendicular arms of a cross-shaped specimen. Some researchers have even likened the testing with cruciform specimens to testing two uniaxial test pieces crossed at 90° [77]. This can be supported by the fact that the original aim of biaxial testing with cruciform specimens is to apply a force along a specimen arm and generate the desired stresses without any unwanted resistance occurring in the other perpendicular arm’s direction [72]. This consideration made it possible for researchers to compare their experimental biaxial test results to published uniaxial ones with a high degree of confidence in the comparability [42,76].
By using cruciform specimens, one is also able to reduce the influence of the shear stress in the material (even though not completely) by employing several optimal geometry features. Therefore, longitudinal and transverse stresses dominate in the material. This possibility offers an easier way to induce orthogonal tension-tension stress state in a material [61].
When studying different loading modes and their combinations, cruciform biaxial specimens allow more complicated stress fields to be created for non-proportional loading experiments [51,52]. These specimens will give an equibiaxial stress field if both axes are in tension, or a pure shear field if one is in tension and the other in compression. If a crack is at 45° to the axes in the pure shear field, then it will be in pure mode II loading [51].
An extensive amount of work was done on cruciform biaxial specimens to try and produce a standard type of testing. However, due to the various types of cruciform models and methodologies employed that task still remains a challenge [8,78]. Cruciform specimens tend to be commonly tested in a biaxial testing device that is fitted with four actuators clamps aimed at fixing and loading the specimen during testing. The clamps are usually put into motion by servo-hydraulic jacks or electromagnetic motors that induce the stresses into the test specimen (Figure 9).
The damage, generally in the form of a crack suffered by the materials used in this test can be recorded with an electronic microscope. There exist many different cruciform specimen designs that can be tested in these devices. All the specimens encountered in the literature, despite exhibiting different geometries, tend to follow the similar guidelines in order to reach two main objectives [69]:
  • To maximise the stress level recorded in the central part of the specimen;
  • To reduce the stress concentration in the arms of the specimen.
Having said that, it was shown in the literature that when it comes to cruciform specimens, the main problematic areas are at the transition between the perpendicular arms. Because of the proximity of these areas to the gauge area of the specimen, they end up having a noticeable influence on the uniformity of the recorded stresses at the centre. This problem was tackled by using several various geometrical enhancements to cruciform specimens in order to achieve the two objectives aforementioned. These are also aimed towards guaranteeing that the crack initiation site occurs and propagates from the centre of the specimen.
Cruciform specimens with slits cut into the arms (Figure 10a) are reported to help with reducing the influence of the specimen arms on the size of the stress field as well as smoothing the stress field recorded in the central gauge area of the specimen [74,80]. By doing so, it is possible to reduce significantly stress concentrations and therefore produce uniform stresses at the centre [81]. However, there are several problems, which were reported. For example, it was found that experimental results were not in agreement with published literature centred on the Hill’s quadratic yield equation for anisotropic deformations, which is described as a reliable tool for cold rolled Steel behaviour characterisation [33,34], was not in agreement. For most load ratios, the published results of work contours to failure were higher than the experimental ones, with the equibiaxial loading scenario being the furthest off, especially at lower strain levels. It was also found that the number, size and spacing of slits have a considerable influence on the stress field generated at the centre of these specimens [57,61,73], and increasing the number of slits in the arms is only beneficial up to a certain extent. Furthermore, the cruciform specimen with slits would not be very adequate for testing with plastic deformations [81]. Finally, it was noticed that the slits in the arms have the undesired effect of increasing the influence of shear stress in the failure of the test pieces [81].
Notched corners were introduced aiming at increasing strain levels in the central area of the specimen, while reducing stress concentrations at the corners formed by the arm-to-arm transitions [70,73,82]. These stress concentrations were also found to result in undesired shear stresses, compromising the uniformity of the stresses in the central gauge area [73]. Typical biaxial cruciform specimens with circular and elliptical notched corners can be seen in Figure 10b,c. It is interesting to note that the performance of circular-notched specimens is variable and that specimens with elliptical corner notches are the best alternative. Specimens with elliptical corners proved more adequate when the loading was not equibiaxial by guaranteeing a good level of stress uniformity up to 80% [73].
One well-documented aspect of concern with this style of specimen is that despite the maximum stress level being achieved in the central area, if the radii at the tip end of the notch are fairly small, then that could create a problematic site of stress concentration and necking [72,77]. Other works observed that such specimens are not particularly suitable for studying biaxial plastic fatigue due to several specimen failures happening outside the central gauge area [77].
In most cases encountered in the published literature, experimental test pieces that exhibited a thinner central area are combined with the feature of notched corners. This is the case of the specimen presented in Figure 10c, where the thinner central area is circular. The reduction in thickness at the centre of the specimen contributes in increasing stress levels around that area [62,72].
A variation to the thinner central area specimen is to shape it in the form of a square or a rhombus [31,83] (Figure 11a). It transpired that for specimens with arm length dimension at least double that of arm width, the strain distribution in the gauge area was quite uniform. In fact, by increasing the ratio of arm length to arm width, an improvement in strain field uniformity is observed [83]. As it can be seen in Figure 11b, the direct strain fields in the central area of such specimens are comparatively better and uniform, stress concentration in the arms are practically non-existent, and shear strains at the centre are close to zero, proving further the good uniformity of the stress field produced by these specimens [61]. However, it has to be noted that these specimens were designed for testing on textile composite materials. To achieve such configuration, instead of a circular recess, on metals through subtractive manufacturing would probably be more challenging, so its suitability for testing on metals cannot necessarily be guaranteed. Nevertheless, it provides a nice basis for possible adaptation to a metal testing scenario on UFT, especially if one is to analyse metal AM materials.
In High Cycle Fatigue biaxial experiments conducted on ductile aluminium (alloy 1050A-H14), cruciform specimens with combined elliptical notched corners and reduced centre thickness (Figure 12) were tested in an electromagnetic four-actuator loading device (Figure 9) with forces up to 1 kN at 20 Hz [12,78]. After having used direct multi-search (DMS), a Multiple Objective Optimisation (MOO) method, the geometry of the specimen shown in Figure 12 was optimised by isolating five major design parameters. Special attention was paid to the centre geometry. To keep stress as uniform as possible without the effect of stress concentrations the centre region was generated with a revolving spline starting horizontally at the centre of the specimen and ending with an angle θ at a diameter d , both defined as design variables for the optimisation algorithm. This spline ensures a smooth geometrical transition to avoid stress concentration in the critical region. In this specimen, the thickness at the centre was fixed as 0.5 mm, stipulated as being the minimum value to ensure good machining conditions, and the thickness t of the sheet plate in the arms was fixed at 3.0 mm. The remain design variables are the major R and minor r ellipse radii [70,78]. The optimised geometry of this specimen resulted in a stress field that is maximum and uniform at the centre. This was demonstrated by verifying that the stress gradient would not exceed 4% for every 2 mm radius away from the centre of the test piece and that the stress value in the arms was at least 20% lower that the stress value in the gauge area.
The work presented in [70,78] was extended to expose the influence of each geometrical design parameter on biaxial fatigue test response. The geometries proposed in the works from Baptista et al. [16,55,56] appear to be, to some extent, a combination of all the features of the cruciform specimens aforementioned. These specimens present many advantages among which a fairly thorough definition of the influential parameters of the geometry and their impacts on the stress state of the specimen. Equations were derived in [16,56] as a tool to help with obtaining optimised geometries for biaxial testing with different sizes.

3.3.4. Biaxial Specimens for Uniaxial Machines

There are many other biaxial test specimens’ designs that were presented over the years, including biaxial specimens that can be tested in uniaxial test machines [84,85,86]. Of particular interest is the one presented by Bellett et al. [87], as an attempt to study elastic and plastic stresses under biaxial fatigue. This specimen has a very distinct geometry: it is a flat unnotched hourglass specimen, with two through holes that remind teardrops. The authors have not given any specific name to these specimens. However, since hourglass specimens are quite generalised in fatigue testing, in the context of this paper, this specimen will be designated as twin-teardrop, or teardrop for simplicity (Figure 13).
The interesting feature of the teardrop specimen is that biaxial stress states can be induced under the application of uniaxial loads. High cycle fatigue tests at 2 × 10⁶ cycles under 2 kN were conducted for two types of Aluminium: wrought Aluminium 2024-O, and cast Aluminium-silicon alloy AlSiCu0.5Mg0.3. The authors used shape optimisation in ANSYS to generate a specimen that could be obtained within a 100 × 40 × 4.7 mm envelope, based on the Dang Van fatigue failure criterion [63,70,73,74] and the Lin-Taylor hypothesis [88]. The Dang Van fatigue failure criterion was used to increase the likelihood of crack initiation to happen in the centre of the recessed area of the specimen. The Lin-Taylor hypothesis was used to explain the cases where fatigue failure could happen outside the centre of the specimen. Their second objective was to maximise the biaxial uniformity on the gauge area. The overall findings of the experiments were satisfactory with biaxial tensile tests and biaxial fatigue both covered by the specimen. However, it was shown that this specimen was not suitable for testing cast aluminium in biaxial fatigue since 5 out of 5 specimens tested failed outside the gauge area. A possible reason touted for that was the presence of defects (micro-shrinkage pores) for failure to occur in such a small biaxial gauge area. On the other hand, the wrought aluminium performed well with 100% of failures occurring in the centre. A further observation was that for a specimen with overall thickness increased from 4.5 mm to 10 mm, the performance was improved [87].

4. Multiaxial Fatigue Testing at Very High Number of Cycles

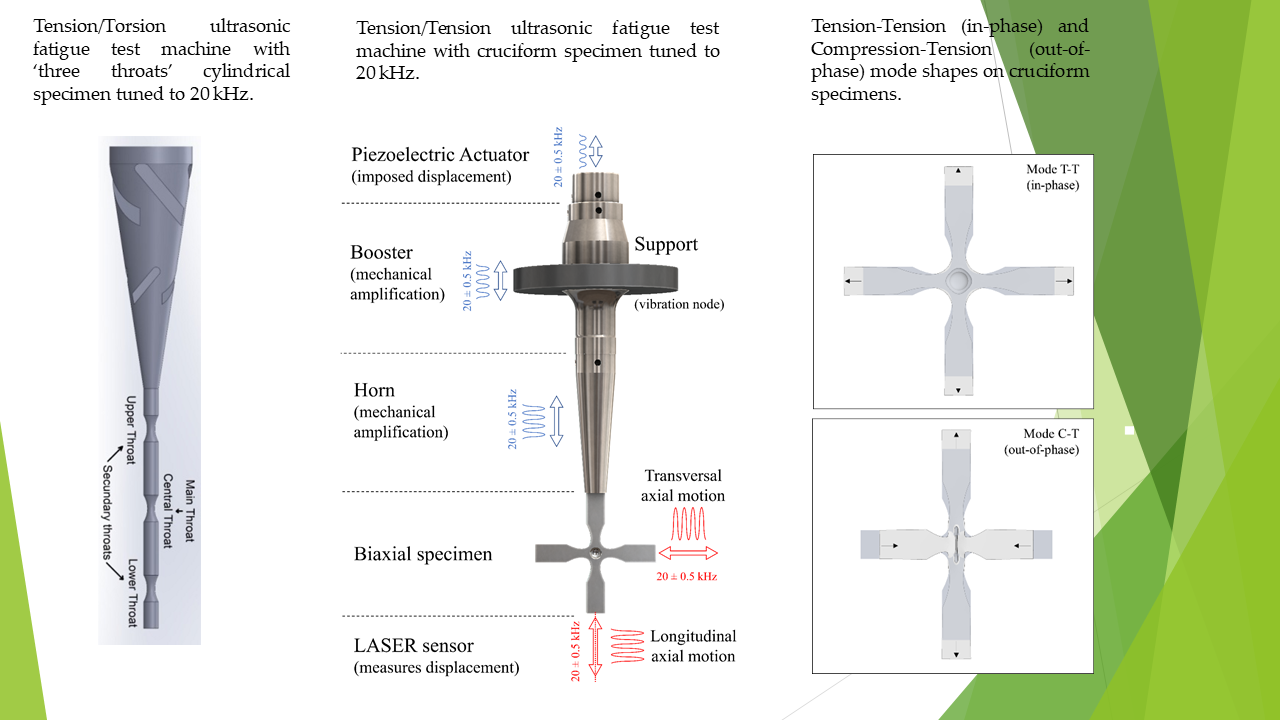
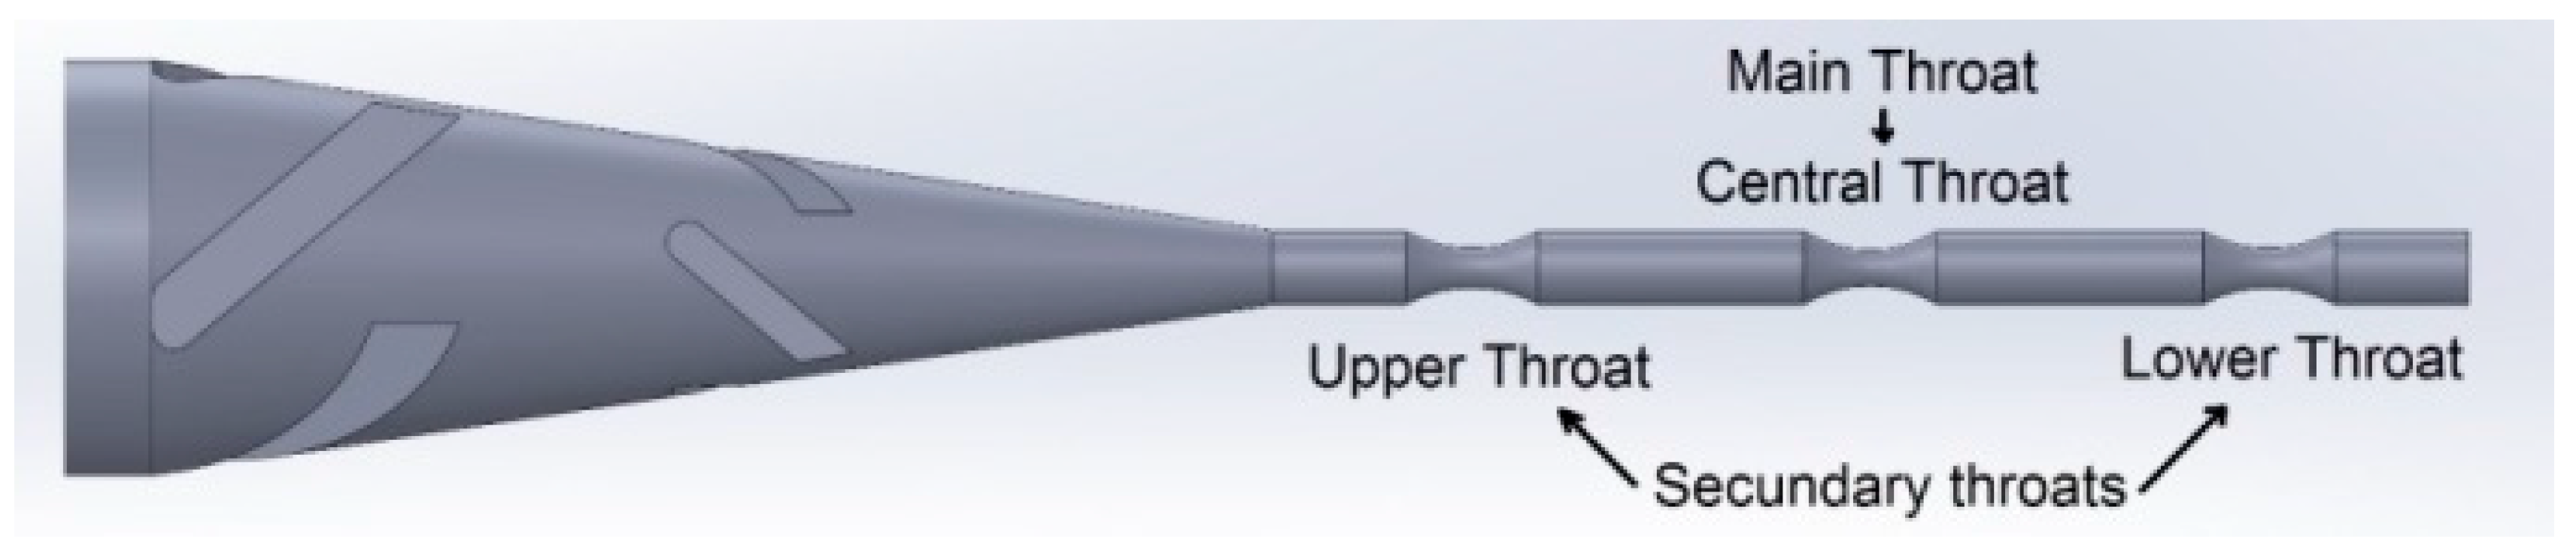
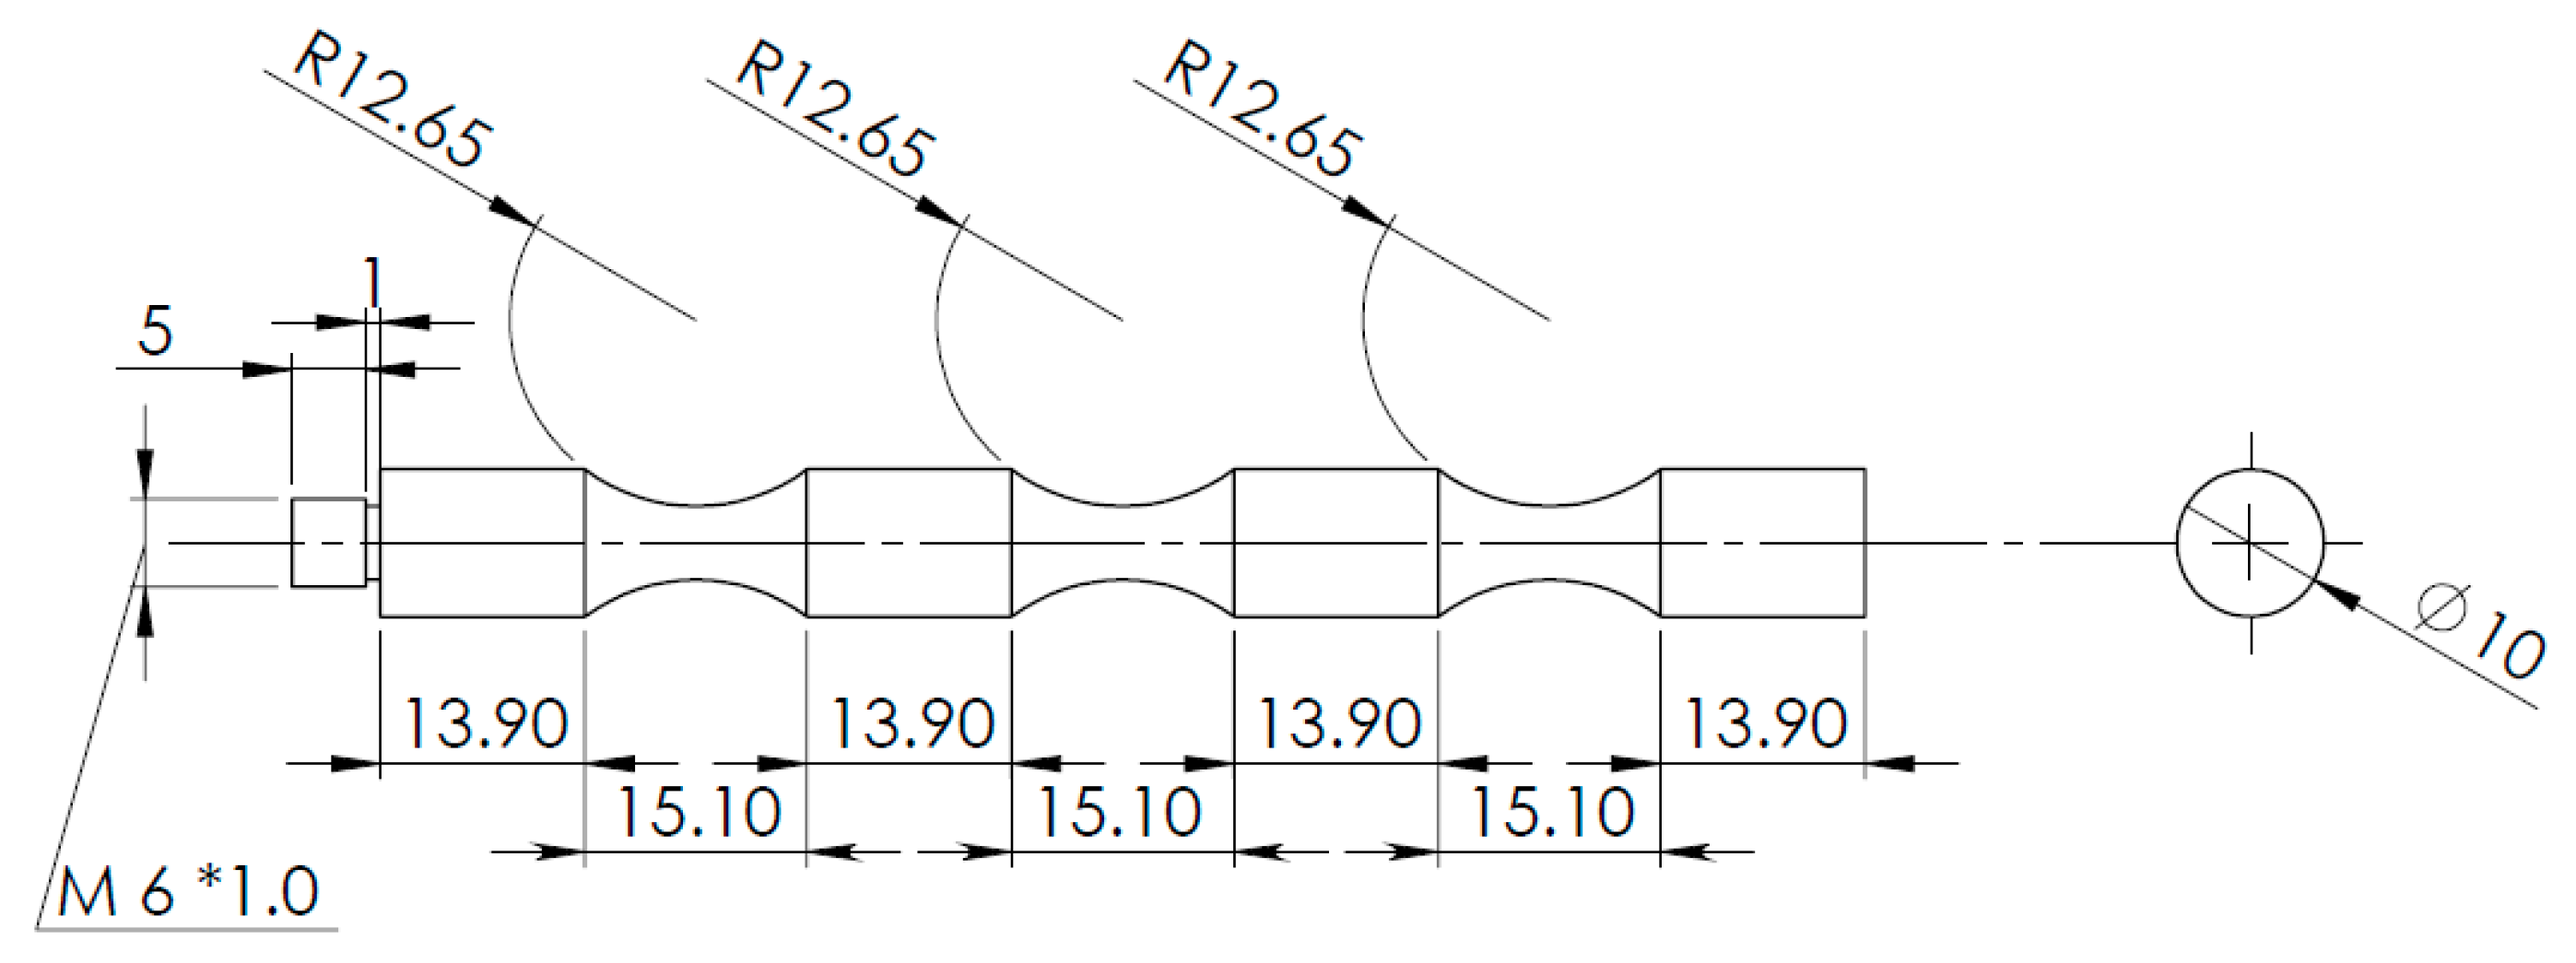
4.1. Tension/Torsion Ultrasonic Fatigue Testing

Recently [23,76], a tension/torsion loading UFT device using a single piezoelectric axial actuator was presented. Contrary to the cruciform UFT specimens developed by Montalvão et al. [25,26] that make use of the same horn as the one for uniaxial UFT (later described in Section 4.2), a custom horn and new specimen were proposed (Figure 14). The horn is designed in order to transform the axial displacement from the actuator into both axial and rotational motion [23,76]. This excitation pattern is then transmitted to the specimen, which will both stretch/compress and twist. The resulting specimen is shown in Figure 15. It is composed of three ‘throats’, where the central one is where maximum tension/torsion are achieved [15] and where fatigue failure is expected.
Several steel tension/torsion specimens were machined from a railway wheel’s rim [89,90,91]. When testing these particular specimens in UFT machines, they do not achieve complete failure, i.e., split up into two pieces. It is required to take them to another machine for the complete failure to be reached, with the purpose to have the fatigue fracture unveiled. Such a procedure is required because in such tests the specimen works in resonance. It must be noted that such a procedure is not unusual in UFT, whether it is uniaxial or multiaxial. With the growth of the fatigue crack, the stiffness k is reduced, but the mass m is assumed to remain constant. Making an analogy to a single-degree-of-freedom lumped-mass spring system where the natural frequency is:
ω n = k m
It is easy to see that as the stiffness k reduces, the natural frequency ω n reduces too. This is a typical assumption in vibration-based Structural Health Monitoring [92,93,94,95,96]. Since the operating frequency of the UFT testing machine has a tight tolerance of ± 0.5 kHz, once the specimen’s resonant frequency drops more than the tolerance’s lower limit (i.e., drops below 19.5 kHz), the UFT is interrupted and can no longer proceed. This is a consequence of horn and booster still having 20 kHz resonant frequencies; it is only the specimen’s resonant frequency what is offset due to crack initiation and propagation.

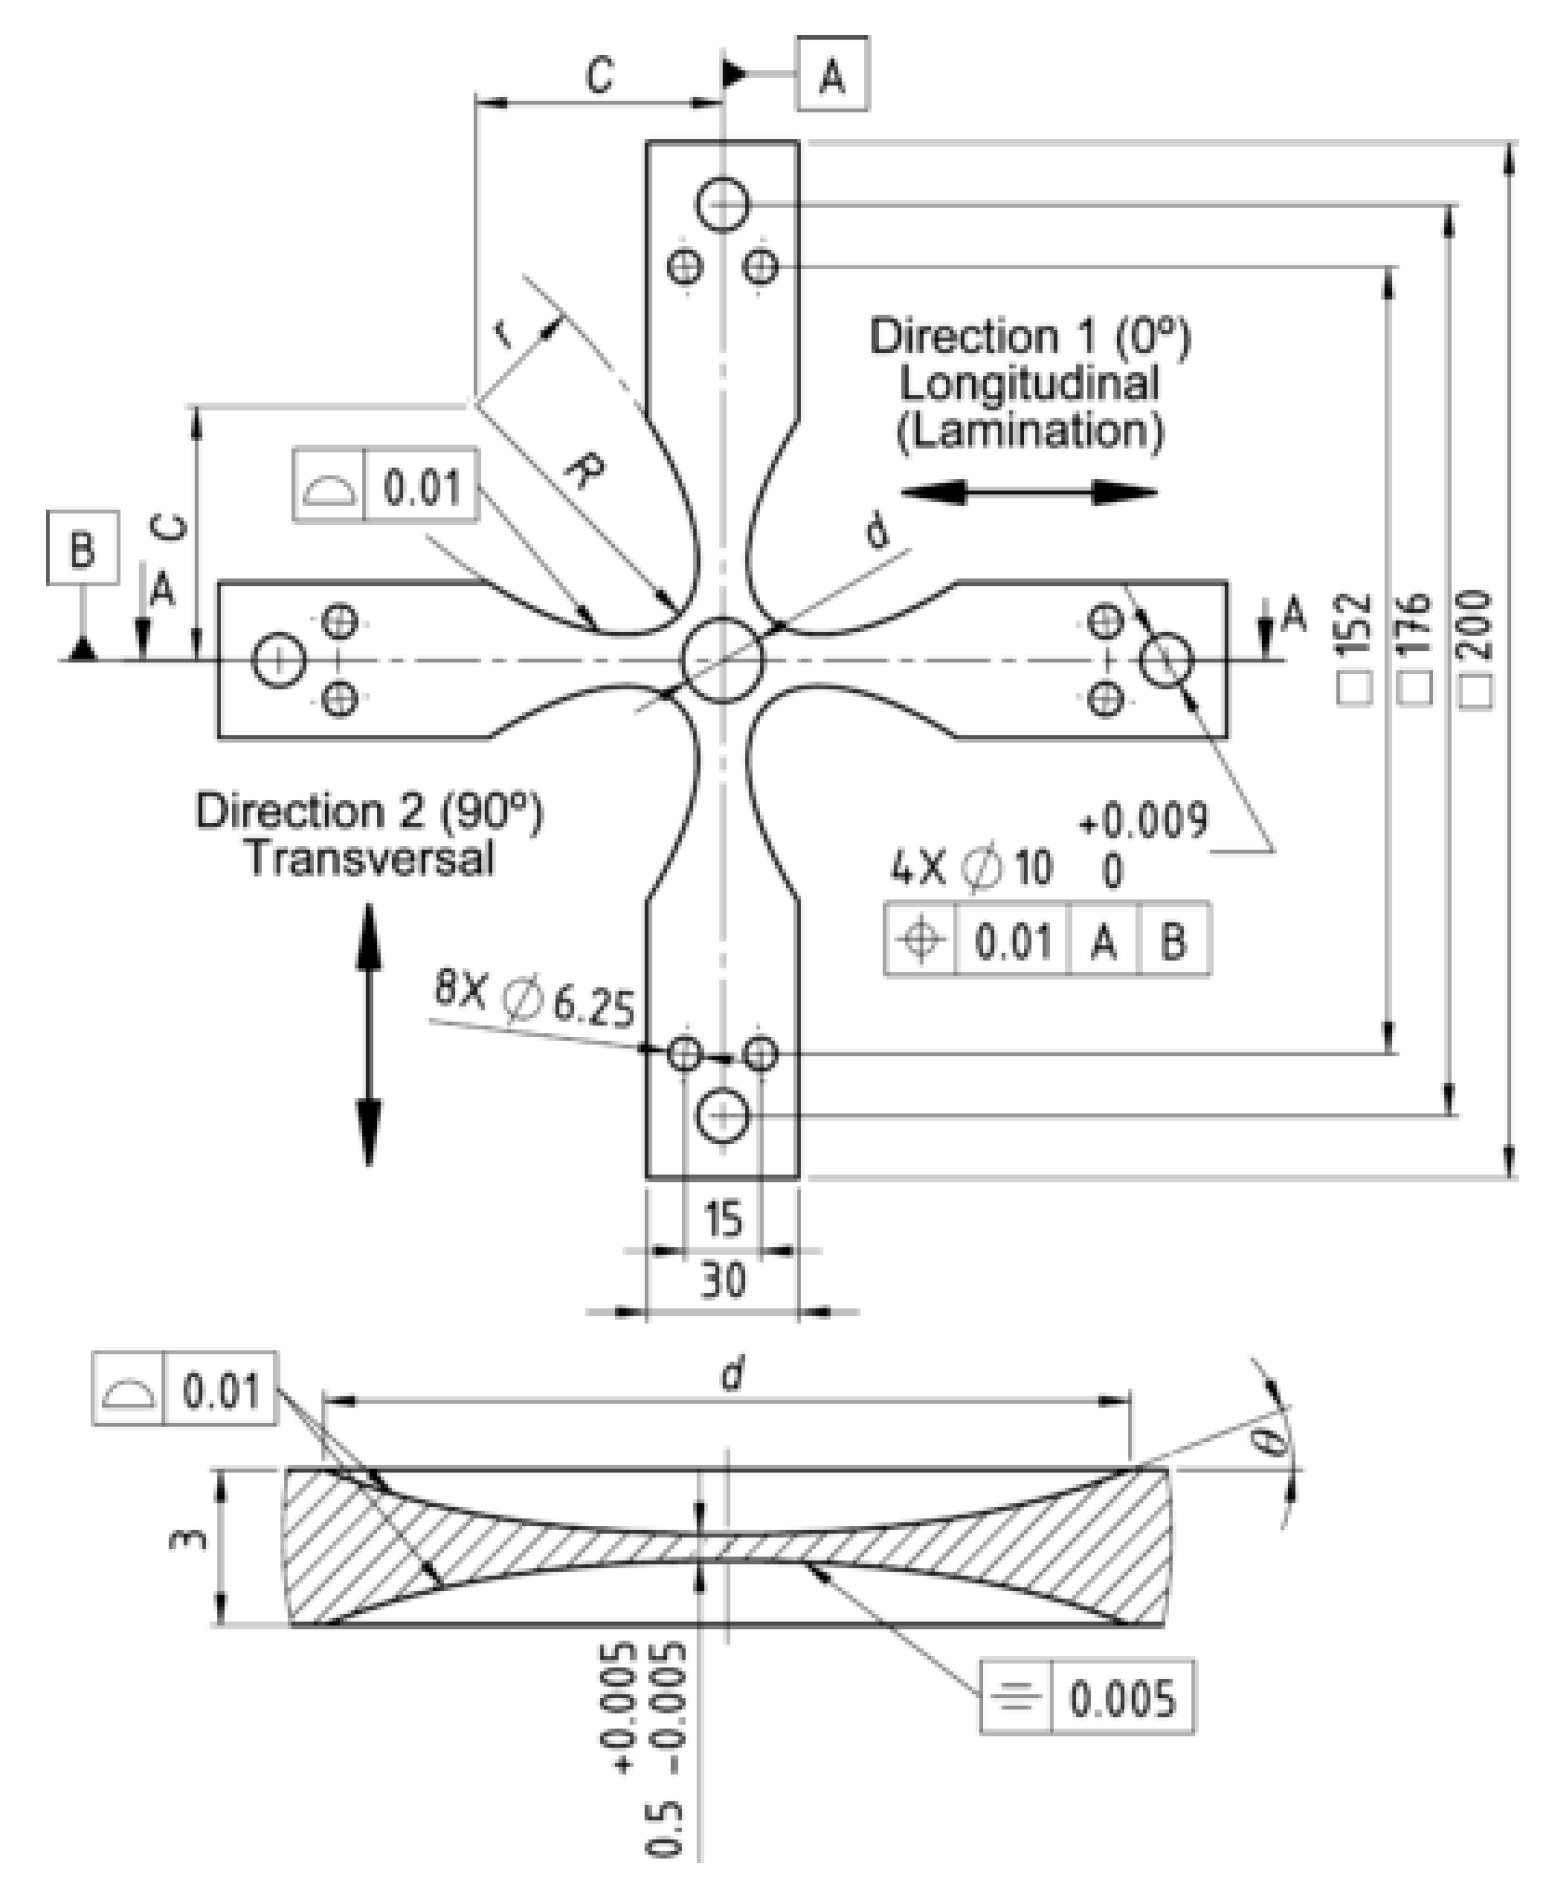
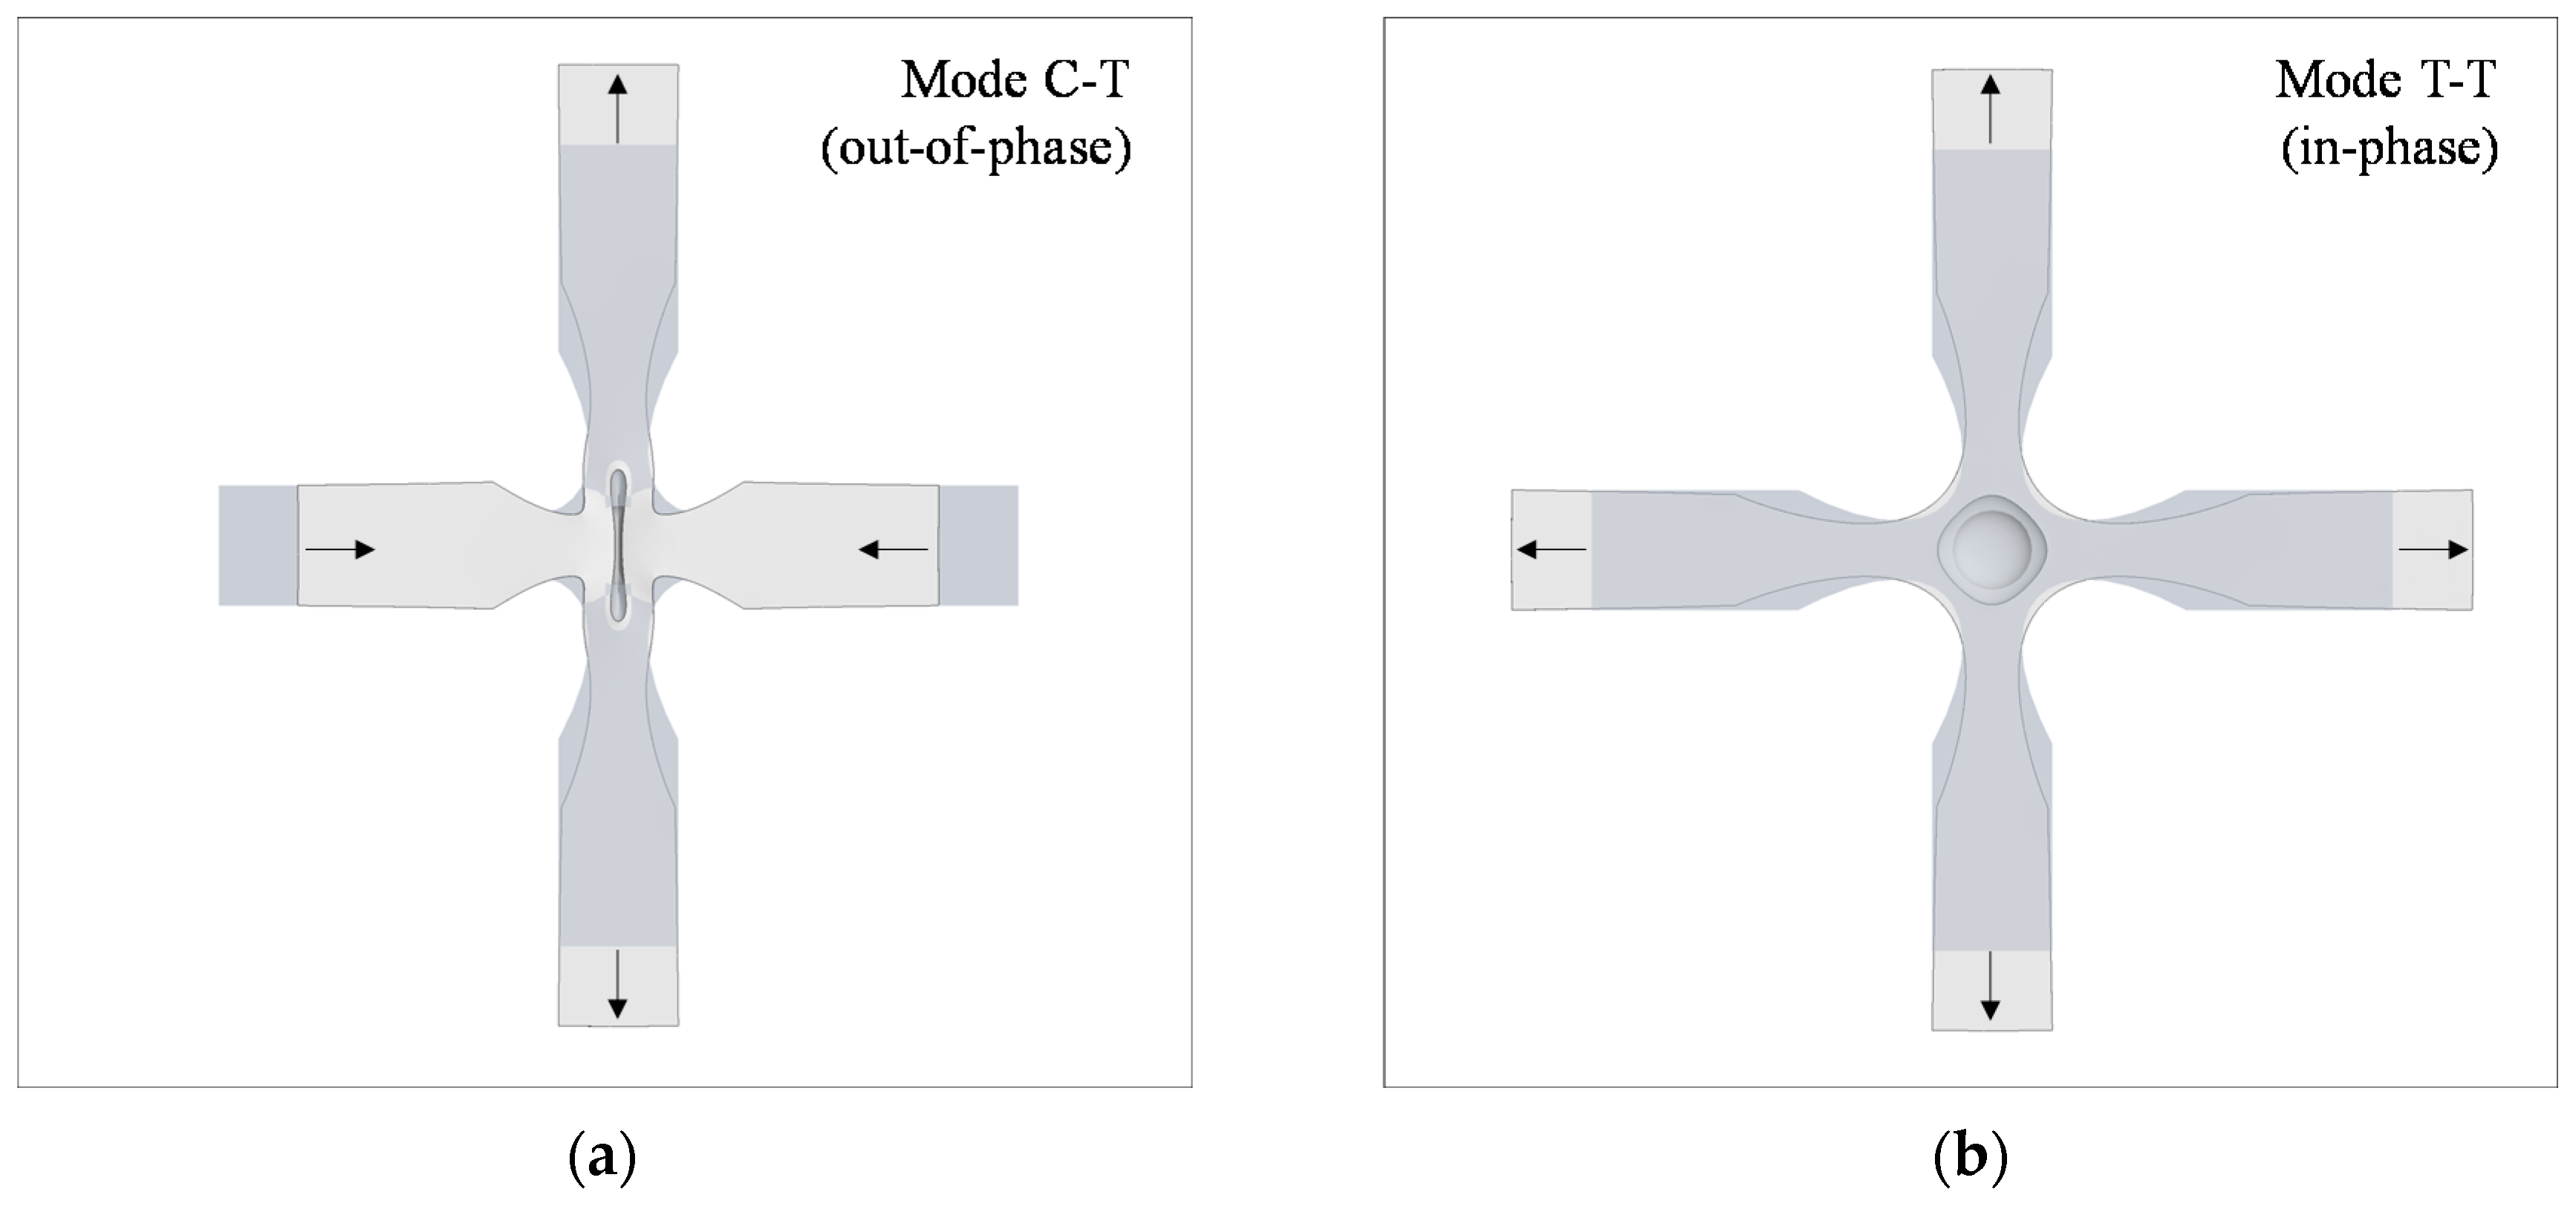
4.2. Tension/Tension Ultrasonic Fatigue Testing (Cruciform Specimens)

An original approach to biaxial UFT was proposed in order to achieve VHCF regime using cruciform specimens [25]. Having as starting point the same principles used in the design of the ultrasonic fatigue testing machines and design rules for cruciform specimen design as in [16,24,55], it was shown that at least when using cruciform specimens for in-plane tension-tension (biaxial) testing, only the specimen needs to be redesigned and no changes are required to be made to the machine. Figure 16 shows the UFT machine setup described by Montalvão and Wren [25]. It can be seen that the machine used is the same as Lage et al. [10] used, an uniaxial UFT machine (Figure 1b and Figure 4), and that the specimen is a redesigned version based on Baptista et al. [16,55] (Figure 12). The specimen is attached to the machine through an M6 screw connection.
The principles behind the redesign of these specimens are based on Single-Input-Multiple-Output (SIMO) modal analysis. This means that an important requirement in the specimen’s design is that the connection between the machine and the specimen is done at a coordinate that is an anti-node of the particular mode shape of interest being excited [25]. In this case, where specimens have all their arms free (except the one being excited, which is attached to the horn through a screw connection), the stress ratio is [97]:
R = σ x , m i n σ x , m a x = σ y , m i n σ y , m a x = 1
Since these specimens (as any solid body that can be described as a continuous system) have an infinite number of mode shapes, it is shown that two different stress scenarios can be contemplated [25]: Tension-Tension (T-T) where both orthogonal arms stretch (or compress) in-phase; and, Compression-Tension (C-T), where when one arm is stretching the perpendicular one is compressing, i.e., they are out-of-phase and result in shear (Figure 17).
Cruciform specimens, such as the ones discussed in Section 3.3.3, were optimised to ensure that stress concentrations at the corners between the arms are minimised and the bulk of the stress occurs at the centre and is homogeneously distributed. Therefore, it is reasonable to assume that if one of the resonant mode shapes represented in Figure 17 can be obtained when the specimen is excited at a single (harmonic) ultrasonic frequency and at a single anti-node (i.e., with only one piezoelectric actuator as shown in Figure 16), the stress field created by the vibrating mode shape is no different from the one generated when the specimen is being loaded in ‘conventional’ test machines through all four arms (e.g., such as the ones shown in Figure 9, Section 3.3.3). The problem with adapting existing specimens into UFT machines is how to ‘tune’ them so that they present only the intended vibrating patterns (such as the ones shown in Figure 17) at the machine’s operating frequency.

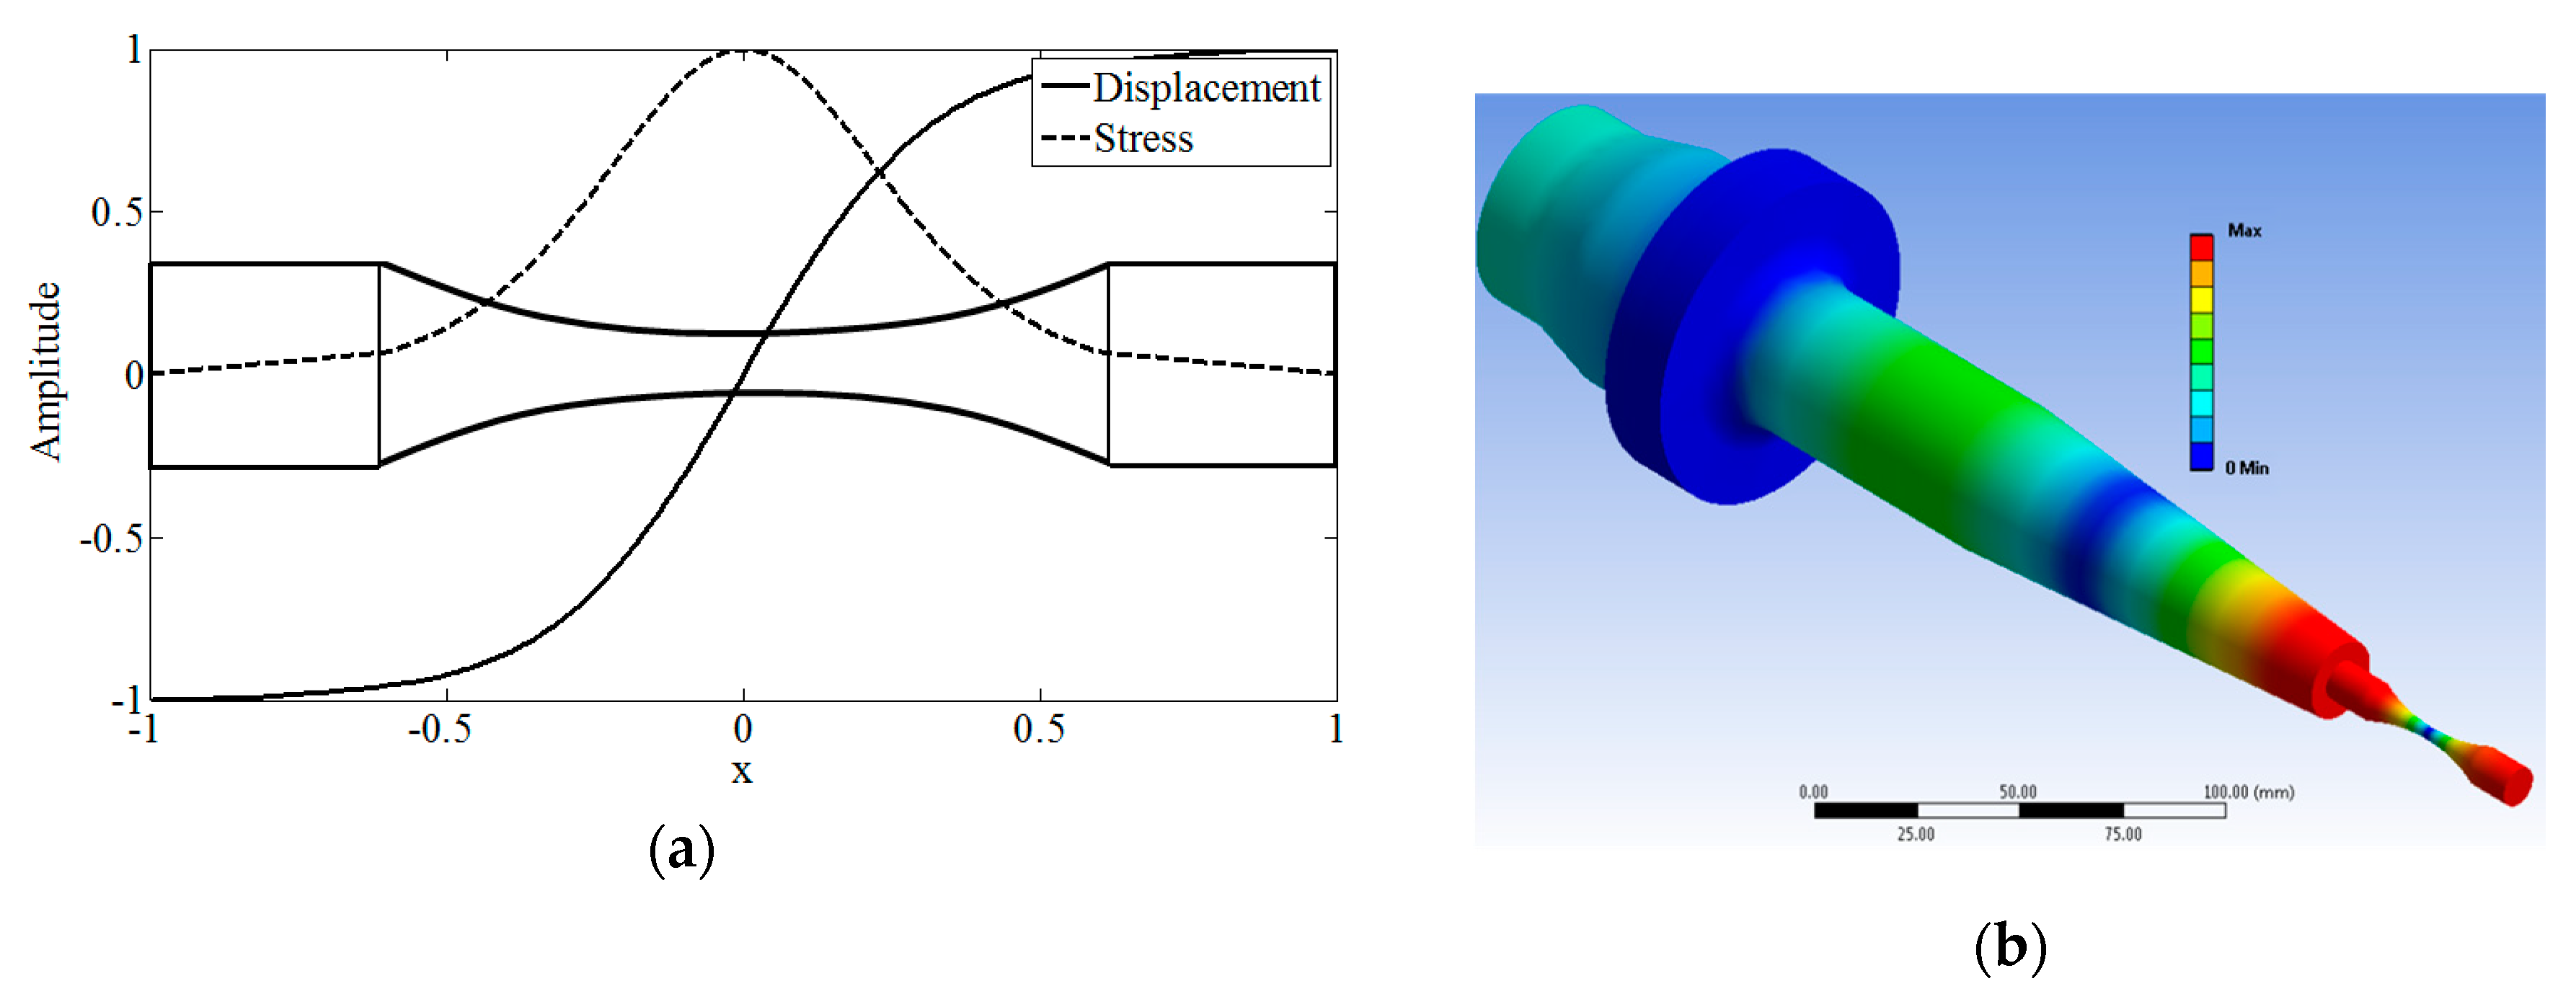
4.2.1. Tuning with a Global Dimensional Scale Factor

Montalvão and Wren [25] show that one approach for ‘reusing’ existing designs (such as the ones from Baptista et al. [16,55]), consists of using a geometrical scale factor that can be determined from:
s = f U D f C D
where f U D is the mode shape’s resonant frequency of the ‘Uncalibrated Design’ and f C D is the mode shape’s resonant frequency of the ‘Calibrated Design’. In practice, what this means is that if we scale up all the dimensions of an existing design by a scale factor of s , all the natural frequencies will be scaled down in the same proportion. Since we want to have one of the tension mode shapes of the Calibrated Design cruciform specimen tuned at a certain natural frequency (in the case of Montalvão and Wren, 2017, 20 ± 0.5 kHz [25]), we only need to determine the dimensional scale factor based on the natural frequency of the existing Uncalibrated Design (UD), which can be achieved either experimentally or using Finite Element Analysis (FEA).
The scale factors determined were 0.5533 and 0.4577 for the T-T and C-T specimens respectively, considering a 6082-T651 aluminium alloy and a 10 mm thick base specimen. This means that Equation (4) can yield rather small specimens, especially at the gauge area. Also, since the gauge area of specimens T-T and C-T present different dimensions due to the different scale factors, it is not clear that they are comparable.

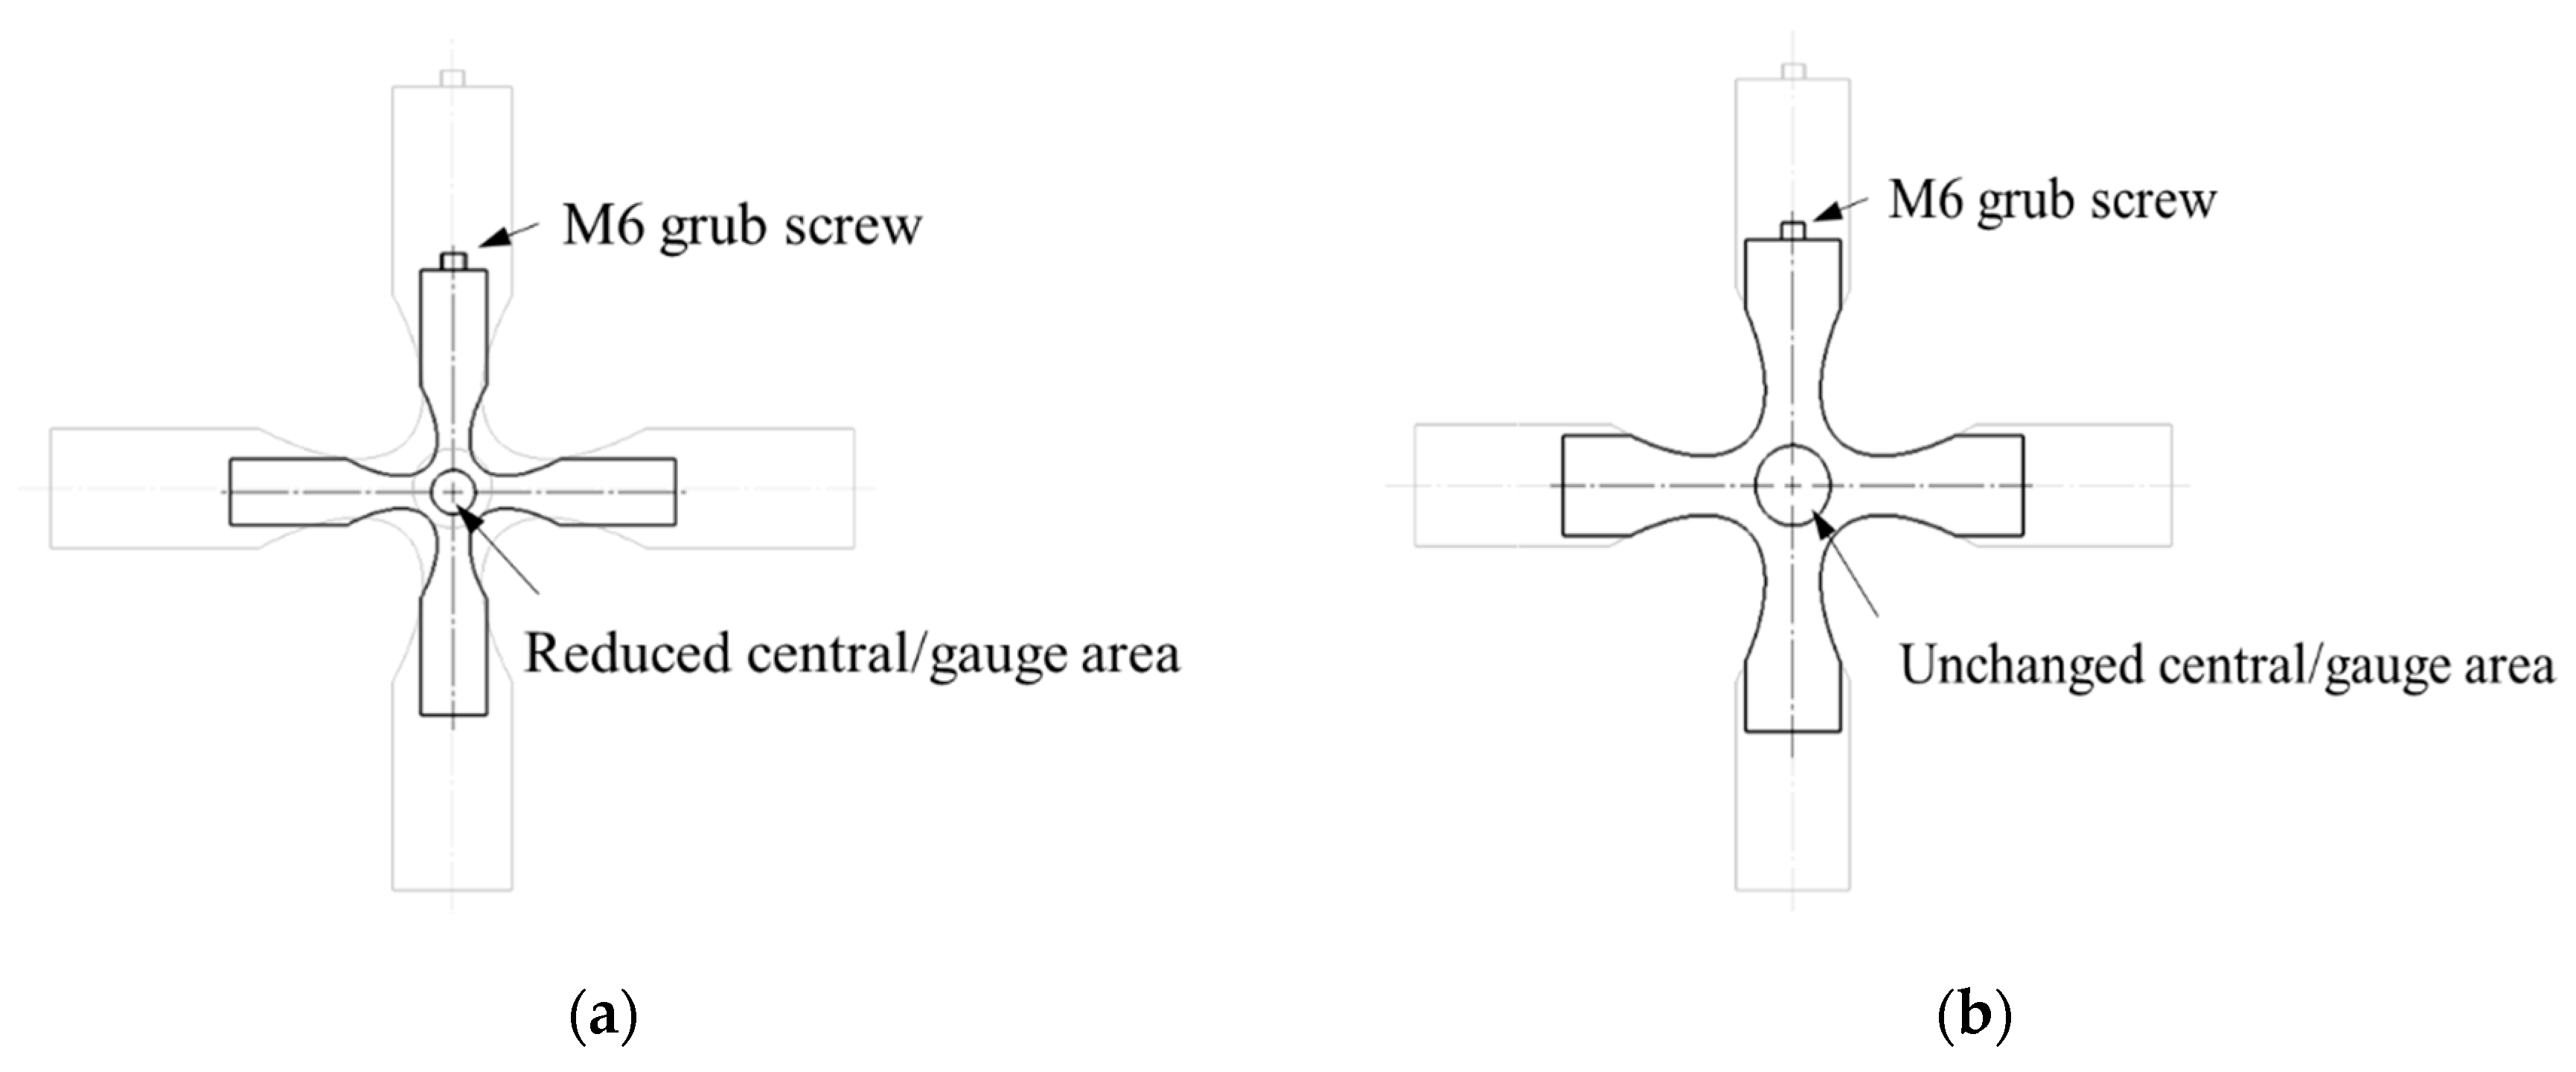
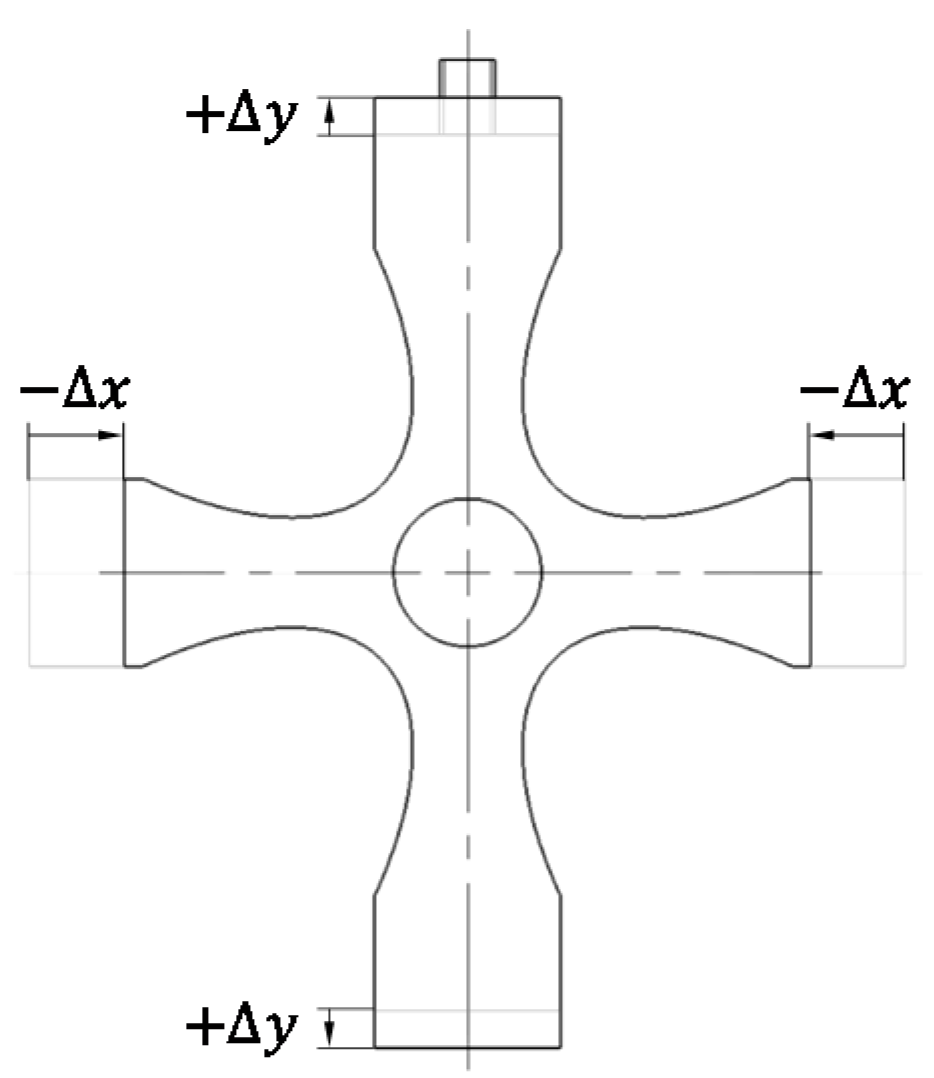
4.2.2. Tuning by Changing the Specimen’s Arms’ Dimensions

To ensure that the gauge area dimensions are pre-determined, an alternative method is suggested, whereby the rectangular ends of the arms have their lengths (and/or widths) changed [26,97]. If one considers the approximation that one single arm of the cruciform specimen behaves as a rod with a lump mass at the tip under free longitudinal vibration, then the increase in mass at the tip will lead to a reduction in the natural frequency f n , and vice versa, as illustrated with Equation (5):
f n = 1 2 π A E m L
where A is the cross-sectional area of the idealised rod, L is its length, E is the Young’s modulus of the rod’s material, and m is value of the lump mass at the tip.
However, cruciform specimens are not composed of uniform rods with lump masses at their tips, so although the basic idea can be explored, Equation (5) cannot be formally used. Instead, using FEA, this approximation was proposed to be used to tune the original specimens from Baptista et al. [16,55] so that the required C-T and T-T mode shapes at 20 kHz were obtained without affecting the geometry of the specimens’ gauge area [26,97]. The result was a cruciform specimen with the same central section geometry and thickness as the original specimen, but only slightly shorter (or even narrower) arms (Figure 18). To achieve a working specimen, several dimension combinations were numerically tested and experimentally tested until they have the resonance mode of interest within the working frequency [24].
The same principles as the ones described in the previous Section 4.2.2 were used to design specimens that are able to deliver biaxiality ratios B [ 1 ,   1 ] [26]:
B = { σ y / σ x   i f | σ x | | σ y | σ x / σ y   i f | σ x | < | σ y |
This means that for B = ± 1 we have the same in-plane stresses in both directions (symmetric cruciform specimens) and for the limit case where B = 0 we have uniaxial stress in one direction only. The signal is indicating if the mode shape is either in-phase (T-T) when positive (+), or out-of-phase (C-T) when negative (-).
When biaxiality ratios B ± 1 are being sought, this can be achieved by changing the arms’ lengths in different directions by different proportions (Figure 19). If the arm in the horizontal direction is shortened by a quantity Δ x , and using again the analogy of a rod with a lump mass at the tip, this corresponds to a reduction in the mass in the horizontal direction; hence, to an increase in the natural frequency according to Equation (5). To compensate for this increase in the natural frequency, the arm in the vertical direction is extended by a quantity + Δ y until the frequency is reduced back to 20 kHz. Since the elongation of one arm corresponds to an increase in mass, Equation (5) tells us that the frequency can be reduced this way. Figure 6 shows one example of what a specimen with a non-unitary biaxiality ratio may look like following this procedure.

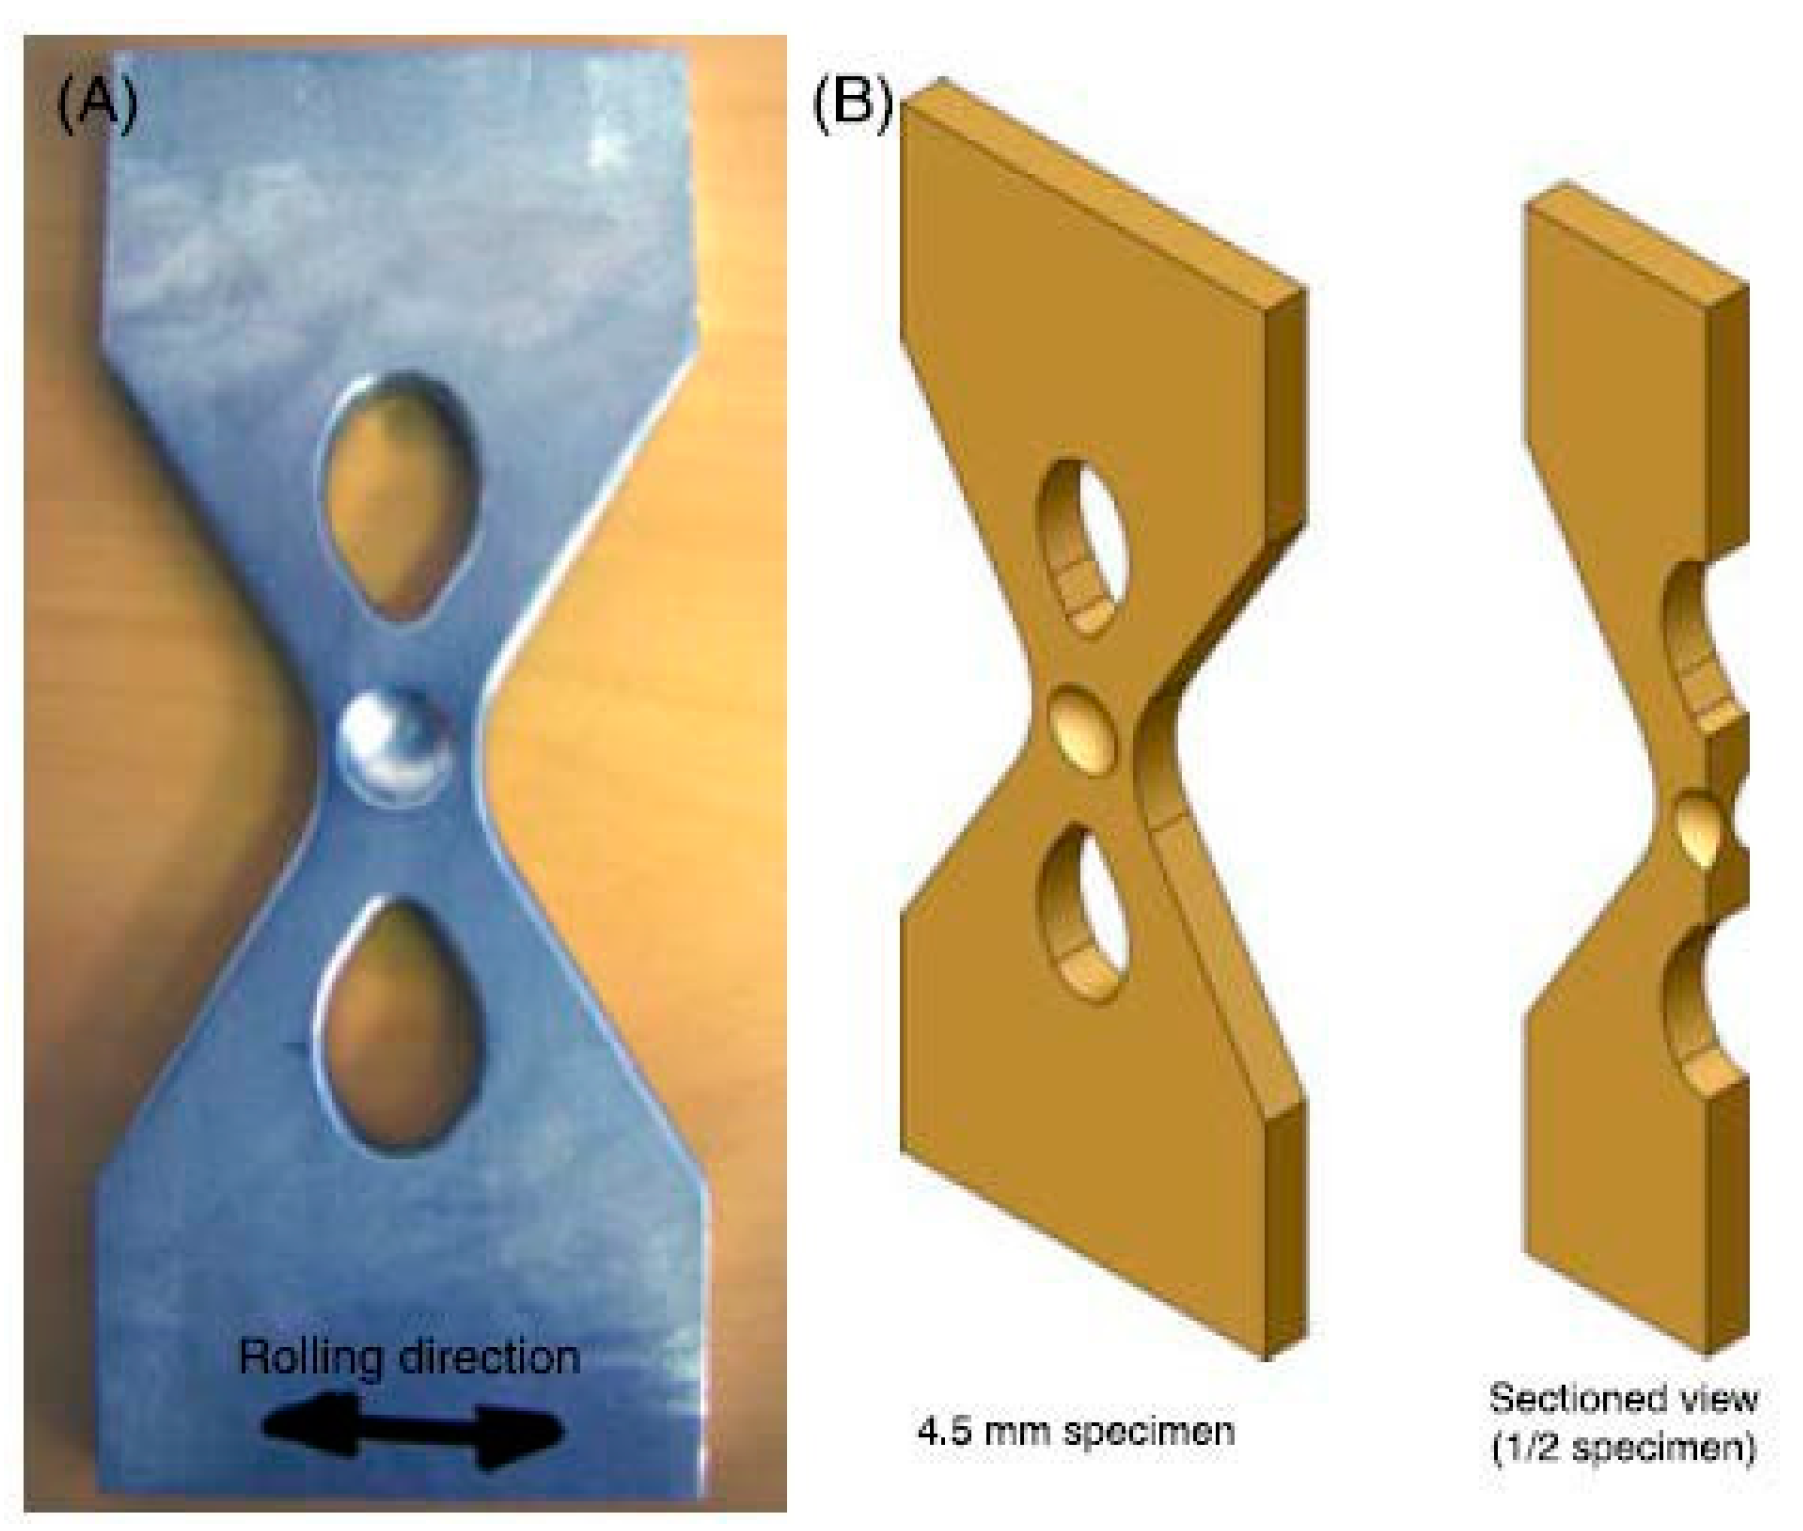
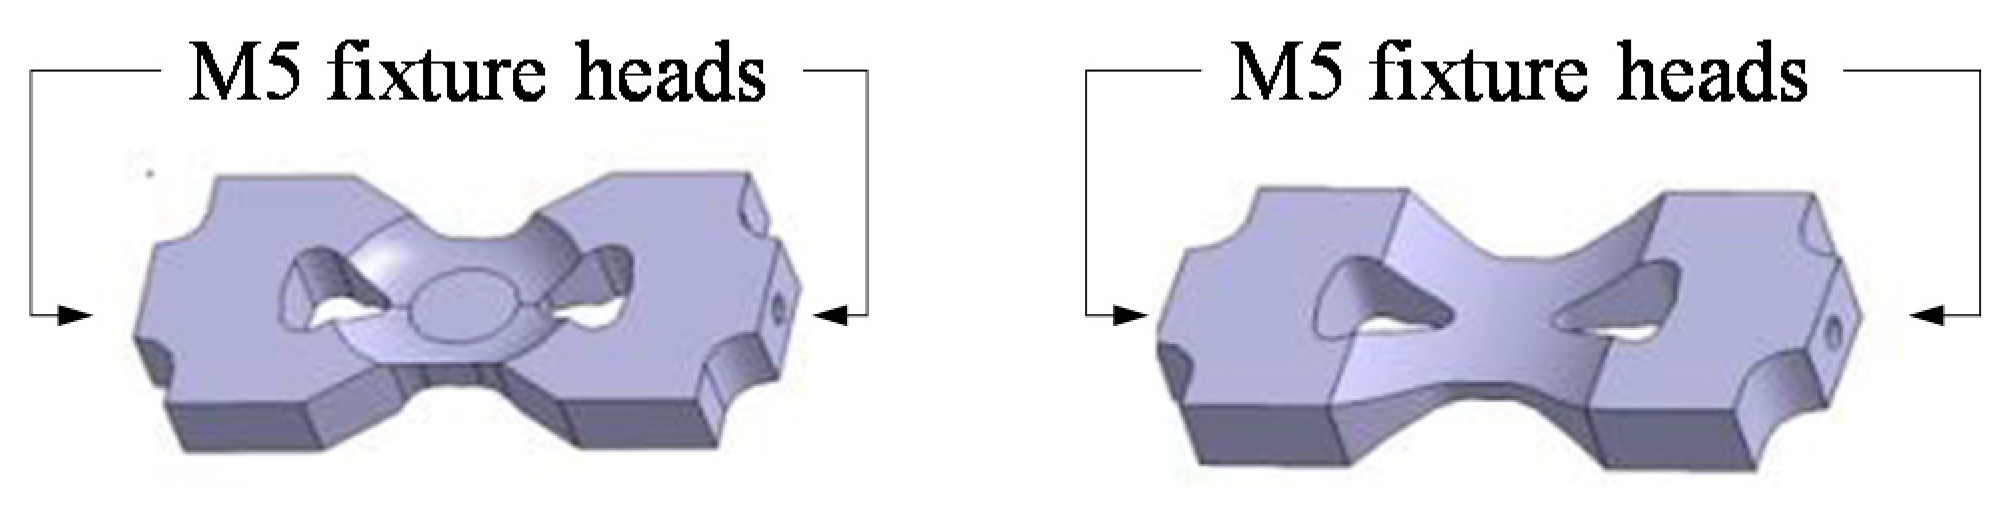
4.3. Tension/Tension Ultrasonic Fatigue Testing (Teardrop Specimens)

An optimisation process based on the computation of the modal response and biaxial stress state profile of a twin-teardrop biaxial specimens was presented by Nwawe et al. [98]. Aiming at adapting twin-teardrop specimens to be used in UFT machines, two preliminary UFT twin-teardrop specimen concepts (spherical and cylindrical) were obtained (Figure 20).
Although this is still preliminary work, these UFT twin-teardrop designs should, in principle, be able of being tested for stress ratios R 1 . This could be an advantage when compared to the cruciform specimens adapted for UFT as discussed in Section 4.2, which can only be used for R = 1 . This is because specimens in Figure 20 have two attachment points, one of each can be anchored. By having one end fixed, a mean (static) stress could, in principle, be introduced. However, this brings more challenges to the design, as boundary conditions need to be modelled precisely. Also, these specimens may have some limitations if one wants to study out-of-phase (C-T) biaxial testing or non-unitary biaxiality ratios.

5. Performance of Biaxial Specimens Based on Experimental Evidence

Experimental fatigue tests were carried out on the ultrasonic fatigue testing facilities in Instituto Superior Técnico (University of Lisbon). Both tension/torsion UFT cylindrical specimens with three ‘throats’ and tension/tension UFT in-plane biaxial cruciform specimens were used, following the guidelines previously described in Section 4.1 and Section 4.2, respectively.

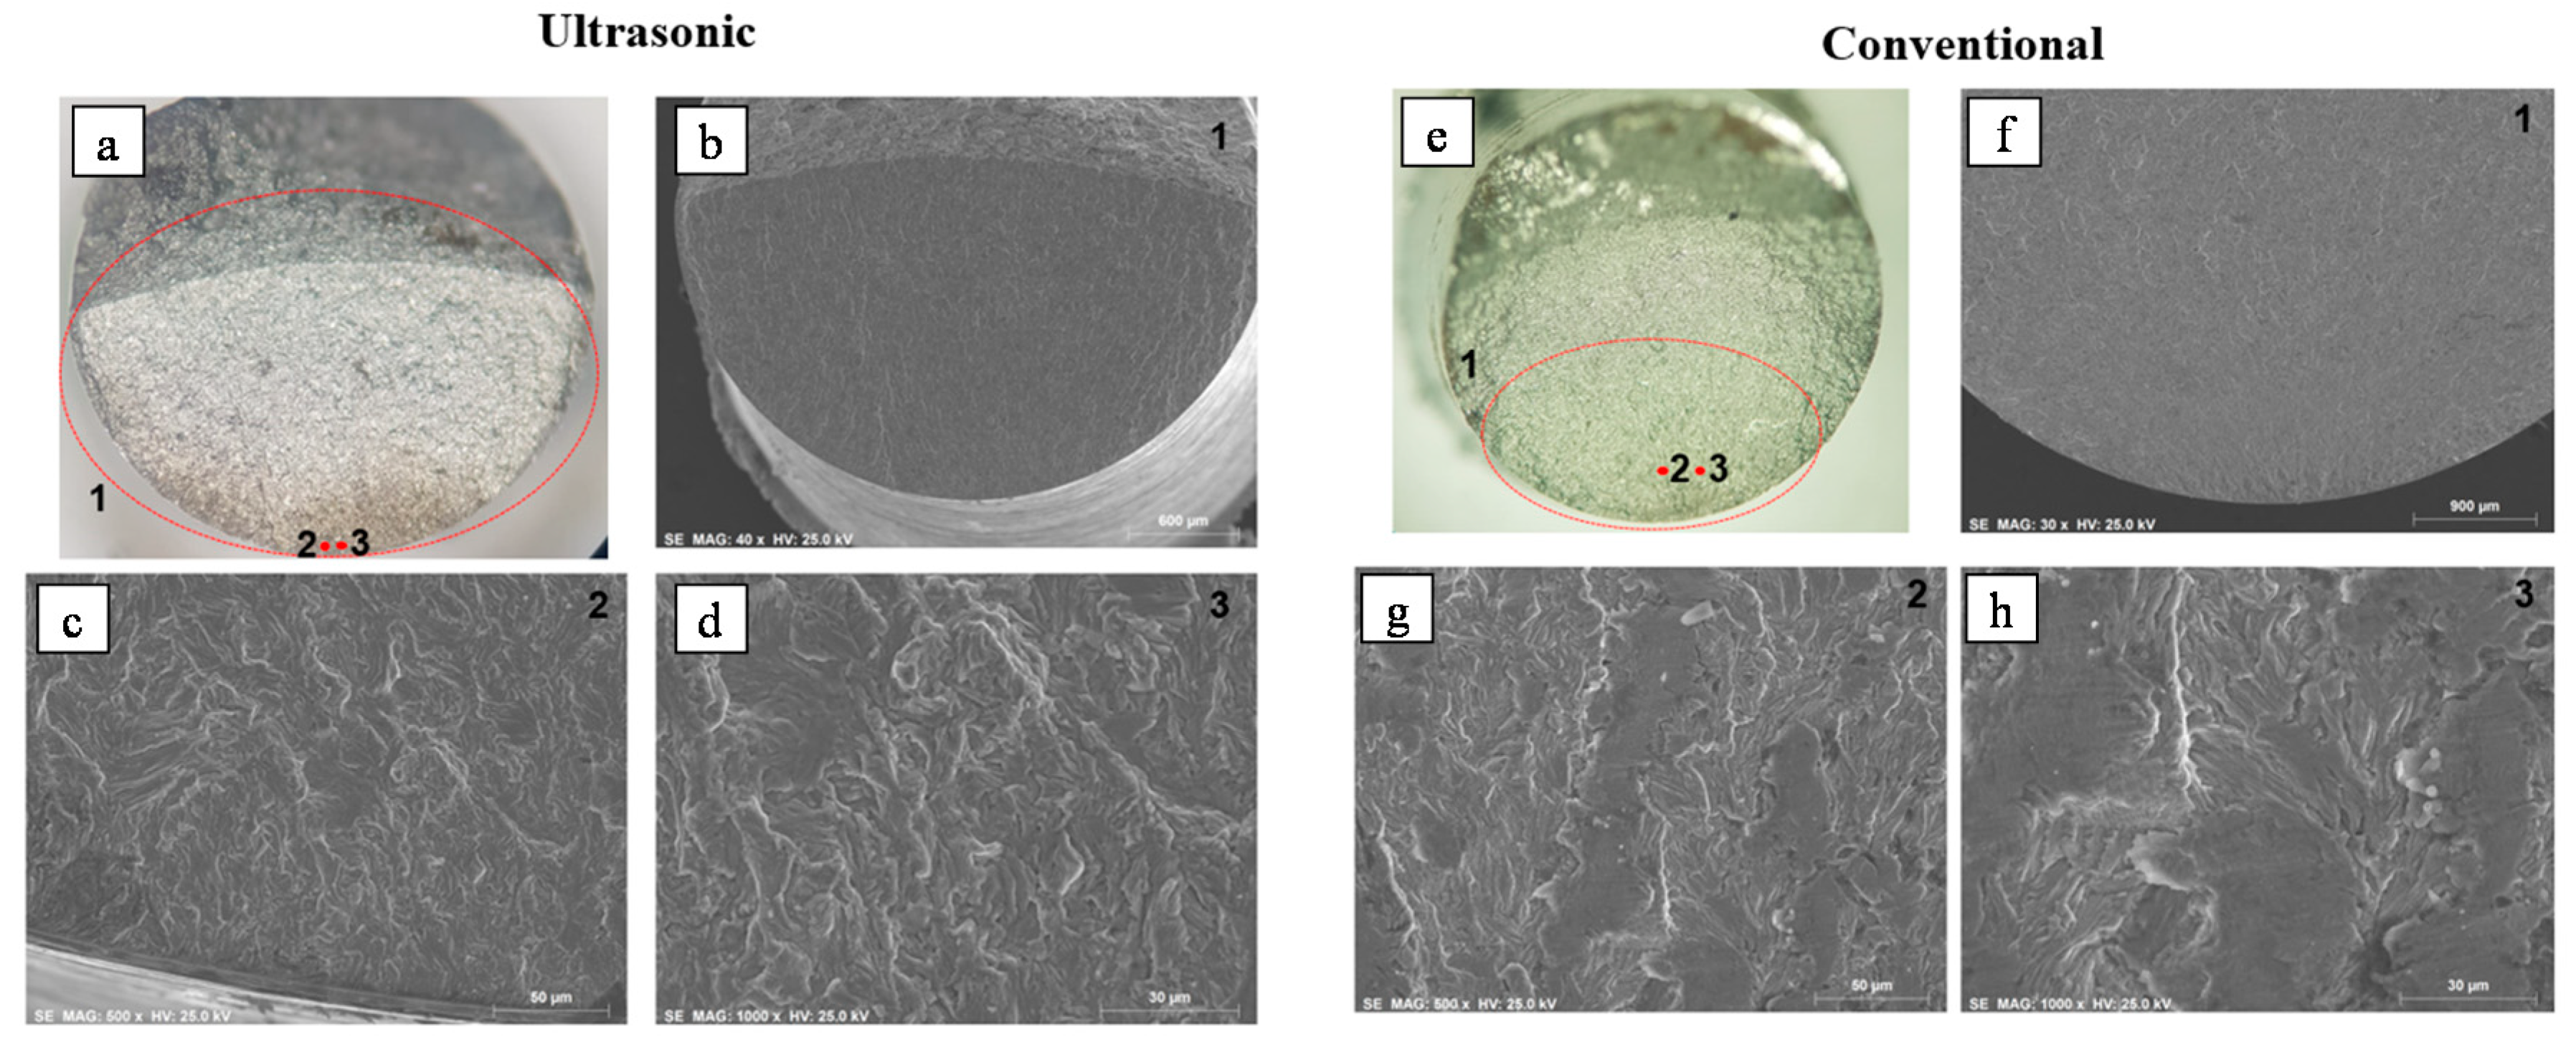
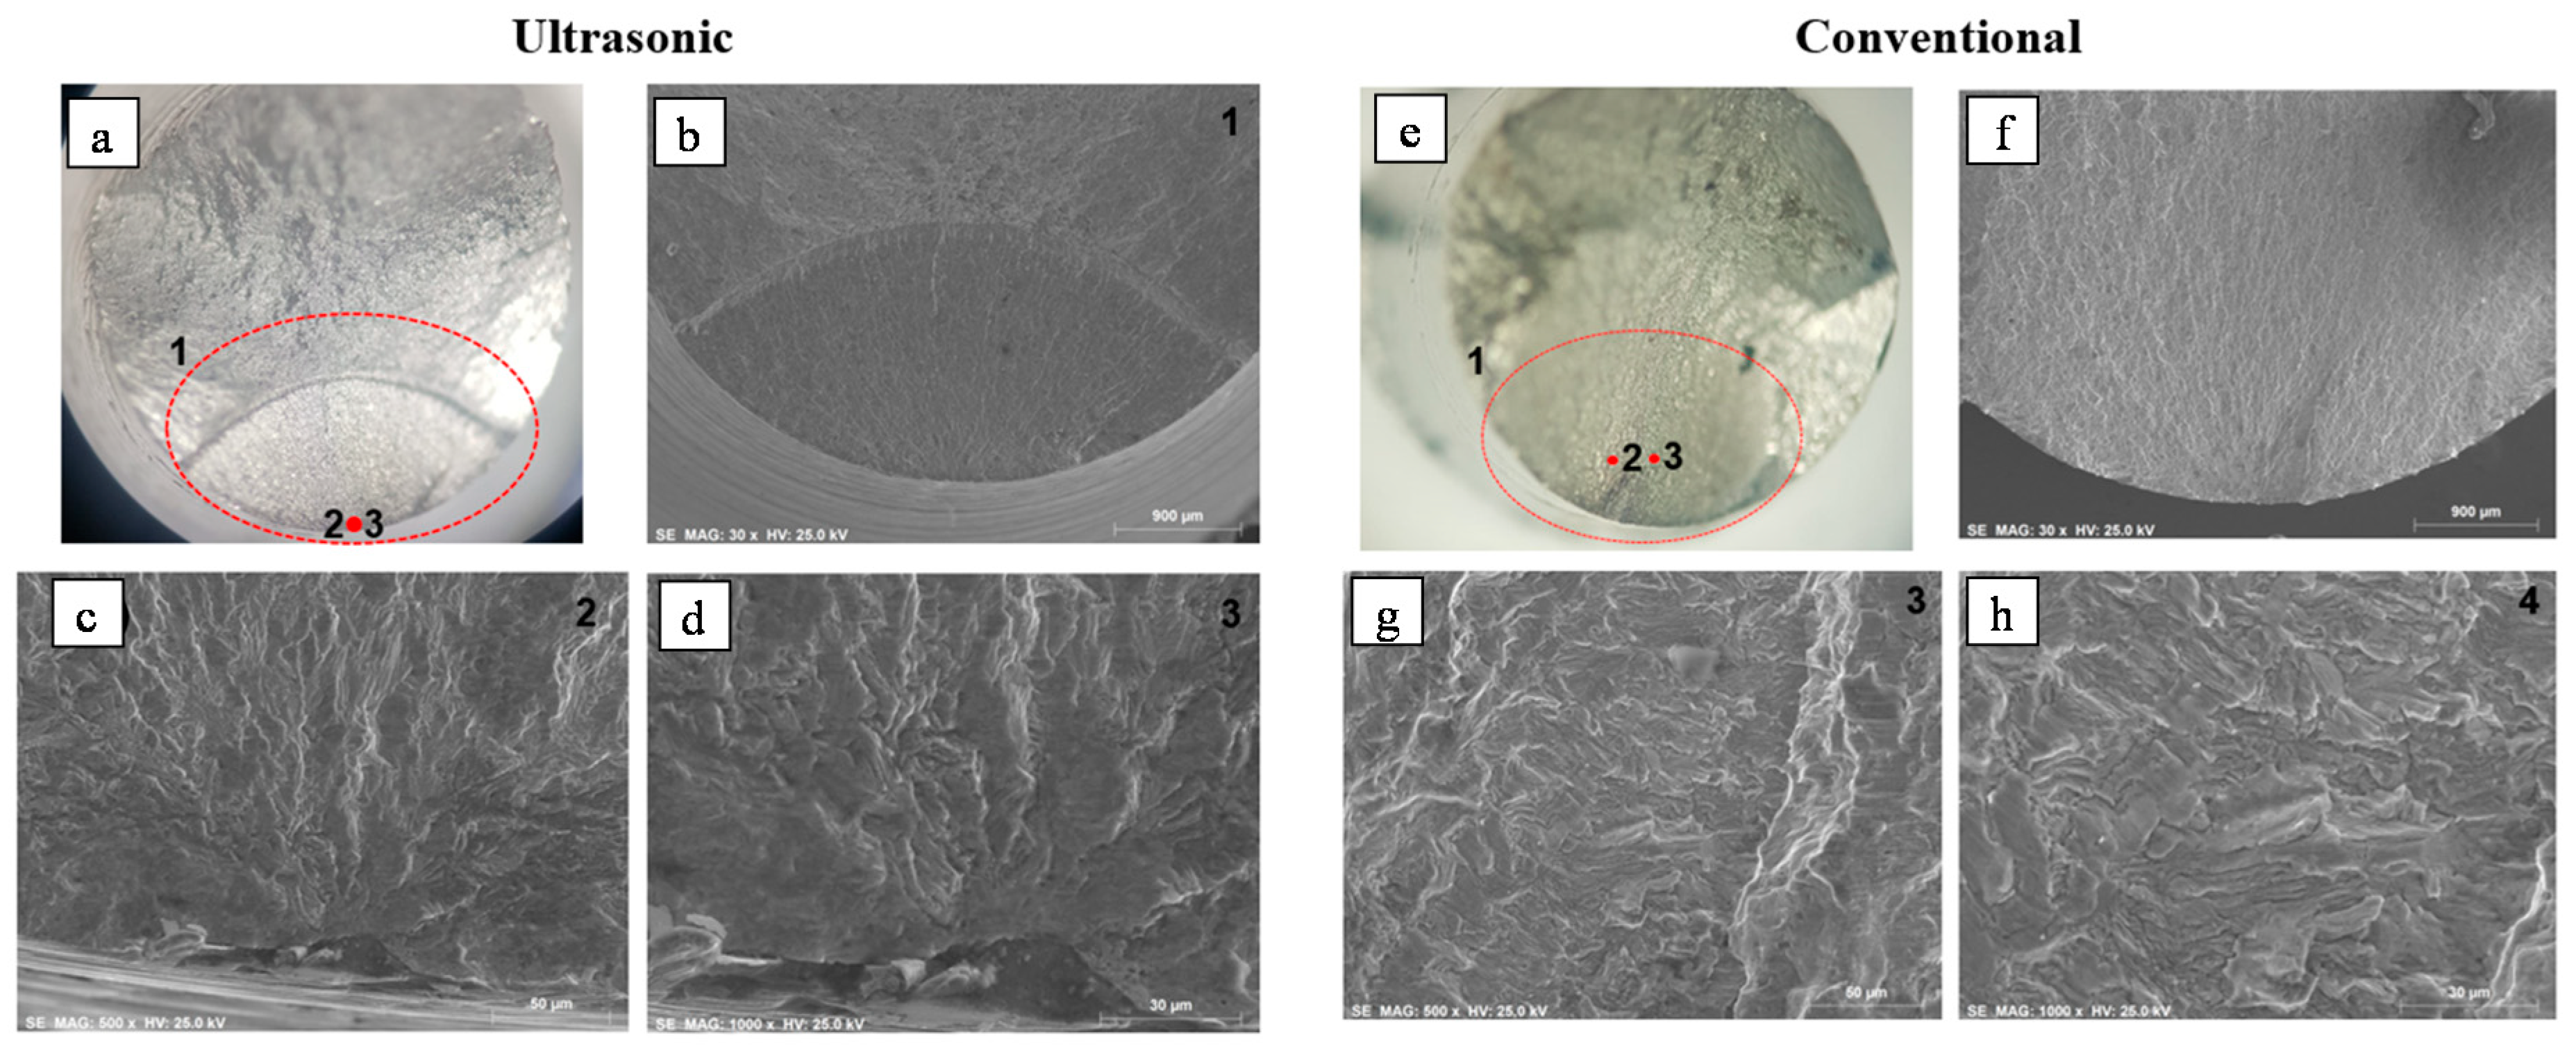
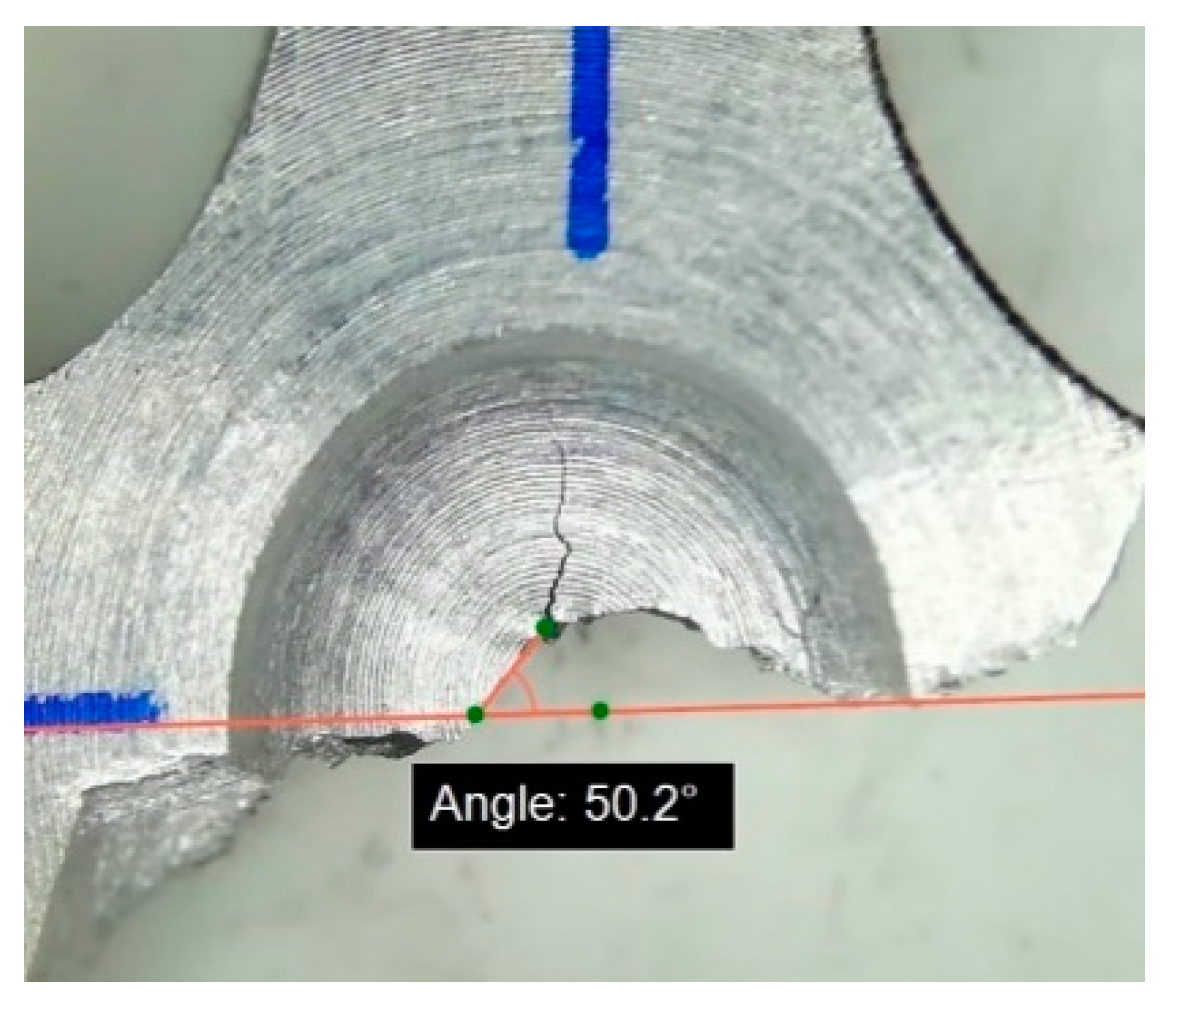
5.1. Tension/Torsion Ultrasonic Fatigue Testing

Cylindrical specimens were produced from an ER9 class train wheel. The material (Steel) was defined to comply with the European Standard EN 13262 + A1. A metallurgical analysis of the railway wheel’s Steel in the rim and in the web region was firstly conducted (Figure 21) using an Optical microscope and Scanning Electron Microscopy (SEM). This is useful since it is known that the material’s microstructure may influence results [99,100,101,102].
In Figure 21, the microstructure images of the web (Figure 21b,c) and the rim (Figure 21d,e), show a perlite-ferrite microstructure with a predominant perlite phase. The microstructure analyses show, for the same low magnification (Figure 21b,c), differences in the microstructure distribution and grain size. In the rim section a smaller grain and greater disorder arrangement of the perlite phase is found, related to a higher cooling rate treatment.
Figure 22 shows the profile of the fracture on a tension/torsion specimen which was tested with stress ratios R = 1 (both in tension and in torsion). The von Mises equivalent stress was 0.577 (the use of the von Mises criterion is only exactly applicable when homogeneous material properties relationship between shear and tensile stresses are equal to 0.577). Fracture occurred at the main throat (central throat in Figure 15) as intended. The angle between the fracture surface and the horizontal in Figure 22 is in agreement with similar fatigue tests carried out for the similar Steel and loading conditions in classical servo-hydraulic fatigue testing machines [89,90,91].
A total of eight specimens were tested to failure. The first specimen was used for calibration of the system using strain gauges, i.e., the correlation between the machine’s output power and induced stress at the central throat was determined. For the remaining specimens the applied tension/torsion stresses were transformed into equivalent von Mises stresses and correlated with the obtained final fatigue life. Fatigue results were then plotted in a S-N graph as shown in Figure 23, showing that fatigue strength increases for both uniaxial and multiaxial UFT, as well as for run-out specimens under VHCF conditions. In uniaxial run-out conditions stress results have an increase of 11% when tested in ultrasonic fatigue at 20 kHz in relation to conventional 5 Hz. Regarding the multiaxial results the difference is more pronounced with 45% higher stresses at 20 kHz and no failures during the entire duration of the tests. Such results are in line with what is stated in the literature [101], where for certain metals application of high frequency fatigue testing has an impact on fatigue life stress results. Similar observations were made where the application of high frequency loads resulted in fatigue life strengthening [103,104,105], at least for low carbon metals with a ferrite-perlite microstructure, similar to the one used in this study. It is also worth mentioning that the perlite matrix is the root cause for the non-growth of micro-cracks in the VHCF regime [99]: the finer perlite at the rim and coarser perlite at the web influenced positively the fatigue strength of the material at ultrasonic frequencies [106]. Since the material in this study has a predominant perlite phase, it results in little or no failure in the VHCF regime, i.e., above 106 cycles. On the other hand, the slope of the S-N curve from 106 cycles is very small (almost a flat plateau), making it extremely difficult to configure a stress state so that failure occurs at 107 and 108 cycles. Therefore, points at 109 cycles in Figure 23 are representing those that did not fail at all in the VHCF regime (run-out).
Test specimens that nucleated a fatigue crack during UFT and ‘lost resonance’ were then put into a tensile test machine for total failure to be achieved. The obtained SEM images were compared to uniaxial ultrasonic specimens machined also from the same Steel (rim of the railway wheel). SEM analysis was also conducted on specimens that were subjected to uniaxial and multiaxial conventional fatigue testing. SEM images for uniaxial and multiaxial specimens are showed in Figure 24 and Figure 25, respectively.
Figure 24 shows SEM uniaxial tension-compression detailed images for both conventional and ultrasonic fatigue testing conditions. From comparing both sets of images, no clear difference was found in the origin of fatigue crack initiation as well as propagation marks. The propagation marks only show to have a slight spacing increase related to higher crack growth speed in conventional testing.
The multiaxial tension/torsion result images using SEM are shown in Figure 25 for both conventional and ultrasonic fatigue testing methods. In this case, the total failure is different between both loading conditions. Nevertheless, propagation marks are similar between both loading conditions (modal vibration vs. actuator imposed) and indicate the existence of shear stresses. The shape of propagation marks, as seen in both ultrasonic and conventional higher amplification images (Figure 25c,d,g,h), is laminated. The separation lines from the chipping point to the initiation zone can be better observed in the SEM images (Figure 25b,f). Such lamination is linked to fatigue shear damage mechanism. When there is no shear, a more ‘randomised’ pattern of lines is generated as seen in the amplified uniaxial propagation marks (Figure 24c,d,g,h).
A much greater stress life increase was obtained between the conducted multiaxial fatigue tests. Such increase can be associated with a higher influence of shear stress in frequency fatigue strengthening of the material. It could also be related to the torsion stress gradient or a geometry effect/volume effect. No clear difference was observed through SEM imaging comparison between conventional and ultrasonic fatigue cracks. A more detailed research to the fracture surface specimens and to the final microstructure after fatigue testing is required.

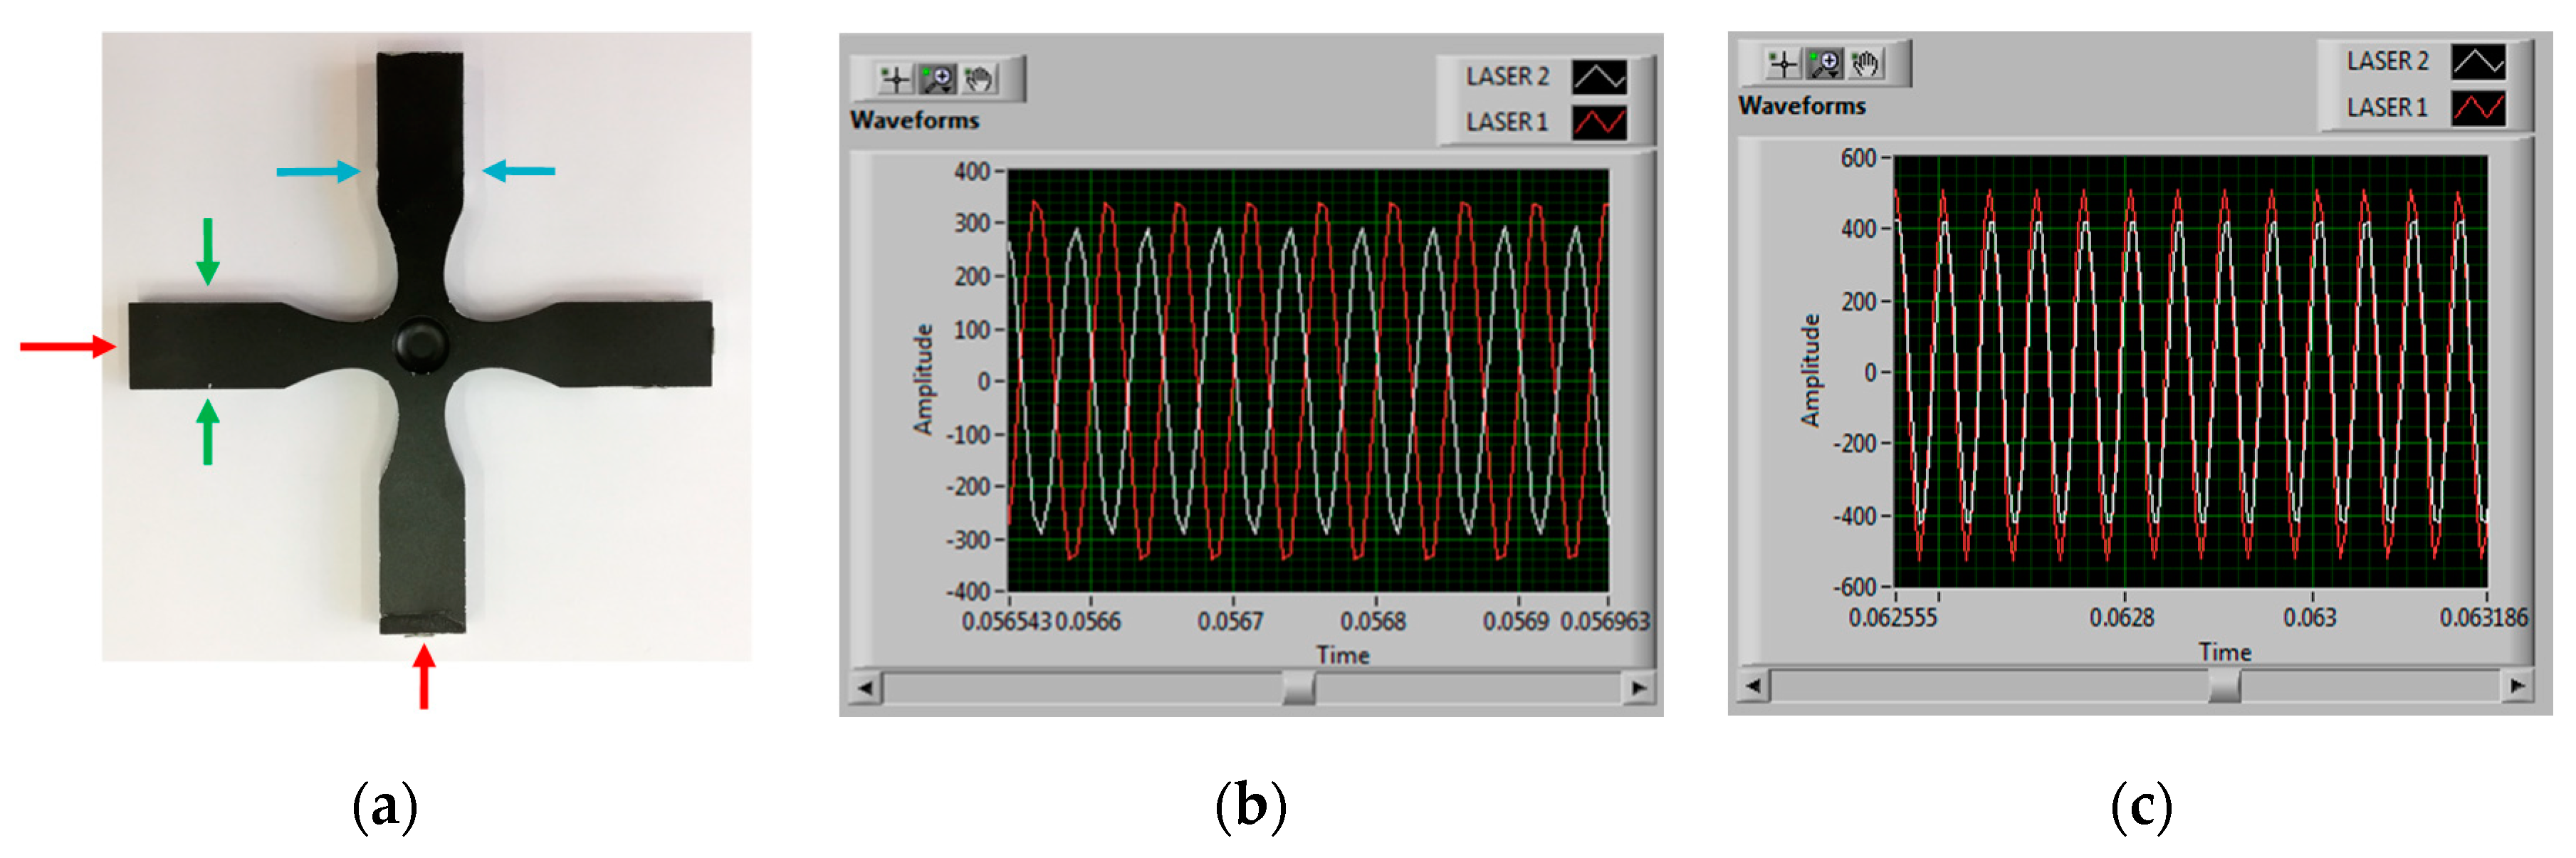
5.2. Tension/Tension Ultrasonic Fatigue Testing (Cruciform Specimens)

Figure 26 shows the fracture surface of a cruciform specimen made from a 6082-T651 Aluminum alloy, and tested in out-of-phase tension/compression, with a stress ratio R = 1 in both directions. Crack initiation occurred at the centre of the specimen as expected. Once again, the angle of crack initiation and the crack growth of the fracture surface is in agreement with similar experimental results obtained using cruciform specimens on similar aluminium alloys tested with a fatigue testing machine powered by linear iron core motors [78].
The problem with cruciform specimens, as reported by Costa et al. [24]—in a study that combined FEA analysis, experimental UFT results, and thermographic analysis—is that these specimens may present ‘undesired’ mode shapes in the vicinity of 20 kHz. In such a case, the specimen’s deformation shape will be the result from the combination of the two mode shapes being excited, and not just predominantly from one. This will condition the stress field at the centre of the specimen. While for C-T specimens this was not an issue and the specimens were behaving as intended, T-T specimens in the study presented what was called a ‘flapping’ mode shape of the horizontal arms.
The displacements at the specimens’ arms were measured in both axial and transverse directions (Figure 27) with a Polytec LASER vibrometer, which waveforms are shown in Figure 27b,c. It can be seen that the biaxiality ratios are close to one (unitary), so that the phase shift between horizontal and vertical arms on specimen C-T is 90° (out-of-phase), and the respective phase shift on specimen T-T is 0° (in-phase).
Figure 28 shows the Frequency Response Functions (FRFs) for specimen T-T. There is transverse motion of the cantilever (horizontal) arms, which can be due to many reasons: (i) the surfaces of the arms not being flat; (ii) body motion due to the horn’s axial mode; (iii) modes in the nearby frequencies (a disturbance can be seen at 19.8 kHz, within the machine’s operational range); or (iv) asymmetries in the specimen. The first two issues are not of concern, as they are not related to the specimen’s mode shape, but the latter ones require more research.
Figure 29 illustrates two different situations from FEA [24]. The first case (a) concerns the T-T (in-phase) axial mode shape at 20 ± 0.5 kHz, whereas the second case (b) is the preceding mode shape (the flapping mode shape) where the arms are flexing, at the vicinity of the machine’s T-T mode shape and machine’s operating frequency. The closer the flapping mode shape is of the T-T mode shape, the greater its influence on the results. Therefore, designers must take these situations into account and find ways to reducing this influence when redesigning specimens to be used in UFT machines.

6. Conclusions

In this paper, a review of recent developments on multiaxial ultrasonic fatigue testing (UFT), including descriptions of the main equipment, instrumentation, and specimens, was presented. Original experimental results of UFT conducted on steel and aluminium were also presented in order to demonstrate the capability of multiaxial load testing in the VHCF regime.
The paper starts with an overview of the early days of UFT using uniaxial test specimens. Then, a review of multiaxial fatigue using ‘conventional’ test methods and speeds is presented, so that the integration of both multiaxial testing and UFT can be better understood.
The term multiaxial fatigue is generally accepted in the literature but indeed it may not be the adequate one since it includes a triaxial stress state which is rarely found in service. Moreover, at the surface of the material, where a large majority of fatigue crack initiation occurs, the stress state is biaxial. Therefore, most literature on multiaxial fatigue testing, whether it uses ‘conventional’ testing or UFT machines, is focused on either one from these two loading conditions:
Tension/torsion where both axial and rotational displacements are combined. Specimens are cylindrical/toroidal which in the specific case of UFT, include three ‘throats’. The machine has a modified horn which is more complex than the ones typically seen in uniaxial UFT;
Tension/tension where orthogonal in-plane stresses are generated. In the case of UFT, cruciform specimens were used. Stresses can be in-phase (tension-tension, or T-T) or out-of-phase (compression-tension, or C-T) and the biaxiality ratios can vary, in theory, between 0 and 1 for T-T specimens, and between −1 and 0 for C-T specimens. The horn does not require any special features and the ones typically seen in uniaxial UFT can be used.
UFT machines working at 20 kHz are most often used to perform very high cycle fatigue (VHCF) tests with a stress ratio R = 1 , although for ‘twin-teardrop’ specimens a different stress ratio is suggested. Experimental results of both tension/torsion using cylindrical specimens and tension/tension using cruciform specimens show fairly good results with correct induction of multiaxial stresses. However, there are challenges that need to be kept in mind when designing specimens for UFT, such as the existence of nearby mode shapes that may detrimentally affect the stress field and therefore the fatigue results.

Author Contributions

Conceptualisation: D.M., L.R., Y.C. and M.F.; Experimental Testing: P.C. and H.S.; Validation: P.C., H.S., R.N. and D.M.; Formal analysis: P.C., R.N., L.R., M.F. and D.M.; writing—original draft preparation: P.C., R.N. and D.M.; writing—review: P.C., H.S., L.R., M.F., Y.C. and R.N.; writing—editing: D.M.; supervision: D.M., L.R., M.F. and Y.C. All authors have read and agreed to the published version of the manuscript.

Funding and Acknowledgments

The authors would like to thank FCT, Fundação para a Ciência e Tecnologia, which through several research projects in the last 20 years has supported financially the development of these technologies of multiaxial very high cycle fatigue and namely through IDMEC, under LAETA, project UIDB/50022/2020 and Project PTDC/EMS-PRO/5760/2014.

Conflicts of Interest

The authors declare no conflict of interest. The funders had no role in the design of the study; in the collection, analyses, or interpretation of data; in the writing of the manuscript, or in the decision to publish the results.

References

  1. Suryanarayana, C. Experimental Techniques in Materials and Mechanics; CRC Press: Boca Raton, FL, USA, 2011. [Google Scholar]
  2. Freitas, M. Multiaxial fatigue: From materials testing to life prediction. Theor. Appl. Fract. Mech. 2017, 92, 360–372. [Google Scholar] [CrossRef]
  3. Anes, V.; Montalvao, D.; Ribeiro, A.; Freitas, M.; Fonte, M. Design and instrumentation of an ultrasonic fatigue testing machine. In Proceedings of the VHCF5—5th International Conference on Very High Cycle Fatigue, Berlin, Germany, 28–30 June 2011. [Google Scholar]
  4. Davies, P. Long-Haul Spaceship Travel ‘Could Soon Become Mainstream’. Available online: https://www.travelweekly.co.uk/articles/327137/long-haul-spaceship-travel-could-soon-become-mainstream (accessed on 12 May 2020).
  5. Freitas, M.; Anes, V.; Montalvao, D.; Reis, L.; Ribeiro, A. Design and assembly of an ultrasonic fatigue testing machine. In Proceedings of the XXVIII GEF—Encuentro del Grupo Español de Fractura (Anales de Mecânica de la Fractura), Gijón, Spain, 6–8 April 2011. [Google Scholar]
  6. Kok, Y.; Tan, X.P.; Wang, P.; Nai, M.L.; Loh, N.H.; Liu, E.; Tor, S.B. Anisotropy and heterogeneity of microstructure and mechanical properties in metal additive manufacturing: A critical review. Mater. Des. 2018, 139, 565–586. [Google Scholar] [CrossRef]
  7. Lage, Y.; Cachão, H.; Reis, L.; Fonte, M.; de Freitas, M.; Ribeiro, A. A damage parameter for HCF and VHCF based on hysteretic damping. Int. J. Fatigue 2014, 62, 2–9. [Google Scholar] [CrossRef]
  8. Bathias, C. There is no infinite fatigue life in metallic materials. Fatigue Fract. Eng. Mater. Struct. 1999, 22, 559–566. [Google Scholar] [CrossRef]
  9. Pyttel, B.; Schwerdt, D.; Berger, C. Very high cycle fatigue–Is there a fatigue limit? Int. J. Fatigue 2011, 33, 49–58. [Google Scholar] [CrossRef]
  10. Lage, Y.; Ribeiro, A.; Montalvão, D.; Reis, L.; Freitas, M. Automation in strain and temperature control on VHCF with an ultrasonic testing facility. J. ASTM Int. 2014, 1571, 80–100. [Google Scholar]
  11. Bathias, C. Piezoelectric fatigue testing machines and devices. Int. J. Fatigue 2006, 28, 1438–1445. [Google Scholar] [CrossRef]
  12. Freitas, M.; Reis, L.; Li, B.; Guelho, I.; Antunes, V.; Maia, J.; Cláudio, R. In-Plane Biaxial Fatigue Testing Machine Powered by Linear Iron-Core Motors. J. ASTM Int. 2014, 1571, 63–79. [Google Scholar]
  13. Montalvão, D.; Shengwen, Q.; Freitas, M. A study on the influence of Ni–Ti M-Wire in the flexural fatigue life of endodontic rotary files by using Finite Element Analysis. Mater. Sci. Eng. C 2014, 40, 172–179. [Google Scholar] [CrossRef] [Green Version]
  14. Reis, L.; Li, B.; Freitas, M. A multiaxial fatigue approach to Rolling Contact Fatigue in railways. Int. J. Fatigue 2014, 67, 191–202. [Google Scholar] [CrossRef]
  15. Costa, P.; Vieira, M.; Reis, L.; Ribeiro, A.; de Freitas, M. New specimen and horn design for combined tension and torsion ultrasonic fatigue testing in the very high cycle fatigue regime. Int. J. Fatigue 2017, 103, 248–257. [Google Scholar] [CrossRef]
  16. Baptista, R.; Claudio, R.A.; Reis, L.; Guelho, I.; Freitas, M.; Madeira, J.F.A. Design optimization of cruciform specimens for biaxial fatigue loading. Frat. Integrità Strutt. 2014, 8, 118–126. [Google Scholar] [CrossRef] [Green Version]
  17. Huang, Z.Y.; Liu, H.Q.; Wang, H.M.; Wagner, D.; Khan, M.K.; Wang, Q.Y. Effect of stress ratio on VHCF behavior for a compressor blade titanium alloy. Int. J. Fatigue 2016, 93, 232–237. [Google Scholar] [CrossRef]
  18. Kovacs, S.; Beck, T.; Singheiser, L. Influence of mean stresses on fatigue life and damage of a turbine blade steel in the VHCF-regime. Int. J. Fatigue 2013, 49, 90–99. [Google Scholar] [CrossRef]
  19. Sander, M.; Stäcker, C.; Müller, T. Experimental and numerical investigations on crack initiation and crack growth under constant and variable amplitude loadings in the VHCF regime. In Fatigue of Materials at Very High Numbers of Loading Cycles: Experimental Techniques, Mechanisms, Modeling and Fatigue Life Assessment; Christ, H.-J., Ed.; Springer Fachmedien Wiesbaden: Wiesbaden, Germany, 2018; pp. 273–293. [Google Scholar]
  20. Nikitin, A.; Bathias, C.; Palin-Luc, T. A new piezoelectric fatigue testing machine in pure torsion for ultrasonic gigacycle fatigue tests: Application to forged and extruded titanium alloys. Fatigue Fract. Eng. Mater. Struct. 2015, 38, 1294–1304. [Google Scholar] [CrossRef] [Green Version]
  21. Mayer, H.; Schuller, R.; Karr, U.; Irrasch, D.; Fitzka, M.; Hahn, M.; Bacher-Höchst, M. Cyclic torsion very high cycle fatigue of VDSiCr spring steel at different load ratios. Int. J. Fatigue 2015, 70, 322–327. [Google Scholar] [CrossRef]
  22. Marines-Garcia, I.; Doucet, J.-P.; Bathias, C. Development of a new device to perform torsional ultrasonic fatigue testing. Int. J. Fatigue 2007, 29, 2094–2101. [Google Scholar] [CrossRef]
  23. Vieira, M.; de Freitas, M.; Reis, L.; Ribeiro, A.M.R. Development of a Very High Cycle Fatigue (VHCF) multiaxial testing device. Frat. Integrità Strutt. 2016, 10, 131–137. [Google Scholar] [CrossRef] [Green Version]
  24. Costa, P.R.; Montalvão, D.; Freitas, M.; Baxter, R.; Reis, L. Cruciform specimens’ experimental analysis in ultrasonic fatigue testing. Fatigue Fract. Eng. Mater. Struct. 2019, 42, 2496–2508. [Google Scholar] [CrossRef]
  25. Montalvão, D.; Wren, A. Redesigning axial-axial (biaxial) cruciform specimens for very high cycle fatigue ultrasonic testing machines. Heliyon 2017, 3, e00466. [Google Scholar] [CrossRef]
  26. Montalvão, D.; Blaskovics, A.; Costa, P.; Reis, L.; Freitas, M. Numerical analysis of VHCF cruciform test specimens with non-unitary biaxiality ratios. Int. J. Comput. Methods Exp. Meas. 2019, 7, 327–339. [Google Scholar] [CrossRef] [Green Version]
  27. Brugger, C.; Palin-Luc, T.; Osmond, P.; Blanc, M. Gigacycle fatigue behavior of a cast aluminum alloy under biaxial bending: Experiments with a new piezoelectric fatigue testing device. Procedia Struct. Integr. 2016, 2, 1173–1180. [Google Scholar] [CrossRef] [Green Version]
  28. Kazymyrovych, V. Very High Cycle Fatigue of Engineering Materials: A Literature Review; Karlstad University: Karlstad, Sweden, 2009. [Google Scholar]
  29. Kazymyrovych, V. Very High Cycle Fatigue of Tool Steels. Ph.D. Thesis, Karlstad University, Karlstad, Sweden, 2010. [Google Scholar]
  30. Bathias, C.; Paris, P.C. Gigacycle Fatigue in Mechanical Practice; CRC Press: New York, NY, USA, 2004. [Google Scholar]
  31. Stanzl-Tschegg, S.E.; Schönbauer, B. Mechanisms of strain localization, crack initiation and fracture of polycrystalline copper in the VHCF regime. Int. J. Fatigue 2010, 32, 886–893. [Google Scholar] [CrossRef] [Green Version]
  32. Green, C.H. Stress amplitude analysis in a generalized ultrasonic fatigue dumbbell specimen. J. Phys. D Appl. Phys. 1991, 24, 469–477. [Google Scholar] [CrossRef]
  33. Cho, I.-S.; Shin, C.-S.; Kim, J.-Y.; Jeon, Y.-H. Accelerated ultrasonic fatigue testing applications and research trends. Trans. Korean Soc. Mech. Eng. A 2012, 36, 707–712. [Google Scholar] [CrossRef] [Green Version]
  34. Marines, I.; Dominguez, G.; Baudry, G.; Vittori, J.F.; Rathery, S.; Doucet, J.P.; Bathias, C. Ultrasonic fatigue tests on bearing steel AISI-SAE 52100 at frequency of 20 and 30 kHz. Int. J. Fatigue 2003, 25, 1037–1046. [Google Scholar] [CrossRef]
  35. Ribeiro, A.; Montalvao, D.; Azinheira, J.; Freitas, M.; Reis, L.; Fontul, M. Hysteretic Damping as an Energy Parameter in Gigacycle Fatigue. In Proceedings of the 5th International Conference on Very High Cycle Fatigue, Berlin, Germany, 28–30 June 2011; DVM: Berlin, Germany, 2011. [Google Scholar]
  36. Delmotte, E.; Micone, N.; De Waele, W. Testing methodologies for corrosion fatigue. Int. J. Sustain. Constr. Des. 2015, 6, 10. [Google Scholar] [CrossRef] [Green Version]
  37. Cavalieri, F.; Bathias, C.; Ranc, N.; Cardona, A.; Risso, J. Ultrasonic fatigue analysis on an austenitic steel at high temperature. Mecánica Comput. 2008, 27, 1205–1224. [Google Scholar]
  38. Shyam, A.; Torbet, C.J.; Jha, S.K.; Larsen, J.M.; Caton, M.J.; Szczepanski, C.J.; Pollock, T.M.; Jones, J.W. Development of ultrasonic fatigue for rapid, high temperature fatigue studies in turbine engine materials. Superalloys 2004 2004, 259–268. [Google Scholar] [CrossRef]
  39. Müller, T.; Sander, M. On the use of ultrasonic fatigue testing technique – Variable amplitude loadings and crack growth monitoring. Ultrasonics 2013, 53, 1417–1424. [Google Scholar] [CrossRef]
  40. Atkinson, R.; Norris, G.; Winkworth, W. Behaviour of Skin Fatigue Cracks at the Corners of Windows in a Comet I Fuselage; HM Stationery Office: London, UK, 1960.
  41. Cohen, B.; Farren, W.; Duncan, W.; Wheeler, A. Report of the Court of Inquiry into the Accidents to Comet G-ALYP on 10 January 1954 and Comet G-ALYY on 8 April 1954; Her Majesty Station of Office: London, UK, 1955.
  42. Lage, Y.; Freitas, M.; Montalvao, D.; Ribeiro, A.; Reis, L. Ultrasonic fatigue analysis on steel specimen with temperature control: Evaluation of variable temperature effect. In Proceedings of the the XIII Portuguese Conference on Fracture, Coimbra, Portugal, 2–3 February 2012. [Google Scholar]
  43. Galliot, C.; Luchsinger, R.H. Uniaxial and biaxial mechanical properties of ETFE foils. Polym. Test. 2011, 30, 356–365. [Google Scholar] [CrossRef]
  44. Koster, M.; Wagner, G.; Eifler, D. Ultrasonic fatigue of a high strength steel. J. Phys. Conf. Ser. 2010, 240, 012044. [Google Scholar] [CrossRef]
  45. Tridello, A. VHCF Response of Two AISI H13 Steels: Effect of Manufacturing Process and Size-Effect. Metals 2019, 9, 133. [Google Scholar] [CrossRef] [Green Version]
  46. McDiarmid, D.L. A new analysis of fatigue under combined bending and twisting. Aeronaut. J. 2016, 78, 325–329. [Google Scholar]
  47. Kurath, P. Multiaxial fatigue criteria for spot welds. Prog. Technol. 1997, 67, 143–154. [Google Scholar]
  48. Manfredi, E.; Cumbo, F.; Hippoliti, R. Computer Assisted Fatigue Life Prediction of Spot Welded Frames. In Proceedings of the 10th International Conference on Machine Design and Production, Cappadocia, Turkey, 4–6 September 2002. [Google Scholar]
  49. Quaak, G. Biaxial Testing of Sheet Metal: An Experimental-Numerical Analysis. Master’s Thesis, Eindhoven University of Technology, Eindhoven, The Netherlands, 2008. [Google Scholar]
  50. Brieu, M.; Diani, J.; Bhatnagar, N. A New Biaxial Tension Test Fixture for Uniaxial Testing Machine—A Validation for Hyperelastic Behavior of Rubber-like Materials. J. Test. Eval. 2007, 35, 364–372. [Google Scholar]
  51. Bold, P.E. Multiaxial Fatigue Crack Growth in Rail Steel. Ph.D. Thesis, University of Sheffield, Sheffield, UK, 1990. [Google Scholar]
  52. Hua, G.; Alagok, N.; Brown, M.W.; Miller, K.J. Growth of Fatigue Cracks Under Combined Mode I and Mode II Loads. In Multiaxial Fatigue; Miller, K.J., Brown, M.W., Eds.; ASTM International: West Conshohocken, PA, USA, 1985; pp. 184–202. [Google Scholar]
  53. Tomlinson, R.A.; Marsavina, L. Thermoelastic investigations for fatigue life assessment. Exp. Mech. 2004, 44, 487–494. [Google Scholar] [CrossRef]
  54. Pereira, A.B.; Fernandes, F.A.; Morais, A.B.; Carvalhoso, P. Development of a Delamination Fatigue Testing Machine for Composite Materials. Machines 2019, 7, 27. [Google Scholar] [CrossRef] [Green Version]
  55. Baptista, R.; Claudio, R.A.; Reis, L.; Madeira, J.F.A.; Guelho, I.; Freitas, M. Optimization of cruciform specimens for biaxial fatigue loading with direct multi search. Theor. Appl. Fract. Mech. 2015, 80, 65–72. [Google Scholar] [CrossRef]
  56. Baptista, R.; Cláudio, R.A.; Reis, L.; Madeira, J.F.A.; Freitas, M. Numerical study of in-plane biaxial fatigue crack growth with different phase shift angle loadings on optimal specimen geometries. Theor. Appl. Fract. Mech. 2016, 85, 16–25. [Google Scholar] [CrossRef]
  57. Iadicola, M.A.; Creuziger, A.A.; Foecke, T. Advanced Biaxial Cruciform Testing at the NIST Center for Automotive Lightweighting. In Residual Stress, Thermomechanics & Infrared Imaging, Hybrid Techniques and Inverse Problems; Springer International Publishing: Cham, Switzerland, 2014; Volume 8. [Google Scholar]
  58. Hannon, A.; Tiernan, P. A review of planar biaxial tensile test systems for sheet metal. J. Mater. Process. Technol. 2008, 198, 1–13. [Google Scholar] [CrossRef]
  59. Welsh, J.S.; Adams, D.F. Development of an electromechanical triaxial test facility for composite materials. Exp. Mech. 2000, 40, 312–320. [Google Scholar] [CrossRef]
  60. Soden, P.D.; Hinton, M.J.; Kaddour, A.S. Chapter 2.2—Biaxial test results for strength and deformation of a range of E-glass and carbon fibre reinforced composite laminates: Failure exercise benchmark data. In Failure Criteria in Fibre-Reinforced-Polymer Composites; Hinton, M.J., Kaddour, A.S., Soden, P.D., Eds.; Elsevier: Oxford, UK, 2004; pp. 52–96. [Google Scholar]
  61. Escárpita, D.A.A.; Cárdenas, D.; Elizalde, H.; Ramirez, R.; Probst, O. Biaxial tensile strength characterization of textile composite materials. In Composites and Their Properties; IntechOpen: Rijeka, Croatia, 2012; pp. 83–106. [Google Scholar]
  62. Smits, A.; Van Hemelrijck, D.; Philippidis, T.P.; Cardon, A. Design of a cruciform specimen for biaxial testing of fibre reinforced composite laminates. Compos. Sci. Technol. 2006, 66, 964–975. [Google Scholar] [CrossRef]
  63. Makris, A.; Ramault, C.; Van Hemelrijck, D.; Clarke, A.; Williamson, C.; Gower, M.; Shaw, R.; Mera, R.; Lamkanfi, E.; Van Paepegem, W. A review of biaxial test methods for composites. In Experimental Analysis of Nano and Engineering Materials and Structures; Gdoutos, E.E., Ed.; Springer: Dordrecht, The Netherlands, 2007; pp. 933–940. [Google Scholar]
  64. Swanson, S.R.; Christoforou, A.P.; Colvin, G.E. Biaxial testing of fiber composites using tubular specimens. Exp. Mech. 1988, 28, 238–243. [Google Scholar] [CrossRef]
  65. Francis, P.H.; Walrath, D.E.; Sims, D.F.; Weed, D.N. Biaxial Fatigue Loading of Notched Composites. J. Compos. Mater. 1977, 11, 488–501. [Google Scholar] [CrossRef]
  66. Razmjoo, G.R.; Tubby, P.J. Fatigue of Welded Joints Under Complex Loading. In European Structural Integrity Society; Marquis, G., Solin, J., Eds.; Elsevier: Edinburgh, UK, 1997; Volume 22, pp. 153–164. [Google Scholar]
  67. Madhavan, R. On the Collapse of Long Thick-Walled Circular Tubes under Biaxial Loading. Ph.D. Thesis, California Institute of Technology, Pasadena, CA, USA, 1988. [Google Scholar]
  68. Quaresimin, M.; Carraro, P.A. On the investigation of the biaxial fatigue behaviour of unidirectional composites. Compos. Part B Eng. 2013, 54, 200–208. [Google Scholar] [CrossRef]
  69. Makris, A.; Vandenbergh, T.; Ramault, C.; Van Hemelrijck, D.; Lamkanfi, E.; Van Paepegem, W. Shape optimisation of a biaxially loaded cruciform specimen. Polym. Test. 2010, 29, 216–223. [Google Scholar] [CrossRef]
  70. Guelho, I.; Reis, L.; Freitas, M.; Li, B.; Madeira, J.; Cláudio, R. Optimization of cruciform specimen for low capacity biaxial testing machine. In Proceedings of the 10th International Conference on Multiaxial Fatigue (ICMFF10), Kyoto, Japan, 3–6 June 2013. [Google Scholar]
  71. Hopperstad, O.S.; Langseth, M.; Remseth, S. Cyclic stress-strain behaviour of alloy AA6060 T4, part II: Biaxial experiments and modelling. Int. J. Plast. 1995, 11, 741–762. [Google Scholar] [CrossRef]
  72. Ghiotti, A.; Bruschi, S.; Bariani, P.F. Determination of yield locus of sheet metal at elevated temperatures: A novel concept for experimental set-up. Key Eng. Mater. 2007, 344, 97–104. [Google Scholar] [CrossRef]
  73. Lebedev, A.A.; Muzyka, N.R. Design of cruciform specimens for fracture toughness tests in biaxial tension (Review). Strength Mater. 1998, 30, 243–254. [Google Scholar] [CrossRef]
  74. Mönch, E.; Galster, D. A method for producing a defined uniform biaxial tensile stress field. Br. J. Appl. Phys. 1963, 14, 810–812. [Google Scholar] [CrossRef]
  75. Terry, G. The biaxial tensile strain field from a conventional load-splitting tree. Strain 1977, 13, 110–112. [Google Scholar] [CrossRef]
  76. Vieira, M.; Reis, L.; de Freitas, M.; Ribeiro, A. Preliminary evaluation of the loading characteristics of biaxial tests at low and very high frequencies. Procedia Struct. Integr. 2016, 1, 205–211. [Google Scholar] [CrossRef] [Green Version]
  77. Abu-Farha, F.; Hector, L.G.; Khraisheh, M. Cruciform-shaped specimens for elevated temperature biaxial testing of lightweight materials. JOM 2009, 61, 48–56. [Google Scholar] [CrossRef]
  78. Cláudio, R.A.; Reis, L.; Freitas, M. Biaxial high-cycle fatigue life assessment of ductile aluminium cruciform specimens. Theor. Appl. Fract. Mech. 2014, 73, 82–90. [Google Scholar] [CrossRef]
  79. Cláudio, R.; Freitas, M.; Reis, L.; Li, B.; Guelho, I. Multiaxial Fatigue Behaviour of 1050 H14 Aluminium Alloy by a Biaxial Cruciform Specimen Testing Method. In Proceedings of the 10th International Conference on Multiaxial Fatigue & Fracture (ICMFF10), Kyoto, Japan, 3–6 June 2013. [Google Scholar]
  80. Lyadova, K.A.; Shadrin, V.V.; Kovtanyuk, L.V.; Ustinova, A.S. Shape optimization of a biaxially loaded specimen. In Proceedings of the XLI International Summer School Conference on “Advanced Problems in Mechanics”, St. Petersburg, Russia, 2–6 July 2013. [Google Scholar]
  81. Kuwabara, T.; Ikeda, S.; Kuroda, K. Measurement and analysis of differential work hardening in cold-rolled steel sheet under biaxial tension. J. Mater. Process. Technol. 1998, 80–81, 517–523. [Google Scholar] [CrossRef]
  82. Smith, E.W.; Pascoe, K.J. Fatigue Crack Initiation and Growth in a High-Strength Ductile Steel Subject to In-Plane Biaxial Loading. In Multiaxial Fatigue; Miller, K.J., Brown, M.W., Eds.; ASTM International: West Conshohocken, PA, USA, 1985; pp. 111–134. [Google Scholar]
  83. Corbin, C. The Design of Cruciform Test Specimens for Planar Biaxial Testing of Fabrics for Inflatable Aerodynamic Decelerators. Earth Space 2012, 2012, 763–772. [Google Scholar]
  84. Sawert, W. Verhalten der Baustähle bei wechselnder mehrachsiger Beanspruchung. Z. Ver. Deut. Ing. 1943, 87, 39–40. [Google Scholar]
  85. Lebedev, A.; Mouzuika, N. Ukrainian Patent. SU 769 399 A1, 7 October 1980. [Google Scholar]
  86. Clay, S.B. Biaxial Testing Apparatus. U.S. Patent 5,905,205, 18 May 1999. [Google Scholar]
  87. Bellett, D.; Morel, F.; Morel, A.; Lebrun, J.-L. A Biaxial Fatigue Specimen for Uniaxial Loading. Strain 2011, 47, 227–240. [Google Scholar] [CrossRef] [Green Version]
  88. Mura, T. Micromechanics of Defects in Solids; Springer Science & Business Media: Dordrecht, The Netherlands, 2013. [Google Scholar]
  89. Soares, H.; Costa, P.; Freitas, M.; Reis, L. Fatigue life assessment of a railway wheel material under HCF and VHCF conditions. MATEC Web. Conf. 2018, 165, 09003. [Google Scholar] [CrossRef] [Green Version]
  90. Soares, H.; Costa, P.; Vieira, M.; Freitas, M.; Reis, L. Characterization and Evaluation of a Railway Wheel Steel in the HCF and VHCF Regimes. In Proceedings of the 17th International Conference on New Trends in Fatigue and Fracture (NT2F19), Cancun, Mexico, 25–27 October 2017; Springer: Cancun, Mexico, 2017. [Google Scholar]
  91. Costa, P.R.; Soares, H.; Reis, L.; Freitas, M. Ultrasonic fatigue testing under multiaxial loading on a railway steel. Int. J. Fatigue 2020, 136, 105581. [Google Scholar] [CrossRef]
  92. Montalvão, D.; Ribeiro, A.M.R.; Duarte-Silva, J.A.B. Experimental Assessment of a Modal-Based Multi-Parameter Method for Locating Damage in Composite Laminates. Exp. Mech. 2011, 51, 1473–1488. [Google Scholar] [CrossRef] [Green Version]
  93. Montalvão, D.; Karanatsis, D.; Ribeiro, A.M.; Arina, J.; Baxter, R. An experimental study on the evolution of modal damping with damage in carbon fiber laminates. J. Compos. Mater. 2015, 49, 2403–2413. [Google Scholar] [CrossRef] [Green Version]
  94. Mitsheal, A.; Daerefa-a Diogo, M.; Opukuro, D.-W.; George, H. A Review of Structural Health Monitoring Techniques as Applied to Composite Structures. Struct. Durab. Health Monit. 2017, 11, 91–147. [Google Scholar]
  95. Montalvão, D.; Silva, J.M.M. An alternative method to the identification of the modal damping factor based on the dissipated energy. Mech. Syst. Signal Process. 2015, 54–55, 108–123. [Google Scholar]
  96. Maia, N.M.M.; Ribeiro, A.M.R.; Fontul, M.; Montalvão, D.; Sampaio, R.P.C. Using the Detection and Relative Damage Quantification Indicator (DRQ) with Transmissibility. Key Eng. Mater. 2007, 347, 455–460. [Google Scholar] [CrossRef]
  97. Montalvão, D.; Freitas, M.; Reis, L.; Fonte, M. Design of Cruciform Test Specimens with different Biaxiality ratios for VHCF Fatigue. In Proceedings of the 8th International Conference on Engineering Failure Analysis (ICEFA VIII), Budapest, Hungary, 8–11 July 2018. [Google Scholar]
  98. Nwawe, R.; Grasso, M.; Chen, Y.; Klusak, J.; Rosiello, V. Optimisation of a gigacycle biaxial fatigue specimen for ultrasonic testing. In Proceedings of the Engineering and Computer Science Research Conference, Hatfield, UK, 17 April 2019. [Google Scholar]
  99. Bach, J.; Göken, M.; Höppel, H.-W. Fatigue of low alloyed carbon steels in the HCF/VHCF-regimes. In Fatigue of Materials at Very High Numbers of Loading Cycles: Experimental Techniques, Mechanisms, Modeling and Fatigue Life Assessment; Christ, H.-J., Ed.; Springer Fachmedien Wiesbaden: Wiesbaden, Germany, 2018; pp. 1–23. [Google Scholar]
  100. Grigorescu, A.; Hilgendorff, P.M.; Zimmermann, M.; Fritzen, C.-P.; Christ, H.-J. Fatigue behaviour of austenitic stainless steels in the VHCF regime. In Fatigue of Materials at Very High Numbers of Loading Cycles: Experimental Techniques, Mechanisms, Modeling and Fatigue Life Assessmenet; Christ, H.-J., Ed.; Springer Fachmedien Wiesbaden: Wiesbaden, Germany, 2018; pp. 49–71. [Google Scholar]
  101. Hilgendorff, P.M.; Grigorescu, A.C.; Zimmermann, M.; Fritzen, C.-P.; Christ, H.-J. Simulation of the VHCF deformation of austenitic stainless steels and its effect on the resonant behaviour. In Fatigue of Materials at Very High Numbers of Loading Cycles: Experimental Techniques, Mechanisms, Modeling and Fatigue Life Assessment; Christ, H.-J., Ed.; Springer Fachmedien Wiesbaden: Wiesbaden, Germany, 2018; pp. 73–94. [Google Scholar]
  102. Dönges, B.; Fritzen, C.-P.; Christ, H.-J. Fatigue mechanism and its modeling of an austenitic-ferritic duplex stainless steel under HCF and VHCF loading conditions. In Fatigue of Materials at Very High Numbers of Loading Cycles: Experimental Techniques, Mechanisms, Modeling and Fatigue Life Assessment; Christ, H.-J., Ed.; Springer Fachmedien Wiesbaden: Wiesbaden, Germany, 2018; pp. 111–131. [Google Scholar]
  103. Tsutsumi, N.; Murakami, Y.; Doquet, V. Effect of test frequency on fatigue strength of low carbon steel. Fatigue Fract. Eng. Mater. Struct. 2009, 32, 473–483. [Google Scholar] [CrossRef]
  104. Nonaka, I.; Setowaki, S.; Ichikawa, Y. Effect of load frequency on high cycle fatigue strength of bullet train axle steel. Int. J. Fatigue 2014, 60, 43–47. [Google Scholar] [CrossRef]
  105. Guennec, B.; Ueno, A.; Sakai, T.; Takanashi, M.; Itabashi, Y.; Ota, M. Dislocation-based interpretation on the effect of the loading frequency on the fatigue properties of JIS S15C low carbon steel. Int. J. Fatigue 2015, 70, 328–341. [Google Scholar] [CrossRef]
  106. Soares, H. Avaliação e Caracterização em Fadiga Multiaxial do Aço de uma Roda Ferroviária de Aplicabilidade ao Transporte de Passageiros. Ph.D. Thesis, Instituto Superior Técnico, University of Lisbon, Lisboa, Portugal, 2019. (In Portuguese). [Google Scholar]
Figure 1. Fatigue testing in (a) a servo-hydraulic ‘conventional’ machine; and (b) an UFT machine. Both photos taken at Instituto Superior Técnico, University of Lisbon. Please note that in the UFT machine the specimen’s attachment is achieved through a single end only (the other end is free).
Machines 08 00025 g001
Figure 2. UFT machine resonant system components of one of the machines at Instituto Superior Técnico, University of Lisbon.
Machines 08 00025 g002
Figure 3. (a) Normalised distribution of displacement and stress along the normalised length of a uniaxial UFT specimen [10]; (b) Modal analysis simulation results (displacement) for the first axial (tension) mode at 20 kHz of the resonant system components [10].
Machines 08 00025 g003
Figure 4. Schematic representation of the typical systems found in a UFT machine [10].
Machines 08 00025 g004
Figure 5. Engineering drawing of a 2014-T6 Aluminium hourglass uniaxial UFT (20 kHz) specimen.
Machines 08 00025 g005
Figure 6. Schematic representation of biaxial stress states (based in [2]).
Machines 08 00025 g006
Figure 7. (a) Solid cylindrical toroidal specimen [2]; (b) tubular cylindrical specimen [2].
Machines 08 00025 g007
Figure 8. Photoelastic fringe pattern image of a biaxially loaded flat square specimen with edge holes and loaded by vertical forces with disturbance from compression zones on show [74].
Machines 08 00025 g008
Figure 9. In-plane biaxial fatigue testing machine powered by linear iron core motors [79].
Machines 08 00025 g009
Figure 10. Typical biaxial cruciform specimens with: (a) slits [81]; (b) elliptical notched corners [70]; (c) circular-notched corners and reduced thickness at the centre [70].
Machines 08 00025 g010
Figure 11. Rhomboidal recessed area specimen: (a) overall geometry; (b) FEA with strain field at the centre [61].
Machines 08 00025 g011
Figure 12. Cruciform specimen studied by Claudio et al. [2,78].
Machines 08 00025 g012
Figure 13. The ‘Twin-Teardrop’ specimen [87].
Machines 08 00025 g013
Figure 14. Horn and specimen for tension/torsion biaxial testing [15].
Machines 08 00025 g014
Figure 15. Tension/torsion specimen for VHCF [2,15].
Machines 08 00025 g015
Figure 16. VHCF testing machine resonant system components with UFT biaxial specimen [25].
Machines 08 00025 g016
Figure 17. Cruciform test specimen axial (tension) mode shapes: (a) C-T (out-of-phase); (b) T-T (in-phase) (deformation was exaggerated for better understanding) [25].
Machines 08 00025 g017
Figure 18. Comparison between the resulting UFT cruciform specimens from the (a) “scaling” and from the (b) change in arms’ dimensions methods. The original design is faded for comparison purposes. Both UFT designs deliver an in-phase (T-T) mode shape at 20 kHz [26].4.2.3. Tuning for Non-Unitary Biaxiality Ratios
Machines 08 00025 g018
Figure 19. Result from the “change in arms’ dimensions” method to obtain an out-of-phase C-T specimen with a non-unitary biaxiality ratio at 20 kHz [26].
Machines 08 00025 g019
Figure 20. Preliminary designs of UFT twin-teardrop specimens (spherical and cylindrical) [98].
Machines 08 00025 g020
Figure 21. (a) Prepared samples for microstructural analysis; (b) Optical zoom at the web (500×); (c) SEM at the web (10,000×); (d) Optical zoom at the rim (500×); (e) SEM at the web (10,000×).
Machines 08 00025 g021
Figure 22. Specimen failed by tension/torsion fatigue at VHCF.
Machines 08 00025 g022
Figure 23. UFT tension/torsion stress life results.
Machines 08 00025 g023
Figure 24. Uniaxial specimen after ultrasonic testing: (a) optical microscope general view; (b) SEM general view; (c) fatigue propagation near initiation (500×); (d) fatigue propagation near initiation (1000×). Uniaxial specimen after conventional testing: (e) optical microscope general view; (f) SEM general view; (g) fatigue propagation near initiation (500×); (h) fatigue propagation near initiation (1000×).
Machines 08 00025 g024
Figure 25. Multiaxial specimen after ultrasonic testing: (a) optical microscope general view; (b) SEM general view; (c) point of fatigue crack initiation (500×); (d) point of fatigue crack initiation (1000×). Multiaxial specimen after conventional testing: (e) optical microscope general view; (f) SEM general view; (g) fatigue propagation near initiation (500×); (h) fatigue propagation near initiation (1000×).
Machines 08 00025 g025
Figure 26. Cruciform C-T specimen failed after tension/tension (out-of-phase) biaxial UFT at VHCF [24].
Machines 08 00025 g026
Figure 27. (a) Photo of one manufactured specimen; (b) deformation waveform at the end of C-T in the axial direction (out-of-phase); (c) deformation waveform at the end of T-T in the axial direction (in-phase).
Machines 08 00025 g027
Figure 28. FRFs at: axial direction on the vertical arm’s end (purple); axial direction on the horizontal arm’s end (yellow); transverse direction at the horizontal arm’s sides (blue and orange).
Machines 08 00025 g028
Figure 29. Assembly of specimen and horn in free-free vibration: (a) T-T mode shape; (b) Flapping mode shape [24].
Machines 08 00025 g029
Table 1. Comparison between the duration different fatigue testing methods need to be completed, assuming tests can run uninterruptedly (approximate values, rounded to the nearest 0.5).
Number of CyclesUltrasonic (20 kHz)Resonance (150 Hz)Rotating Bending (30 Hz)
1078.5min1days4days
1081.5h1weeks1.5months
1090.5days2.5months1years
10101weeks2years1decades

