Article

Virtual Testing of Counterbalance Forklift Trucks: Implementation and Experimental Validation of a Numerical Multibody Model †

by
Alberto Martini
1,*,
Giovanni Paolo Bonelli
2 and
Alessandro Rivola
1
1
DIN—Department of Industrial Engineering, University of Bologna, 40136 Bologna, Italy
2
L.T.E. Lift Truck Equipment SpA, 44020 Ferrara, Italy
*
Author to whom correspondence should be addressed.
This paper is an extended version of our paper published in: Ventura, L.; Bonelli, G.P.; Martini, A. Development and Experimental Validation of a Numerical Multibody Model for the Dynamic Analysis of a Counterbalance Forklift Truck. In Proceedings of the 5th Joint International Conference on Multibody System Dynamics—IMSD 2018, Lisbon, Portugal, 24–28 June 2018.
Machines 2020, 8(2), 26; https://doi.org/10.3390/machines8020026
Submission received: 10 April 2020 / Revised: 8 May 2020 / Accepted: 13 May 2020 / Published: 14 May 2020

Abstract

:
This study investigates the dynamic behavior of a recently developed counterbalance forklift truck. The final objective is creating virtual testing tools based on numerical multibody models to evaluate the dynamic stresses experienced by the forklift family of interest during a reference operating cycle, defined by the manufacturer’s testing protocols. This work aims at defining sufficiently accurate and easy-to-implement modelling approaches and validation procedures. It focuses on a specific test, namely the passage of a speed-bump-like obstacle at high velocity, which represents one of the most severe conditions within the reference cycle. Indeed, unlike most of the other wheeled vehicles, forklifts typically do not have advanced suspension systems and their dynamic response is significantly affected by ground irregularities. To this end, a preliminary model of the complete forklift, featuring rigid bodies and a simplified tire–ground contact model, is implemented with a commercial software. Experimental tests are conducted on the forklift to measure the vehicle vibrations when running on the obstacle, for model validation purposes. After model updating, the results provided by the numerical simulations match the experimental data satisfactorily. Hence, the modelling and validation strategies are proven viable and effective.

1. Introduction

Counterbalance forklift trucks represent an omnipresent and almost essential material handling equipment in industrial applications [1]. They are typically characterized by several distinctive design features, in comparison with most wheeled vehicles [2,3,4]. Firstly, they do not have dedicated suspension systems, e.g., elastic elements and/or shock absorbers connecting the wheel assemblies to the vehicle chassis. This is a design solution commonly adopted to enhance the forklift’s stability, since it allows limiting the static/dynamic deflection of the front/rear axles generated by load transfer during loading/unloading operations or acceleration/brake/cornering maneuvers. Hence, tires constitute the most deformable components. Solid rubber tires (which are typically stiffer than pneumatic ones) are adopted for most applications. Secondly, the vehicle is supported at three points, namely the left front wheel(s), the right front wheel(s) and the median point of the rear axle, commonly referred to as the triangle of stability. Indeed, the rear axle of four-wheeled forklifts, which also includes the steering system, can rotate freely around a longitudinal axis lying on the plane of symmetry of the vehicle. Finally, depending on the load and on the lift height, a huge variability of the vehicle mass, inertia and center of mass (COM) location can be experienced.
Because of the specifications mentioned above, ground roughness and irregularities, such as speed bumps and potholes, can significantly affect the dynamic response of forklifts. Indeed, they may induce severe vibrations, high transient dynamic loads on the vehicle chassis and other components, and vehicle instability, hence possibly causing durability and safety issues [5,6,7,8].
Numerous works have dealt with the analysis of the dynamic behavior of counterbalance forklift trucks, the majority of them being focused on safety aspects. On one hand, the vehicle stability for typical maneuvers was investigated, by using different approaches. In [9], controllability issues affecting the dynamics of forklifts characterized by a rear steering axle were assessed by means of an analytical model. Studies on vehicle stability during various cornering maneuvers on a smooth (i.e., without obstacles) horizontal ground through numerical simulations were reported in [10]; the models were validated with tests on forklift trucks equipped with special safety outriggers to prevent complete roll-over. Cornering stability and possible roll-over issues were studied also in [5], by means of a rigid multibody model with Pacjeka [11] tire formulation and experimental measurements on a forklift with outriggers. In [12], the dynamic stability of a forklift performing a breaking maneuver when descending a longitudinal slope was investigated through a simplified analytical model and experimental tests. Stability tests on tilting platform, carried out according to [13], were simulated through rigid multibody models in [14,15]. Indeed, the ISO Standard is mostly adopted in industry to verify the safety requirements, although it can be observed that the actual safety margins may be significantly reduced by the dynamic loads potentially experienced in emergency situations or other possible maneuvers not accounted for in the reference tests [16].
On the other hand, research has focused on the problem of vibrations possibly transmitted to forklift operators, since exposure to high vibration levels can be hazardous for human health [17]. Experimental tests to assess the vibrations transmitted to the seat and to the floor for a forklift running on both smooth concrete ground and paved track were conducted in [18]. In [19], a rigid multibody model with simplified tire formulation was developed and validated to investigate the seat accelerations on a forklift travelling over standardized obstacles at constant speed. The benefits provided by a prototypal semi-active cabin suspension system were assessed through measurements on a vehicle in case of ground unevenness and different maneuvers [20]. In [8], seat vibrations induced by ground roughness for rectilinear motion at constant speed were evaluated through rigid body simulations and experimental tests.
Only few studies, to the authors’ best knowledge, have aimed at implementing tools to assist the structural design process of forklift trucks [21,22]. Therein, the primary objective was evaluating the dynamic stresses affecting only the loaded mast assembly, during longitudinal motion and lifting maneuvers, by taking into account its compliance. The possibility of developing numerical models to reliably predict the dynamic loads acting also on the structural components constituting the entire vehicle (such as the chassis and the axles), even in case of severe testing conditions (e.g., passage on an obstacle), is apparently not documented in the literature. Hence, deeper investigations on this topic appear worthy of interest.
The present study aims at investigating the dynamic response of a heavy-duty forklift truck recently developed by Toyota Material Handling Manufacturing SpA (Bologna, Italy). The manufacturer’s final goal is implementing virtual testing tools based on numerical multibody models to assess the dynamic stresses experienced by the main structural components (particularly the chassis) of specific families of counterbalance forklift trucks when performing a standard working cycle defined by the reference testing protocols of the company. Such tools should meet two main requirements. Firstly, they should be sufficiently accurate and reliable to permit gradually reducing the need for experimental tests on physical prototypes, thus helping the development of new products since the early design stages. Secondly, such tools should be easy to implement by starting from the other numerical models already implemented by the manufacturer, e.g., Computer-Aided Design (CAD) and Finite Element (FE) models, hence being well-integrated in the design procedures of the company. Reasonably, after collecting a fairly limited database of validated models for a certain family of forklift trucks, tests on new prototypes belonging to same product family should almost not be required.
As a first stage of the research, the focus is on implementing and validating a numerical model with rigid bodies to simulate the dynamics of the forklift of interest when crossing a standardized obstacle, which is one of the most critical testing conditions in terms of dynamic loads. This work has two primary objectives. The first one is defining suitable measurement protocols, particularly in terms of sensor setup. The second objective is defining convenient (i.e., satisfactorily accurate and cost-effective) modelling and validation procedures; in particular, the suitability of a simplified tire model is assessed.
The manuscript has the following structure. Section 2 provides an overview of the studied vehicle. Section 3 reports the experimental tests. Section 4 describes the numerical model and its validation; the simulation results provided by the updated model are discussed as well. The final section draws the main conclusions of this study.

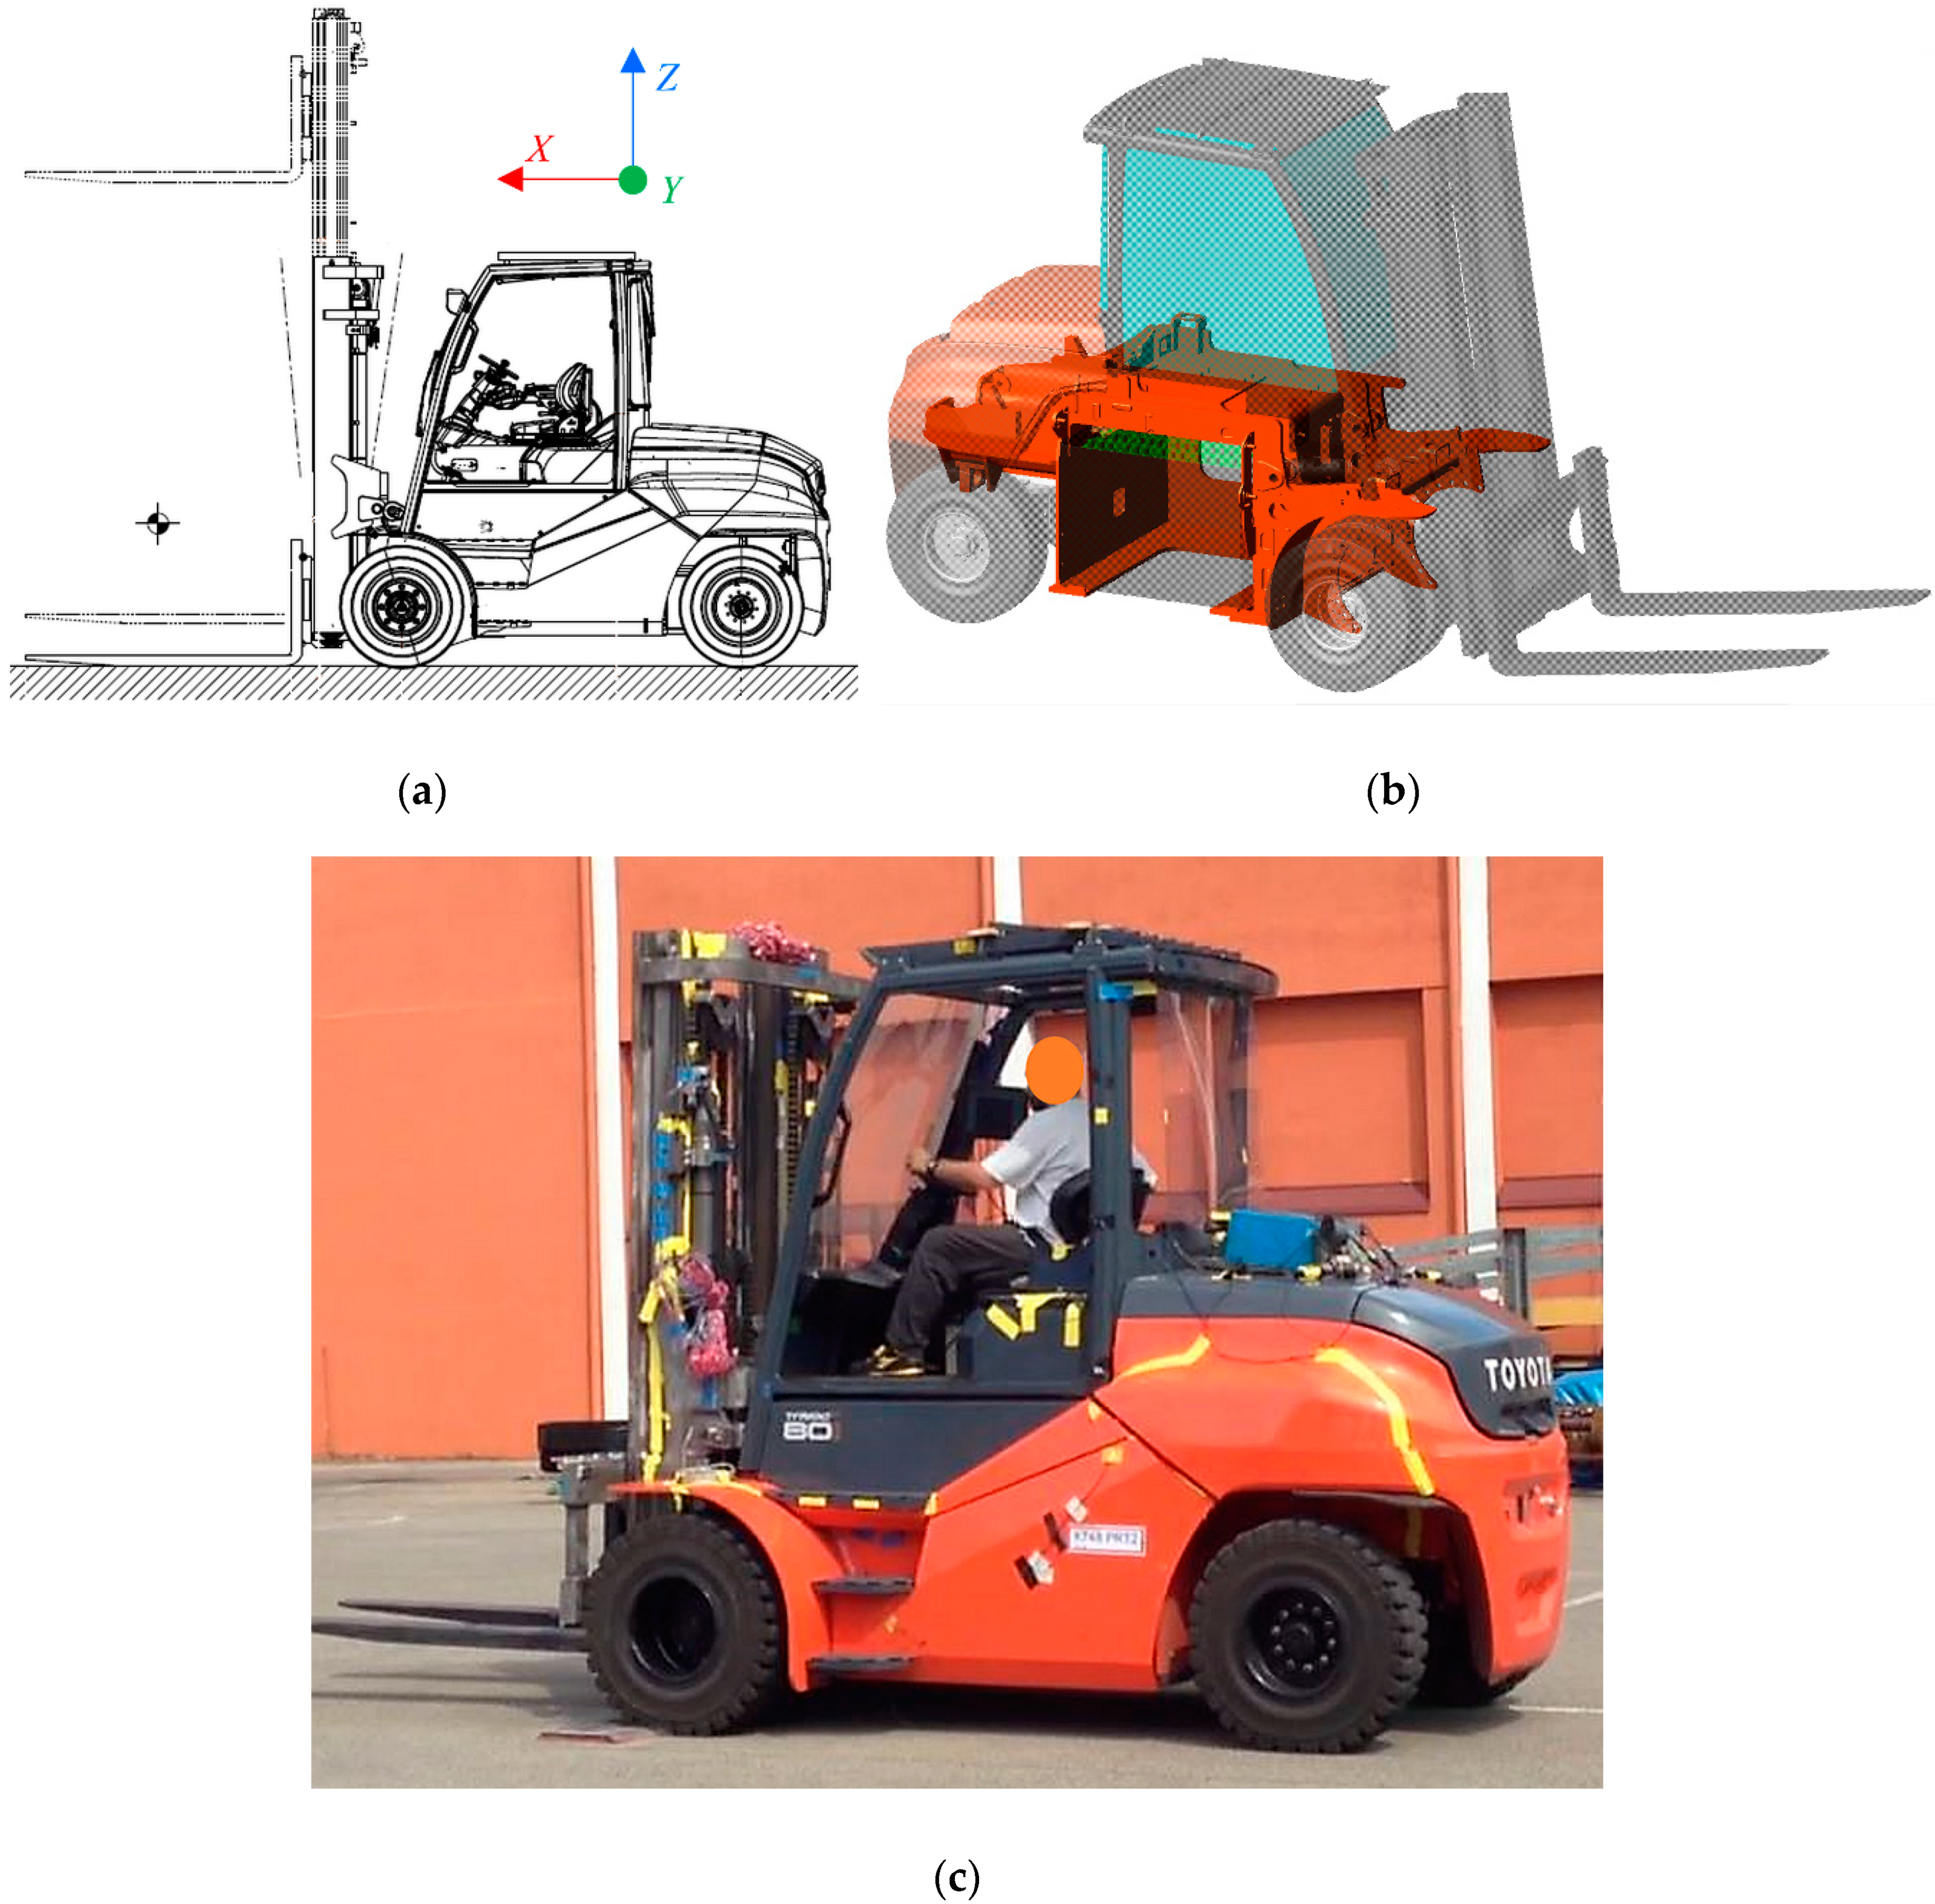
2. Specifications of the Analyzed Forklift Truck

The vehicle under investigation is a counterbalance forklift truck devised for indoor and/or outdoor heavy-duty operation, referred to as model Traigo 80 by the manufacturer (Figure 1). The main specifications of the studied configuration are reported in Table 1.
The front axle is equipped with dual wheels, namely, having on each side two tires sharing the same rim. Each front dual set is driven independently by an electric motor with planetary gearbox. The rear (swinging) axle features two wheels and a hydraulically actuated steering system; it also includes an additional active safety system for limiting the axle rotation under certain conditions that, however, was deactivated during tests. All six tires are super-elastic solid tires of size 300-15 (nominal dimensions: outer diameter, 823 mm; width, 252 mm). Further actuators with dedicated hydraulic circuit control the mast tilting and the lift height of the forks. The cabin is suspended by means of conical elastomeric bearings.
The chassis of the studied forklift truck is characterized by a highly asymmetric geometry (Figure 1b), which is specifically conceived to allow automated fast replacement of the large battery (whose mass constitutes about 15% of the total). Because of such geometry, a careful evaluation of the actual strains/stresses experienced by the chassis in working conditions is essential. This can be achieved through an accurate assessment of the dynamic loads acting on it.

3. Experimental Measurements

The experimental tests focused on a single maneuver performed with a specific loading condition, namely the unloaded forklift passing over a reference obstacle. This condition, which is included in standard test protocols, had been observed triggering severe vibrations of the system in preliminary tests.
Preliminary tests performed with different forklift configurations also showed that such maneuver can cause the fork carriage to rebound. This can excite local modes of the mast assembly, hence possibly hampering model validation, by introducing additional unpredictable perturbations not directly related to the global dynamic response of the vehicle. In order to prevent this potential issue, the mast and the fork carriage were constrained by belts in a fixed position during the experiments presented and described in the following sections. In particular, the mast was kept completely retracted and fully tilted backwards, and the forks close to their lowest position.

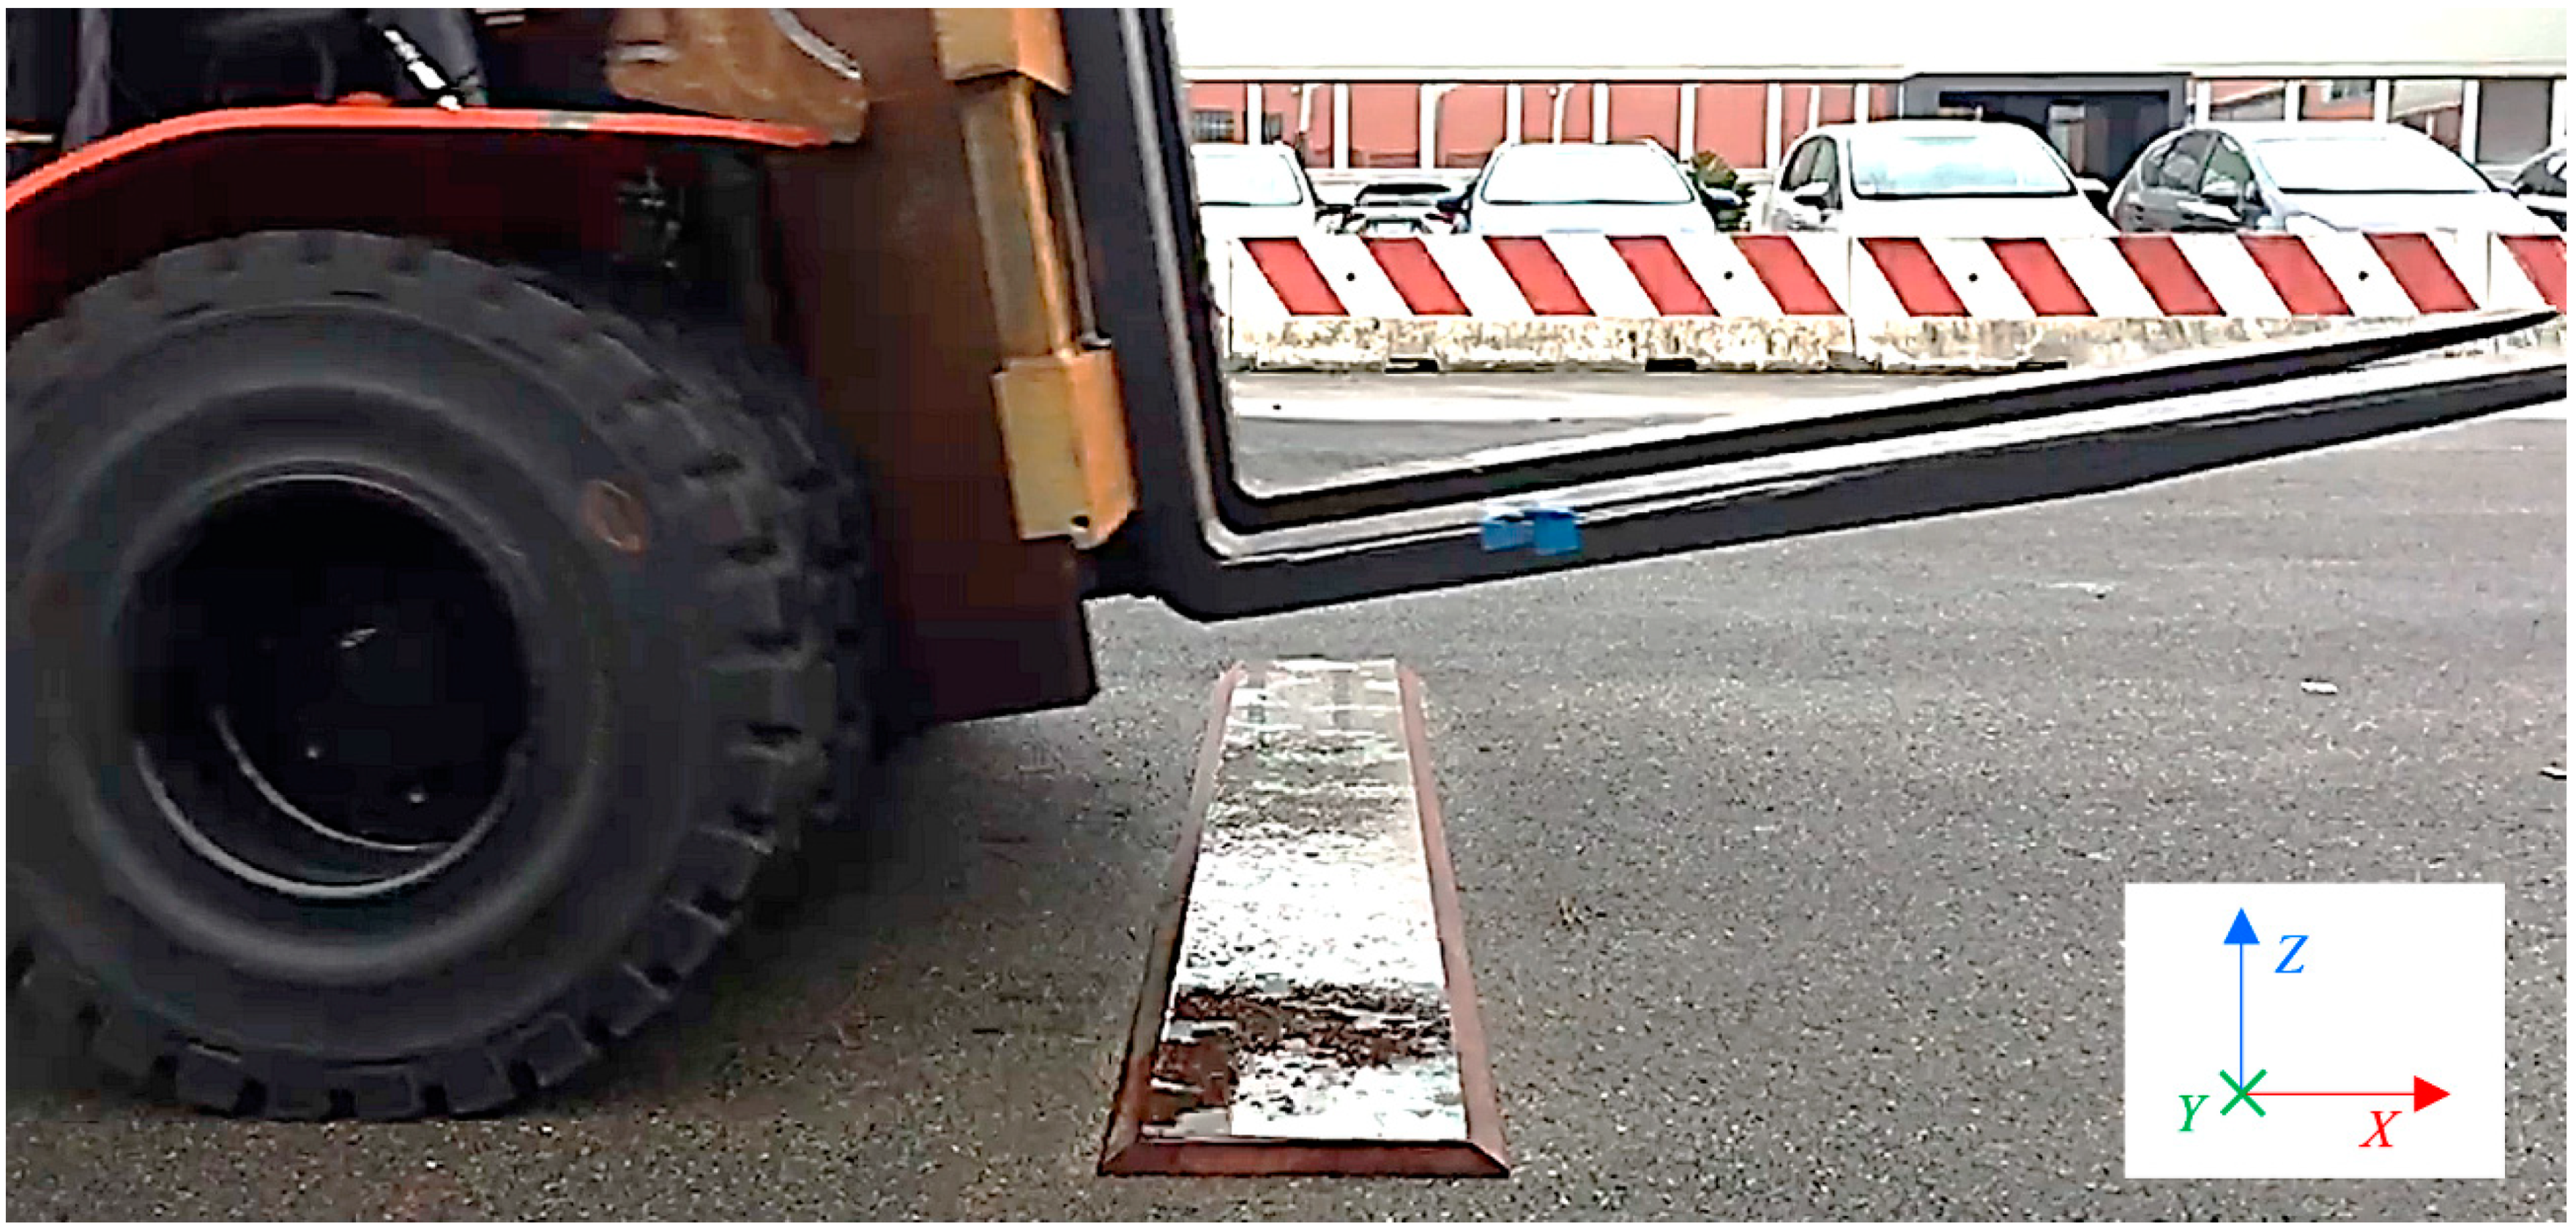
3.1. Sensor Setup and Test Protocols

The forklift was equipped with accelerometers to detect its vibrations. The sensor setup adopted for the tests reported hereafter consisted of six triaxial transducers, namely Dytran 7533A4 MEMS accelerometers with sensitivity 57 mV/g (Dytran Instruments Inc., Chatsworth, CA, USA), installed as shown in Figure 2. In particular, one accelerometer was mounted on/next to each wheel hub, i.e., Front Left (FL), Front Right (FR), Rear Left (RL) and Rear Right (RR) wheels; one transducer (referred to as CH in Figure 2a) was attached to the chassis, on the vehicle longitudinal centerline at about half the wheelbase; one sensor was connected to the cabin, under the operator’s seat (SE). It is worth noting that the signals collected from the front wheels were considered of primary importance for the sake of model validation. Indeed, because of the very high stiffness of the front axle that limits the contribution of local modes, such signals were expected to permit updating the tire–ground contact model.
A Micro-Measurements System 7000 frontend (Vishay Intertechnology Inc., Malvern, PA, USA) was adopted to perform the acquisitions with a sampling frequency of 2 kHz. A digital low-pass filter (cutoff frequency of 400 Hz) was applied to all the recorded channels.
The tests were conducted on an outdoor area characterized by null slope and asphalt concrete pavement. The unloaded forklift was driven with pure longitudinal motion (i.e., null steering angle) over a speed-bump-like obstacle at a constant speed of 11 km/h. The obstacle, namely a steel block with a trapezoidal cross-section (height 33 mm), was crossed orthogonally, i.e., with the front wheels climbing over it simultaneously (Figure 3). Fifteen runs were carried out in order to guarantee the repeatability of the measurements.

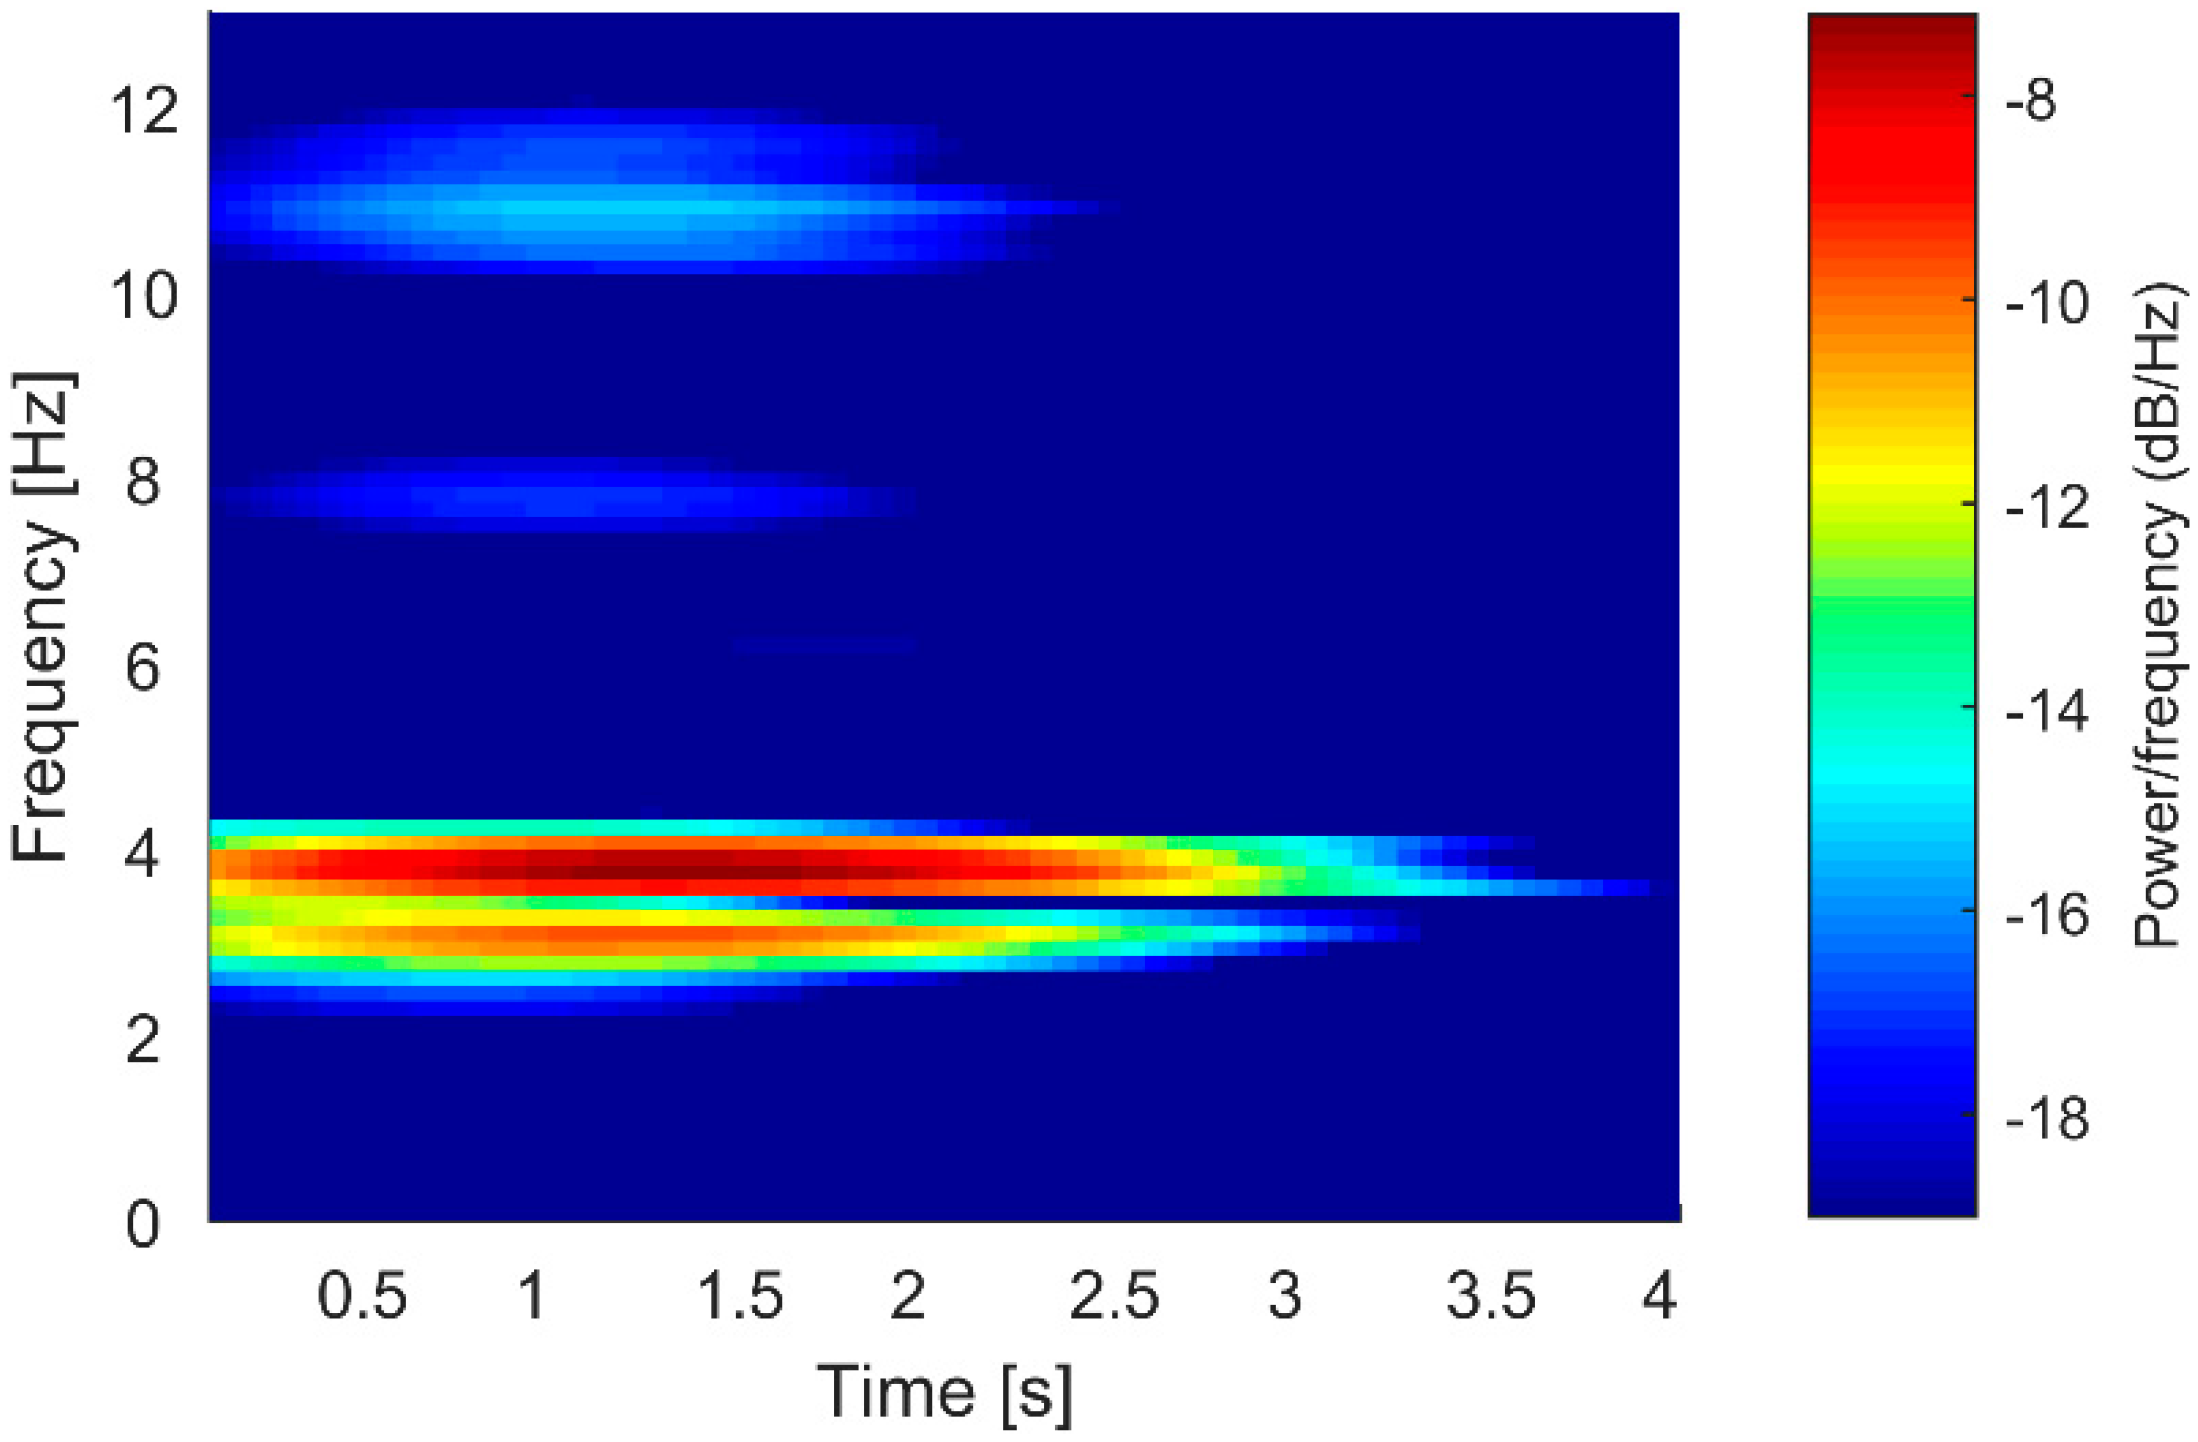
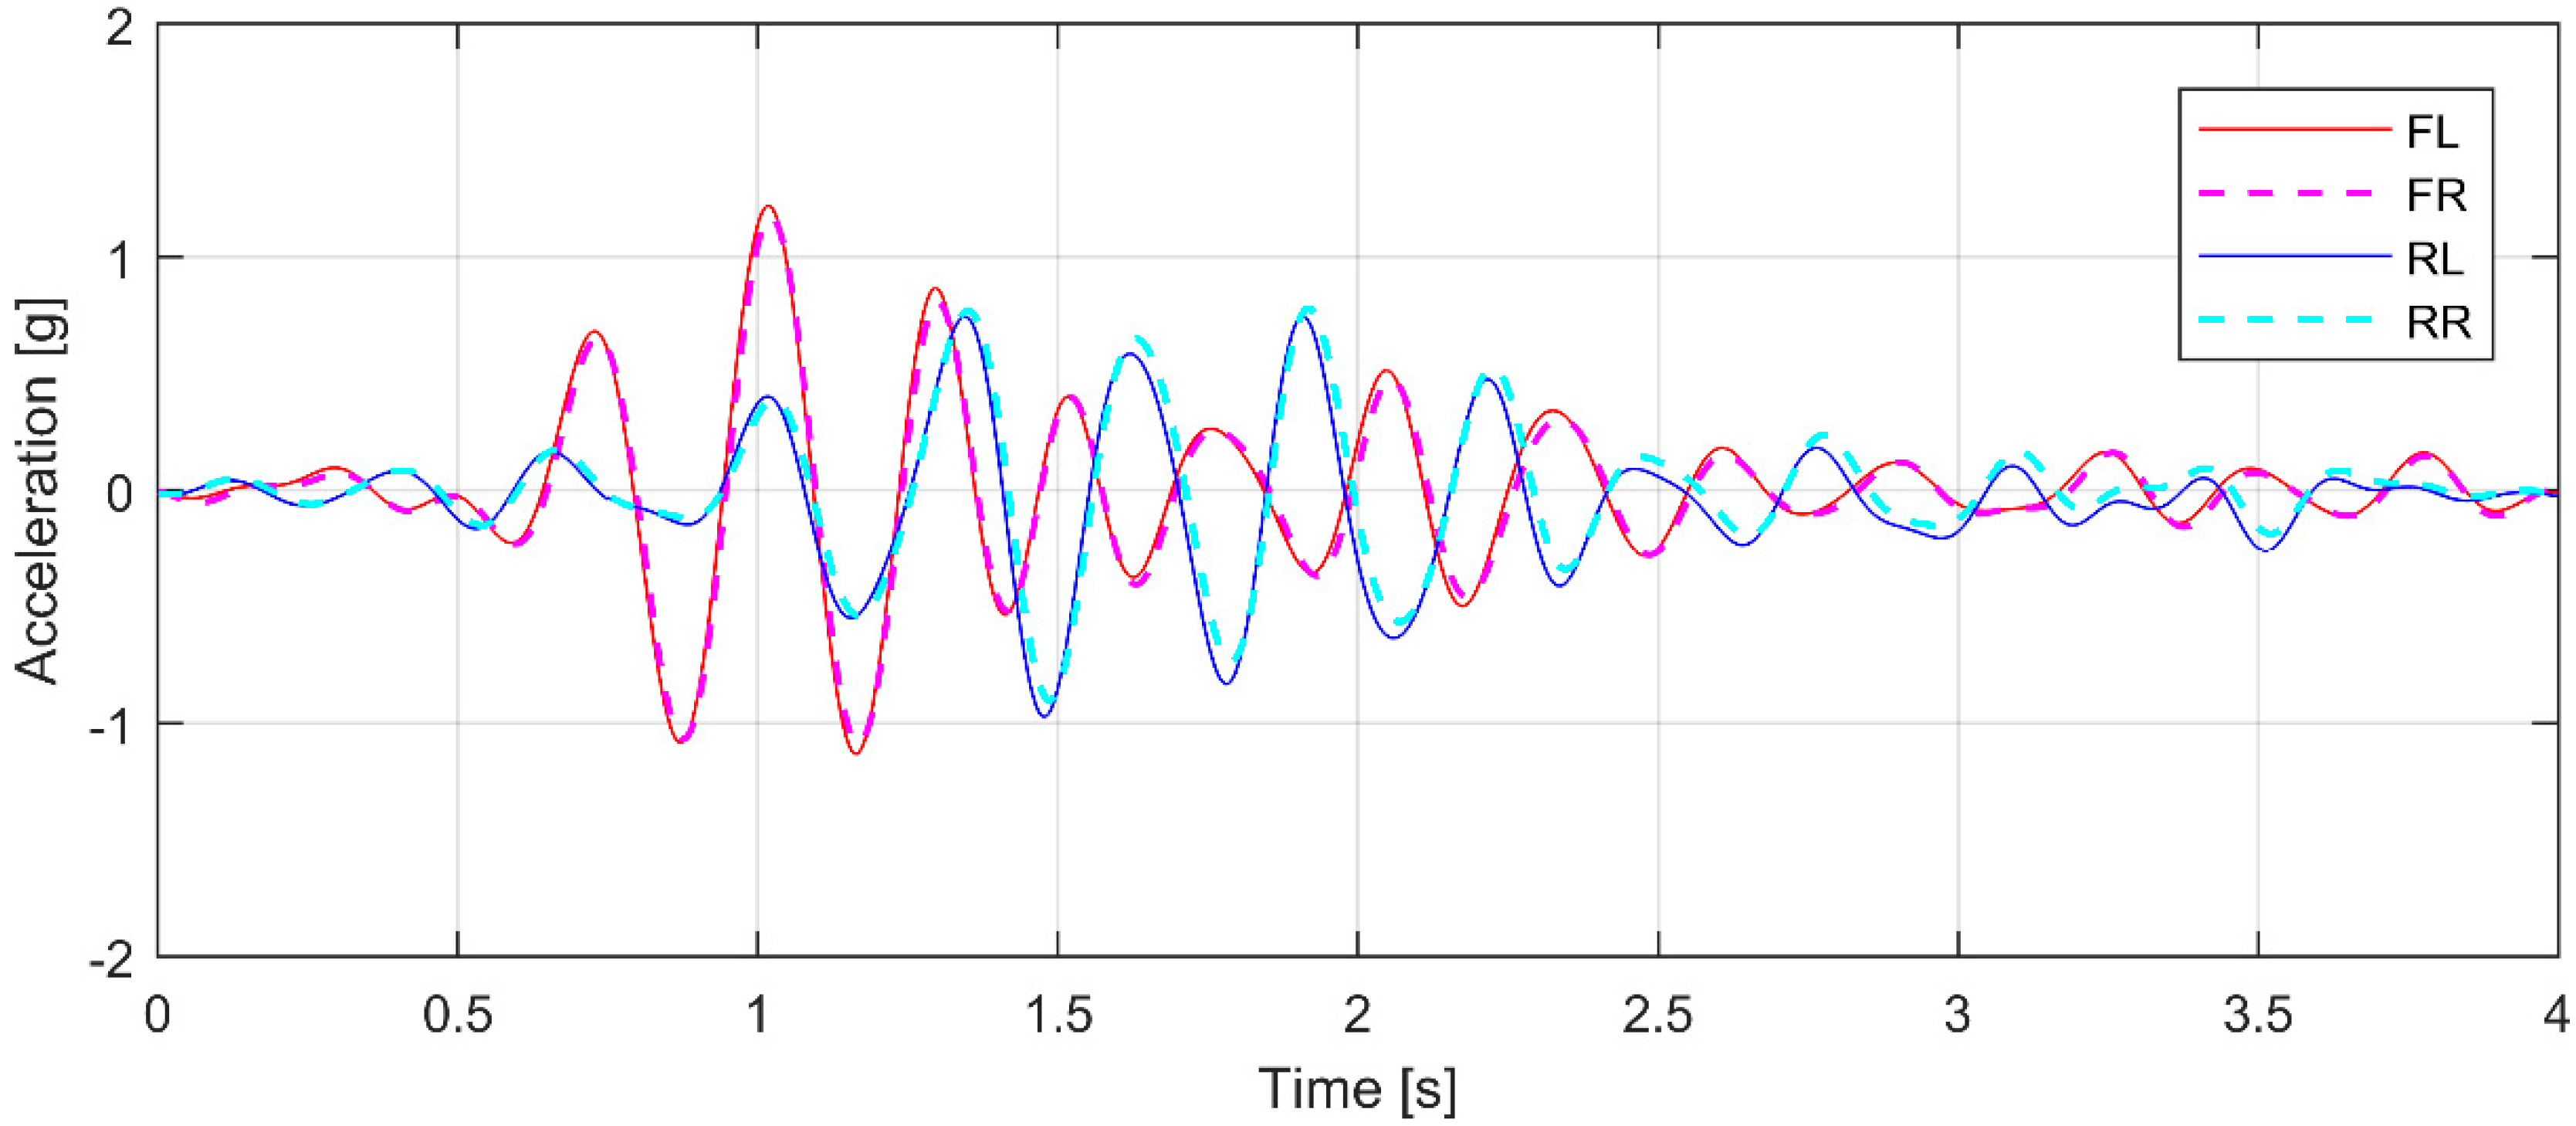
3.2. Experimental Results

A satisfactory repeatability could be achieved for all the measured signals, notwithstanding the potential variability intrinsically characterizing the test conditions (namely the fact that the forklift truck was manually driven by a human operator, hence its trajectory possibly being not perfectly orthogonal to the obstacle). A lower standard deviation is observed for the transducers located in the front wheel hubs. Reasonably, such behavior is determined by the greater compliance of the rear axle assembly; in particular, the presence of backlash in the joints of both the steering system and the additional swinging Degree of Freedom (DOF) may introduce nonlinearities, possibly increasing the variability of acceleration signals measured in the rear of the forklift.
The most consistent results are obtained for the vertical acceleration (i.e., along the z-axis) of the Front Left (FL) wheel hub. The corresponding measured signals are shown in Figure 4 (all the fifteen runs are plotted with black curves). The component related to the gravitational acceleration has been subtracted from the signals. The comparison confirms the low variability of the acquisitions. The reference vertical acceleration of the FL wheel hub (referred to as z ¨ a v F L , also reported in Figure 4 with a red line) is computed as an average of all the fifteen measured signals and adopted for subsequent model updating. Accordingly, the analysis is focused on signal z ¨ a v F L hereafter.
The z ¨ a v F L signal exhibits the following relevant features:
  • A high acceleration peak (namely, the maximum value of the signal, referred to as z ¨ a v F L { p k 1 } ) occurs when the front wheels jump over the obstacle and rebound on the ground (time 1.00 s).
  • Two lift-off phases are apparently present before and after the main rebound, respectively. Indeed, an almost constant acceleration of −1 g can be observed (except for minor oscillation at high frequency), reasonably indicating that the front axle is undergoing free fall (it is worth recalling that the gravitational component has been subtracted from the signals).
  • The rear wheels impact on the obstacle with a delay of about 0.75 s. This event generates a second remarkable peak at time 2.02 s (referred to as z ¨ a v F L { p k 2 } ).
  • Oscillations are present over the whole time history; the first collision with the obstacle causes their amplitude to increase sizably.
The z ¨ a v F L signal is firstly investigated in the frequency domain by computing the Power Spectral Density (PSD), for a preliminary assessment of its frequency content. Figure 5 shows the PSD over the monitored frequency range 0–400 Hz. Two significant spectral lines are identified, at about 3 and 3.8 Hz, respectively. They should represent the first two resonances of the vehicle, hence being reasonably associated with its bounce and pitch vibration modes (not necessarily in this relative order). Conversely, the roll vibration mode is not expected to be excited remarkably in the test, since the forklift undergoes in-plane motion and the impact forces on the tires act almost symmetrically with respect to the global COM of the vehicle; hence, its participation to the vehicle response should be negligible. No relevant frequency content is found above 12 Hz.
Since the z ¨ a v F L signal is nonstationary, time–frequency analysis is performed in order to gain better insights into its properties, by computing the Short-Time Fourier Transform (STFT). The corresponding spectrogram is reported in Figure 6, for the frequency range 0–13 Hz. The spectrogram confirms that the severe vibrations triggered by the impact with the obstacle are ascribable to two resonances, namely the two main frequency peaks observed in the PSD (Figure 5). The second vibration mode dampens after a longer time interval, thus representing the most relevant contribution to the oscillations observed in the time domain (Figure 4); hence, it is adopted for subsequent model updating.
In order to perform model updating correctly, it is essential to determine the mode shape corresponding to the second resonance. A rough assessment of the vibration modes can be achieved by band-pass filtering the signals in a narrow band around the resonances and by comparing their relative phases in the time domain [23]. In particular, a band-pass filter (zero-phase FIR filter, center frequency 3.5 Hz, bandwidth 2 Hz) is applied to the averaged vertical accelerations of the four wheel hubs. The comparison between the filtered signals is reported in Figure 7. The analysis shows that:
  • The accelerations of the front wheels are always in phase;
  • The accelerations of the rear wheels are always in phase as well;
  • After the first impact with the obstacle, the signals of the front and the rear wheels are in antiphase for a longer time interval.
Therefore, the second resonance, referred to as ωpE hereafter, can be related to the vehicle pitch mode with a satisfactory level of confidence.

4. Numerical Model and Simulations

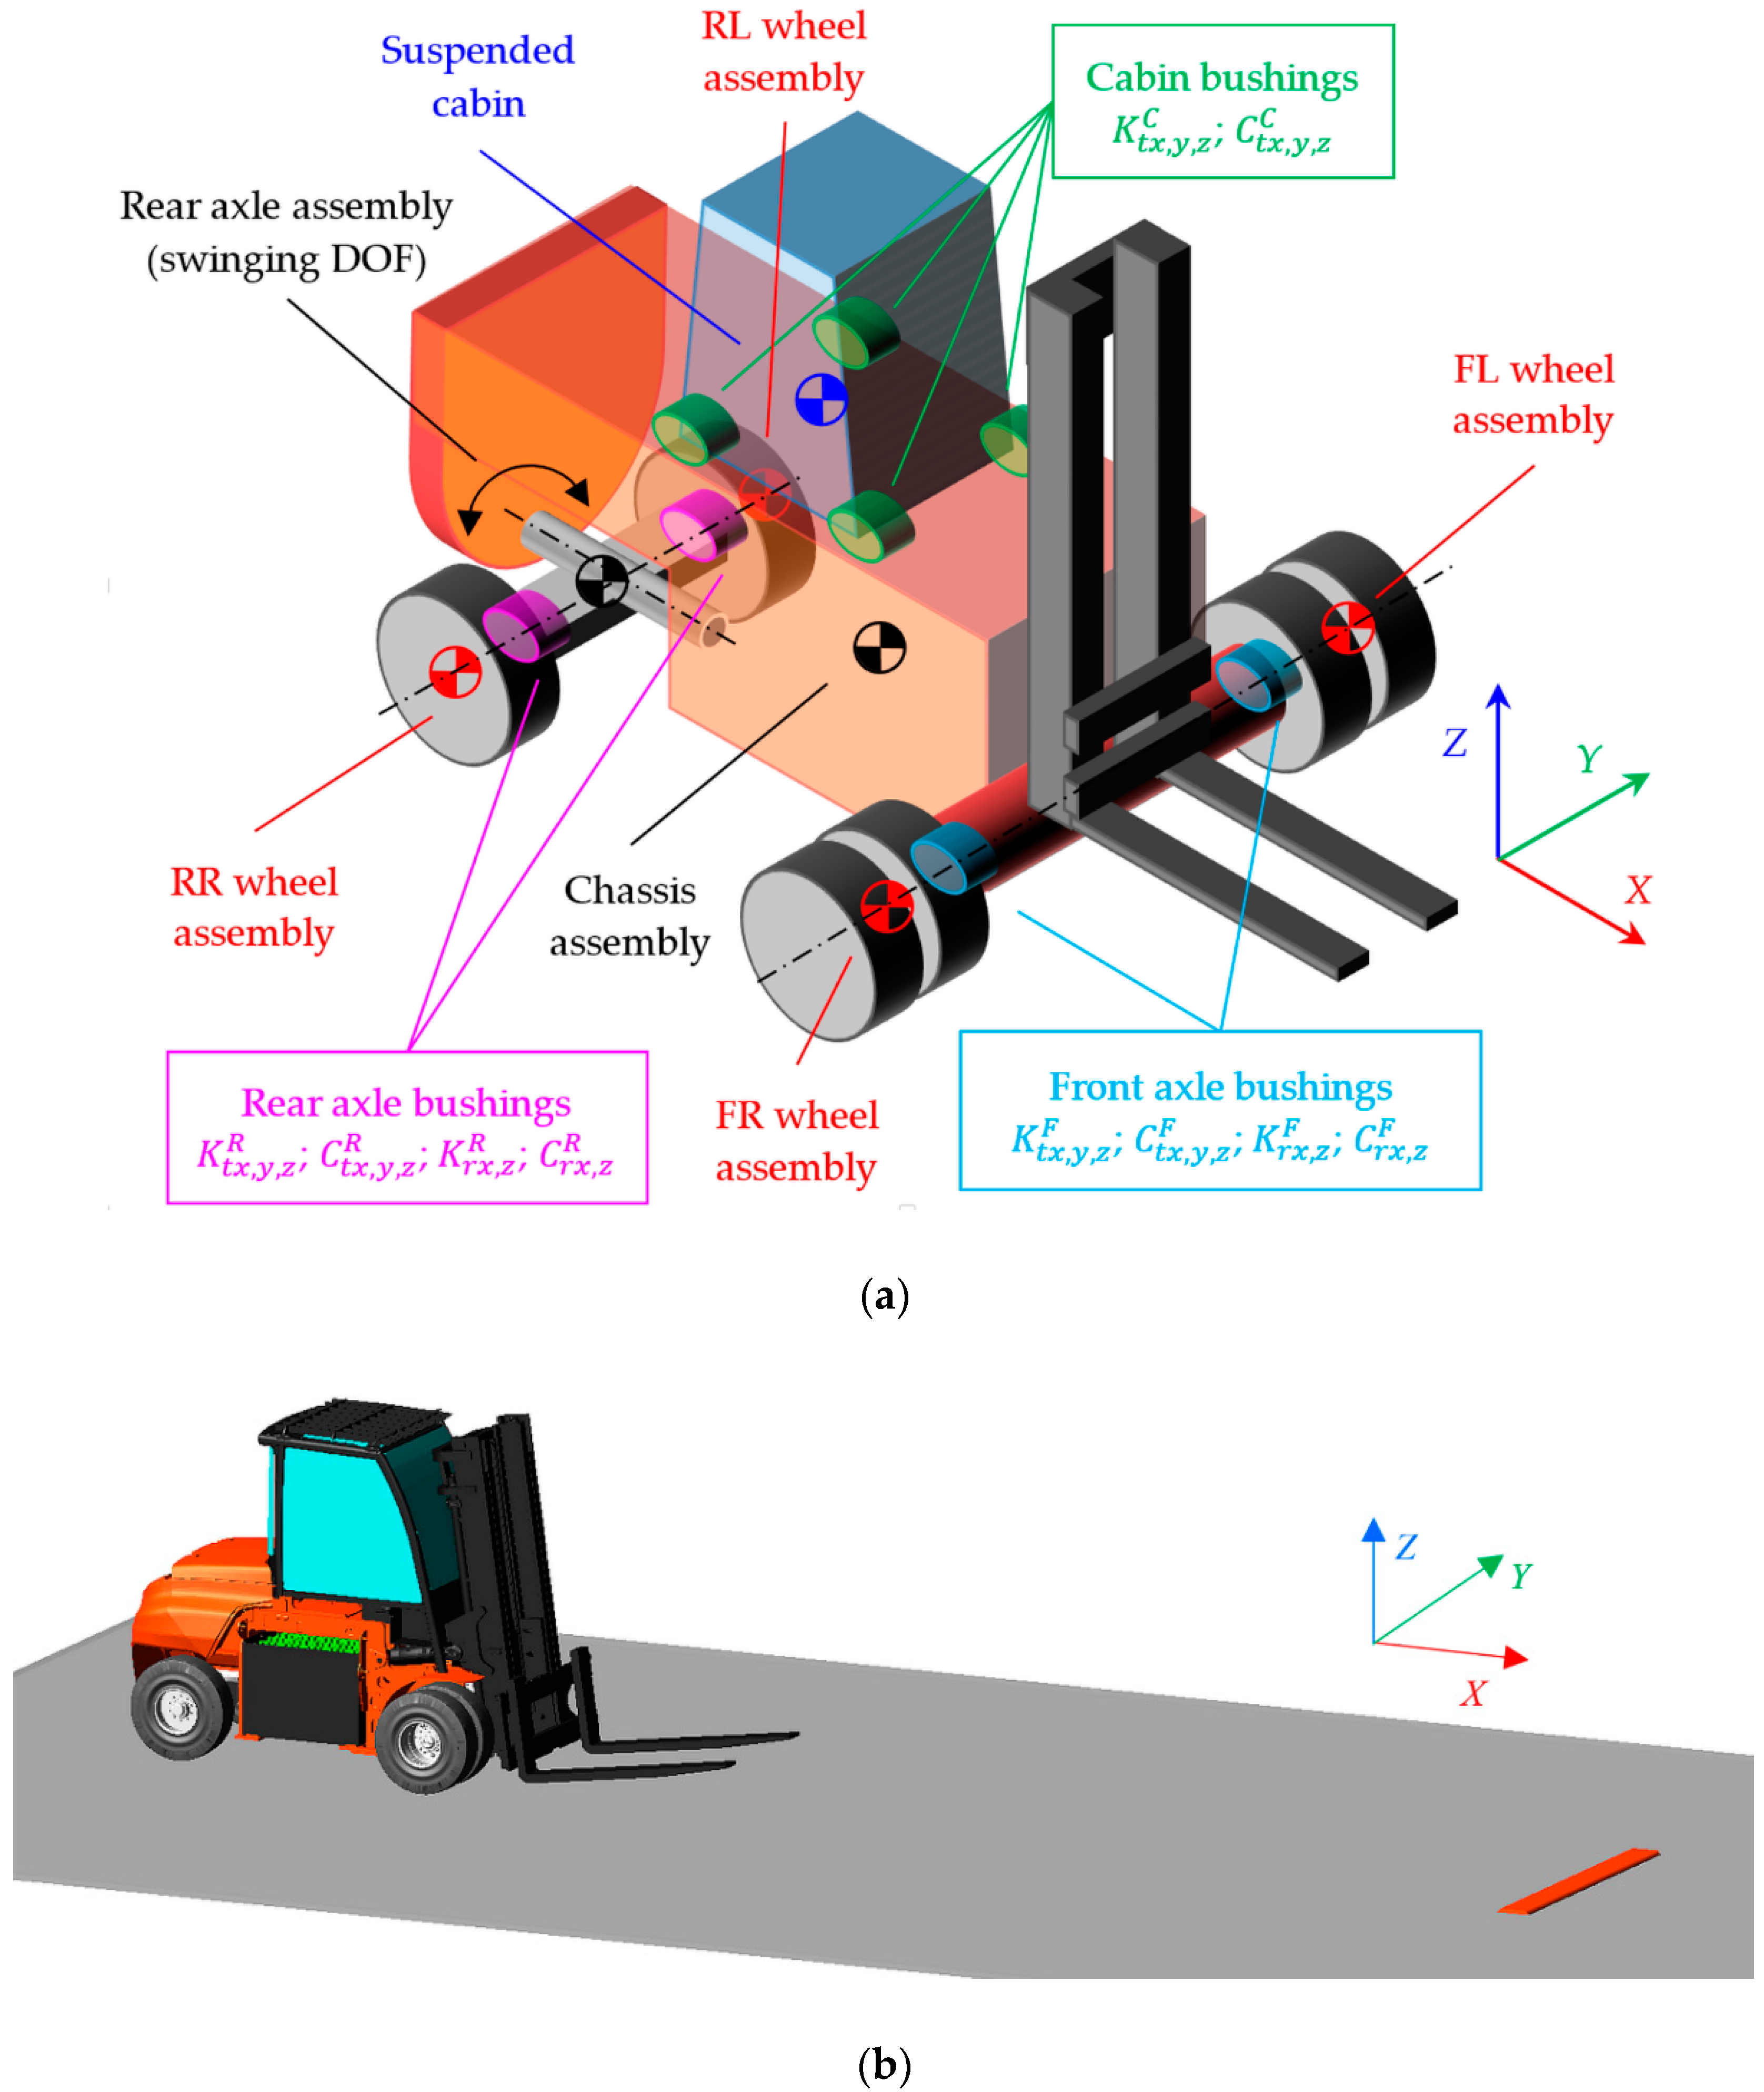
4.1. Model Implementation

A numerical model of the complete forklift truck is implemented within a commercial multibody environment, namely the MSC Adams/View software (Figure 8). All the vehicle components are modelled as rigid bodies. A total of 31 rigid bodies are included in the model. Such a large amount of bodies is meant for the future steps of the research: for instance, the components rigidly connected to the chassis are considered as distinct bodies, to possibly implement a flexible-body chassis; distinct bodies are also considered for the rear axle assembly, to permit simulating different maneuvers by controlling the steering angle. The schematic in Figure 8a shows only the assemblies that exhibit relative motion in the simulations carried out in the present work: e.g., the rear axle is represented as a single body with its swinging DOF; the mast assembly is included in the chassis assembly; each front wheel assembly includes the rim and two tires; etc.
The mass values of all the main assemblies are measured experimentally through an industrial load cell scale; conversely, the locations of their COMs and their inertia tensors are estimated by using three-dimensional CAD models. The forklift operator is included in the model as an additional non-deformable body (mass equal to 80 kg) rigidly connected to the cabin.
All the joints are modelled as ideal kinematic constraints, with some exceptions described below in detail.
Each wheel is connected to its hub by using a linear bushing (Figure 8a), i.e., spring-damper elements (namely, three translational and two torsional elements) characterized by constant lumped parameters, to take into account the compliance of the joints, as well as of the mechanical transmission (front wheels) or of the steering mechanism (rear wheels). The stiffness parameters are referred to as K t j § and K r j § , where the subscripts t and r indicate, respectively, translational and rotational (i.e., torsional), j is the direction of the generated action according to the axes of the local reference system (which is parallel to the global reference system at the initial assembly configuration, hence the directions being indicated as X, Y or Z), and the superscript § stands for the generic axle (either the front axle, F, or the rear one, R). The corresponding damping parameters are referred to as C t j § and C r j § , respectively. It can be observed that the bushings on the same axle have identical parameters. First, tentative values for initializing the stiffness parameters are estimated by using FE models inside Ansys Workbench environment. In particular, the equivalent static stiffness of each axle (translational and torsional, along each direction) is estimated by performing static structural analyses; i.e., static loads are applied to the constrained axle, and its static deflections and rotations at the loading point are computed. Conversely, the damping parameters are arbitrarily initialized based on the authors’ experience. The translational parameters (both the stiffness and the damping ones) are then refined within the model updating process, whereas the rotational parameters are assumed as constants.
Each of the four (identical) bearings that constitute the cabin suspension is modelled by means of three translational spring-damper elements with linear behavior (Figure 8a). The corresponding stiffness and damping constant coefficients are K t j C and C t j C , respectively, where the subscript t means translational, j indicates the generic axis (i.e., X, Y or Z) and the superscript C stands for cabin. Their values are assigned by taking the nominal specifications found in the datasheet provided by the manufacturer of these off-the-shelf components; i.e., they are assumed constant during model updating. It is worth noting that the choice of neglecting the nonlinearities typically characterizing the behavior of elastomeric bearings is expected to possibly limit the accuracy of the predicted vibration response of the cabin itself. Nonetheless, this simplification is deemed acceptable, because the study primarily aims at assessing the global dynamic behavior of the forklift, while the mass of the cabin (with the operator) amounts to only about 3% of the total vehicle mass.
As for the interactions between ground/obstacle and wheels, only a few works dealing with solid rubber tires and forklift trucks can be found in the literature. The majority of these contributions (e.g., see [5,10,24,25]) take into account (semi-)empirical tire models like the well-known Pacejka’s Magic Formula [11], which are mainly suitable for studying steady state and/or slow transient tire response. For simulating the test condition of interest, which is characterized by fast transients induced by the interaction with the obstacle, physically based (flexible ring) tire models would be more appropriate [19,26]. However, such models have numerous parameters to be determined (for each different tire size/thread pattern) by means of tailored experimental tests since they are not provided by the tire manufacturers (unlike for car-mounted tires). Hence, they do not represent a viable option from the perspective of the forklift manufacturer.
Due to the drawbacks of the mentioned tire models concerning the application of interest, this work aims at assessing the use of simplified contact models, based on the penetration of three-dimensional solid geometries, to predict the most relevant aspects of the vehicle response for the test of interest. Such formulation is expected to be less accurate than physically based tire models and may appear as an oversimplification of the problem. However, if proven sufficiently effective (at least for forklifts, given their specific features), it may represent a potentially convenient solution, because of its more straightforward implementation, having only a few parameters to be tuned. To the authors’ best knowledge, investigations of the feasibility of this approach are not documented in the literature. In light of the above considerations, the tire–obstacle (and tire–ground) interaction is modelled with solid-to-solid impact functions. In particular, the IMPACT formulation implemented in the multibody software (without any custom modification), is adopted for computing the normal contact force [27]. For the sake of completeness, the IMPACT contact force formulation is briefly recalled below.
The tires are expected to possibly exhibit different behavior when interacting with the two reaction bodies, namely the ground and the obstacle, because of factors like the pavement irregularities as well as the interface and the connection between the pavement and the steel plate. Hence, two distinct contact functions, possibly having different parameters, are defined for each of the six tires. For each contact function, the magnitude of the normal contact force, FTRn, exerted on the tire (T) by the reaction part (R), i.e., either the ground or the obstacle, is given by the expression [27]:
F T R n = { 0   i f   p < 0 K T R p m + C m a x f ( p ) p ˙ i f   p 0
where p is the penetration of the tire spatial geometry into the reaction part geometry at the contact point, along the common normal direction, KTR is the contact stiffness, m is the exponent of the nonlinear elastic force, Cmax is the maximum contact damping. In addition, f(p) is the following cubic polynomial function:
f ( p ) = { ( p d m a x ) 2 ( 3 2 p d m a x )   i f   0 p < d m a x 1       i f   p d m a x
with the constant dmax indicating the penetration at which the maximum damping is applied. The (static) load–deflection curves provided by the tire manufacturer are utilized for estimating first tentative values to initialize the parameters of the contact functions. In particular, all the contact functions are initialized with the same values; however, the parameters may converge on different values during model updating, with the constraint that homologous functions (i.e., related to the ground or the obstacle) defined for the same axle must assume identical values.
A simple Coulomb friction model is included in the contact force formulation [27]. The friction coefficient varies smoothly with the slip velocity at the contact point (Figure 9): it assumes the value ± μs (static friction coefficient) at vs (referred to as stiction transition velocity); it assumes the value ± μd (dynamic friction coefficient) for a slip velocity lower/higher than vs (referred to as friction transition velocity); the transition between the different values is described by cubic polynomial functions. It is worth noticing that real stiction is not included in the model, as the friction coefficient is equal to zero for a null slip velocity.
Simulations are performed as a sequence of three consecutive steps:
  • The static equilibrium of the forklift lying on the ground in steady state is solved.
  • The vehicle natural frequencies and vibration modes are determined through linearization of the system around the static equilibrium configuration computed at the previous step.
  • Inverse dynamics simulation is carried out by starting from the static equilibrium condition computed at step 1. The forklift is driven from null velocity to a constant forward speed of 11 km/h by defining analytical laws of motion for the front wheels (namely cubic polynomial velocity functions). Then, after a proper time interval to let transient phenomena dampen, the vehicle crosses over the obstacle. The steering angle on the rear wheels is kept constantly equal to zero during the simulations. Hence, the simulated conditions replicate the experimental ones.
The second resonance (referred to as ωpS), which is associated with the pitch vibration mode, and the vertical acceleration of the front left wheel hub (referred to as z ¨ s i m F L ) are retrieved for model updating purposes.

4.2. Model Validation and Results Discussion

The numerical model is updated by means of the built-in optimization tools available in the multibody software. Iteratively, the design parameters (namely the unknowns of the optimization problem) are adjusted and the simulation sequence is repeated to minimize the following objective function:
o b j ( x f r ) = | z ¨ a v F L { p k 1 } z ¨ s i m F L { p k 1 } |
where xfr is the vector of the unknowns for the forklift rigid-body model (in particular, the stiffness and damping parameters of the tire contacts and of the wheel bushings) and z ¨ s i m F L { p k 1 } is the maximum acceleration peak of the FL wheel hub induced by the passage of the front wheels on the obstacle, returned by the dynamic simulation. A tolerance of ± 10% with respect to the experimental value z ¨ a v F L { p k 1 } is deemed acceptable. The optimization process is subjected to the following constraints:
{ x f r , m i n x f r x f r , m a x | ω p E ω p S | 0.05 ω p E | z ¨ a v F L { p k 2 } z ¨ s i m F L { p k 2 } | 0.1 z ¨ a v F L { p k 2 }
where xfr,min and xfr,max are the lower and upper bounds for the unknowns, respectively, and z ¨ s i m F L { p k 2 } is the positive acceleration peak generated on the FL wheel hub by the interaction of the rear wheels with the obstacle. The second condition limits the error on the prediction of the pitch mode resonance to ± 5%. The third constraint limits the error on the second acceleration peak to ± 10%.
The comparison between the measured and the simulated accelerations of the FL wheel hub in the time domain, after model updating, is shown in Figure 10. The main updated parameters related to the tire contact forces are reported in Table 2. The updated parameters for the linear bushings of the wheel hubs are shown in Table 3. For the sake of completeness, the parameters not included in the updating process and those related to the bushings of the cabin suspension are also reported in Table 3.
The results provided by the simulations are in satisfactory agreement with the experimental data. Indeed, the main features of interest are predicted with the desired accuracy of ± 10% (and of ± 5% for the pitch resonance). In particular, the first acceleration peak ( z ¨ a v F L { p k 1 } ) is overestimated by 9.86%; the second acceleration peak ( z ¨ a v F L { p k 2 } ) is underestimated with an error of −9.41%; the pitch mode resonance is also matched within the accepted tolerance (error of −4.54%), and, consequently, the main oscillations as well.
Two discrepancies can be observed: higher-frequency vibrations are not properly caught by the model, in particular those induced by the first collision with the obstacle; the initial phase of the impact of the front wheels with the obstacle (at about 0.75 s) is not accurately reproduced. Reasonably, the former issue may be solved by implementing flexible bodies, in particular a flexible chassis. As for the latter one, it is probably ascribable to an abrupt change in the direction of the resultant contact force (caused by the obstacle geometry) and may be overcome by implementing a more refined contact model. Nonetheless, both issues are considered of minor importance in relation to the final goal of the study, since the most severe excitations experienced by the forklift appear to be properly predicted.
In light of the above considerations, the updated rigid-body model is deemed validated as far as the vehicle vertical dynamics is concerned, which is the primary objective of this study. The current model will be adopted as a reliable starting point to develop a more complex flexible multibody model in the next phases of the investigation. It is worth noting that further tests would be required to properly validate both the longitudinal and the lateral dynamics of the forklift as well, hence permitting to simulate also longitudinal transients and cornering maneuvers, respectively. The possibility of performing such additional analyses will be evaluated in the future steps of the research.
The simulation results retrieved from the current model may be already used for performing the structural analysis of some assemblies, such as the axles, for the test condition of interest. The computed magnitude of the force acting on the bushing of the FL wheel hub, as a function of time, is reported in Figure 11, as an example. Before the obstacle, the force is close to the static value (about 45.9 kN). The first rebound generates a force peak that is more than four times greater than the static force. The two time intervals (before and after the force peak) where the force goes to zero indicate that the front wheels lift off and the front axle is undergoing free fall. This behavior constitutes a severe impulsive excitation to be considered carefully for potential durability issues of the front axle.
Conversely, the updated rigid-body model still results as not adequate for assessing the dynamic stresses on the chassis, because of its interaction with the battery. Indeed, the battery is not rigidly connected to the chassis, but it is simply laying on a flat flange at the bottom of its housing in the chassis itself. Hence, the implementation of both a flexible chassis and a more complex solid-to-flexible contact model is necessarily required to properly evaluate the forces exchanged with the battery case.

5. Conclusions

In the present study, the dynamic behavior of a recently manufactured heavy-duty forklift truck was assessed. A numerical multibody model, featuring rigid bodies and a simplified tire–ground contact model, was implemented to simulate one of the most critical operating conditions characterizing the manufacturer’s test protocols for new prototypes. The model was validated in terms of the forklift vertical dynamics, through experimental measurements on the complete vehicle.
The updated model provides a satisfactory prediction of the vehicle vertical dynamic behavior in the working condition of interest. In particular, all the main features of the forklift response can be reproduced with sufficient accuracy, namely within a tolerance of ± 10%. The simplified model is proven effective as well as easy to implement and validate. Hence, it is confirmed as a promising tool to be adopted for virtual testing purposes.
The current model will be the starting point to develop a flexible multibody model that includes an FE-based chassis to predict the dynamic stresses experienced by the forklift main structures when executing the prescribed test protocols.

Author Contributions

Conceptualization, A.M. and G.P.B.; methodology, A.M. and G.P.B.; software, A.M.; validation, A.M.; formal analysis, A.M. and A.R.; investigation, A.M.; resources, A.M., G.P.B. and A.R.; data curation, A.M.; writing—original draft preparation, A.M.; writing—review and editing, A.R.; supervision, G.P.B. and A.R.; project administration, A.M. and G.P.B.; funding acquisition, A.M. All authors have read and agreed to the published version of the manuscript.

Funding

The funders collaborated in designing the study and in collecting the experimental data. The funders had no role in the analyses, or interpretation of data; in the writing of the manuscript, or in the decision to publish the results.

Acknowledgments

This activity is performed in collaboration with Toyota Material Handling Manufacturing Italy S.p.A. (Bologna, Italy), which is gratefully acknowledged for operative cooperation, use of facilities, and financial support.

Conflicts of Interest

The authors declare no conflict of interest.

References

  1. Industrial Truck Association. Lifting America—The Economic Impact of Industrial Truck Manufacturers, Distributors and Dealers. Available online: https://www.oxfordeconomics.com/recent-releases/lifting-america (accessed on 12 March 2020).
  2. Cao, D.; Song, X.; Ahmadian, M. Editors’ perspectives: Road vehicle suspension design, dynamics, and control. Veh. Syst. Dyn. 2011, 49, 3–28. [Google Scholar] [CrossRef] [Green Version]
  3. Azraai, M.R.; Priyandoko, G.; Yusoff, A.R.; Rashid, M.F.F.A. Parametric optimization of magneto-rheological fluid damper using particle swarm optimization. Int. J. Automot. Mech. Eng. 2015, 11, 2591–2599. [Google Scholar] [CrossRef]
  4. Martini, A.; Bellani, G.; Fragassa, C. Numerical assessment of a new hydro-pneumatic suspension system for motorcycles. Int. J. Automot. Mech. Eng. 2018, 15, 5308–5325. [Google Scholar] [CrossRef]
  5. Rebelle, J.; Mistrot, P.; Poirot, R. Development and validation of a numerical model for predicting forklift truck tip-over. Veh. Syst. Dyn. 2009, 47, 771–804. [Google Scholar] [CrossRef]
  6. Larsson, T.J.; Oldertz, C. Hazardous Exposures and Injury Types Associated with the Use of Industrial Lift Trucks in Sweden 2005–2007. Available online: http://www.diva-portal.org/smash/get/diva2:433870/FULLTEXT01.pdf (accessed on 13 May 2020).
  7. Saric, S.; Bab-Hadiashar, A.; Hoseinnezhad, R.; Hocking, I. Analysis of forklift accident trends within Victorian industry (Australia). Saf. Sci. 2013, 60, 176–184. [Google Scholar] [CrossRef]
  8. Yang, M.; Xu, G.; Dong, Q.; Han, X. Vibration study of fork-lift truck based on the virtual prototype technology. Sens. Transducers 2014, 170, 177–183. [Google Scholar]
  9. Strandberg, L. Danger, rear wheel steering. J. Occup. Accid. 1983, 5, 39–58. [Google Scholar] [CrossRef]
  10. Frazer-Nash Consultancy Limited. Fork Lift Truck Validation and Trials. Available online: http://www.hse.gov.uk/research/rrhtm/rr456.htm (accessed on 12 March 2020).
  11. Pacejka, H.B. Tire and Vehicle Dynamics, 3rd ed.; Butterworth-Heinemann: Oxford, UK, 2012. [Google Scholar]
  12. Popescu, S.; Nastase, S.; Csatlos, C. Contributions to theoretical and experimental study of the dynamic stability of the forklift trucks. J. Eng. Stud. Res. 2012, 18, 115–121. [Google Scholar]
  13. International Organization for Standardization. Industrial Trucks—Verification of Stability—Part 2: Counterbalanced Trucks with Mast; Standard ISO 22915-2; International Organization for Standardization: Geneva, Switzerland, 2018. [Google Scholar]
  14. Milanowicz, M.; Budziszewski, P.; Kedzior, K. Numerical analysis of passive safety systems in forklift trucks. Saf. Sci. 2018, 101, 98–107. [Google Scholar] [CrossRef]
  15. Gardella, M.; Martini, A. Multibody models and simulations to assess the stability of counterbalance forklift trucks. In Multibody Dynamics 2019—ECCOMAS 2019. Computational Methods in Applied Sciences; Kecskeméthy, A., Geu Flores, F., Eds.; Springer: Cham, Switzerland, 2020; Volume 53, pp. 526–533. [Google Scholar]
  16. Larsson, T.J.; Lambert, J.; Wilde, M.; Tully, G.; Askew, H.; Skinner, W.; Carter, B.; Martin, T.; Kenningham, L. Industrial Forklift Trucks-Dynamic Stability and the Design of Safe Logistics. Available online: http://www.diva-portal.org/smash/record.jsf?pid=diva2%3A430110&dswid=-6079 (accessed on 13 May 2020).
  17. International Organization for Standardization. Mechanical Vibration and Shock-Evaluation of Human Exposure to Whole-Body Vibration-Part 1: General Requirements; Standard ISO 2631-1; International Organization for Standardization: Geneva, Switzerland, 1997. [Google Scholar]
  18. Malchaire, J.; Piette, A.; Mullier, I. Vibration exposure on fork-lift trucks. Ann. Occup. Hyg. 1996, 40, 79–91. [Google Scholar] [CrossRef]
  19. Lemerle, P.; Mistrot, P. A new tire model to predict vibration emission of counterbalance trucks. Tire Sci. Technol. 2000, 28, 119–137. [Google Scholar] [CrossRef]
  20. De Man, P.; Lemerle, P.; Mistrot, P.; Verschueren, J.-P.; Preumont, A. An investigation of a semiactive suspension for a fork lift truck. Veh. Syst. Dyn. 2005, 43, 107–119. [Google Scholar] [CrossRef]
  21. Doçi, I.; Bajraktari, M.; Imeri, V. Studying Dynamic Effects on Warehouse Forklift During Forward Movement with Full Loading. In Proceedings of the 16th International Research/Expert Conference Trends in the Development of Machinery and Associated Technology-TMT 2012, Dubai, UAE, 10–12 September 2012. [Google Scholar]
  22. Doçi, I.; Imeri, V. Dynamic analysis of forklift during load lifting using modeling and simulations. Int. J. Curr. Eng. Technol. 2013, 3, 342–347. [Google Scholar]
  23. Martini, A.; Troncossi, M. Upgrade of an automated line for plastic cap manufacture based on experimental vibration analysis. Case Stud. Mech. Syst. Signal Process. 2016, 3, 28–33. [Google Scholar] [CrossRef] [Green Version]
  24. Challener, S.A.; Wylie, A.F. Development of Theoretical Model for Simulating FLT Overturn-Rate of Steering Response-Fixed Geometry Vehicle; Health and Safety Executive Research Report 291; HSE Books: Sudbury, UK, 2004. [Google Scholar]
  25. Stepanyuk, S.; Bruns, R.; Krivenkov, K. Empirical lateral-force-model for forklift tires. Logist. Res. 2017, 10, 1–12. [Google Scholar]
  26. Gipser, M. FTire—The tire simulation model for all applications related to vehicle dynamics. Veh. Syst. Dyn. 2007, 45, 139–151. [Google Scholar] [CrossRef]
  27. MSC Software Corporation. Adams/Solver: Software User Manual; MSC Software Corporation: Newport Beach, CA, USA, 2009. [Google Scholar]
Figure 1. Traigo 80 forklift: (a) Full-assembly draft; (b) CAD model of the chassis; (c) Picture of the tested vehicle.
Machines 08 00026 g001
Figure 2. Sensor setup: (a) Schematics of the monitored locations; (b) close up of the accelerometer on the FL wheel hub.
Machines 08 00026 g002
Figure 3. Close up of the steel obstacle just before being impacted during tests.
Machines 08 00026 g003
Figure 4. FL wheel hub acceleration, comparison of the averaged signal z ¨ a v F L and the 15 acquisitions.
Machines 08 00026 g004
Figure 5. PSD of the z ¨ a v F L signal.
Machines 08 00026 g005
Figure 6. Spectrogram of the z ¨ a v F L signal.
Machines 08 00026 g006
Figure 7. Comparison between the filtered signals of the front left (FL), front right (FR), rear left (RL), and rear right (RR) wheel hubs.
Machines 08 00026 g007
Figure 8. Numerical model: (a) Schematics with the main assemblies and parameters; (b) MSC Adams model after static equilibrium solution.
Machines 08 00026 g008
Figure 9. Curve describing the friction model in the tire contacts.
Machines 08 00026 g009
Figure 10. Comparison between experimental data (exp), z ¨ a v F L , and numerical results (sim), z ¨ s i m F L .
Machines 08 00026 g010
Figure 11. Magnitude of the force on the FL wheel hub provided by the updated numerical model.
Machines 08 00026 g011
Table 1. Main specifications of the tested forklift.
ParameterValueUnit
overall mass (with operator) 117,280kg
front | rear mass distribution (unloaded) 19355 | 7925kg
load capacity8000kg
battery mass 12824kg
cabin mass 1497kg
wheelbase2300mm
lift height3300mm
turning radius3207mm
overall width2141mm
1 Experimentally measured data.
Table 2. Main tire contact force parameters of the Traigo 80 rigid-body model after updating.
ContactKTR
[N/m]
Cmax
[N·s/m]
mμsμd
tire-road, front6.0·1065.0·1031.50.60.5
tire-road, rear 6.0·1065.0·1031.50.60.5
tire-obstacle, front4.0·1067.5·1031.51.00.8
tire-obstacle, rear7.2·1067.5·1031.51.00.8
Table 3. Linear bushing parameters of the Traigo 80 rigid-body model after updating.
Linear Bushing 1 K t x *
[N/m]
K t y *
[N/m]
K t z *
[N/m]
C t x *
[N·s/m]
C t y *
[N·s/m]
C t z *
[N·s/m]
K r x , z *
[Nm/rad]
C r x , z *
[Nm·s/rad]
front axle7.8·1079.1·1087.8·1075.0·1055.8·1065.0·1052.3·10105.7·105
rear axle2.5·1073.0·1082.5·1071.7·1051.9·1061.7·1055.0·1091.3·105
cabin 1.4·1061.4·1064.8·1051.0·1041.0·1045.0·103
1 Symbol * stands for F (front axle), R (rear axle) or C (cabin suspension).

