Article

Machine Vision-Based Surface Defect Detection Study for Ceramic 3D Printing

1
School of Mechanical Engineering, Tianjin University of Science and Technology, Tianjin 300222, China
2
China National Center for Quality Inspection and Testing of Electrical Control and Distribution Equipment, Tianjin 300180, China
3
Tianjin Tianchuan Electric Control Equipment Test Co., Ltd., Tianjin 300180, China
*
Author to whom correspondence should be addressed.
Machines 2024, 12(3), 166; https://doi.org/10.3390/machines12030166
Submission received: 24 January 2024 / Revised: 22 February 2024 / Accepted: 23 February 2024 / Published: 28 February 2024
(This article belongs to the Special Issue Design and Application of Advanced Manufacturing Systems)

Abstract

:
A set of online inspection systems for surface defects based on machine vision was designed in response to the issue that extrusion molding ceramic 3D printing is prone to pits, bubbles, bulges, and other defects during the printing process that affect the mechanical properties of the printed products. The inspection system automatically identifies and locates defects in the printing process by inspecting the upper surface of the printing blank, and then feeds back to the control system to produce a layer of adjustment or stop the printing. Due to the conflict between the position of the camera and the extrusion head of the printer, the camera is placed at an angle, and the method of identifying the points and fitting the function to the data was used to correct the camera for aberrations. The region to be detected is extracted using the Otsu method (OSTU) on the acquired image, and the defects are detected using methods such as the Canny algorithm and Fast Fourier Transform, and the three defects are distinguished using the double threshold method. The experimental results show that the new aberration correction method can effectively minimize the effect of near-large selection caused by the tilted placement of the camera, and the accuracy of this system in detecting surface defects reached more than 97.2%, with a detection accuracy of 0.051 mm, which can meet the detection requirements. Using the weighting function to distinguish between its features and defects, and using the confusion matrix with the recall rate and precision as the evaluation indexes of this system, the results show that the detection system has accurate detection capability for the defects that occur during the printing process.

1. Introduction

Additive manufacturing, or 3D printing, is a common intelligent manufacturing method that has grown significantly in the last several years and attracted much interest and study [1]. In contrast to conventional machining techniques, 3D printing technology is a novel form of additive manufacturing. It builds a discrete part model with computer assistance and then builds up the target component entity layer by layer using the material layer-by-layer process [2]. In the mechanical, electronic, energy, medical, biological, chemical, environmental protection, national defense, aerospace, and other fields, ceramic materials are among the three basic materials along with polymer and metal materials because of their excellent mechanical properties and acousto-optic electromagnetic heat; additionally, their high-temperature resistance, corrosion resistance, wear-resistant insulation, chemical, and physical properties are stable [3,4]. In additive manufacturing, ceramic 3D printing technology is now facing a huge challenge; printing accuracy is low, and process complexity and other issues have been slowing its development [5,6,7]. Three-dimensional light-curing molding, fused deposition molding, digital light processing, binder jetting, selective laser sintering/fusion, etc., are the primary technologies utilized in ceramic 3D printing [8,9,10]. One of the most economical molding techniques for 3D printing ceramics is extrusion molding. The application of numerous primary procedures can be broken down into categories such as slurry preparation, printing and forming, drying and sintering, sanding or post-processing, etc. [11,12]. The extrusion molding principle describes how the ceramic material is made to have specific mobility by adding solvents or heating it physically after it has been extruded externally to a specific caliber (often hundreds of microns to a few millimeters in diameter). In contrast to the conventional preparation method, which saves raw materials, has lower processing costs and a shortened processing cycle, and offers a larger development space, extrusion nozzle extrusion of a material into a specific shape to manufacture ceramic parts is like squeezing toothpaste layer by layer and molding it [13,14]. Real-time printing process detection is important because variations in printing speed, temperature, and paste preparation can result in under- or over-packing of the printed parts due to defects like pits, bubbles, and bulging. As a result, the printed parts may not meet the necessary performance indicators [2]. The advantages of machine vision technology in defect detection include long operation time, high precision, high efficiency, and good non-contact detection. These make it ideal for flaw identification in the ceramic 3D printing process [15,16].
Machine vision technology, which has been developed in recent decades, is a non-destructive, non-contact method of automatic inspection. It is a useful tool for achieving equipment automation, and intelligent and precision control. Its many benefits include a high productivity, long working hours in challenging environments, safety and dependability, and a wide range of spectral responses [17,18]. Furthermore, the use of machine vision technology to carry out real-time online defect detection on 3D printing is also a novel method that can ensure the high precision of processed parts and meet the requirements for mechanical properties of parts in high-end manufacturing while reducing the processing time and processing costs and improving the yield rate of parts [19,20,21,22,23]. At present, the research to introduce visual inspection into the 3D printing process has gradually become a new exploration direction [24,25,26,27,28,29,30]. Fang et al. [31] used machine vision to detect surface paths in the printing process. Pitchaya Sitthi-Amorn [32] developed a system to detect fluctuations in the Z-direction. Mingtao Wu [33] designed a system to detect the top view of a printer. Weijun Sun et al. carried out the design of a multi-angle visual inspection system for robot 3D printing, and proposed a virtual–real matching defect detection algorithm for model self-features to reduce the false detection rate and improve the detection accuracy in view of the misidentification of the model’s own features and real defects in the existing visual inspection technology. Jeremy Straub [34] designed a multi-camera inspection system for Cartesian structural printers, using a five-position camera with a fixed position to inspect the outer surface of a print. Oliver et al. [35] designed a real-time detection system for fused filament processing 3D printing, which detects printing defects in real time by monitoring the parts during the printing process, using a 3D digital image camera to obtain geometric shapes, and comparing the printed geometry with the computer model.
Compared to the above, 3D printing has a simple molding, short cycle, is easy to adjust, etc., but because of the extrusion molding process, the material price is more expensive and the printing process is prone to defects and cannot produce printed products that [36]. Therefore, to avoid wasting the materials and time to perform the follow-up process and to solve the problem of printing defects that cannot be detected during the printing process, a detection method that can detect a variety of defects was investigated for the extrusion molding process in ceramic 3D printing, and a real-time online inspection system based on machine vision was designed. The technical difficulty lies in the fact that most of the conventional camera arrangement methods are placed perpendicular to the object to be detected, and due to the conflict between the camera and the position of the extrusion head of the printer, it can only be solved by other placement methods. Secondly, this system is different from other inspection systems in that it needs to detect three defects simultaneously and identify and locate them, and it contains a feedback system, which can realize automatic stopping and make the printed products more perfect, compared with the conventional defect detection systems, which can only identify one kind of defect.

2. Machine Vision Defect Detection System Design

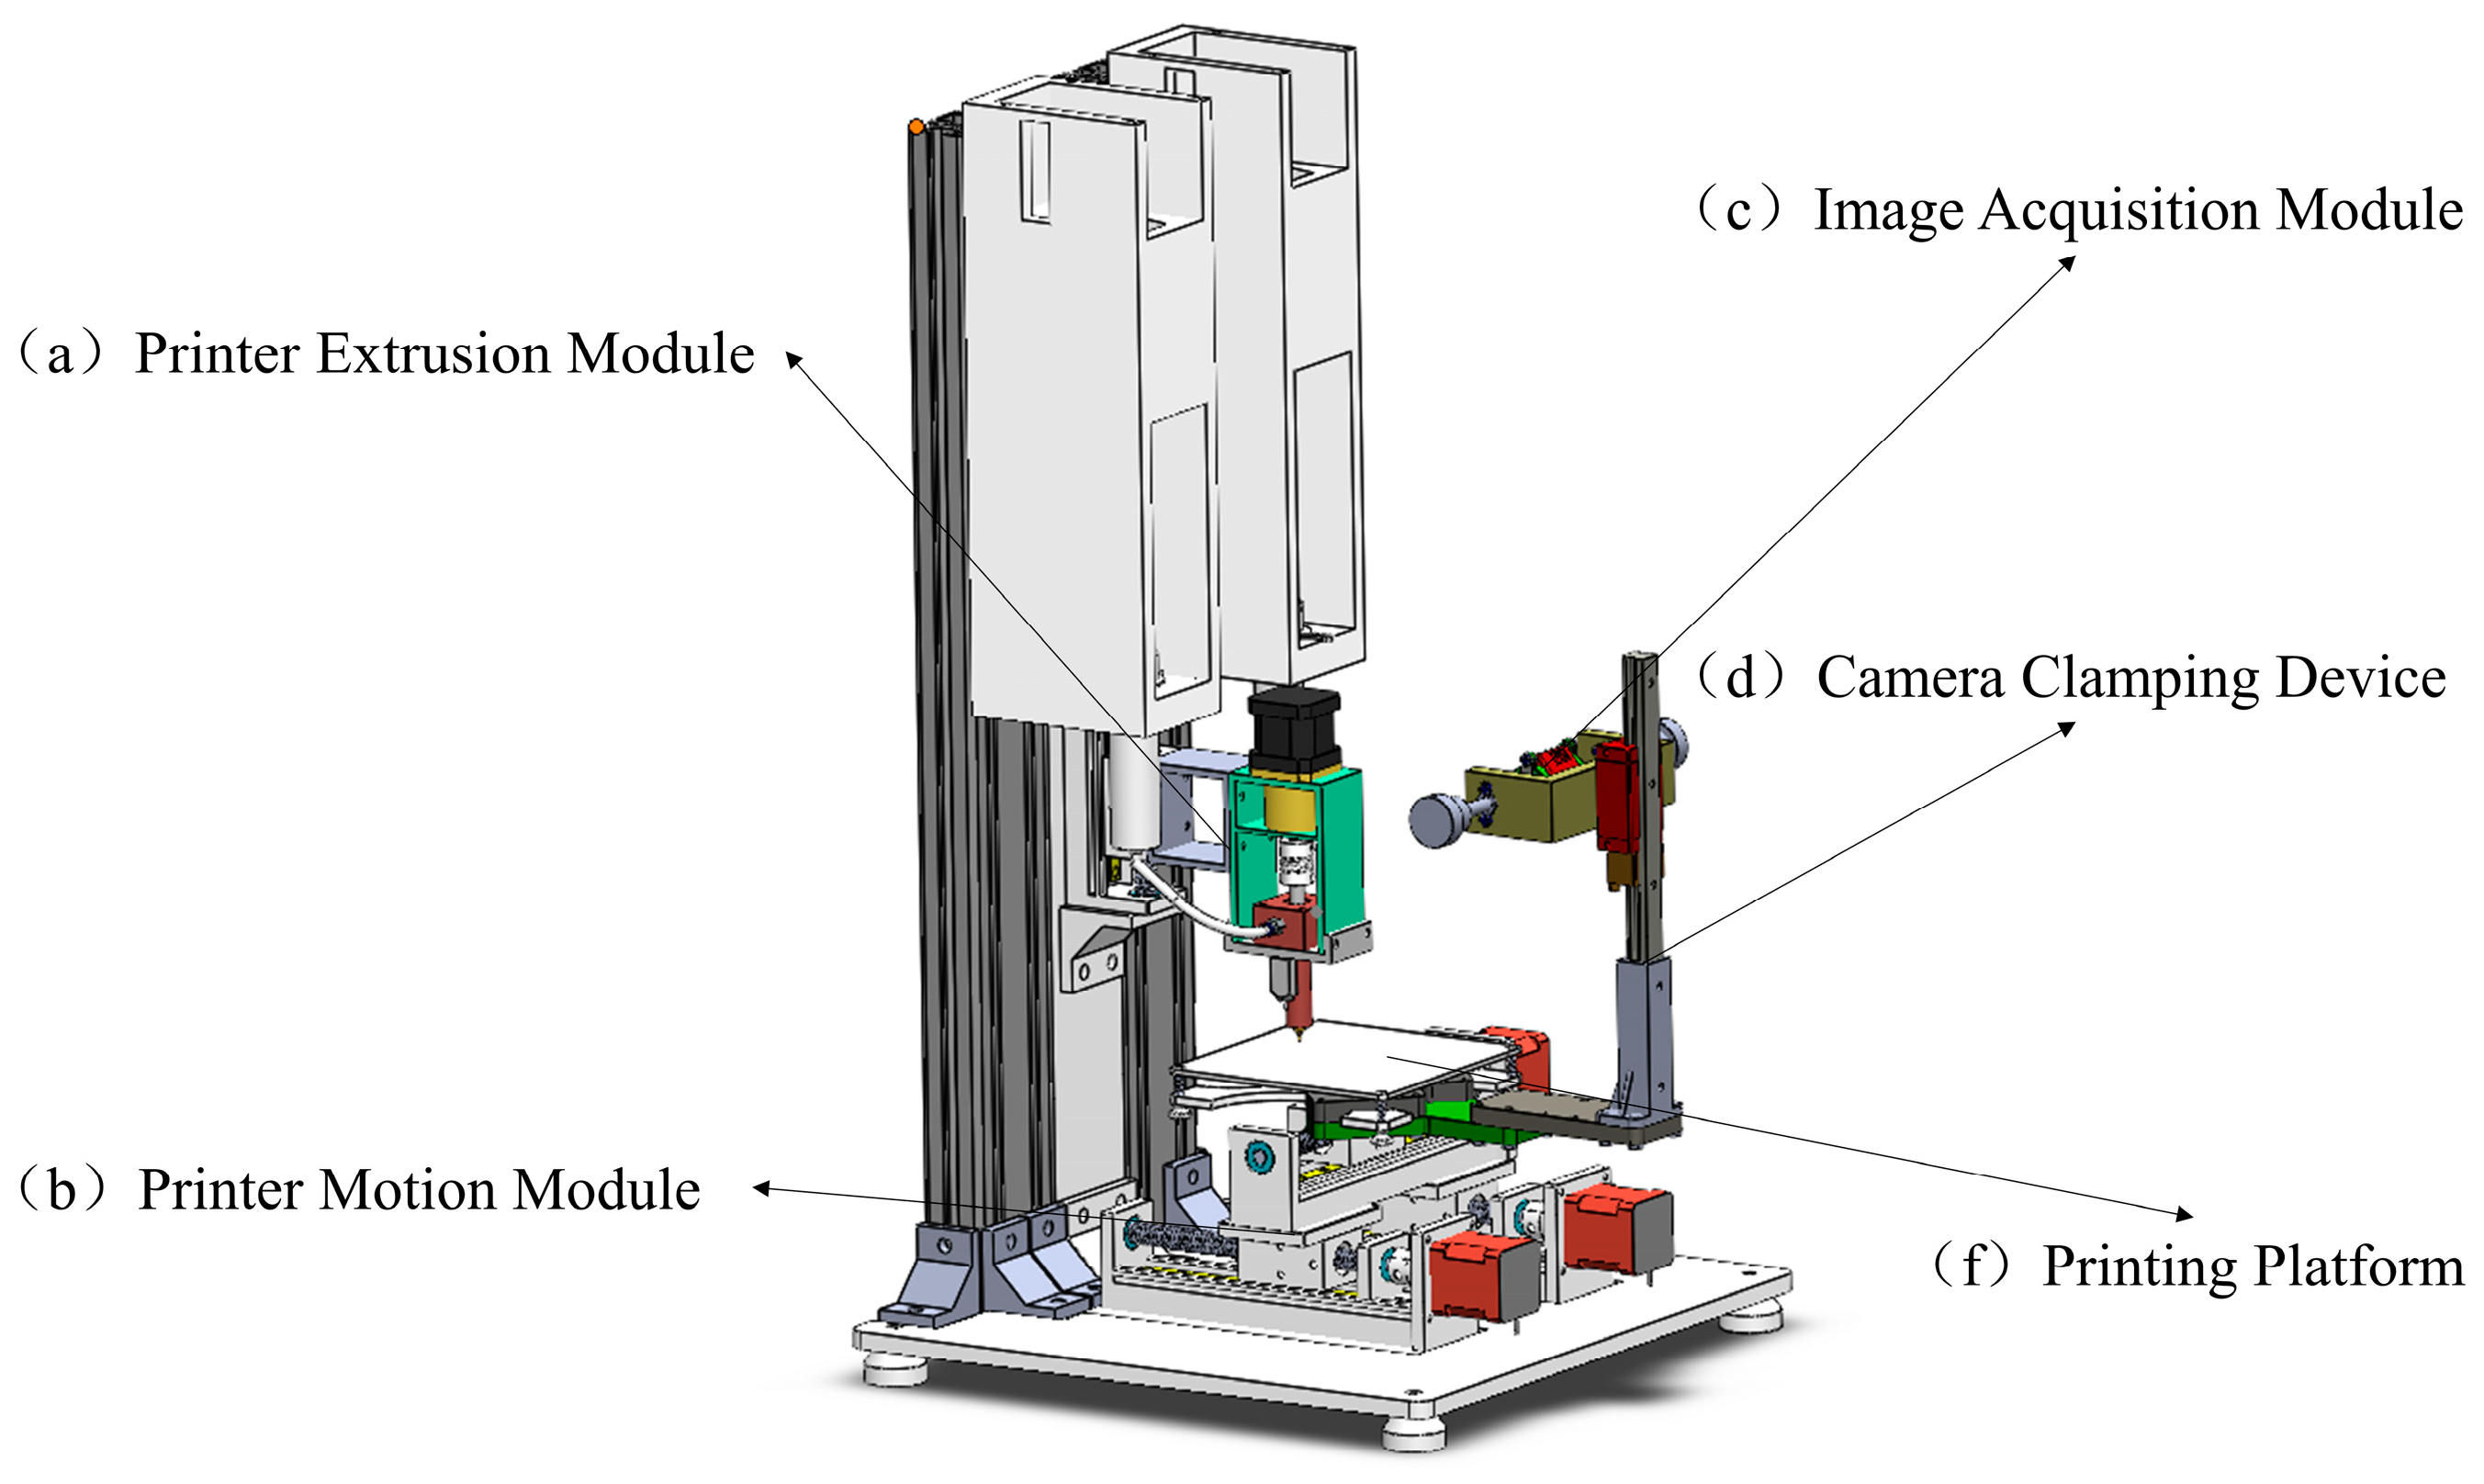
2.1. Overall System Design

The model diagram of the system is shown in Figure 1. It contains a printer extrusion module, a printer drive module, an image acquisition module, a camera clamping module, and a printing platform, in which the camera in the image acquisition module is placed at an oblique angle to avoid interfering with the extrusion head of the printer, and the object being tested is in the printing platform. To ensure that the 3D printer can obtain high-quality images during operation, the camera should remain stationary relative to the printing platform. We designed a machine vision camera clamping device for 3D printers, as shown in Figure 1d.

2.2. Image Capture Module

The image acquisition module comprises an industrial camera, an industrial lens, and a ring light source [37]. In this study, one camera was placed at an angle for defect detection, and the camera remained stationary relative to the printing platform. As the print platform size is 150 mm × 150 mm, the actual detection range is 160 mm × 150 mm. To ensure the accuracy of the captured image, the working distance was chosen to be 150 mm~220 mm in consideration of the installation space, and the camera sensor size was 1/1.7 inch, i.e., the sensor chip size was 7.2 mm × 5.4 mm, C v = 7.2 mm, and C h = 5.4 mm. The Field of View (FOV) in this study was 160 mm × 150 mm, and the Working Distance (WD) was 150 mm~220 mm. The focal length according to f = W D × C V / F O V was 6.75~10.6, so this study chose a focal length of an 8 mm lens; the parameters of the industrial camera, industrial lens, and ring light source are shown in Table 1.
Due to the cascading nature of 3D printing, the printing steps are stacked layer by layer and the Z-axis only rises one layer after each layer is printed. It is only necessary to set the acquisition image command to complete real-time online inspection when the Z-axis rises, and it also ensures that each acquired image is a complete layer, avoiding the impact of the acquired image [38] when the height of the measured object is less than 10 mm within the depth of field of the image acquisition module, which ensures the quality of the captured picture.

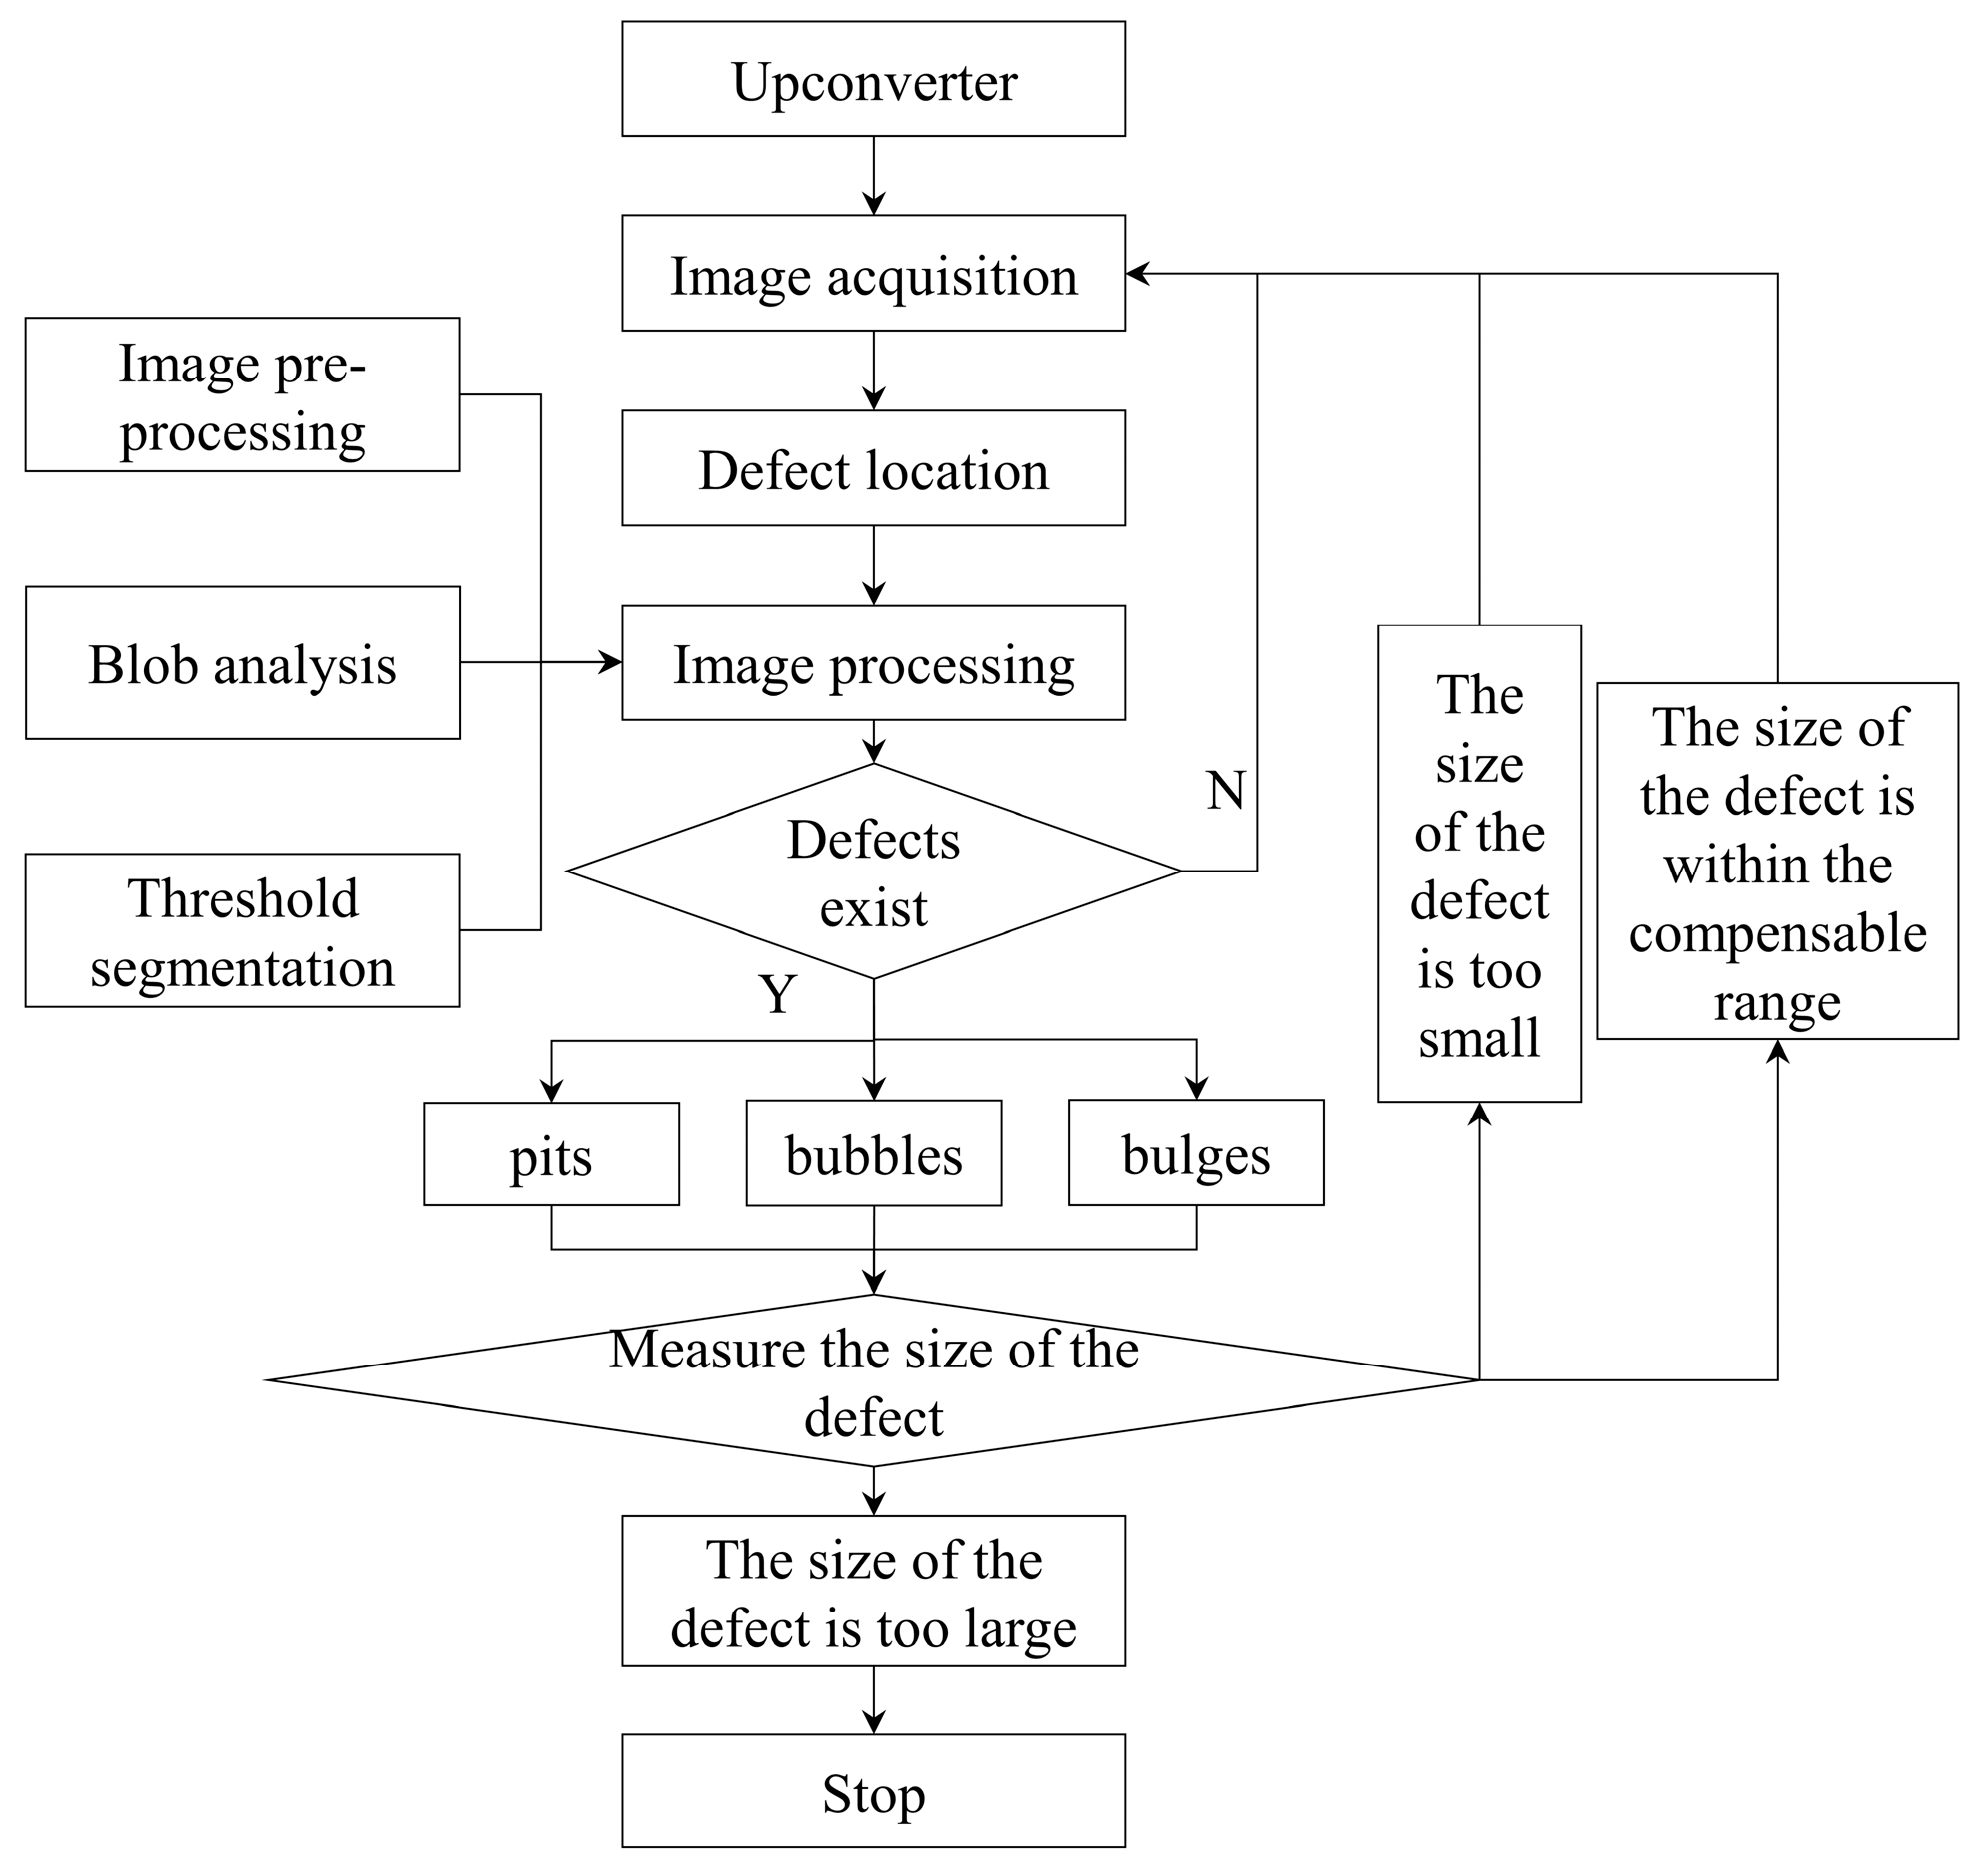
2.3. Image Processing and Defect Detection Module

The image processing and defect detection module is the core of the whole detection system; its function is to carry out feature detection of the pre-processed image, according to the different features to determine whether there are form, size, or surface defects, and automatically distinguish the type of defects. This study categorized the defects into three main types of defects: pits, bubbles, and bulges, as shown in Figure 2.

3. Image Processing and Defect Recognition

When the industrial camera acquires images, it will inevitably be disturbed by some signals and produce noise, so the acquired images need to be pre-processed to simplify the data, remove irrelevant information, and obtain reliable images [39,40,41]. The detection process is shown in Figure 3. Figure 3 is the framework flow chart of the overall visual inspection.

3.1. ROI Positioning

ROI (Region Of Interest) positioning is the first step in image processing and requires the accurate positioning of the print platform to the part of the image that requires defect detection. As the background of the print platform differs significantly from the grey scale value of the printed part, it is only necessary to segment the image into foreground and background, not to segment the image into multiple segments. In this study, the maximum between-class variance method (OSTU) was used for image segmentation because when the measured object is printed to a certain layer height, this method can only separate the upper surface to be inspected and will not include the side aspects.
The target region can be obtained using the maximum interclass variance method, which is then processed using the open operation in morphology to smooth the edges of the image, eliminating burrs and narrow connections, but keeping the size of the ontological region unchanged. Finally, the target area is intercepted using the reduce_domain operator. As the industrial camera is placed at an angle in the inspection method designed in this study, the camera will capture images of both the upper and side surfaces of the printed part after printing a certain layer height, and the target area to be inspected can be effectively obtained using the maximum inter-class variance method, as shown in Figure 4.

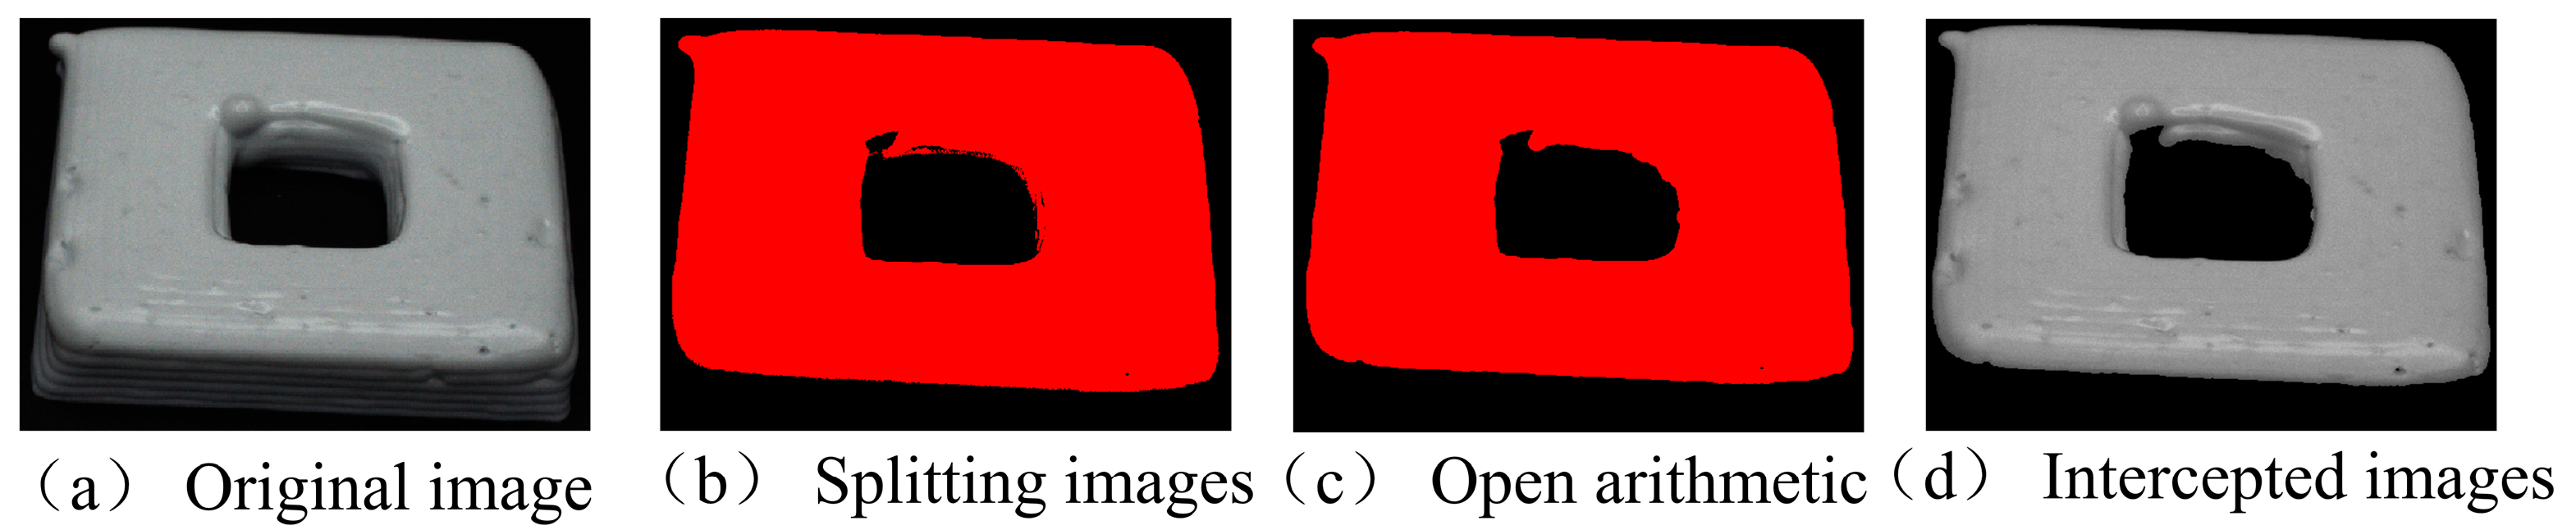
3.2. Image Pre-Processing

Image pre-processing starts with filtering, which reduces the image noise, which refers to pixel points that do not correlate with the features of the image itself and behave similarly to electronic noise. Image noise can bring interference and additional information to the image, which can hinder the analysis of the image. Mean filtering has a good effect on the noise inside the image and blurring the image, but it will blur out the edge information and feature information in the image and a lot of features will be lost. Median filtering has a good smoothing effect mainly on the individual noise, while Gaussian filtering can obtain an image with a high signal-to-noise ratio, and it can eliminate the Gaussian noise [42,43].
Gaussian filtering is a linear smoothing filter for removing Gaussian noise. Gaussian filtering is a process of weighted averaging of the whole image, where the value of each pixel point is obtained by weighted averaging of its value and the values of other pixels in its neighborhood. Because there was a lot of Gaussian noise in the images collected in this study, the Gaussian filter was used to process the images; the images processed by the Gaussian filter have a high signal-to-noise ratio, and the real signal is displayed.
Then, morphological processing is required; expansion, erosion, open operations, and closed operations are the four basic operations of morphological processing [44]. Morphological processing is essentially a non-linear algebraic operation based on the shape of an object, which acts on point sets and the connectivity between point sets and shapes. Morphological processing is primarily designed to simplify image data by removing extraneous structures and allowing their underlying shape to be effectively preserved. The results of the morphological processing of the three defects are shown in Figure 5.
It is obvious in the figure that after the morphological processing of the image, small bits and pieces of interference have been removed, the contours of the print product itself have been preserved, the irrelevant structures are effectively removed, and the main structure and the basic shape are preserved; the image is now ready for the subsequent segmentation of the image.

3.3. Threshold Segmentation

Before the threshold segmentation, according to the different characteristics of the defects, this study classified the defects into three types for segmentation: firstly, bulge and bubble defects because the bulge and bubble will produce a circle of gradient transformation in the grey value on the part surface. Hence, this study used the canny edge detection algorithm to detect the defects. The canny edge detection algorithm has the advantage of strong self-adaptation and can enhance the suppression of multi-response edges [45], as shown in Figure 6.
For pit defects, this study used the Fast Fourier Transform to detect defects [46]. The usual calculations are carried out in the spatial domain. Still, sometimes the processed effect in the spatial domain cannot achieve the desired effect, so the fast Fourier transform can be used to convert the target into the frequency domain space. Then, the reverse Fourier transform can be performed in this space for subsequent processing after the processing is completed. The processing is completed, followed by mean filtering and dynamic thresholding to segment out the defects and finally, morphological processing is performed to obtain the desired image, as shown in Figure 7.

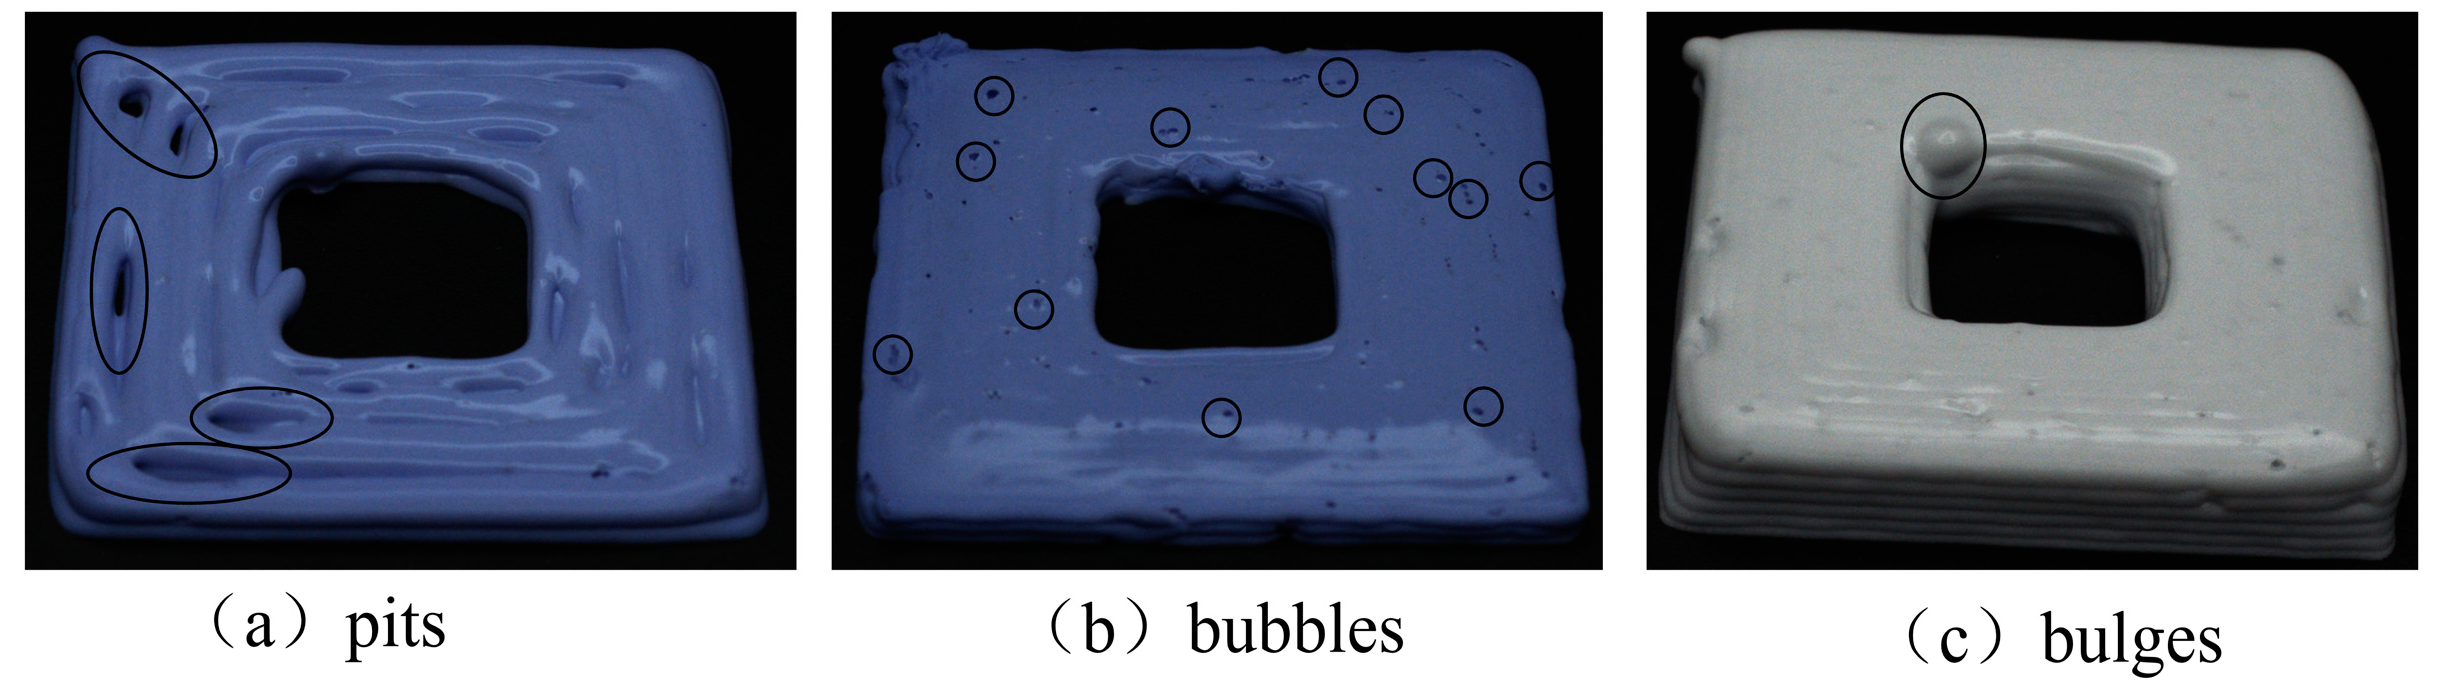
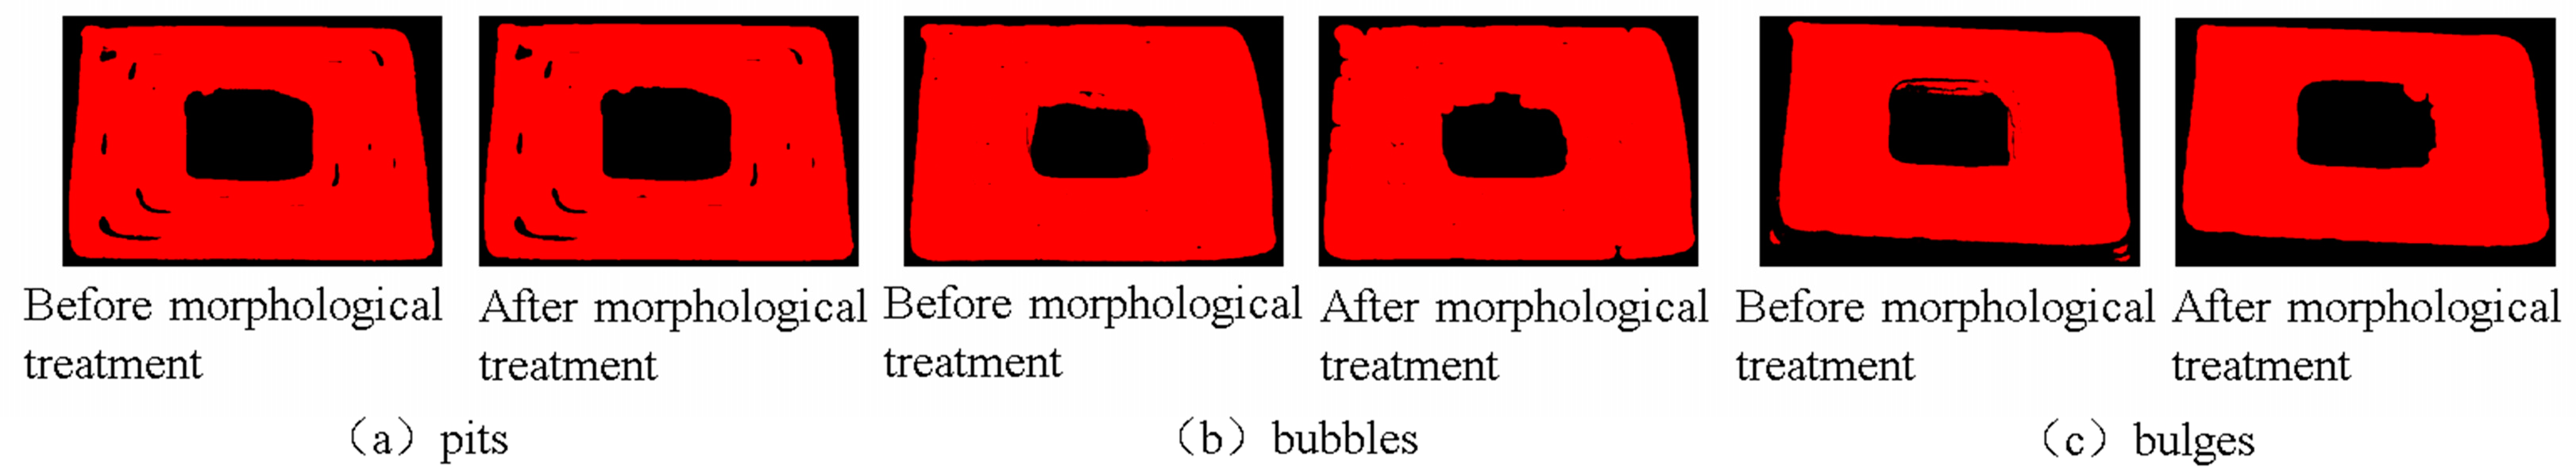
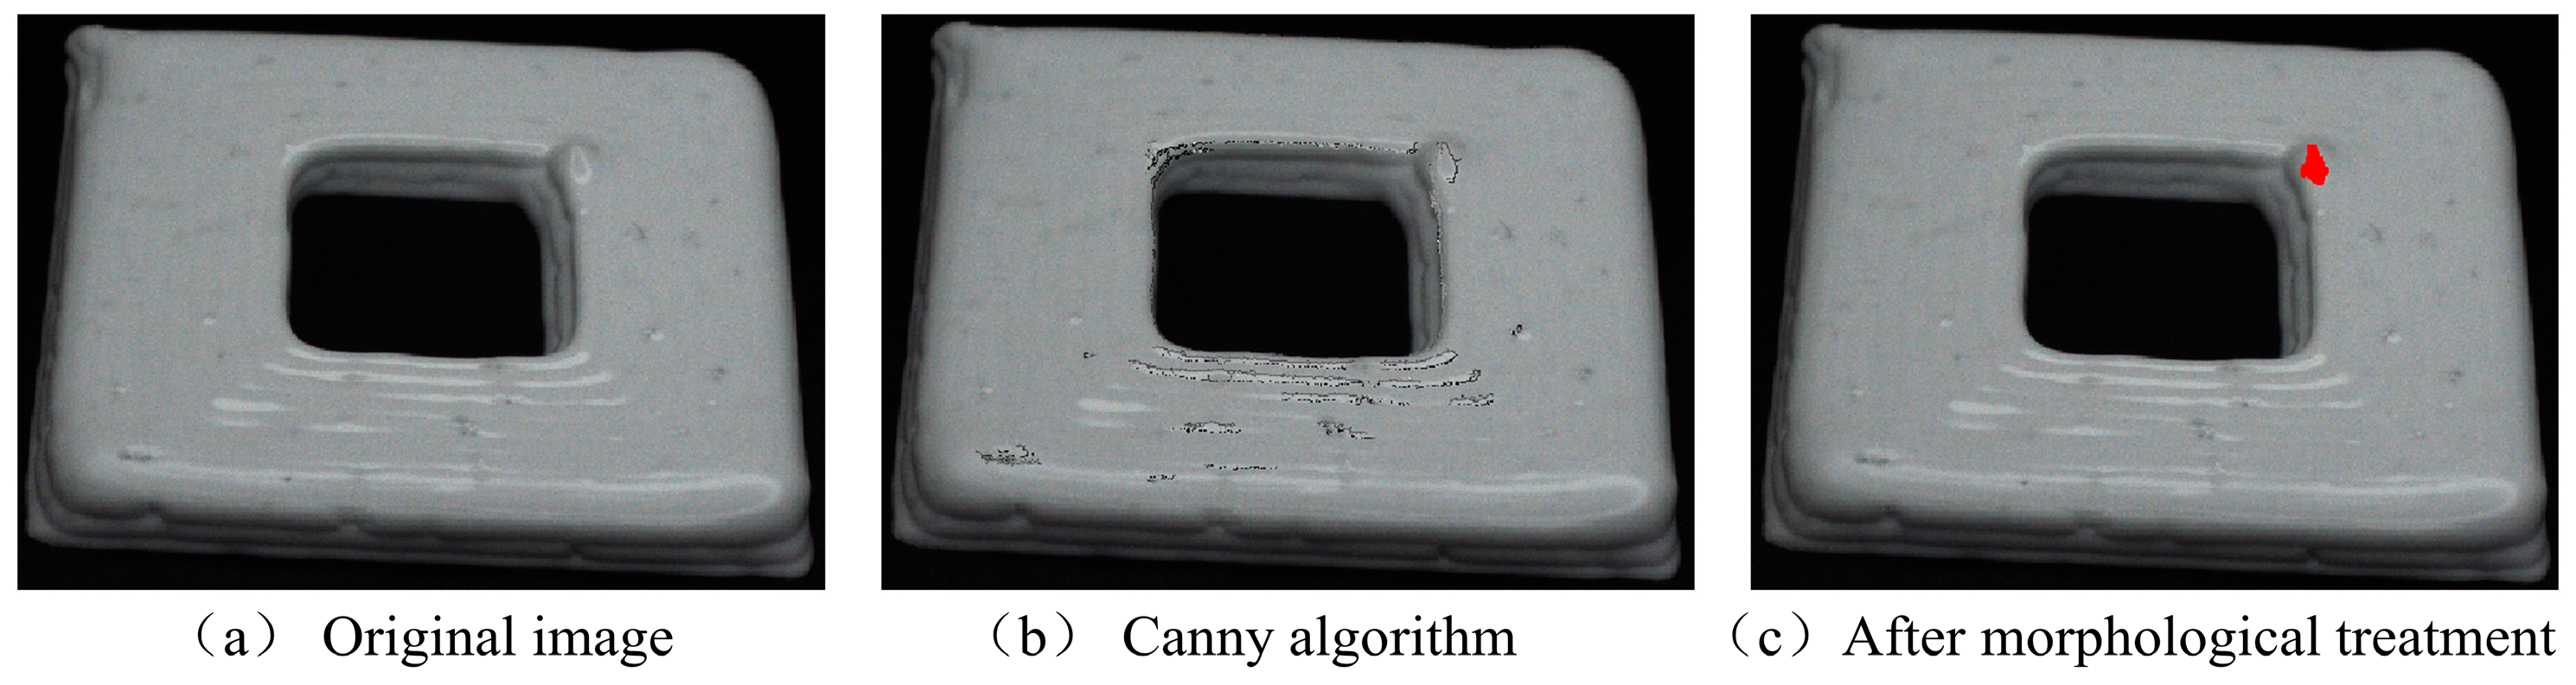
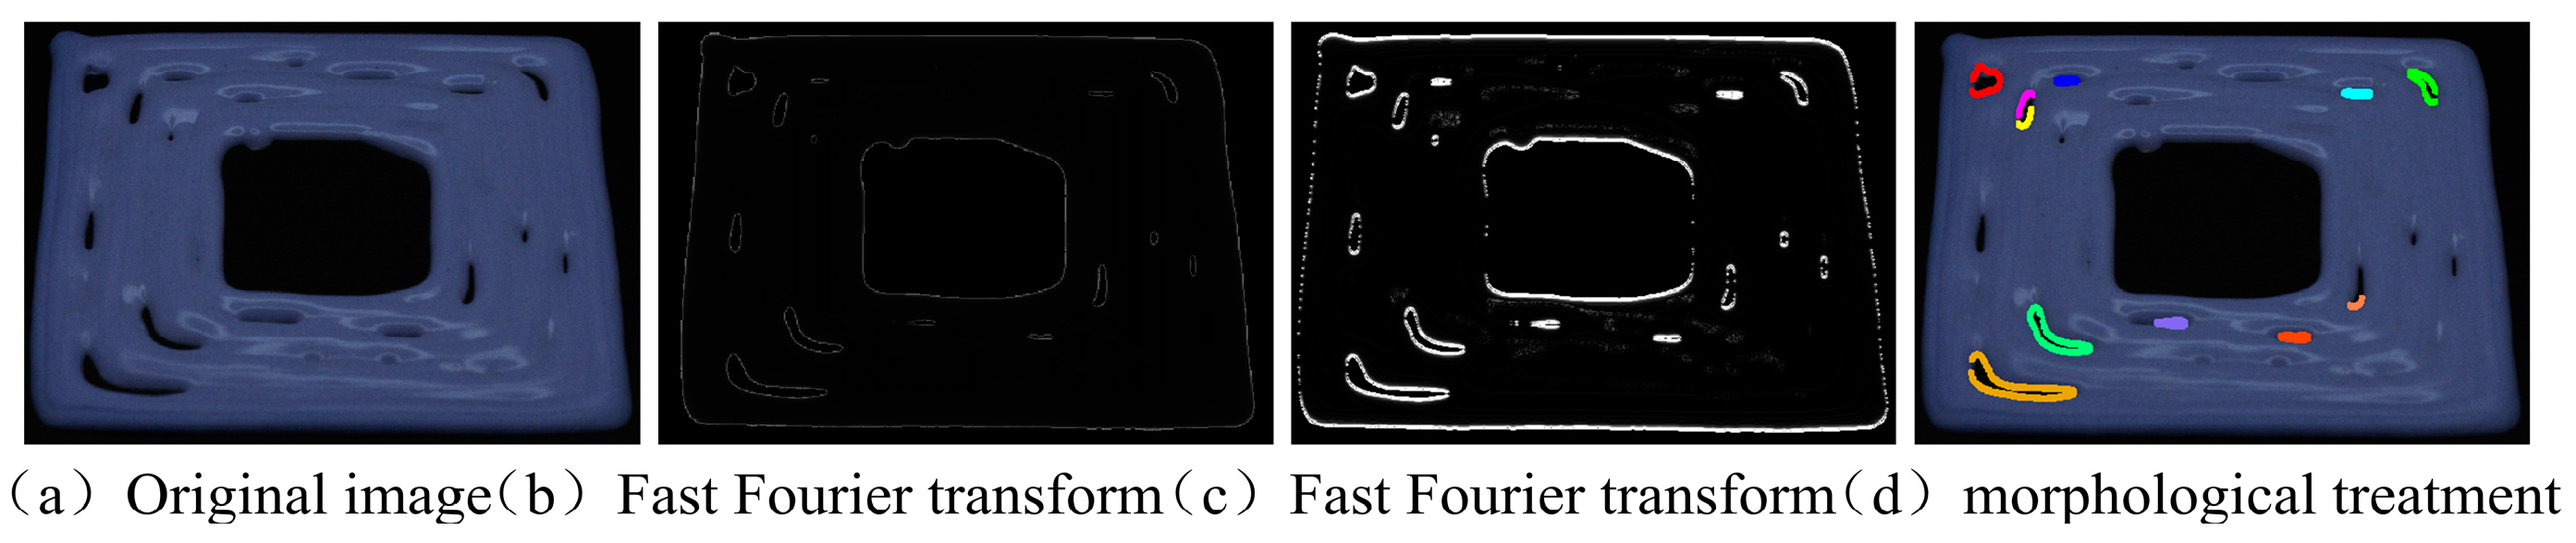
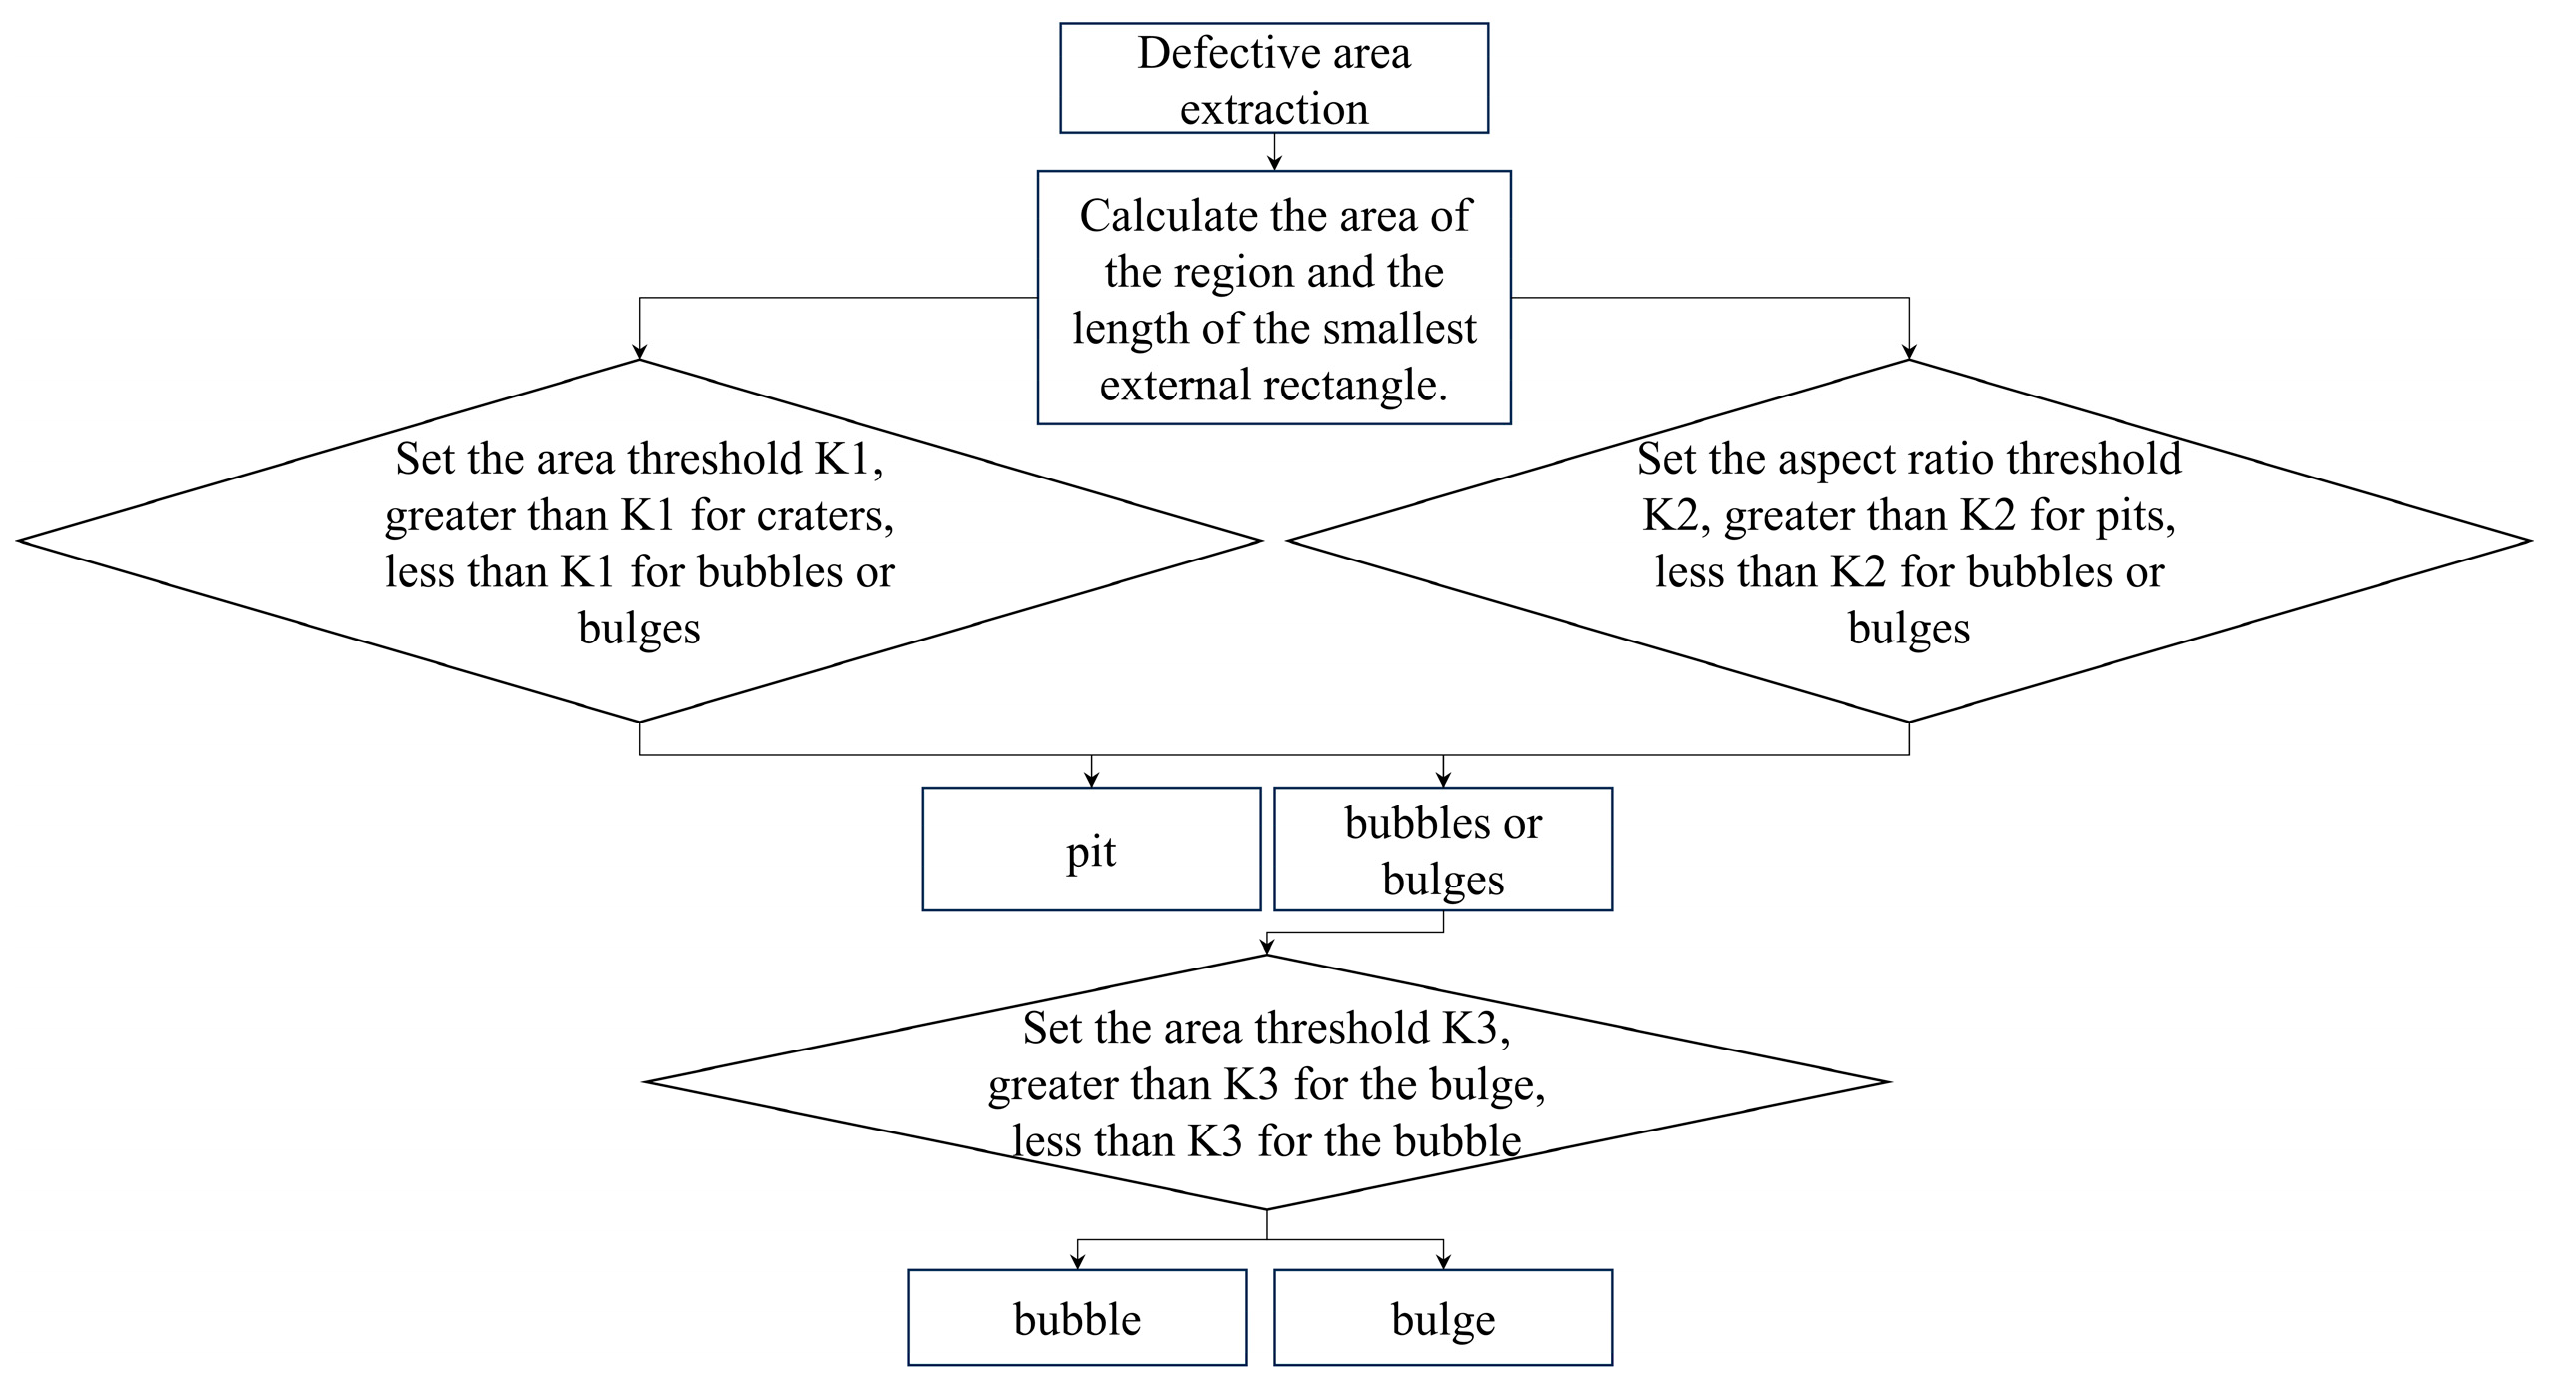
3.4. Defect Identification

The process of distinguishing between different types of defects based on their distinct properties and the outcomes of image processing is known as defect recognition [47]. After identifying the defective area, it is also necessary to distinguish the three kinds of defects again, and the flowchart of the identification of the three kinds of defects is shown in Figure 8.
Figure 8 shows the method of distinguishing three types of defects, mainly the double threshold distinction of area and geometric features. The area and aspect ratio dual threshold was used to distinguish between the categories of defects. First of all, the most obvious difference between the pit defects and bubbles and bulging defects is that the area is often much larger, because the cause of its generation is mostly missing filaments, broken filaments, and so on, and bubble defects generated by the slurry in the extrusion chamber and air mixing occur after bulging is generated by the printing process due to the extrusion of the head of the slurry occurring in a natural downward spiral. The reason for this is that during the printing process, the paste in the extruder head falls naturally, which leads to the stacking of the printing place that should be stopped. So, the first step is to distinguish between pit defects and the other two defects; the second step is the continued use of the area threshold to distinguish between the bubble and the drum package defects since bubble defects tend to be smaller than the area of the drum package defects and their shapes are more similar.

3.5. Distortion Correction

After the camera calibration, the conversion relationship between the pixel size and the actual size is obtained, but it is not yet possible to directly convert the size, and it is also necessary to carry out aberration correction. In the actual image acquisition process, the camera lens does not fully comply with the ideal model; according to the imaging principle of the camera, it is impossible to meet the lens and the imaging surface in a parallel state so it will lead to the generation of aberrations. The mathematical expression for radial distortion is shown in the following equation:
x ~ y ~ = 1 + k 1 r 2 + k 2 r 4 x y
k 1 and k 2 are the camera distortion coefficients and r 2 = x 2 + y 2 is the distance between the point in the image and the center of the imaging plane. From the above equation, it can be seen that with the increase in the off-center distance r 2 , the resulting distortion effect is more pronounced, and ( x ~ , y ~ ) is the true coordinate value of (x, y) that has been corrected for distortion. This leads to the coordinate representation in the case of distortion, as shown in the following equation:
u ~ v ~ = 1 + k 1 r 2 + k 2 r 4 u u 0 v v 0 + u 0 v 0
In the defect detection system designed in this study, the camera is placed at an angle, which leads to near large and far small dimensional errors in the two-dimensional plane, and the conventional distortion correction method is not sufficient to solve this problem, and thus a new method is also needed. A plane plate with 20 × 20 dots is generated and printed out, and the plate is placed on the printing platform, with the bottom of the plate parallel to the camera; the camera then captures an image, as shown in Figure 5, Figure 6, Figure 7, Figure 8 and Figure 9a. After the aberration correction, the image is preprocessed first, and the region of dots is segmented, and then two columns of dots are selected as identification points, and the pixel distance between them and one column of 18 and the actual distance are calculated, respectively. It is known that the theoretical distance should be 70 mm, and the converted actual distance and the theoretical distance are compared to this, as shown in Figure 9c, and the two groups of identification points are selected.
The calculated marking point measurements are shown in Table 2 below.
In Table 2, the first column refers to the rental number of the marker, the second column refers to the ROW pixel coordinates, the third column refers to the measured distance in the image coordinate system, the fourth column refers to the measured distance converted to the world coordinate system, the fifth column refers to the theoretical distance, and the sixth column refers to the ratio of the measured distance to the theoretical distance.
The obtained ratio is used as the output function, and the row coordinates of the center of each group of corresponding identification points are used as the input function, and then the Origin software is used for nonlinear fitting; the selected fitting function model is the ExpDecl type, and the fitting result is shown in the following formula:
y = B + A e x t
where A is 0.85111, B is 0.48265, and t is 99.44617. The measurement results are used to convert the function and calculate the error using the theoretical distance, as shown in Table 3 below.
In Table 3, the first column refers to the rental number of the marking point, the second column refers to the corrected measurement distance, the third column refers to the theoretical distance, and the fourth column refers to the error between the measured distance and the theoretical distance. As can be seen from the above table, this method has a good distortion correction effect for cameras placed obliquely.

3.6. Defect Matching Method Based on Geometric Features

In the process of defect identification, the possible features of the printed body itself will be misidentified as defects, so it is necessary to distinguish such features. In defect detection, the location, shape, and size of the defects are the three most critical pieces of information. Based on such parameters, the similarity of defects was evaluated by establishing a weighting function of the direct similarity of each parameter, which is shown in the following formula:
S O C P = β n α 1 l x m x n 2 + y m y n 2 l + α 2 r m r n r m r n r m r n + α 3 A m A n A m A n A m A n  
where S O C P (Similarity Evaluation of Contour Parameters) indicates the similarity of the defect parameters; x and y are the central coordinates representing the location of the defect; r is the aspect ratio that represents the shape of the defect; A is the area representing the defect; m is the defect number detected from the image; n is the feature number represented by the theoretical model; l is the error threshold of defect location, in pixels; α is the weight coefficient of each parameter of the defect; and β is the weight coefficient of the features in the theoretical model.
According to different environments and detection requirements, we can choose different thresholds and weighting coefficients. The error threshold l of defect localization is mainly used to match the error due to the precision of the hardware platform and extraction algorithms, etc. When the printing precision of the experimental platform is high, then a smaller positioning error threshold can be set; when the precision error is large, to avoid missing matches due to the harsh evaluation, it is necessary to adjust the positioning error threshold. The weight coefficient α of each parameter of the contour is mainly used to reconcile different environmental requirements, and the weight coefficients of each parameter can be set according to the requirements for positioning, shape, and area. The weight coefficient β of the theoretical model features is used to reconcile the errors of the theoretical model features, due to the existence of the camera calibration error in the experiment, which leads to the deviation of the received point coordinates and the camera direction in the feature extraction, so it is necessary to set different weight coefficients for each theoretical model feature.
In the study of the text, the parameters β n , α 1 , α 2 , α 3 , and l in the evaluation function were set to 1, 0.4, 0.3, 0.3, and 80, respectively. Thus, the closer the value of S O C P is to 1, the higher the similarity is, and the similarity reaches its maximum value when SOCP = 1 and is considered to be completely consistent. The SOCP value in this study was set to 0.6, i.e., a value greater than 0.6 is considered to be the original model’s characteristic. By setting the SOCP threshold, the flexibility of matching can be increased, effectively reducing the bias error caused by the subtle rotation and scaling of the image due to the platform’s micro-movements during printing, etc.
The theoretical model features and printed detected defects are shown in Figure 10 when this model is printed. Among them, the red-filled part of Figure 10b indicates the detected defects. In this study, the defects are mainly characterized by parameters such as center coordinates, aspect ratio, and area.
The characteristic information of Figure a in Figure 10 is shown in Table 4 below.
According to the similarity evaluation function in Equation (4), the calculation shows that there was only one pair of SOCP values greater than 0.6, which means that they have a high degree of similarity and belong to the printing model’s features, while the rest are printing defects. Therefore, the feature-based defect matching detection method can distinguish the model’s features from the real defects, and the similarity of the contours can be effectively evaluated by the weighting function of the similarity between each parameter to reduce the misdetection rate and improve the online detection accuracy.

4. Experimentation and Analysis

To verify the robustness of the above defect detection system, experiments were conducted to verify the analysis for surface defects. The defect detection system composition is shown in Figure 11. It mainly includes an 3D extrusion ceramic printer, a PC, an industrial camera, an industrial lens, a ring light source, a camera bracket, and the Halcon image processing software system. First of all, the external dimension defect experiment was conducted because the printer extrusion head exit diameter of 1.0 mm, shown results in a detection accuracy of 0.1 mm, can be accurately derived from the measurement results.
As the selected sensor chip size was 7.2 mm × 5.4 mm, the pixel size was 1.85 μm × 1. 85 μm, the longest field of view distance at the far end was selected according to the camera’s tilt placement; the longest field of view distance was 201.5 mm, the lens magnification was calculated to be 0.0357, and the pixel size is divided by the magnification to obtain the minimum detection accuracy of 0.051 mm, which meets the detection accuracy requirements of this study.
In this study, we designed one of the most commonly used zigzag path planning methods and left a rectangular bore in the center of the printed sample to test whether the inspection system will detect it as a defect. The experiments on surface defects were carried out by printing six layers, capturing images of each layer for detection. A total of 30 sets of experiments were carried out, with a total of 180 images captured, and the results are shown in Table 5. This paper presents the experimental results in terms of a confusion matrix to determine the robustness of the defect detection model in terms of recall, which is also known as the true positive rate (TPR) for defective samples, and precision (PPV), which is also known as the positive predictive value (PPV) for samples that are predicted to be defective and reflects how many of the samples that are predicted to be defective are correct. Both recall and accuracy are important metrics for determining the robustness of a defect detection model and can prove that the defect detection model is correct [48,49,50,51]. The formulas for bubble recall and precision are shown below:
T P R = T 1 P 1 T 1 P 1 + F 1 P 2 + F 1 P 3 + F 1 P 4
P P V = T 1 P 1 T 1 P 1 + F 2 P 1 + F 3 P 1 + F 4 P 1
where T 1 P 1 indicates the result of a bubble defect detected as a bubble defect, F 1 P 2 indicates the result of a bubble defect detected as a pit defect, F 1 P 3 indicates the result of a bubble defect detected as a bulge, F 1 P 4 indicates the result of a bubble defect detected as a normal sample, F 2 P 1 indicates the result of a pit defect detected as a bubble defect, F 3 P 1 indicates the result of a bulge defect detected as a bubble defect, and F 4 P 1 indicates the result of a normal sample detected as a bubble defect.
There may be multiple images in one image, and only the images with a single defect are analyzed in Table 5 for the purpose of controlling the variables and judging whether the recognition error of the inspection system has a large impact.
As shown in the table above, bubble defects were partially detected as normal samples, which may be due to the bubble being too small; bulging defects were partially detected as bubble defects, which may be due to the bulge being too small. Out of a total of 180 samples, 175 groups were correctly identified, and 5 groups were incorrectly identified; the overall correct detection result was 97.2%, which is in line with the detection requirements. A part of the sample detection results is shown in Figure 12.
Since there were fewer bulging defects, 100 detected pit defects were randomly selected to detect the size of the width of the pit in pixels, and 100 bubble defects were randomly selected to detect the size of the area of the bubble in pixels; the experimental results are shown in Figure 13a,b.
According to the hardware parameters and calibration results, the width of a pit was estimated to be 10~30 pixels; a width less than 10 pixels was not regarded as a defect and can be filled through the material’s properties; and a width greater than 30 pixels was regarded as too large and the printing should be stopped. The size of a bubble area should be 30~200 pixels; an area less than 30 pixels was not considered a defect, and through the material's properties, it can be filled; and an area greater than 200 pixels was considered to be pit defects that were mistakenly detected as bubble defects and was subsumed in the pit defect processing. The detection time of 50 groups of pit defects and 50 groups of bubble defects can be analyzed. As shown in Figure 13c, it can be seen that it took less than 1S to complete the detection of individual defects using the configuration of an Intel(R) Core(TM) i7-6700HQ CPU @ 2.60GHz. It can be inferred that the single detection time of the whole system is around 4S, which is in line with the design and application requirements.

5. Discussion

In this study, we completed the research on a defect detection system for ceramic 3D printing based on machine vision and developed a defect detection device based on a 3D extrusion ceramic printer, and we found that the molding quality of the 3D printing was significantly improved. In the introduction, the research performed by others has been aimed at the spatial layout and the detection method, with the main purpose being improving the detection efficiency and improving the printing quality. The detection system studied in this paper not only improves the spatial layout, but also does not misidentify its own features as defects when detecting defects and has stronger robustness. The test results obtained after the experiment also prove that the system significantly improves the detection efficiency of 3D printing.
Compared with the existing optimization methods, the camera layout designed in this study avoids the conflict between the positions of the camera and printer’s extrusion head in space, and secondly, the existing method does not mistakenly identify the features of the printing body itself as defects, which is very important.

6. Conclusions

To solve the problem that defects cannot be detected in the process of extrusion molding ceramic 3D printing, a real-time online inspection system was designed for extrusion molding ceramic 3D printers, and its inspection method can automatically identify, analyze, and locate defects that occur during the printing process. The main conclusions are as follows:
  • In order to ensure that the system captures high-quality images during operation, a machine vision-based defect detection system for ceramic 3D printing and a machine vision clamping device for 3D printers were designed. The system was applied to extrusion molding ceramic 3D printers and can realize real-time detection; in addition, the system can automatically identify the type of defects and feedback to the control system to make different adjustments according to the size of the defects. These are two major differences between this system and other vision inspection equipment used in the industry.
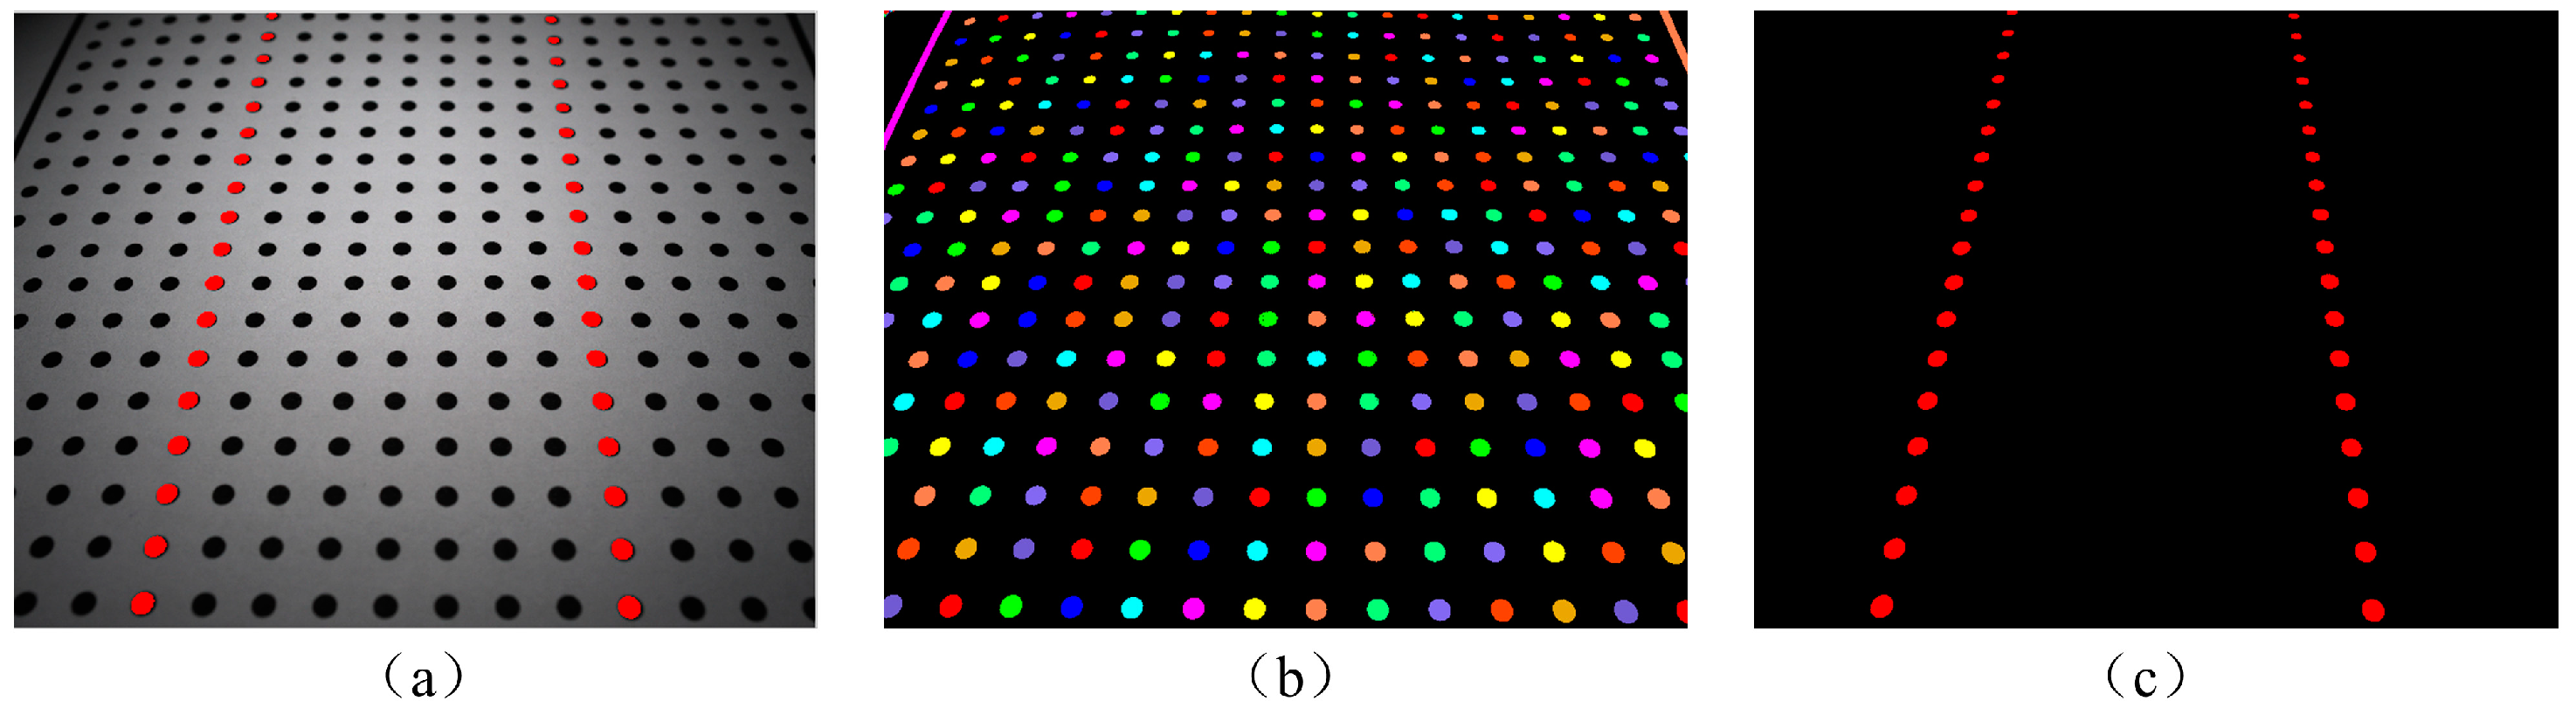
  • In this study, the camera in the image acquisition device was placed in a tilted position, which is different from the conventional vertical placement, so when performing the aberration correction, firstly, a diagram full of marking points is placed, and then the distance of the corresponding marking points is measured, and then an analysis is performed with the actual distance. The data fitting method is subsequently carried out to perform the aberration correction, and the results show that this method has a particularly good effect of image correction to account for the tilted placement of the camera.
  • The experimental verification showed that the system designed in this study had a detection accuracy of 97.2% and could also define the size of defects, and feed back different results based on the size of the defect. At the same time, based on the characteristics of the defects, the evaluation method of the weighting function is introduced to distinguish between the characteristics of the printing blank itself and the printing defects. From the results, it can be seen that this system for 3D printers greatly improves the print quality while reducing the consumption cost. However, due to the limitations of the experiment and the fact that ceramic 3D printing requires numerous steps such as post-processing in addition to printing blanks, the system has not yet been used for industrial production, leaving a large amount of unexplored research space.

Author Contributions

J.Z.: conceptualization, methodology, formal analysis, investigation, and writing—original draft; H.L.: conceptualization, methodology, formal analysis, investigation, and writing—original draft; L.L.: conceptualization, funding acquisition, writing—review and editing, and project administration. Y.C.: conceptualization, methodology, formal analysis, investigation, and writing—original draft. All authors have read and agreed to the published version of the manuscript.

Funding

This research was funded by the Ying Cheng OF National Science Fund for Distinguished Young Scholars, grant number 61705166.

Data Availability Statement

The authors of this article are willing to provide all data supporting this study upon reasonable request.

Conflicts of Interest

Author Lin Lu was employed by the Tianjin Research Institute of Electric Science Co., Ltd. The remaining authors declare that the research was conducted in the absence of any commercial or financial relationships that could be construed as a potential conflict of interest.

References

  1. Jang, S.; Park, S.; Bae, C.-J. Development of ceramic additive manufacturing: Process and materials technology. Biomed. Eng. Lett. 2020, 10, 493–503. [Google Scholar] [CrossRef]
  2. Lakhdar, Y.; Tuck, C.; Binner, J.; Terry, A.; Goodridge, R. Additive manufacturing of advanced ceramic materials. Prog. Mater. Sci. 2021, 116, 100736. [Google Scholar] [CrossRef]
  3. Guan, Z.; Yang, X.; Liu, P.; Xu, X.; Li, Y.; Yang, X. Additive manufacturing of zirconia ceramic by fused filament fabrication. Ceram. Int. 2023, 49, 27742–27749. [Google Scholar] [CrossRef]
  4. Wang, G.; Wang, S.; Dong, X.; Zhang, Y.; Shen, W. Recent progress in additive manufacturing of ceramic dental restorations. J. Mater. Res. Technol. 2023, 26, 1028–1049. [Google Scholar] [CrossRef]
  5. Wolf, A.; Rosendahl, P.L.; Knaack, U. Additive manufacturing of clay and ceramic building components. Autom. Constr. 2022, 133, 103956. [Google Scholar] [CrossRef]
  6. Esteves, A.V.; Martins, M.I.; Soares, P.; Rodrigues, M.; Lopes, M.; Santos, J. Additive manufacturing of ceramic alumina/calcium phosphate structures by DLP 3D printing. Mater. Chem. Phys. 2022, 276, 125417. [Google Scholar] [CrossRef]
  7. Freudenberg, W.; Wich, F.; Langhof, N.; Schafföner, S. Additive manufacturing of carbon fiber reinforced ceramic matrix composites based on fused filament fabrication. J. Eur. Ceram. Soc. 2022, 42, 1822–1828. [Google Scholar] [CrossRef]
  8. He, R.; Zhou, N.; Zhang, K.; Zhang, X.; Zhang, L.; Wang, W.; Fang, D. Progress and challenges towards additive manufacturing of SiC ceramic. J. Adv. Ceram. 2021, 10, 637–674. [Google Scholar] [CrossRef]
  9. Sun, J.; Ye, D.; Zou, J.; Chen, X.; Wang, Y.; Yuan, J.; Liang, H.; Qu, H.; Binner, J.; Bai, J. A review on additive manufacturing of ceramic matrix composites. J. Mater. Sci. Technol. 2023, 138, 1–16. [Google Scholar] [CrossRef]
  10. Nowicki, M.; Sheward, S.; Zuchowski, L.; Addeo, S.; States, O.; Omolade, O.; Andreen, S.; Ku, N.; Vargas-Gonzalez, L.; Bennett, J. Additive Manufacturing with Ceramic Slurries. In Proceedings of the ASME 2022 International Mechanical Engineering Congress and Exposition, Columbus, Ohio, USA, 30 October–3 November 2022. [Google Scholar] [CrossRef]
  11. Ou, J.; Huang, M.; Wu, Y.; Huang, S.; Lu, J.; Wu, S. Additive manufacturing of flexible polymer-derived ceramic matrix composites. Virtual Phys. Prototyp. 2022, 18, e2150230. [Google Scholar] [CrossRef]
  12. Hur, H.; Park, Y.J.; Kim, D.-H.; Ko, J.W. Material extrusion for ceramic additive manufacturing with polymer-free ceramic precursor binder. Mater. Des. 2022, 221, 110930. [Google Scholar] [CrossRef]
  13. Nefedovaa, L.; Ivkov, V.; Sychov, M.; Diachenko, S.; Gravit, M. Additive manufacturing of ceramic insulators. Mater. Today Proc. 2020, 30, 520–522. [Google Scholar] [CrossRef]
  14. Alammar, A.; Kois, J.C.; Revilla-León, M.; Att, W. Additive Manufacturing Technologies: Current Status and Future Perspectives. J. Prosthodont. 2022, 31, 4–12. [Google Scholar] [CrossRef]
  15. Rani, P.; Deshmukh, K.; Thangamani, J.G.; Pasha, S.K. Additive Manufacturing of Ceramic-Based Materials. In Nanotechnology-Based Additive Manufacturing: Product Design, Properties and Applications; Wiley: Hoboken, NJ, USA, 2022; Volume 2, pp. 131–160. [Google Scholar] [CrossRef]
  16. Rahman, M.A.; Saleh, T.; Jahan, M.P.; McGarry, C.; Chaudhari, A.; Huang, R.; Tauhiduzzaman, M.; Ahmed, A.; Al Mahmud, A.; Bhuiyan, S.; et al. Review of Intelligence for Additive and Subtractive Manufacturing: Current Status and Future Prospects. Micromachines 2023, 14, 508. [Google Scholar] [CrossRef] [PubMed]
  17. Dadkhah, M.; Tulliani, J.-M.; Saboori, A.; Iuliano, L. Additive manufacturing of ceramics: Advances, challenges, and outlook. J. Eur. Ceram. Soc. 2023, 43, 6635–6664. [Google Scholar] [CrossRef]
  18. Landgraf, J. Computer vision for industrial defect detection. In Proceedings of the 20th International Conference on Sheet Metal, Erlangen-nürnberg, Germany, 2–5 April 2023. [Google Scholar] [CrossRef]
  19. Liu, Z.; Qu, B. Machine vision based online detection of PCB defect. Microprocess. Microsyst. 2021, 82, 103807. [Google Scholar] [CrossRef]
  20. Koubaa, S.; Baklouti, M.; Mrad, H.; Frikha, A.; Zouari, B.; Bouaziz, Z. Defect Detection in Additive Manufacturing Using Computer Vision Monitoring. In Proceedings of the International Conference Design and Modeling of Mechanical Systems, Hammamet, Tunisia, 20–22 December 2021; pp. 285–290. [Google Scholar] [CrossRef]
  21. Suo, X.; Liu, J.; Dong, L.; Shengfeng, C.; Enhui, L.; Ning, C. A machine vision-based defect detection system for nuclear-fuel rod groove. J. Intell. Manuf. 2021, 33, 1649–1663. [Google Scholar] [CrossRef]
  22. Ren, Z.; Fang, F.; Yan, N.; Wu, Y. State of the Art in Defect Detection Based on Machine Vision. Int. J. Precis. Eng. Manuf. Technol. 2021, 9, 661–691. [Google Scholar] [CrossRef]
  23. Zeng, X.; Qi, Y.; Lai, Y. Fuzzy System for Image Defect Detection Based on Machine Vision. Int. J. Manuf. Technol. Manag. 2022, 1, 1. [Google Scholar] [CrossRef]
  24. Zhang, S.; Chen, Z.; Granland, K.; Tang, Y.; Chen, C. Machine Vision-Based Scanning Strategy for Defect Detection in Post-Additive Manufacturing. In Proceedings of the International Conference on Variability of the Sun and Sun-Like Stars: From Asteroseismology to Space Weather, Melbourne, VIC, Australia, 31 October–2 November. 2022; pp. 271–284. [Google Scholar] [CrossRef]
  25. Dong, G.; Sun, S.; Wang, Z.; Wu, N.; Huang, P.; Feng, H.; Pan, M. Application of machine vision-based NDT technology in ceramic surface defect detection—A review. Mater. Test. 2022, 64, 202–219. [Google Scholar] [CrossRef]
  26. Paraskevoudis, K.; Karayannis, P.; Koumoulos, E.P. Real-Time 3D Printing Remote Defect Detection (Stringing) with Computer Vision and Artificial Intelligence. Processes 2020, 8, 1464. [Google Scholar] [CrossRef]
  27. Khan, M.F.; Alam, A.; Siddiqui, M.A.; Alam, M.S.; Rafat, Y.; Salik, N.; Al-Saidan, I. Real-time defect detection in 3D printing using machine learning. Mater. Today Proc. 2021, 42, 521–528. [Google Scholar] [CrossRef]
  28. Khandpur, M.S.; Galati, M.; Minetola, P.; Marchiandi, G.; Fontana, L.; Stiuso, V. Development of a low-cost monitoring system for open 3D printing. IOP Conf. Series Mater. Sci. Eng. 2021, 1136, 012044. [Google Scholar] [CrossRef]
  29. Ishikawa, S.-i.; Tasaki, R. Visual Feedback Control of Print Trajectory in FDM-Type 3D Printing Process. In Proceedings of the 2023 8th International Conference on Control and Robotics Engineering (ICCRE), Niigata, Japan, 21–23 April 2023. [Google Scholar] [CrossRef]
  30. Bai, R.; Jiang, N.; Yu, L.; Zhao, J. Research on Industrial Online Detection Based on Machine Vision Measurement System. J. Physics Conf. Ser. 2021, 2023, 012052. [Google Scholar] [CrossRef]
  31. Fang, T.; Jafari, M.A.; Danforth, S.C.; Safari, A. Signature analysis and defect detection in layered manufacturing of ceramic sensors and actuators. Mach. Vis. Appl. 2010, 15, 63–75. [Google Scholar] [CrossRef]
  32. Sitthi-Amorn, P.; Ramos, J.E.; Wang, Y. MultiFab: A machine vision-assisted platform for multi-material 3D printing. Acm Trans. Graph. 2015, 34, 1–11. [Google Scholar] [CrossRef]
  33. Wu, M.; Phoha, V.V.; Moon, Y.B. Detecting malicious defects in 3d printing process using machine learning and image classification. In Proceedings of the ASME 2016 International Mechanical Engineering Congress and Exposition, Phoenix, AZ, USA, 11–17 November 2016; pp. 4–10. [Google Scholar]
  34. Straub, J. Initial Work on the Characterization of Additive Manufacturing (3D Printing) Using Software Image Anlysis. Machines 2015, 3, 55–71. [Google Scholar] [CrossRef]
  35. Oliver, H.; Dong, L.X. In situ real time defect detection of 3D printed parts. Addit. Manuf. 2017, 17, 135–142. [Google Scholar]
  36. Dabbagh, S.R.; Ozcan, O.; Tasoglu, S. Machine learning-enabled optimization of extrusion-based 3D printing. Methods 2022, 206, 27–40. [Google Scholar] [CrossRef]
  37. Sampedro, G.A.R.; Rachmawati, S.M.; Kim, D.-S.; Lee, J.-M. Exploring Machine Learning-Based Fault Monitoring for Polymer-Based Additive Manufacturing: Challenges and Opportunities. Sensors 2022, 22, 9446. [Google Scholar] [CrossRef] [PubMed]
  38. Bai, T.; Gao, J.; Yang, J.; Yao, D. A Study on Railway Surface Defects Detection Based on Machine Vision. Entropy 2021, 23, 1437. [Google Scholar] [CrossRef] [PubMed]
  39. Xiao, Z.; Wang, J.; Han, L.; Guo, S.; Cui, Q. Application of Machine Vision System in Food Detection. Front. Nutr. 2022, 9, 888245. [Google Scholar] [CrossRef]
  40. Huang, Y.-C.; Hung, K.-C.; Lin, J.-C. Automated Machine Learning System for Defect Detection on Cylindrical Metal Surfaces. Sensors 2022, 22, 9783. [Google Scholar] [CrossRef]
  41. Lin, Y.; Ma, J.; Wang, Q.; Sun, D.-W. Applications of machine learning techniques for enhancing nondestructive food quality and safety detection. Crit. Rev. Food Sci. Nutr. 2023, 63, 1649–1669. [Google Scholar] [CrossRef] [PubMed]
  42. Yu, N.; Li, H.; Xu, Q. A full-flow inspection method based on machine vision to detect wafer surface defects. Math. Biosci. Eng. 2023, 20, 11821–11846. [Google Scholar] [CrossRef]
  43. Zhang, D.; Zhou, F.; Yang, X.; Gu, Y. Unleashing the Power of Self-Supervised Image Denoising: A Comprehensive Review. arXiv (Cornell University). arXiv 2023, arXiv:2308.00247. [Google Scholar] [CrossRef]
  44. Patel, K.K.; Kar, A.; Khan, M.A. Monochrome computer vision for detecting common external defects of mango. J. Food Sci. Technol. 2021, 58, 4550–4557. [Google Scholar] [CrossRef]
  45. Ooi, A.Z.H.; Embong, Z.; Hamid, A.I.A.; Zainon, R.; Wang, S.L.; Ng, T.F.; Hamzah, R.A.; Teoh, S.S.; Ibrahim, H. Interactive Blood Vessel Segmentation from Retinal Fundus Image Based on Canny Edge Detector. Sensors 2021, 21, 6380. [Google Scholar] [CrossRef]
  46. Pan, B.; Tao, J.; Bao, X.; Xiao, J.; Liu, H.; Zhao, X.; Zeng, D. Quantitative Study of Starch Swelling Capacity during Gelatinization with an Efficient Automatic Segmentation Methodology. Carbohydr. Polym. 2020, 255, 117372. [Google Scholar] [CrossRef]
  47. Lin, J.; Guo, T.; Yan, Q.F.; Wang, W. Image segmentation by improved minimum spanning tree with fractional differential and Canny detector. J. Algorithms Comput. Technol. 2019, 13, 1748302619873599. [Google Scholar] [CrossRef]
  48. Cao, J.; Chen, L.; Wang, M.; Tian, Y. Implementing a Parallel Image Edge Detection Algorithm Based on the Otsu-Canny Operator on the Hadoop Platform. Comput. Intell. Neurosci. 2018, 2018, 3598284. [Google Scholar] [CrossRef] [PubMed]
  49. Vaibhav, V. Fast inverse nonlinear Fourier transform. Phys. Rev. E 2018, 98, 013304. [Google Scholar] [CrossRef] [PubMed]
  50. Yang, X.; Bist, R.B.; Subedi, S.; Chai, L. A Computer Vision-Based Automatic System for Egg Grading and Defect Detection. Animals 2023, 13, 2354. [Google Scholar] [CrossRef] [PubMed]
  51. Li, Y.; Wang, H.; Dang, L.M.; Song, H.-K.; Moon, H. Vision-Based Defect Inspection and Condition Assessment for Sewer Pipes: A Comprehensive Survey. Sensors 2022, 22, 2722. [Google Scholar] [CrossRef]
Figure 1. Overall system design.
Machines 12 00166 g001
Figure 2. Types of defects.
Machines 12 00166 g002
Figure 3. Defect detection flowchart.
Machines 12 00166 g003
Figure 4. Image positioning.
Machines 12 00166 g004
Figure 5. Morphological processing treatment.
Machines 12 00166 g005
Figure 6. Canny edge detection results.
Machines 12 00166 g006
Figure 7. Fast Fourier transform.
Machines 12 00166 g007
Figure 8. Defect identification flowchart.
Machines 12 00166 g008
Figure 9. Marker point selection. (a) indicates the identification point to be extracted, (b) indicates all identification points to be extracted, and (c) indicates the identification point to be extracted.
Machines 12 00166 g009
Figure 10. Theoretical model characteristics and print detection defects. (a) is its own characteristics, (b) is the characteristics and defects.
Machines 12 00166 g010
Figure 11. Defect detection system composition.
Machines 12 00166 g011
Figure 12. Detection effect.
Machines 12 00166 g012
Figure 13. Experimental results.
Machines 12 00166 g013
Table 1. Hardware system parameters.
HardwareParameters
Industrial camerasModel: MV-CE120-10UC; Interface: USB3.0; Resolution: 4000 × 3036; Pixel size: 1.85 μm × 1.85 μm; Target size: 1/1.7; Frame rate: 31.9 fps; Camera interface: C-Mount; Sensor chip type: CMOS; Exposure time: 30 μs~0.5 s; Spectrum: color
Industrial lensesModel: MVL-HF0624M-10MP; Focal length: 8 mm; Target size: 1/1.8; Closest shooting distance: 0.1 m; Interface: C; Aperture range: F 2.4~F 16
Toroidal light sourcesModel: MV-LRDS-120-70-W; Color temperature: 6000~7000 K; Power: 13.7 W; Outside diameter of luminous surface: 109.8 mm
Table 2. The point measurements.
Identification Points (Group)Row (Pixel)Measured Distance (Pixel)Actual Distance (mm)Theoretical Distance (mm)Ratio (0.001)
10.8497671392.2452.7419700.753
24.71131427.554.0778700.772
38.758671464.2655.4702700.792
413.04731503.7756.9672700.813
517.61331544.8758.524700.836
622.35761589.5660.217700.860
727.30871636.1961.9834700.885
832.56681687.2163.9163700.913
938.07531740.2965.9271700.941
1044.0541797.6268.0988700.972
1150.42991857.1770.355701.005
1257.31191921.9172.8074701.040
1364.61591990.4775.4048701.077
1472.53582066.4178.2814701.118
1580.98072146.8381.328701.161
1690.19942234.9584.6664701.209
17100.0952328.8488.2232701.260
18110.8612430.3792.0694701.315
Table 3. Identification point error.
Identification Points (Group)Actual Distance (mm)Theoretical Distance (mm)Error (mm)Identification Points (Group)Actual Distance (mm)Theoretical Distance (mm)Error (mm)
169.9631700.03691070.0844700.0844
269.9971700.00291170.0186700.0186
370.0037700.00371269.964700.036
470.019700.0191369.906700.094
569.972700.0281469.9096700.0904
669.996700.0041569.913700.087
770.003700.0031669.9569700.0431
870.0571700.05711770.0244700.0244
970.0819700.08191870.1387700.1387
Table 4. Theoretical model feature information.
Theoretical ModelArea (Pixel)Row (Pixel)Column (Pixel)Length 1 (Pixel)Length 2 (Pixel)
182,49210372245362256
Table 5. Feature parameters.
Actual CategoryTest ResultsTPRPPV
BubblePitBulgeNormal
Bubble2500196%100%
Pit04902100%96%
Bulge1113086%93%
Normal00088100%100%
Disclaimer/Publisher’s Note: The statements, opinions and data contained in all publications are solely those of the individual author(s) and contributor(s) and not of MDPI and/or the editor(s). MDPI and/or the editor(s) disclaim responsibility for any injury to people or property resulting from any ideas, methods, instructions or products referred to in the content.

