Article

Influence of Upstream Sweeping Wake Number on the Unsteady Flow Mechanism in an Integrated Aggressive Intermediate Turbine Duct

1
Research Center of Fluid Machinery Engineering and Technology, Jiangsu University, Zhenjiang 212013, China
2
Key Laboratory of Light-Duty Gas Turbine, Institute of Engineering Thermophysics, Chinese Academy of Sciences, Beijing 100190, China
3
University of Chinese Academy of Sciences, Beijing 100049, China
*
Author to whom correspondence should be addressed.
Machines 2023, 11(7), 728; https://doi.org/10.3390/machines11070728
Submission received: 23 May 2023 / Revised: 29 June 2023 / Accepted: 7 July 2023 / Published: 10 July 2023
(This article belongs to the Special Issue Aerodynamic Design and Optimization for Turbomachinery)

Abstract

:
This paper focuses on the dynamic internal flow in the integrated aggressive intermediate turbine duct (AITD) with different HPT wake numbers, using CFX Solver with dynamic Reynolds-averaged Navier–Stokes equations (RANS), the shear stress transmission κ-ω turbulence model (SST) and the γ-θ transition model. The HPT wakes are simulated using sweeping rods, with the number of rods ranging from 14 to 56 and a reduced frequency of 1.07. The increasing wake number reduces the radial pressure gradient in the integrated AITD, and then decelerates the radial migration and dissipation of wake vortices, so that some residual wakes can reach the integrated low-pressure turbine guide vane (LPT-GV) to enhance the suppression of flow separation to a certain extent. On the other hand, the increase in wake number can also weaken the skewness and stretching of the wake, thereby increasing the duration of flow separation suppression. When there are too many wakes, the mixing between adjacent wakes accelerates the dispersion of wake vortices, leading to increased total pressure loss and an enhanced turbulence intensity. This enhanced turbulence intensity promotes bypass transition on the suction surface of the LPT-GV in advance, thereby completely eliminating flow separation on the LPT-GV in the entire spatiotemporal domain, which is beneficial for reducing separation loss, but also increasing turbulent viscous loss. When N ≤ 28, the gross loss of the integrated AITD studied in this paper reaches a minimum value (around 0.22), as the benefits brought by the wake suppression of flow separation can offset the wake dissipation loss and the turbulent viscous loss caused by the wake-induced transition. Considering that wake loss is inherently present, using sweeping wakes to inhibit the flow separation on the integrated LPT-GV can bring certain aerodynamic benefits when the wake number is less than 28.

1. Introduction

An interturbine turbine duct (ITD) refers to an S-shaped annular duct connecting a high-pressure turbine (HPT) and low-pressure turbine (LPT). To decrease the engine weight and enhance the dynamic characteristics of the LPT rotor, aggressive intermediate turbine ducts (AITD) with larger area ratios, shorter axial lengths and larger radial spans are now widely used.
Dominy et al. [1,2] used swirling vanes to simulate HPT wakes and found that the wakes produced by these vanes were comparable to those of HPT in terms of range and strength. They also pointed out that even two-dimensional wakes would lead to changes in the secondary flow structure and loss distribution within the ITD. Bailey et al. [3] discovered through experimental research that the inlet swirl angle affects the flow velocity, but the tangential momentum in the ITD of the pipeline is conserved. Arroyo [4] studied the flow field and performance under ITD design and non-design conditions, and found that flow separation occurred inside the low-pressure turbine guide under non-design conditions. Spataro et al. [5] simulated a transonic turbine flow experiment and installed two small support plates in the ITD to provide more suitable inlet conditions for the low-pressure turbine. Zhang and Hu [6] further investigated the influence of turbulence intensity and inlet swirl on the internal flow of the ITD and found that a pair of strong counter-rotating vortices would form in the ITD, and the hub boundary layer would gradually develop into a three-dimensional boundary layer, due to the radial pressure gradient. Miller et al. [7] indicated that the radial migration and flow mixing between the casing and the middle channel caused the main loss in the ITD. Zhang et al. [8] discovered that the increasing inlet/outlet area ratio and raised angle of the ITD would lead to an increase in its internal adverse pressure gradient, resulting in boundary layer separation. Norris et al. [9] found that both the expansion ratio of the ITD and the strength of upstream wakes are important to its internal secondary flow vortex structure and size. Wallin and Eriksson [10] used the response surface algorithm to optimize and design an S-shaped transition section for high- and low-pressure turbines, and then they found that the ITD channel was occupied by various vortices on the HPT suction surface due to the interaction between tip leakage flow and passage flow. Axelsson [11] and Göttlich [12] pointed out that the tip clearance variation of the HPT blade row is a significant factor affecting the internal flow in the ITD.
Marn et al. [13] first proposed the integrated design concept of coupling the ITD and LPT-GV, using the strut to replace the LPT-GV to improve the ITD outlet flow quality. The 20–39% weight of the guide vane can also be decreased by adopting this design concept. The small blades were also arranged between large struts integrated in the ITD to further improve the uniformity of its outlet flow [14]. Bader [15] and Faustman [16] used the filters integrated in the ITD to improve outlet flow uniformity and suppress flow instability at the LPT inlet. Wang [17] and Xu [18] pointed out that the integrated wide-chord struts changed the radial and circumferential pressure gradients within the ITD, resulting in the inhibition of the boundary layer separation on the casing and a reduction in flow loss.
As the space between the HPT and the integrated LPT-GV is decreased in the integrated AITD, the HPT wake reaching the LPT-GV becomes an important factor affecting the internal flow of the ITD. Hodson [19] found that unsteady wakes can promote early boundary layer transition on LPT blades, thereby suppressing flow separation. Subsequently, a large number of studies [20] revealed the influencing mechanism of the sweeping wake on the boundary layer development of the linear cascade. However, compared with the upstream wake propagation in the planar cascade, its evolution in AITD will be influenced by the strong axial inverse pressure gradient and circumferential pressure gradients. In recent years, research on the turbine transition section has not been limited to this. Geng et al. [21] used the dynamic mode decomposition method to capture the disturbance modes caused by upstream wake, and studied the coupling effect between the upstream wake and upstream blade tip leakage flow on the internal flow field of the ITD. Fan et al. [22] used the inlet streamwise vortices at different spanwise locations and different axial velocities to simulate the upstream tip leakage vortex, hub secondary vortex and wake, and discussed the flow patterns of the ITD with flow transportation, such as the formation of counter-rotating vortices, wake transportation and so on. Liu et al. [23] investigated the impact of a cavity blowing jet on the integrated AITD, and indicated that the cavity jet changed the pressure gradient from hub to casing and induced local separation on the hub just downstream of the cavity outlet. Zhou et al. [24] studied the coupling effect of upstream wake and inlet streamwise vortex on the internal flow of the ITD, and pointed out that the distance between them has a major effect on the flow pattern and aerodynamic loss of the ITD. The authors’ team [25,26] studied the influence of sweeping frequency and wake intensity on the inner stream of the integrated AITD and the boundary layer of the integrated LPT-GV, and indicated that as wake intensity decreases or the wake reduced frequency increases, the wake skewness increases and the wake width narrows, which can make the duration and radial range of the flow separation inhibition by wakes decrease, resulting in an increase in separation loss. Based on these works, this paper will focus on the effect of HPT wake number on the flow field in the integrated AITD, especially on the internal flow in the integrated LPT-GV passage, and explore the wake number that minimizes the flow loss inside the integrated LPT-GV to guide the selection of upstream high-pressure turbine blade numbers and their matching design with the integrated AITD.

2. Materials and Methods

This paper focuses on the dynamic internal flow in the integrated AITD with different HPT wake numbers, by using CFX Solver with dynamic RANS. Based on the previous research of the authors’ team [25,26], the SST turbulence model and γ-θ transition model are used for turbulence closure, because they have strong ability in high-precision boundary layer simulation and can accurately simulate high turbulence dissipation flow. The time term is discretized with a second-order precision backward difference scheme, while the convection term is discretized with a second-order precision upwind scheme.

2.1. Integrated AITD

This paper uses the integrated AITD that has been continuously studied by the authors’ team as the research object. Figure 1 and Table 1 show its geometric model and parameters. In the integrated AITD, fifteen sections, B0–B9 and C1–C5, are set to extract data for analysis. For detailed parameters of the AITD and these sections, please refer to [26]. To investigate the effect of HPT wake number, 14, 28, 42 and 56 sweeping rods are evenly arranged in the whole circle.
The calculation domain consists of the dynamic domain of the rotating rod and the static integrated AITD domain (Figure 2). The inlet, located 1.5 H (H is the passage height of the AITD’s inlet) upstream of the rotating rod, is set as the velocity inlet boundary condition with a turbulence intensity of 3% and Re = 7.16 × 10⁴ (calculated with H as the characteristic length). The outlet, located 2.5 Cx downstream of the integrated LPT-GV, is prescribed as the static pressure outlet with a back pressure of 101,325 Pa. The surfaces of the AITD, sweeping rod and integrated LPT-GV are prescribed as adiabatic non-slip solid walls. Based on the different numbers of sweeping rods, the dynamic calculation cases carried out in this paper last for 0.242 s to 0.794 s, with a minimum physical time step (Δt) of 6.5 × 10⁻⁵.
A HOH-type structured grid is used to mesh the calculation domain (Figure 2a). Figure 2b shows that the total pressure loss (Y) of AITD varies with the number of grids. It can be seen that the Y value remains unchanged after the number of grids reaches 6.3 million. The calculation results of 6.3 million nodes are very close to those of 12.2 million nodes (difference < 5%), so the former is used for further calculation. For the selected grid, the number of nodes in the axial direction, circumferential direction and spanwise direction is 552, 73 and 133, respectively. The number of O-type grid nodes around the sweeping rod and LPT-GV is 81 and 369, respectively. The height of the first boundary layer is 0.002 mm, with a growth ratio of 1.15 and a total layer number of boundary layer grids of 20 to ensure that y+ < 1 under all working conditions in this paper.

2.2. Verification

In order to prove the feasibility of the above numerical method, this paper studies the AITD model in reference [18] (Figure 3a). The non-dimensional length of this AITD is 2.79, the inlet/outlet area ratio is 1.38, and the raised angle is 20.12°. The computation domain adopts a HOH-type structured grid with the node number of 2 million and y+ < 1 for the all solid walls. The inlet turbulence intensity is 4.65%, the inlet axial velocity is 30 m/s, the outlet back pressure is 101,325 Pa, and all wall surfaces are adiabatic non-slip wall surfaces.
Figure 3b shows the comparison between the measured and simulated radial distribution of the mass-averaged total pressure factor in section A. It has been proven that the simulated distribution trend is consistent with that of the measured one, but the simulated Cp0 is larger than the measured results, especially near the hub. This may be due to the measurement errors: (1) as the measurement section is located at the first bend of the AITD, it is difficult to ensure alignment with the flow direction when installing probes; on the other hand, (2) the immersion measurement by probes interferes with the flow field, especially in near-wall regions, which also causes some measurement errors. Figure 3c,d shows the measured and calculated results of the total Cp0 contour in section A, respectively, where the black dashed lines in Figure 3d mark the measurement boundary in Figure 3c. This proves that the simulation results capture well the wake of upstream sweeping rods and have good similarity with the measured wake shape. However, in the wake region and endwall vortex region (marked by dotted circles in Figure 3c), the measured Cp0 is lower and the range of the low measured Cp0 region is also larger. This is because the seven-hole probes are prone to solving the velocity gradient as the airflow angle in such high-velocity gradient areas, resulting in lower measured Cp0. Overall, the simulation method adopted in this paper can precisely predict the internal mechanism in the AITD.

3. Results

3.1. Unsteady Wake Transport in the Integrated AITD

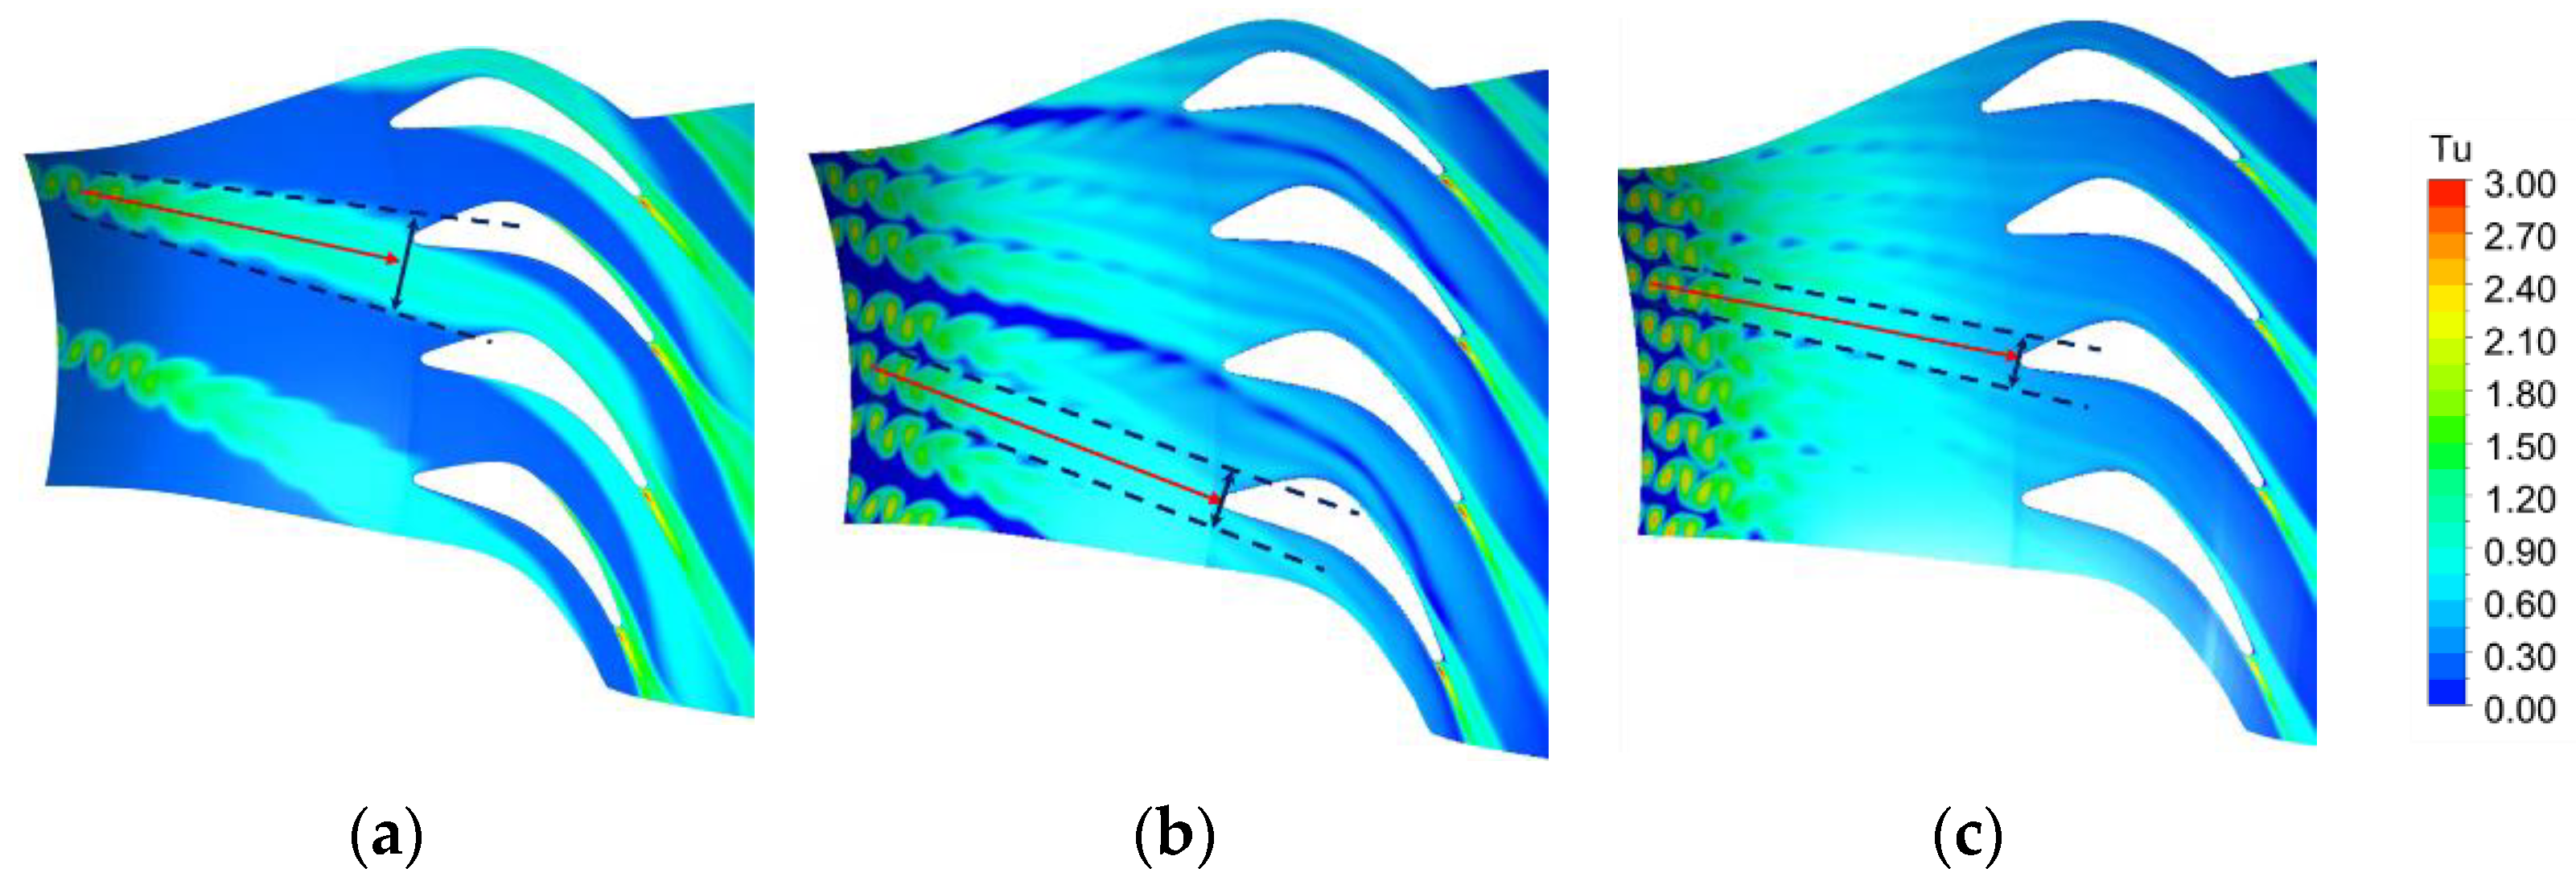
Figure 4 shows the turbulence intensity (Tu) contour in the mid-span section of the AITD in the case of different wake numbers. As the wake number (N) increases, the maximum turbulence intensity in the wake region continues to increase; in the N = 14 case, the maximum turbulence intensity in the wake region is 19%, while when N increases to 42 and 56, the wake region increases to 23% and 30%, respectively. The red arrows in the figure indicate the propagation trajectory of the wake center in the integrated AITD channel under different conditions: in the N = 14 case, when the wakes reaches the integrated LPT-GVs’ leading edges, its center crosses about a 25% pitch beyond the leading edge, while in the N = 42 and 56 cases, it is almost exactly at the integrated LPT-GVs’ leading edges. That is, the circumferential inclination of the wake decreases as the N increases. As the blocking effect of sweeping wakes increases with the increasing N, the mainstream axial velocity downstream of the sweeping rods increase to ensure the same inlet mass flow rate. On the other hand, the rotation speed of sweeping rods is constant under difference conditions, which means the circumferential velocity of the wake is constant. As mainstream axial velocity increases in the cases with more sweeping rods, the circumferential airflow angle of the wake actually decreases. This is also why the wake skewness decreases as N increases. The decreasing wake skewness actually implies a shortening of its propagation path (or time), which is not conducive to wake diffusion. Comparing the wake widths (showed by the blue double-arrow line in Figure 5) at the leading edge of LPT-GV under different conditions, the actual phenomenon is indeed so; when N increases from 14 to 56, the wake width decreases by nearly 48%. This is because the small spacing between the adjacent wakes limits its circumferential diffusion in the cases with a large N. In the N = 42–56 cases, the sweeping wakes already contact and mix with each other upstream of the LPT-GV, which accelerates the consumption of the wake. In the N = 56 condition, it can be clearly seen that wakes at leading edge of the LPT-GV are basically mixed uniformly, making the integrated LPT-GV under a uniform inflow condition have a high turbulence intensity.
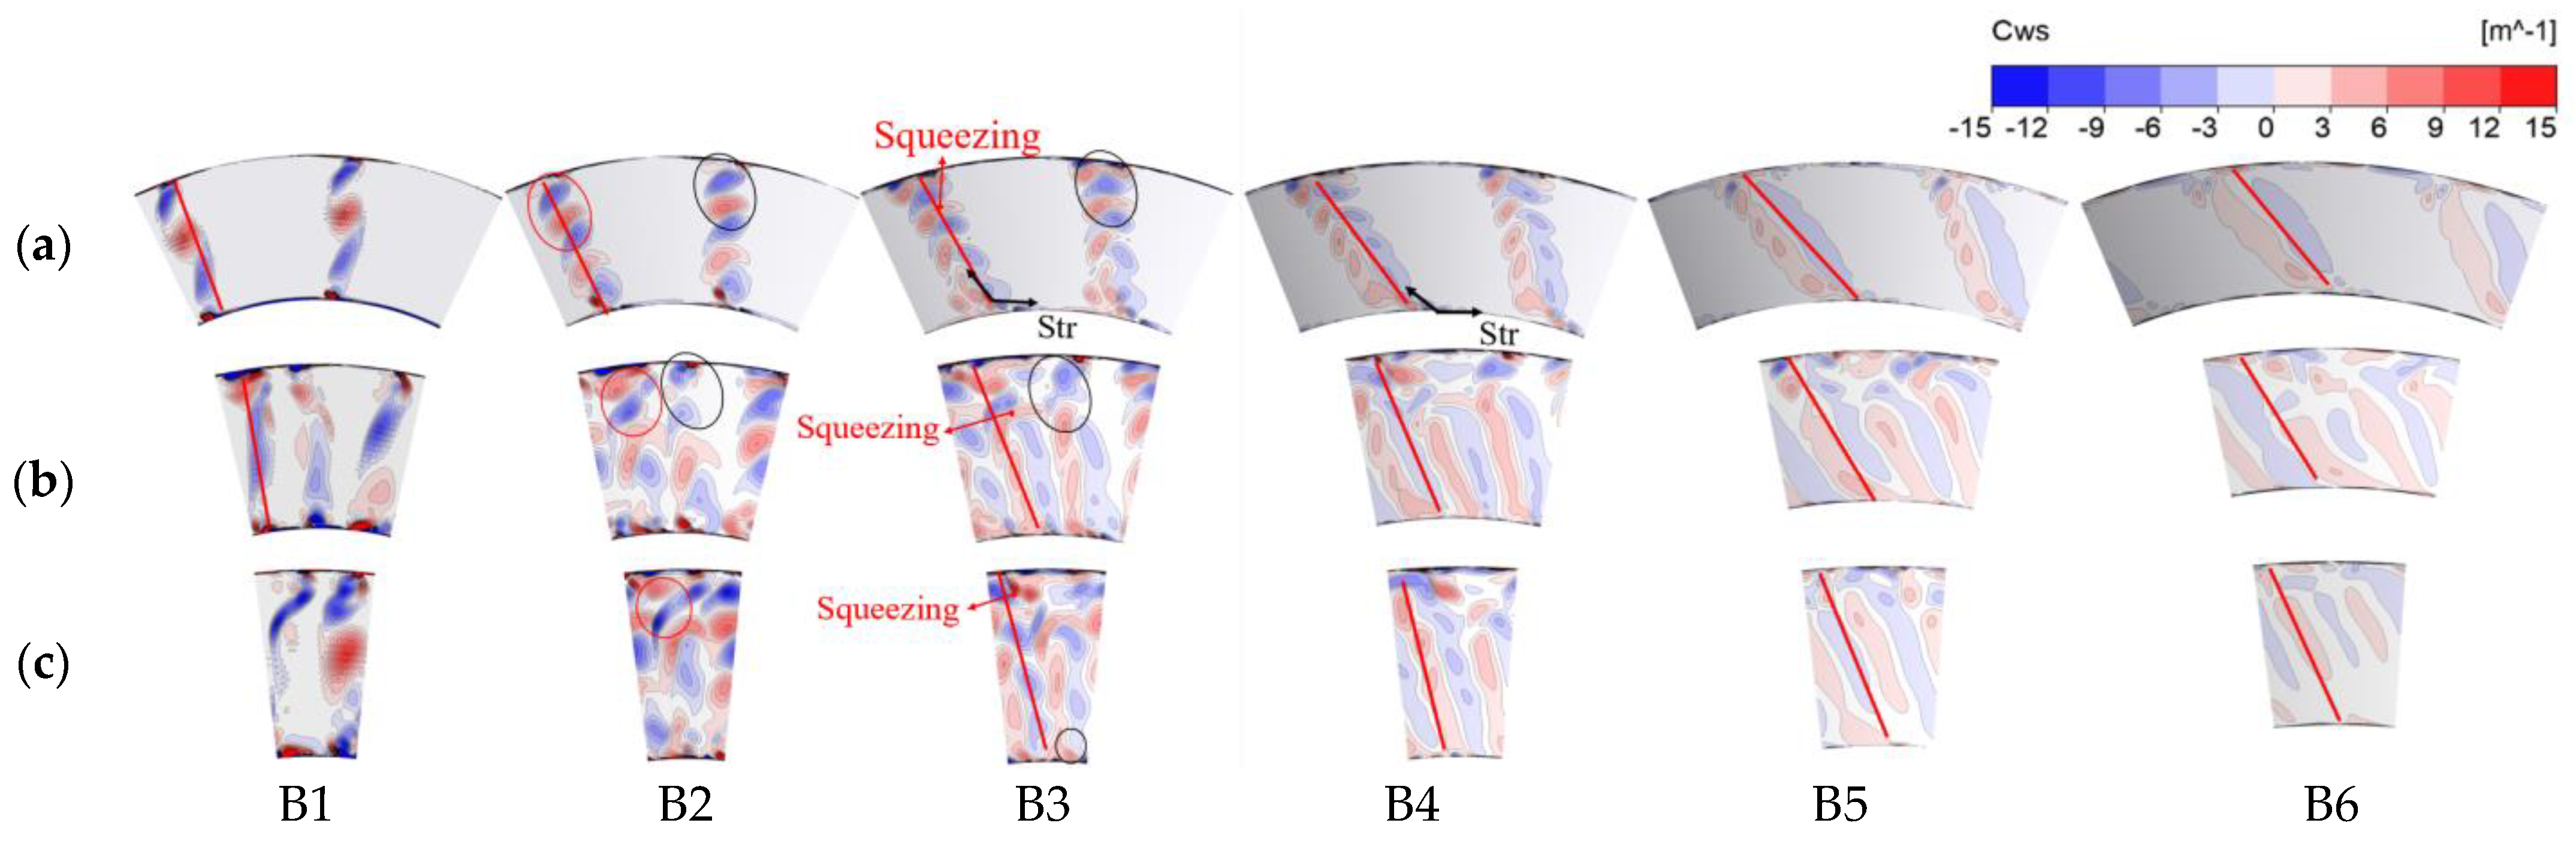
Figure 5 shows the streamwise vorticity coefficient (Cws) contour at different streamwise sections in AITD for the different N cases. In Figure, the red lines mark the wake center. As the wake propagates in the integrated AITD, the radial skewness of the wake center decreases as N increases. This is mainly because (1) as the AITD passage rises, the wakes with the same angular velocity at the inlet exhibit the circumferential velocity differences in different radial positions under angular momentum conservation, and the circumferential velocity near the hub is larger, resulting in wake skewness; on the other hand, (2) as the main flow axial velocity decreases with the decreasing N, the wakes in the cases with a smaller N take longer to reach the same axial position, which enhances the wake skewness in cases with a smaller N. As the sections B1–B6 are located at the first bend of the AITD, where there is a radial pressure gradient from hub to casing, the wake vortices are driven to migrate towards the casing. As the N increases, this migration effect weakens; in the N = 14 case, wake vortices near the casing in section B2 are almost squeezed together, while in the N = 42 case, there are still obvious gaps between wake vortices near the casing. This is because the increasing wake number enhances the blocking effect and thus weakens the radial pressure gradient in the AITD [25], resulting in a suppression of the radial migration of wake vortices to some extent. The convergence of wake vortices near the casing enhances vortex mixing and dissipation in this region. Comparing the residual vorticity near the casing in section B6, it can be found that the streamwise vorticity in this area is almost completely dissipated in the N ≥ 28 cases, while there is still a clear vortex core in the N = 42 case. Near the hub, due to the stretching effect of the circumferential motion and the radial migration (as shown by black arrow, Str, in Figure 5), Lei [26] pointed out that this tensile action is beneficial for accelerating the consumption of wake vortices near the casing. As N increases, the circumferential motion and radial migration is weakened, and this stretching is also delayed; when N = 14, the stretched wake vortices near hub in section B3 already occupy 50% of the channel height, while the stretched wake vortices only occupy 30% of the channel height when N = 28. Dominated by this stretching effect, the residual vorticity in the N = 14 case is significantly smaller than that in the N ≤ 42 case in the same streamwise section. However, as N further increases, the interaction between adjacent wakes becomes the main factor dominating enhanced wake mixing, especially in the region near the hub. When N = 42, the diffused wake vortices near the hub begin to come into contact each other in section B2 and the wake interaction obviously enhances its dissipation. In sections B3–B6, the residual vorticity is significantly smaller than that in the N ≤ 42 case. For the N = 56 case, wake vortices fill the entire channel in section B2 and the strong wake interaction greatly accelerates its dissipation. As a result, the wake is basically mixed uniformly and the residual vorticity is the lowest among the four cases in section B5.
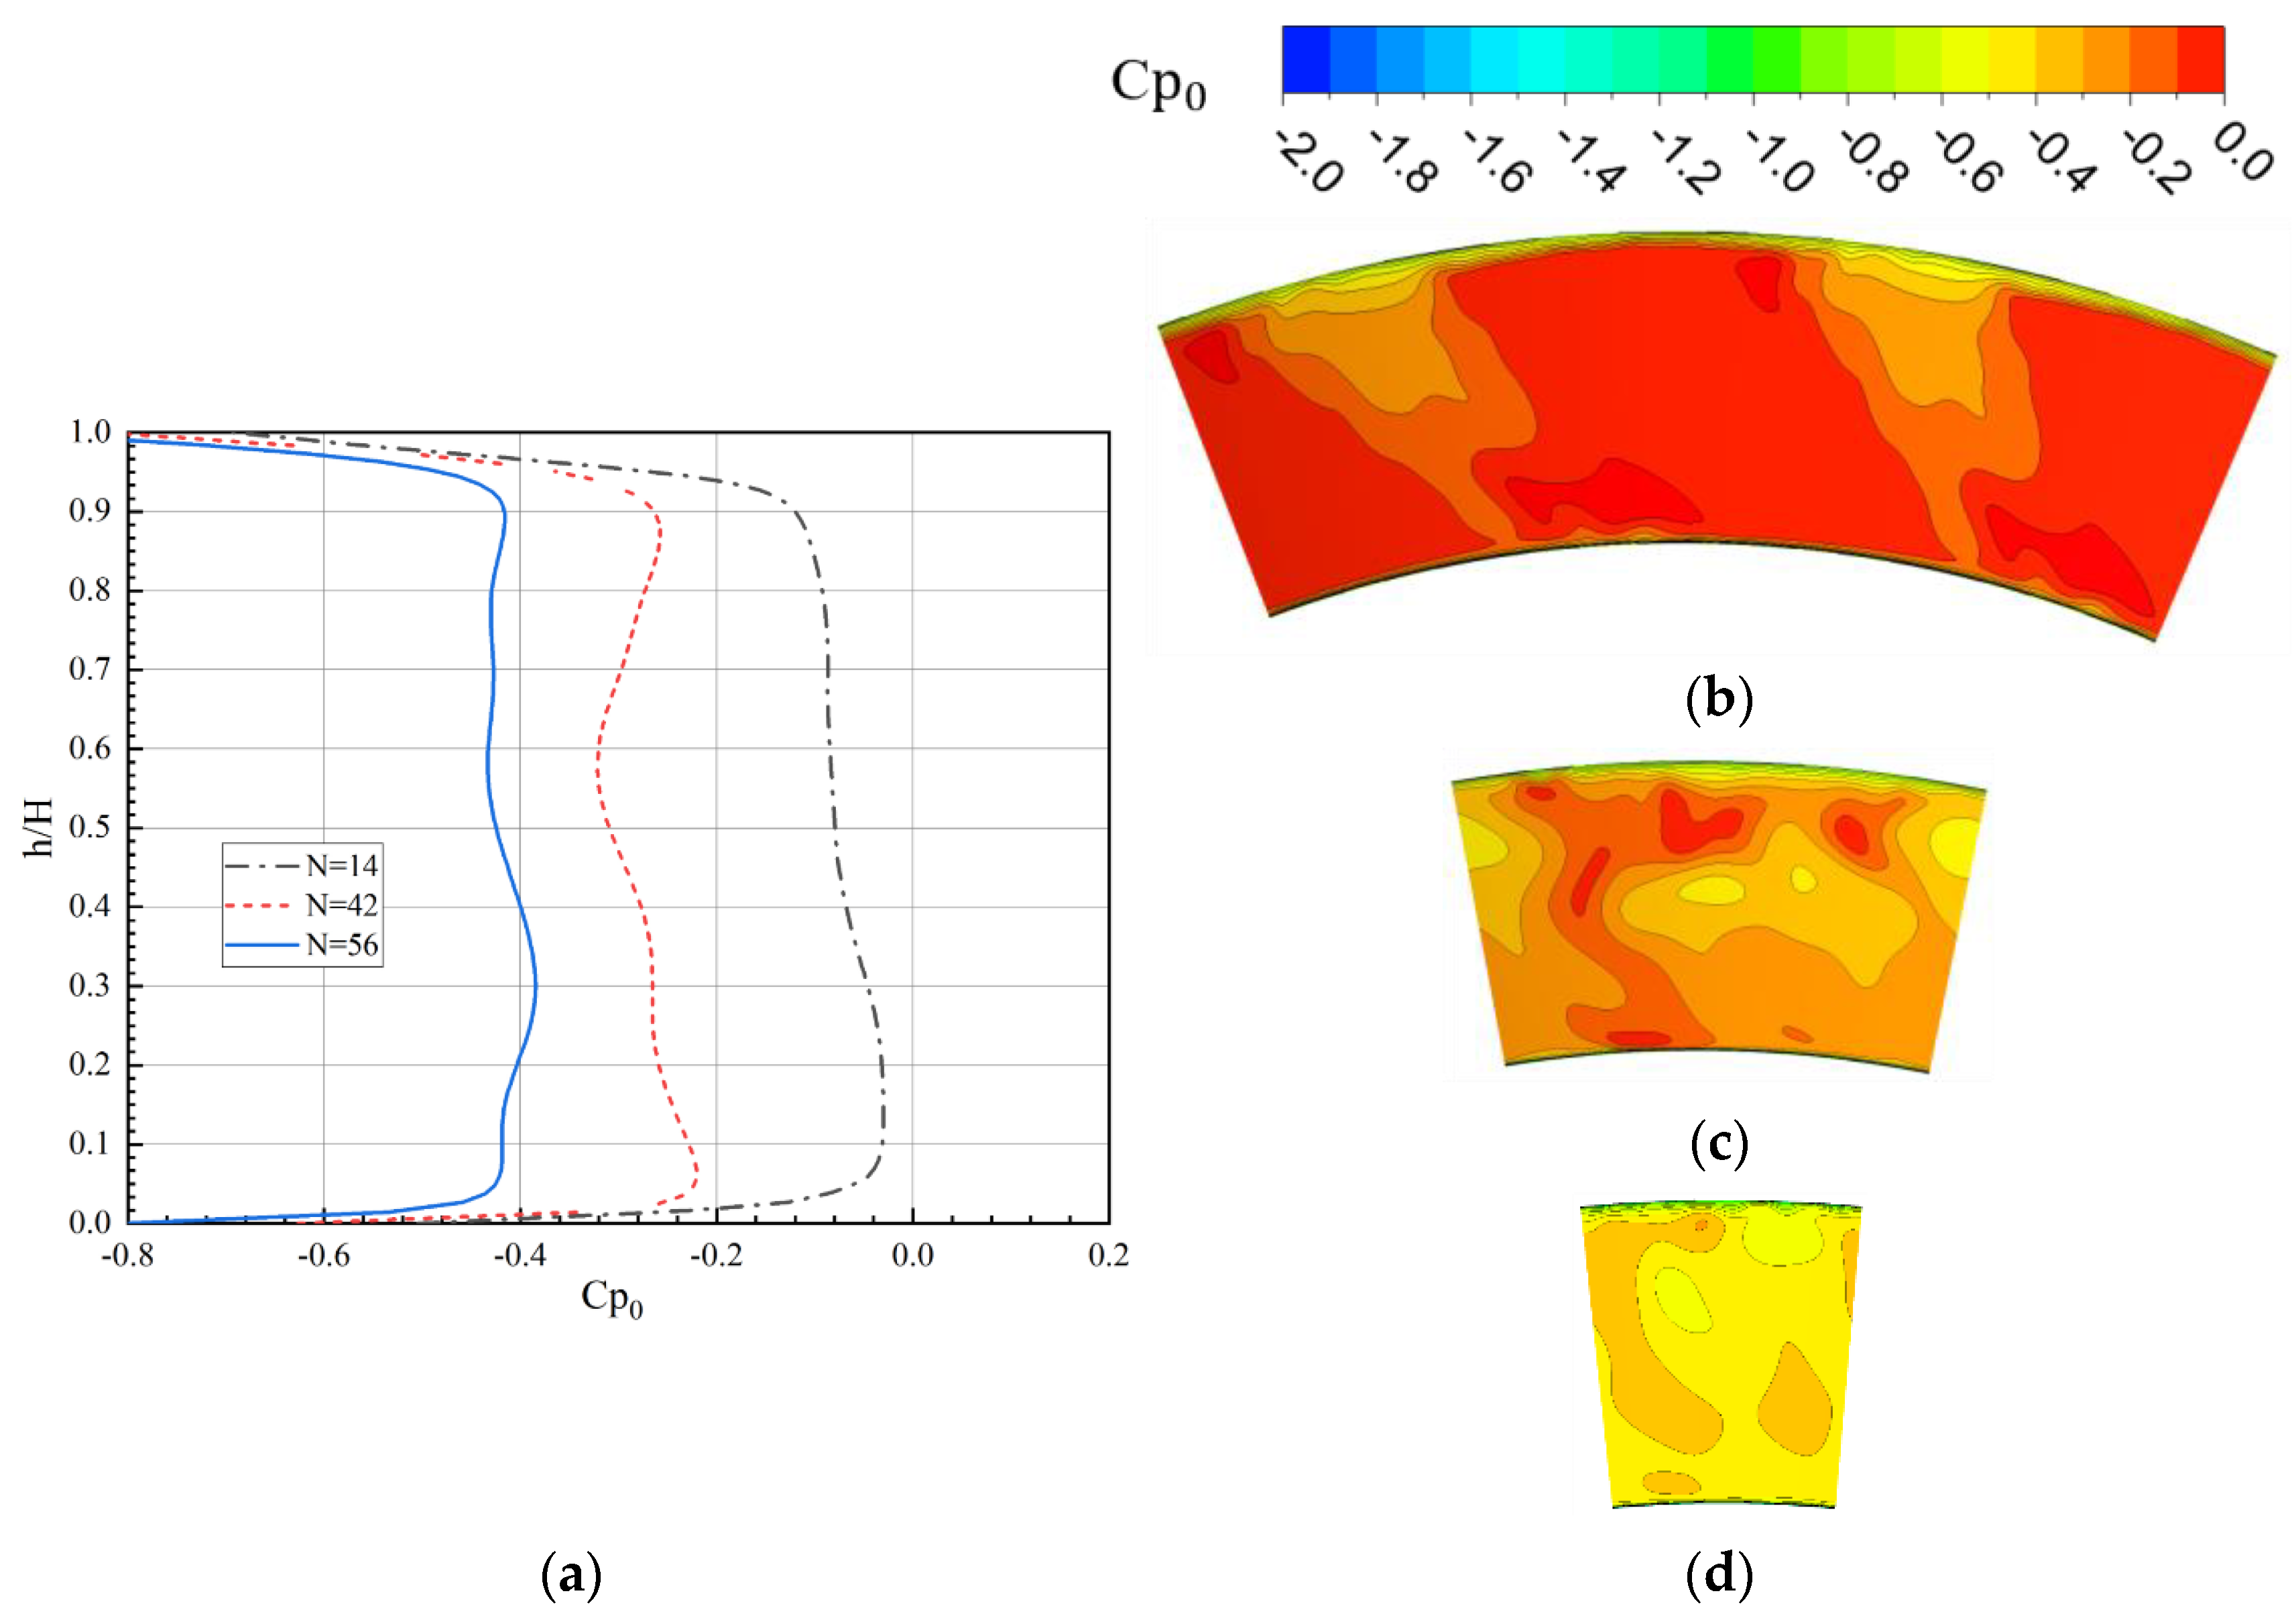
Figure 6 shows the radial spread and contour of the mass-averaged overall pressure coefficient in section B6. The total pressure loss increases as N increases. In the total pressure coefficient contour, the proportion of the red contour representing the low-loss region decreases as N increases, which also confirms the above conclusion. This indicates that sweeping wake number is an important factor affecting the total pressure loss in the AITD, and an increase in the number of wakes increases the AITD loss. However, the radial distribution trend of total pressure loss under different conditions is not consistent; in the N = 14 case, the total pressure loss around the hub (0 < h/H < 0.3) is less than that of the upper area (0.3 < h/H < 1.0); as N increases to 28 and 42, the total pressure loss near the casing and hub is basically the same and the maximum loss region is located in the middle of the channel. This is mainly because the wake number affects the radial migration of wake vortices, which changes the radial distribution of total pressure loss. The distance of radial migration is the key to achieving positive gain using the wake to suppress flow separation on the integrated LPT-GV, which will be discussed in detail below. When N = 56, the total pressure loss in the entire channel does not change much. This is because the wake in section B6 is basically mixed uniformly in this case. The uniform total pressure contour shown in Figure 6d also corroborates well this conclusion.

3.2. Influence of Sweeping Wake Number on the Integrated LPT-GV

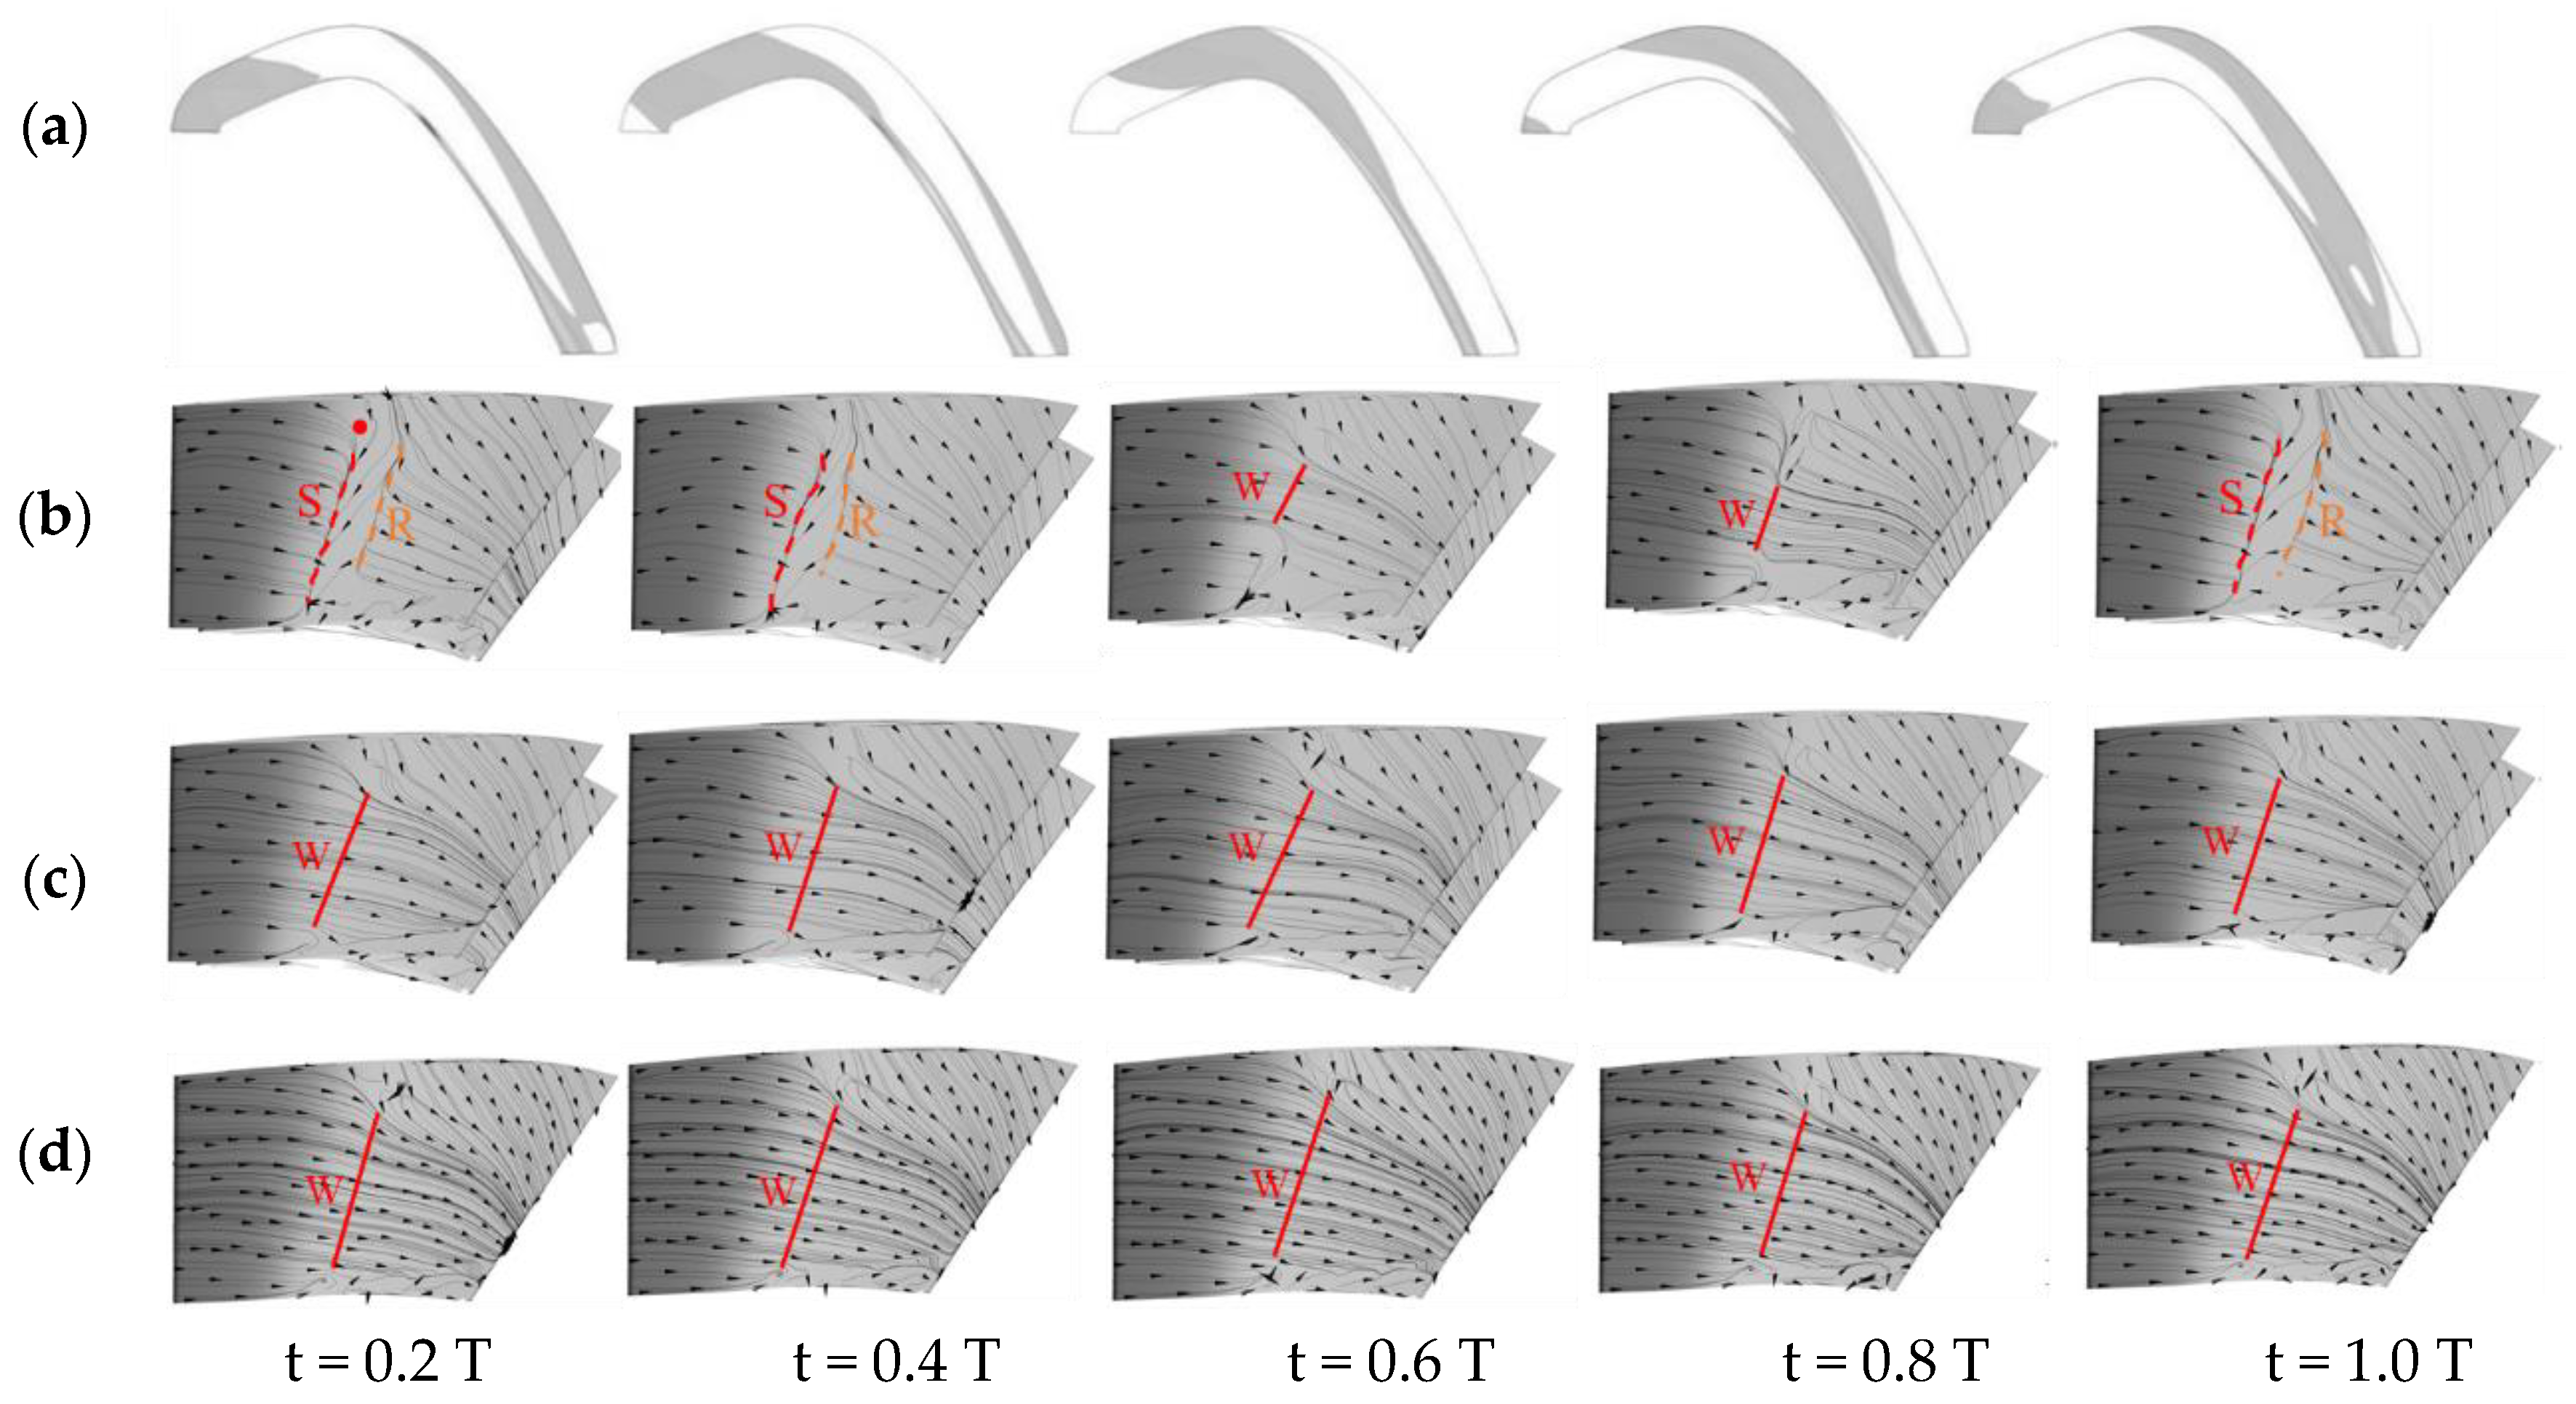
Figure 7 shows the instantaneous limiting streamline on the suction surface of the integrated LPT-GV under different conditions. In the N = 14 case: when t = 0.2 T, the wake has just reached the LPT-GVs’ leading edges and not yet affected the separation bubbles on the suction surface (the red dotted line S is separated line and the orange line R is the reattachment line), thereby the LPT-GV is in its maximum separation state; as the wake propagates downstream, the separation bubble is reduced at t = 0.4 T, then it is completely suppressed at t = 0.6–0.8 T, and finally the separation bubble returns to its initial state after the wake leaves the LPT-GV (t = 1.0 T). The development trend of the LPT-GV boundary layer in the N = 28 case is similar to that in the N = 14 case. However, compared with the N = 14 case: the separation bubble in the N = 28 case is smaller at the same phase, as shown at t = 0.2 T, 0.4 T and 1.0 T, due to the increasing wake number enhances the inlet turbulence intensity of the LPT-GV and suppresses the size of separation bubbles on the LPT-GV. Besides, the effective suppression range of wake (as shown by red solid line W at 0.6 T and 0.8 T in Figure 7) increased by 73.7% in the N = 28 case compared with the former one. This is because the radial suppression range of the stretched wake is reduced as its skewness increases in the small N cases. Under the large N conditions, wake is almost uniformly mixed in section B6, but the enhanced inlet flow turbulence intensity of LPT-GV already has the ability to entirely inhibit the flow separation on suction surface in the entire spatiotemporal domain. However, compared with the N = 42 condition, the radial range of flow separation suppression under the N = 56 condition increased by 12% (as shown by Line W), which still related to influence of N on wake skewness. It can be seen that the wake number has two-sided effect on loss in the integrated AITD: when N is small, the wake dissipation loss is small, but the flow separation can not be completely suppressed; on contrary, when N is large, the flow separation can be completely inhibited by the sweeping wakes, but the wake dissipation obviously increases. Therefore, there may be an optimal sweeping wake number that minimizes the overall loss in the integrated AITD.
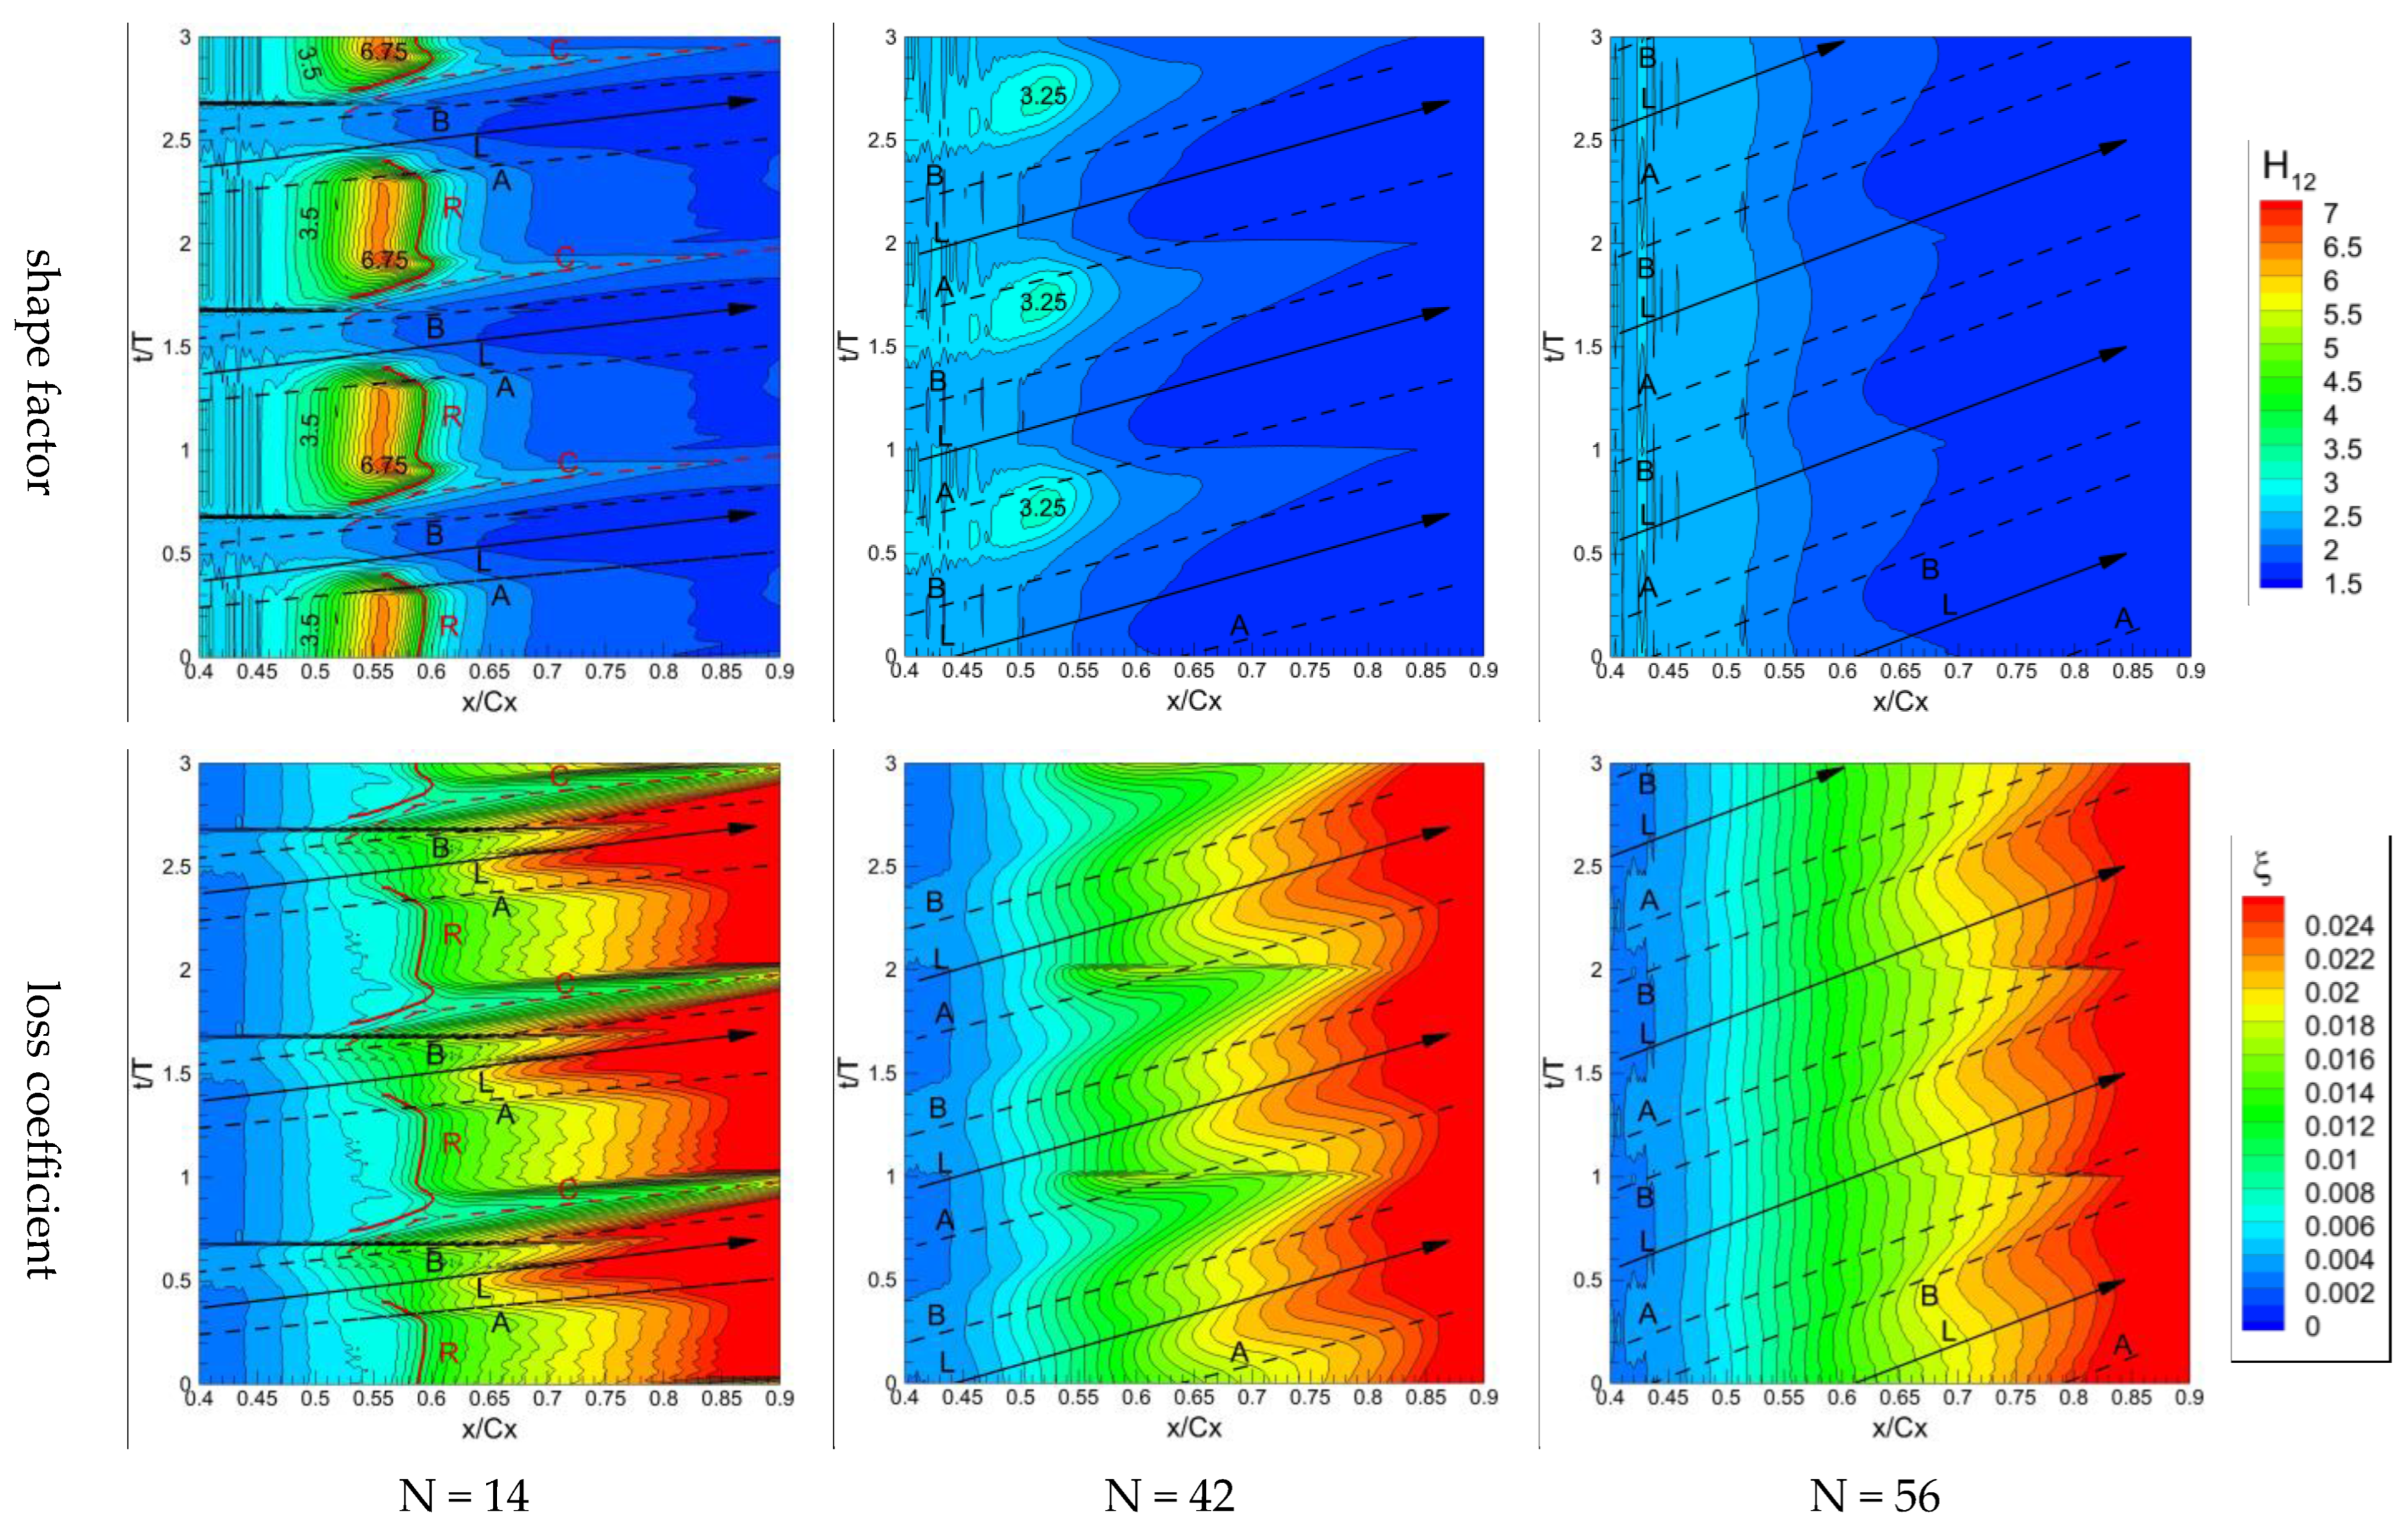
Figure 8 gives the spatiotemporal contour of the loss coefficient (ξ) and shape factor (H12) of the boundary layer at the mid-span of integrated LPT-GV under different conditions. According to the empirical rules [20], the reattach line (Line R), wake-induced transition line (Line T), the leading edge (Line A)/centerline (Line L)/trailing edge (Line B) of the wake and the bound of the calm region (Line C) is marked in Figure 8. For the turbine blades, when the H12 is higher than 3.5, it usually means that boundary layer separation has occurred. In N = 14 and N = 28 conditions, there are areas where H12 is greater than 3.5, which means that there are separation bubbles on the integrated LPT-GV. The separation line on the integrated LPT-GV under the N = 28 condition is delayed by 1.6%SS compared to the N = 14 condition. This is because the enhanced inlet turbulence intensity of LPT-GV in the N = 28 case is beneficial to delay the flow separation to some extent. Although the length of separation bubble in both cases is roughly equal, the duration of separation bubble under the N = 14 condition increases by 30%. This is because the sketched wake reduces the duration of flow separation suppression significantly in this case. When N > 28, there is no region where H12 is greater than 3.5 in full spatiotemporal domain on suction surface of integrated LPT-GV. This is because the enhanced inlet flow turbulence intensity under large N conditions completely suppresses the separation on the integrated LPT-GVs’ suction surface.
When N ≤ 28, there are two types of boundary layer transitions on suction face of integrated LPT-GV: one is separation transition whose transition line is the reattachment line of separation bubble (as shown by Line R in Figure 8), and the viscous loss is increased rapidly downstream of this line due to the formation of turbulent boundary layer; the another one is the wake induced transition whose transition line is marked by the Line T in Figure 8, the leading edge of this transition line is located upstream of the separation transition point, such as 0.15 SS (SS is the suction face length) upstream of the later in the N = 14 case. The wake induced transition point at wake center under the N = 28 condition is roughly equal to that under the N = 14 condition and both are located at 0.45 SS; while the transition points at the wakes’ leading edge and trailing edge move upstream with the increasing N, which may be related to the increase in inlet flow the leading edge of their transition line (as shown by red Line T) is roughly equal to that under the N ≤ 28 conditions. The turbulence intensity between the adjacent wakes is relatively lower and the corresponding transition position moves downstream accordingly. The distance between the leading edge and trailing edge of the transition lines decreases with the increasing N. Loss coefficient represents the proportion of viscous loss, and the position of transition line is the key factor affecting the scope of high loss coefficient region. By comparing high loss coefficient contours under different conditions, it has been proved that the smaller N, the larger the peak in the red high loss coefficient area; but under the large N conditions there are large continuous red high loss coefficient regions near the LPT-GV trailing edge. Overall, as N increases, the high loss coefficient area also grows, which means that the turbulent viscous loss of integrated LPT-GV also increases with the increasing N. However, as N increases, the flow separation is suppressed or even completely eliminated which is beneficial to reduce the separation loss. Whether this reduced separation loss can make up for the increased viscous loss is the key to improve the aerodynamic performance of integrated AITD by utilizing the dynamic wake.
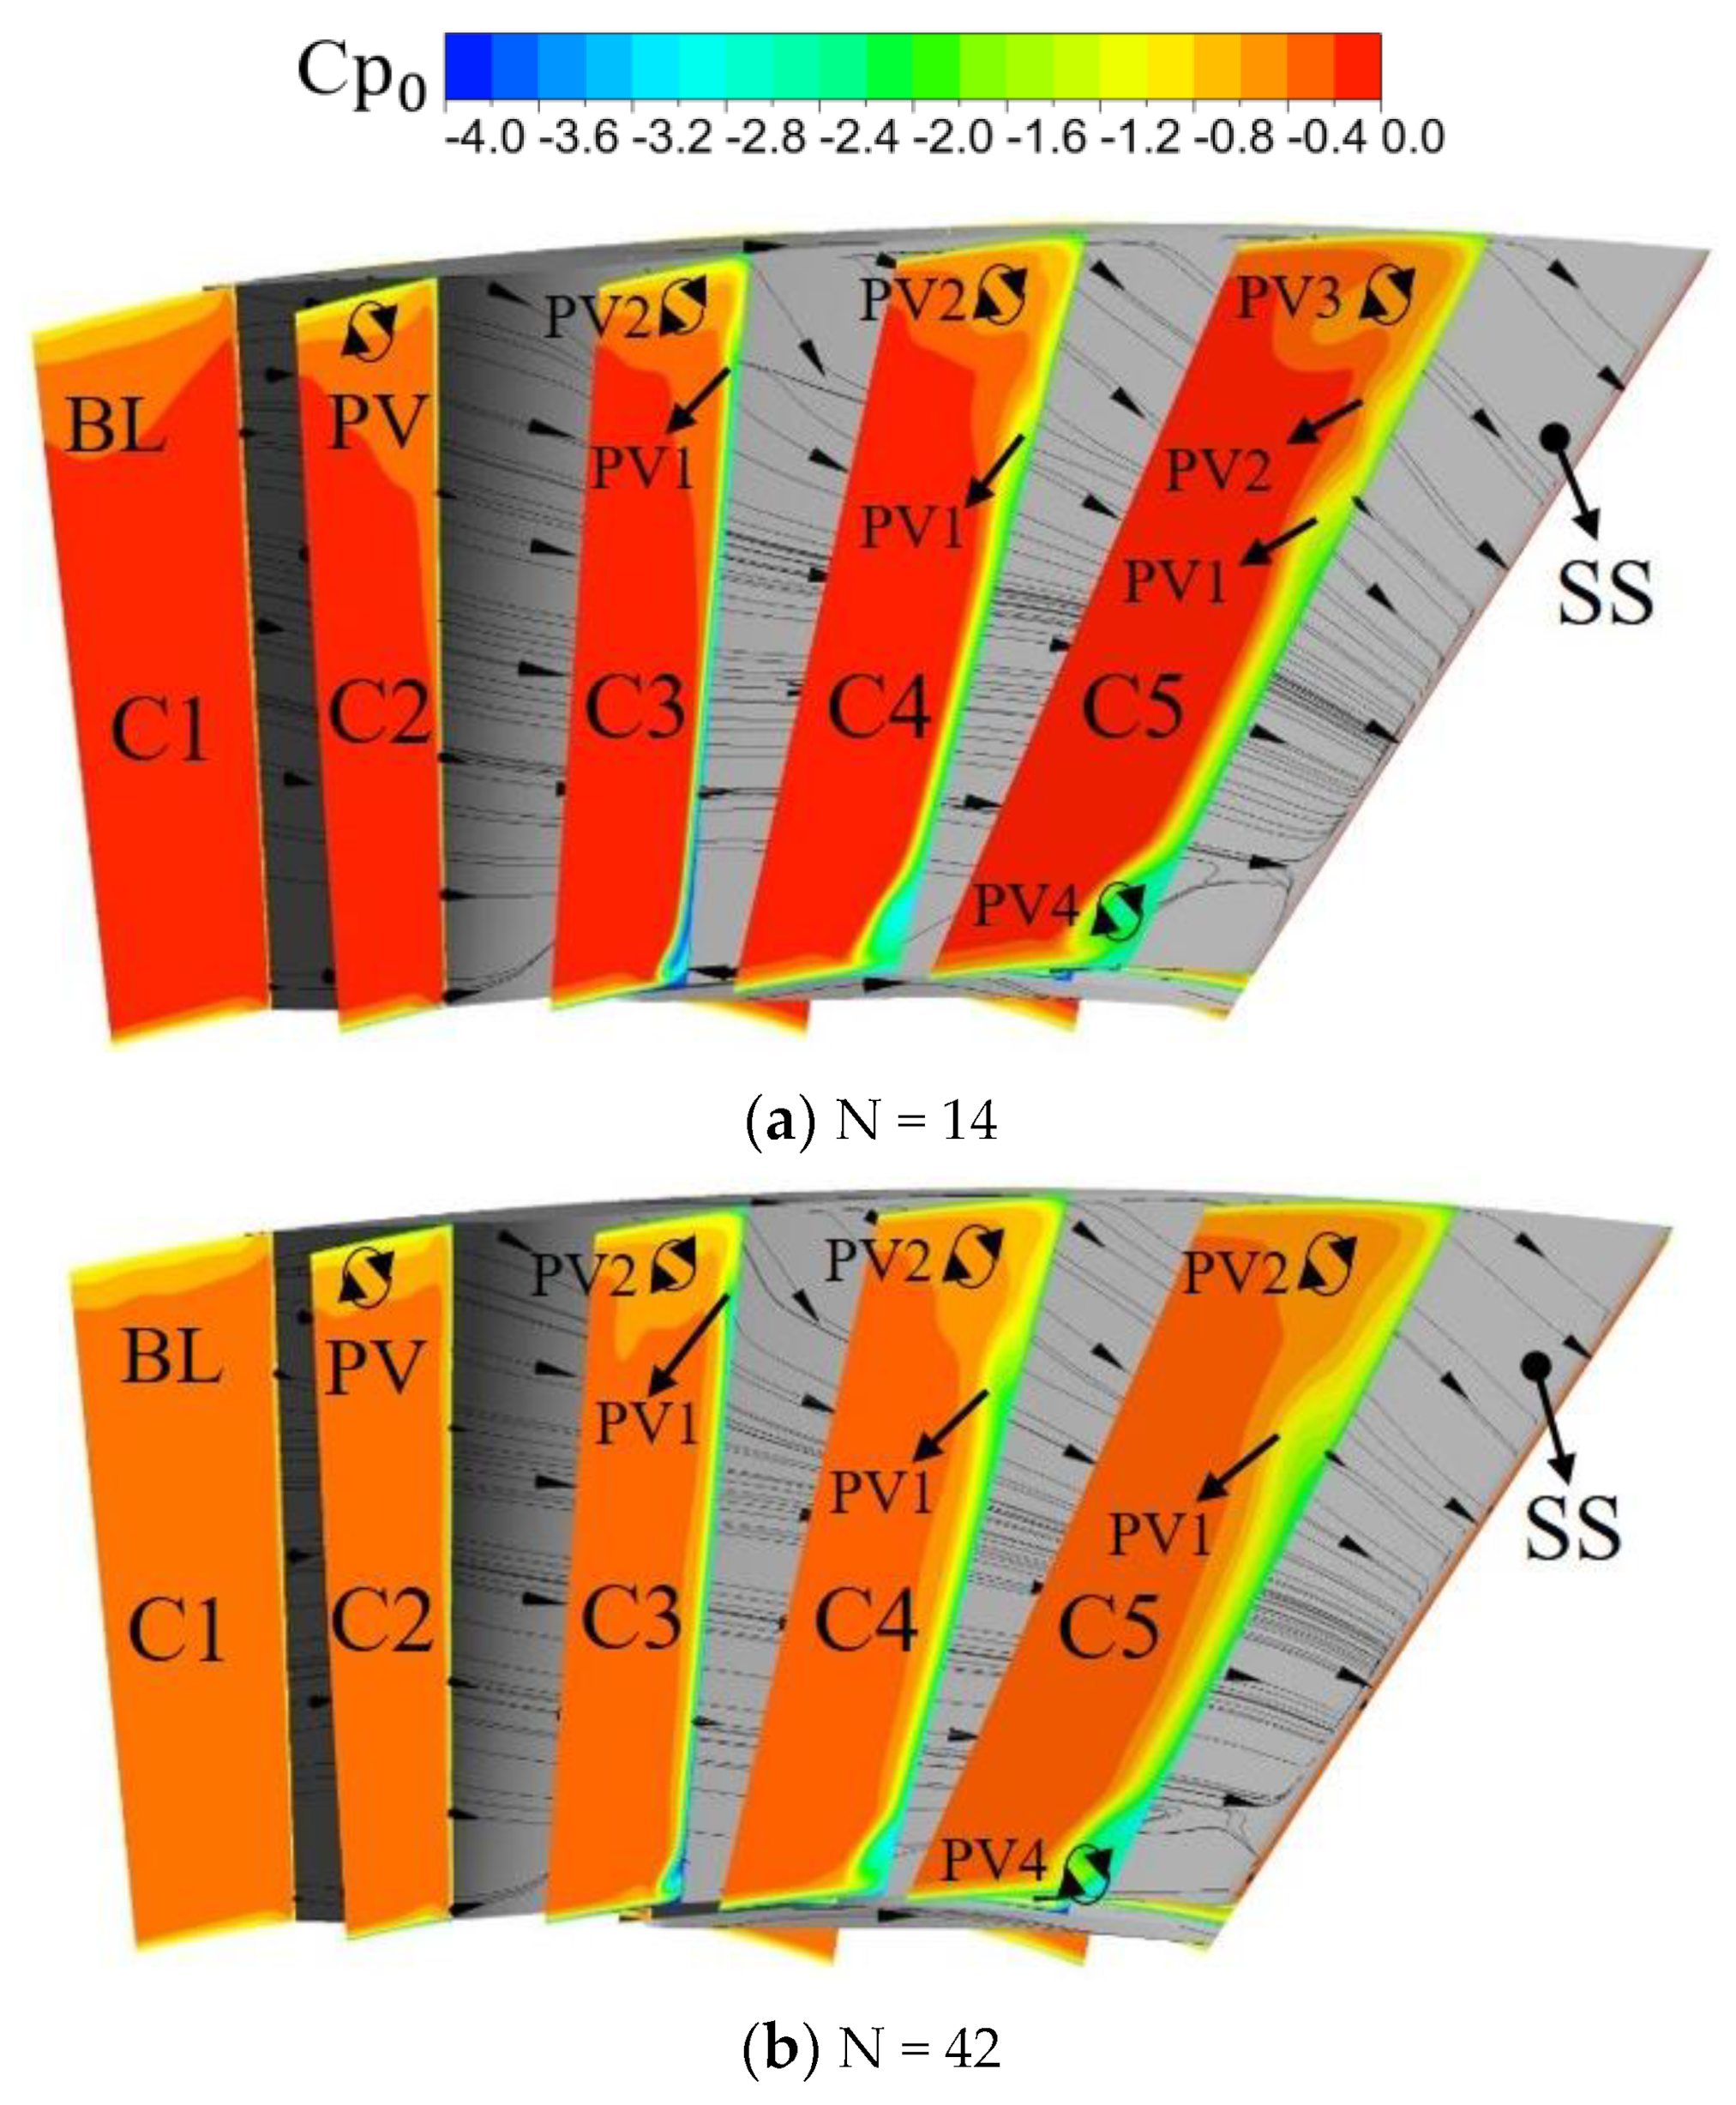
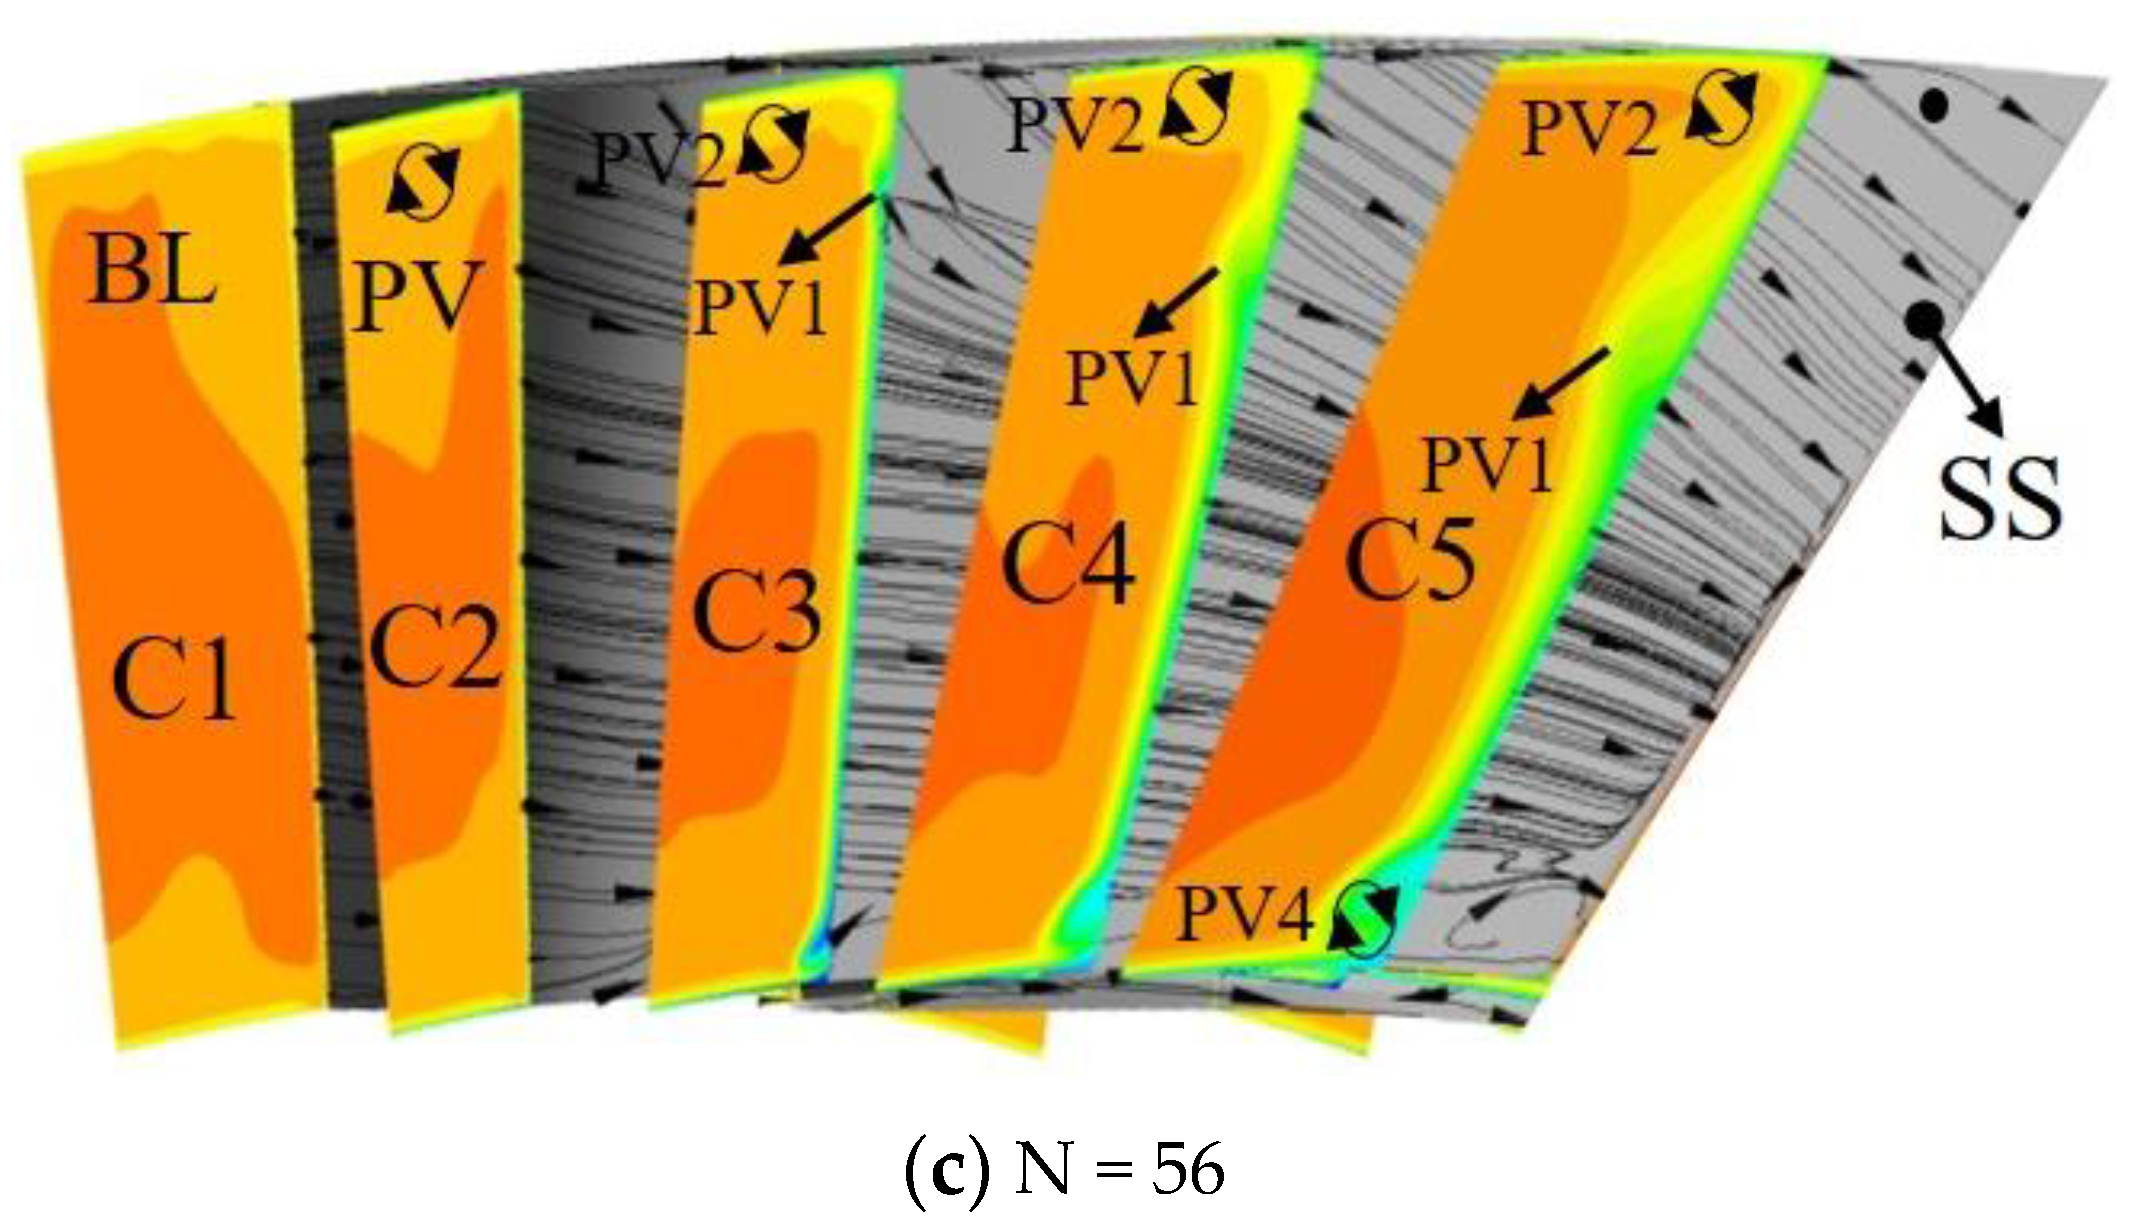
Figure 9 shows the contour of the time-averaged total pressure coefficient for section C1-C5 in the LPT-GV channel and the limiting streamline on the LPT-GV suction surface (marked with “SS”) under different conditions. In section C1, there are thick boundary layers on the casing for the all cases, as shown by BL in Figure 9, where the boundary layer is thickest under the N = 28 condition. Near the casing, the coupling influence of the radial secondary flow and the circumferential secondary flow from the pressure surface to suction surface induces the formation of a channel vortex near the gearbox, as shown by PV in section C2 in Figure 8. As it develops downstream, the radial secondary flow pushes the passage vortex away from the casing and then migrates in the radial downward direction, as shown by the migration path of PV1 in sections C3–C5 under each condition. As N increases, the migration distance of PV1 decreases continuously. This is because the increasing wake number causes a decline in the radial pressure gradient. Under the N = 14 condition, due to the strong radial secondary flow, a new passage vortex (PV2) forms in section C3 after PV1 undergoes radial migration, and then also detaches from the casing and migrates radially downward ina section C5. As N increases, the size of PV1 increases significantly, but the size of the passage vortex close to the casing (such as PV3 for the N = 14 case and PV2 for other cases) decreases. There is also a passage vortex near the hub as shown by PV4 in Figure 9. The size of this vortex decreases with the increasing N, but it is larger under the N = 56 condition than that in the N = 42 condition. In section C5, there is thick boundary layer in the middle region and its thickness increases with the increasing N due to the early transition in the large N cases. However, the thickness of boundary layer in the N = 42 case is greater than that in the N = 56 case, because there is still a certain residual wake in the LPT-GV passage in this case whose dissipation decreases the axial velocity and increases the boundary layer thickness.
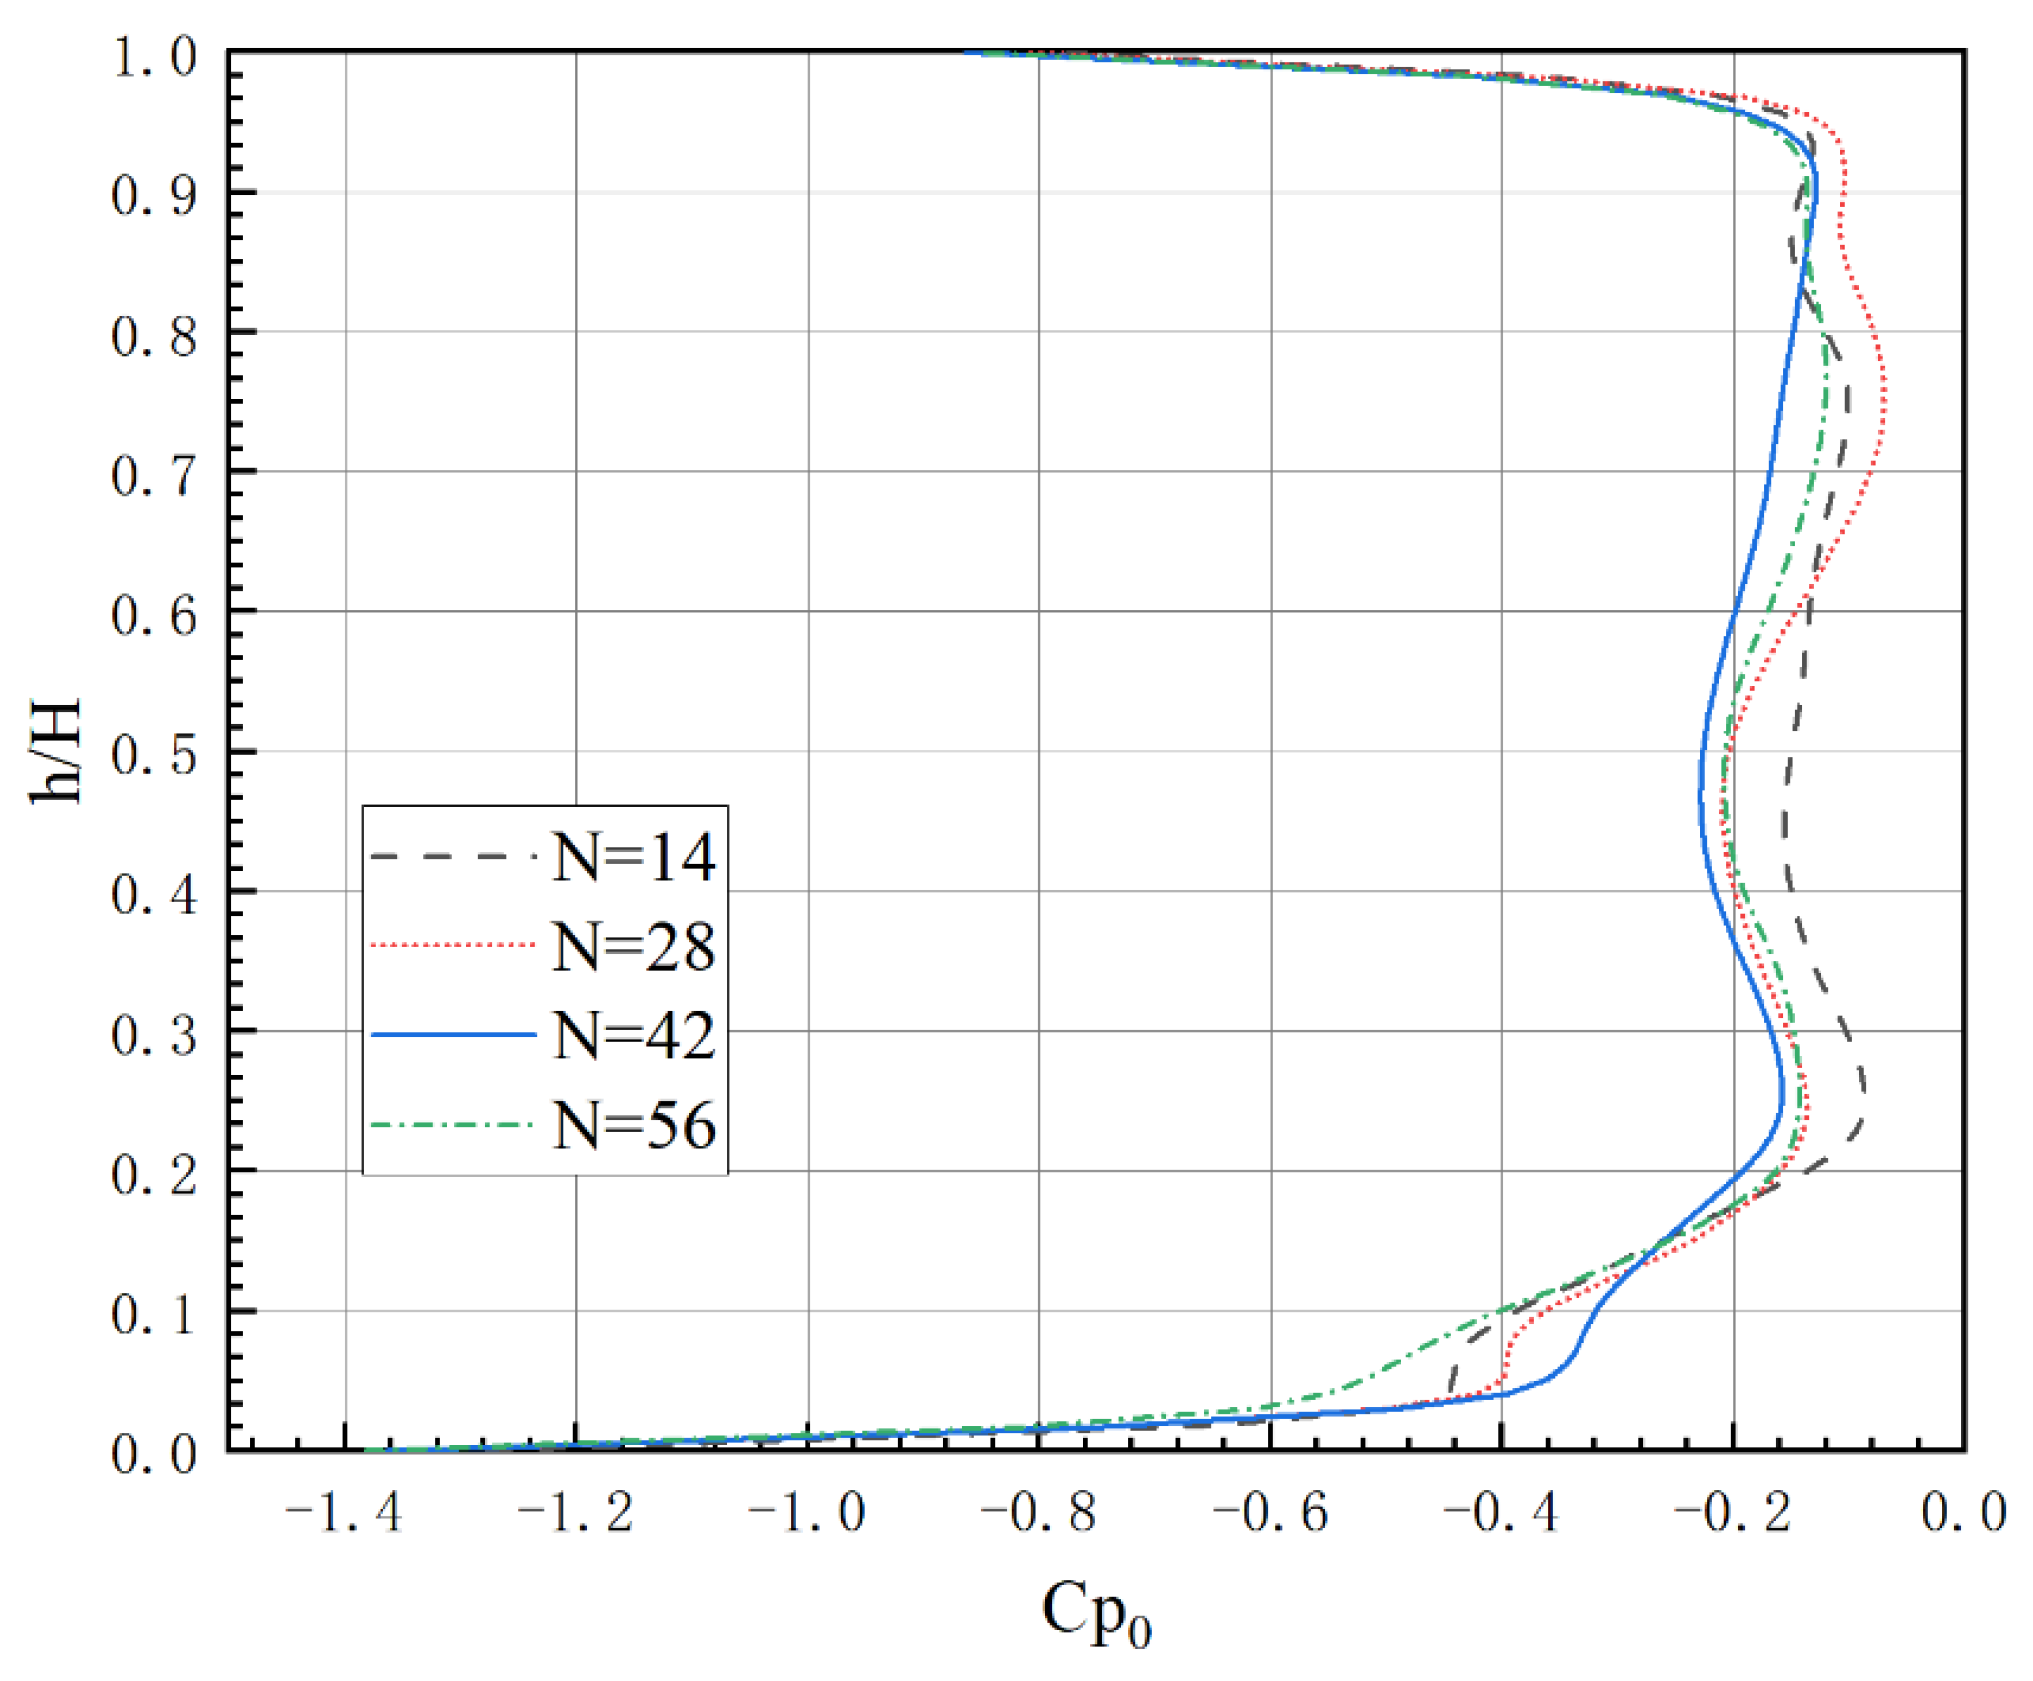
Figure 10 gives the pitchwise mass-averaged Cp0 radial distribution in the integrated LPT-GV. The loss in the region of h/H = 0~0.2 mainly comes from the passage vortex near the hub: as the N increases, the weakening of the passage vortex inevitably reduces the total pressure loss, as shown by in Figure 10 where Cp0 increases with N in this region. However, the total pressure loss of this region in the N = 56 case is largest, which indicates that the passage vortex near the hub in this case is larger than that in other cases. The total pressure loss in the region of 0.64 < h/H < 1.0 mainly comes from the passage vortex near the casing. As N increases, the weakened passage vortex increases Cp0 accordingly; however, the total pressure loss of this area under the large N conditions is even higher than that in the N = 14 case due to the residual wake mixing. the total pressure loss in this region is even higher than that under N = 14 operating conditions. The total pressure loss in the middle region (0.2 < h/H < 0.64) mainly comes from the boundary layer; as the boundary layer thickens with the increase in N, the Cp0 decreases accordingly. For the N = 28 and N = 42 cases, residual wake mixing grows the total pressure loss in this area as well; the residual wake dissipation loss can be offset by the total pressure gain brought by the thinned boundary layer in the N = 28 case, so its Cp0 is almost equal to that in the N = 56 case, while the superposition of the residual wake dissipation loss and the loss of the thickened boundary layer in the N = 42 case makes its Cp0 less than that in the N = 56 case.
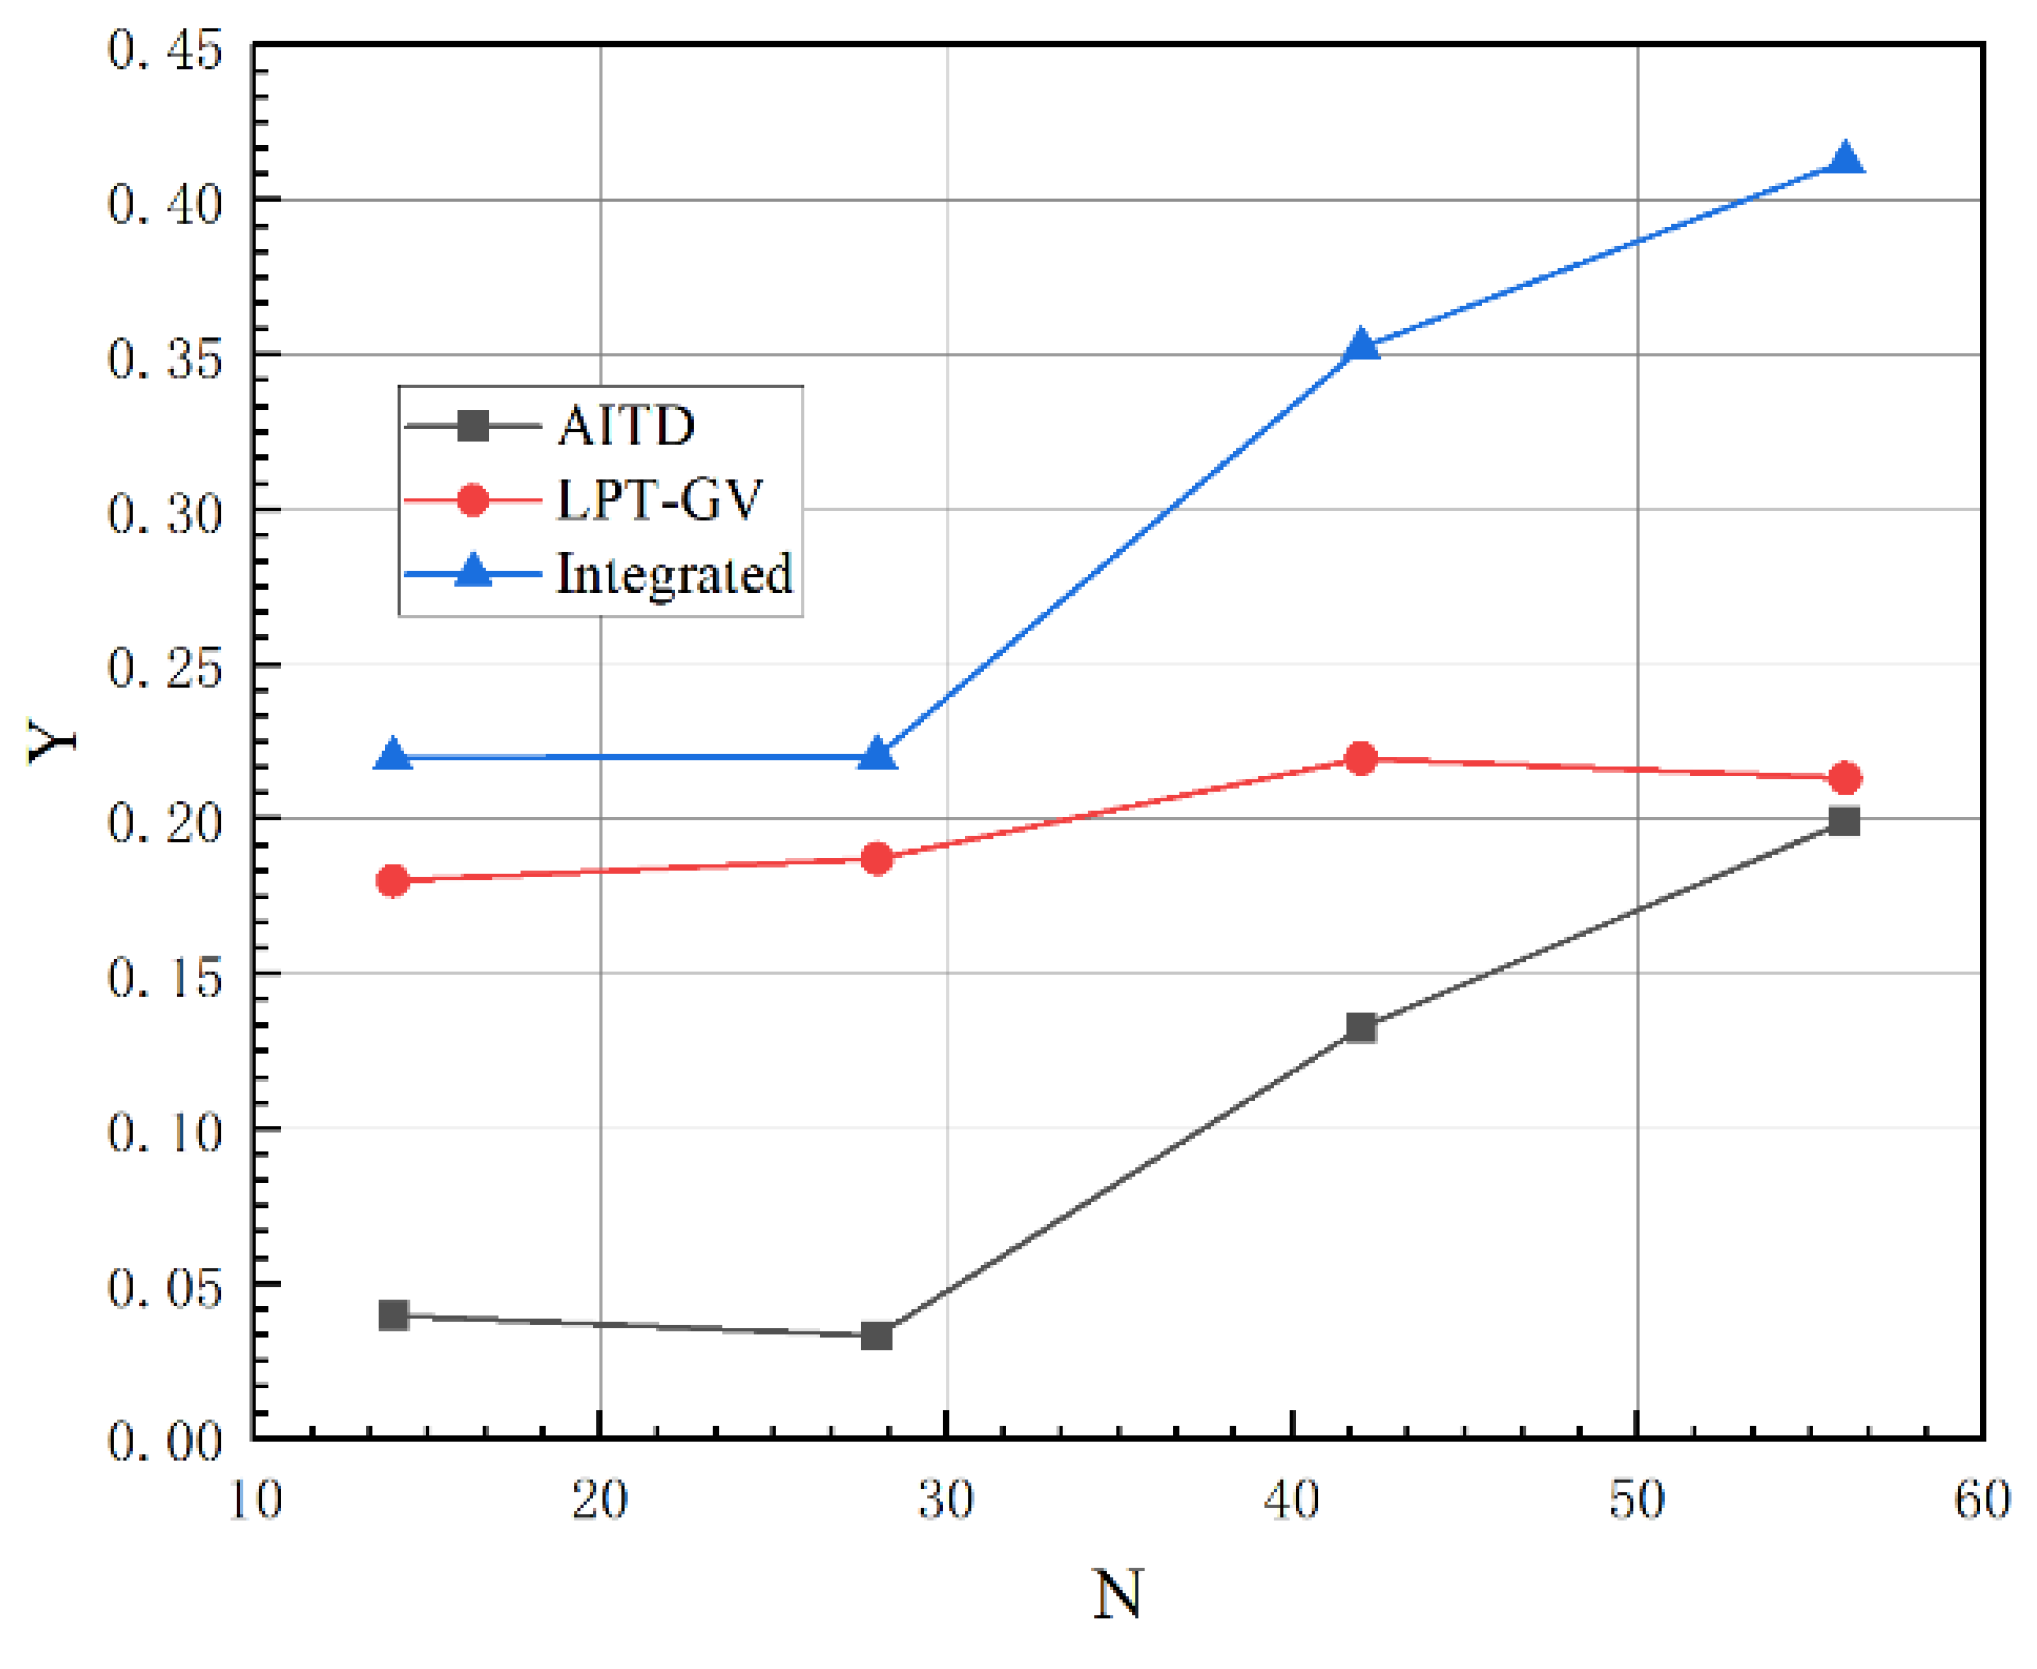
Figure 11 gives the Y in the integrated AITD and its components under different conditions. Compared with the N = 14 case, the AITD loss in the N = 28 case slightly decreases. This is because the weakened radial pressure gradient delays the radial migration of the wake, contributing to a decrease in the wake dissipation loss; as N continues to increase, the AITD loss increases due to the enhanced interaction between the adjacent wakes. The integrated LPT-PV’s loss is the calculated loss between section B6 and section B7, which mainly includes the partial wake mixing loss, the integrated LPT-GV profile loss, secondary flow loss, separation loss and the friction loss. The LPT-GV loss in the N = 28 case slightly increases (about 0.7%) compared to that in the N = 14 case. This indicates that the increasing turbulent boundary layer loss due to the strong wake in the N = 28 case slightly exceeds its gain in flow separation suppression; as N increases, the LPT-GV loss first increases then slightly decreases, where it reaches the maximum value in the N = 42 case. This is because, compared to that in the N < 42 cases, the strong turbulence intensity caused by wake mixing greatly increases the wet area of the turbulent boundary layer on the LPT-GV in the N = 42 case, while compared to that in the N = 56 case, there is still a certain residual wake mixing loss in this case. The total loss of the integrated AITD includes LPT-GV loss and AITD loss; when N ≤ 28, the integrated AITD loss almost remains unchanged, where the LPT-GV loss is its main loss source (accounting for over 80%), while when N > 28, the proportion of wake dissipation loss increases, and the sharply increasing wake dissipation loss leads to a rapid increase in the overall loss of the integrated AITD. Therefore, the overall loss of the integrated AITD studied in this paper reaches its minimum value when 14 ≤ N ≤ 28, where the benefit of the wake suppressing separation can offset the wake mixing loss and the turbulent viscous loss caused by wake-induced transition. Considering that wake dissipation loss originally exists, the upstream wake can be utilized to obtain certain aerodynamic benefits when the wake number is less than 28.

4. Conclusions

This paper uses the sweeping rods to simulate the HPT wakes and studies the influence of wake number on the flow mechanism inside the integrated AITD using dynamic numerical methods. As the wake number increases, the radial pressure gradient is reduced, which is beneficial to delaying the radial migration and dissipation of wake vortices. This enables some residual wakes to reach the integrated LPT-GV, thereby further enhancing the suppression of flow separation. In addition, wake skewness is weakened with the increase in N, which reduces the stretching of the wakes and is conducive to increasing the duration and radial range of flow separation suppression. When there are too many wakes, the mutual mixing between the adjacent wakes accelerates the dissipation of wake vortices and improves the total pressure loss. Meanwhile, the enhanced flow turbulence intensity brought on by wake mixing promotes the early bypass transition on the suction surface of the LPT-GV, thereby completely eliminating the flow separation in the entire spatiotemporal domains. This reduces the separation loss but increases the turbulent viscous loss by increasing the wet area of the turbulent boundary layer. Overall, when N ≤ 28, the overall loss of the integrated AITD studied in this paper reaches a minimum value, as the benefits brought on by the wake suppression of flow separation can offset the wake dispersion loss and the turbulent viscous loss caused by wake-induced transition. Considering that wake loss is inherently present, certain aerodynamic benefits can be obtained by using upstream wakes to inhibit the separation bubble on the integrated LPT-GV when N ≤ 28. This can be used to guide the selection of the rotor number in the high-pressure turbine, thereby improving the matching of the high-pressure turbine with the integrated AITD.

Author Contributions

Conceptualization, X.O.; validation, Z.L.; formal analysis, H.L.; investigation, H.D.; writing—original draft preparation, X.O.; writing—review and editing H.L.; project administration, X.L.; supervision, G.X. and J.Z. All authors have read and agreed to the published version of the manuscript.

Funding

This research was funded by the National Science and Technology Major Project (grant number J2019-II-0007-0027).

Data Availability Statement

Not applicable.

Conflicts of Interest

The authors declare no conflict of interest.

Nomenclature

ARoutlet-to-inlet area ratioLPT-GVlow-pressure turbine guide vane
AITDaggressive interturbine transition ductNwake number
C p 0 total pressure coefficientPVpassage vortices
C p s static pressure coefficient R h u b / R t i p inlet hub/casing ratio
C ω s streamwise vorticity coefficientSSsuction surface
C x axial chordTtime of one sweeping cycle
h height based on hubttime
H channel height at the ITD inlet T u turbulence intensity
H 12 shape factor Y total pressure loss
HPThigh-pressure turbine y + dimensionless thickness of the first layer
ITDinterturbine transition duct θ mean rise angle/momentum thickness
Laxial length ξ = 2 θ / s c o s β e loss coefficient
L/Hdimensionless axial length: axial chord t the minimum physical time step
LPTlow-pressure turbine

References

  1. Dominy, R.G.; Kirkham, D.A. The Influence of Blade Wakes on the Performance of Inter-turbine Diffusers. J. Turbomach. 1996, 118, 347–352. [Google Scholar] [CrossRef]
  2. Dominy, R.G.; Kirkham, D.A.; Smith, A.D. Flow Development through Inter-turbine Diffusers. J. Turbomach. 1998, 120, 298–304. [Google Scholar] [CrossRef]
  3. Bailey, D.W.; Carrotte, J.F. The influence of inlet swirl on the flow within an annular s-shaped duct. In Turbo Expo: Power for Land, Sea, and Air; American Society of Mechanical Engineers: New York, NY, USA, 1996; Volume 78729. [Google Scholar]
  4. Arroyo Osso, C.; Wallin, F.; Johansson, T.G. Experimental and Numerical Investigation of an Aggressive Intermediate Turbine Duct: Part 2-Flowfield under Off-Design Inlet Conditions. In Proceedings of the 26th AIAA Applied Aerodynamics Conference, Honolulu, HI, USA, 18–21 June 2008; p. 7056. [Google Scholar]
  5. Spataro, R.; Göttlich, E.; Lengani, D.; Faustmann, D.; Heitmeir, F. Development of a turning mid turbine frame with embedded design—Part I: Design and steady measurements. J. Turbomach. 2014, 136, 071008. [Google Scholar] [CrossRef]
  6. Zhang, X.; Hu, S.; Benner, M.; Gostelow, P.; Vlasic, E. Experimental and Numerical Study on an Inter-turbine Duct. In Proceedings of the ASME 2010 International Mechanical Engineering Congress and Exposition, Vancouver, BC, Canada, 12–18 November 2010; pp. 679–690. [Google Scholar]
  7. Miller, R.J.; Moss, R.W.; Ainsworth, R.W.; Harvey, N.W. The Development of Turbine Exit Flow in a Swan-Necked Inter-stage Diffuser. In Proceedings of the ASME Turbo Expo 2003: Power for Land, Sea, and Air, Atlanta, GA, USA, 16–19 June 2003; pp. 863–875. [Google Scholar]
  8. Zhang, Y.; Hu, S.; Mahallati, A.; Zhang, X.; Vlasic, E. Effects of Area Ratio and Mean Rise Angle on the Aerodynamics of Inter-Turbine Ducts. J. Turbomach. 2018, 140, 091006. [Google Scholar] [CrossRef]
  9. Norris, G.; Dominy, R.G. Diffusion Rate Influences on Inter-Turbine Diffusers. Proc. Inst. Mech. Eng. Part A J. Power Energy 1997, 211, 235–242. [Google Scholar] [CrossRef]
  10. Wallin, F.; Eriksson, L.-E. Response Surface-Based Transition Duct Shape Optimization; ASME paper, ASME 2006-90978; ASME: New York, NY, USA, 2006. [Google Scholar]
  11. Axelsson, L.U.; Johansson, T.G. Experimental Investigation of the Time-Averaged Flow in an Intermediate Turbine Duct. In Proceedings of the ASME Turbo Expo 2008: Power for Land, Sea, and Air, Berlin, Germany, 9–13 June 2008; pp. 1313–1322. [Google Scholar]
  12. Göttlich, E.; Marn, A.; Pecnik, R.; Malzacher, F.; Schennach, O.; Pirker, H. The Influence of Blade Tip Gap Variation on the Flow through an Aggressive S-Shaped Intermediate Turbine Duct Downstream a Transonic Turbine Stage: Part II—Time-Resolved Results and Surface Flow. In Proceedings of the ASME Turbo Expo 2007: Power for Land, Sea, and Air, Montreal, QC, Canada, 14–17 May 2007; pp. 843–853. [Google Scholar]
  13. Marn, A.; Göttlich, E.; Cadrecha, D.; Pirker, H.P. Shorten the Intermediate Turbine Duct Length by Applying an Integrated Concept. In Proceedings of the ASME Turbo Expo 2008: Power for Land, Sea, and Air, Berlin, Germany, 9–13 June 2008; pp. 1041–1051. [Google Scholar]
  14. Spataro, R.; Santner, C.; Lengani, D.; Göttlich, E. On the Flow Evolution through a LP Turbine with Wide-Chord Vanes in an S-Shaped Channel; ASME: New York, NY, USA, 2012; GT2012-68178. [Google Scholar]
  15. Bader, P.; Sanz, W.; Spataro, R.; Göttlich, E. Flow Evolution through a Turning Mid Turbine Frame With Embedded Design. In Proceedings of the ASME Turbo Expo 2014: Turbine Technical Conference and Exposition, Düsseldorf, Germany, 16–20 June 2014; American Society of Mechanical Engineers: New York, NY, USA, 2014. GT2014-25009. [Google Scholar]
  16. Faustmann, C.; Zerobin, S.; Spataro, R.; Marn, A.; Heitmeir, F.; Gottlich, E. On the Acoustics of a Turning Mid Turbine Frame With Embedded Design in a Two-Stage Test-Turbine. Proc. Inst. Mech. Eng. Part A J. Power Energy 2015, 229, 529–538. [Google Scholar] [CrossRef]
  17. Wang, P. Design and Flow Mechanism of Integrated Aggressive Intermediate Turbine Duct; Institute of Engineering Thermophysics, C.A.S.: Beijing, China, 2014. [Google Scholar]
  18. Xu, Q.; Wang, P.; Du, Q.; Liu, J.; Liu, G. Effects of Axial Length and Integrated Design on the Aggressive Intermediate Turbine Duct. Proc. IMechE Part A J. Power Energy 2018, 233, 443–456. [Google Scholar] [CrossRef]
  19. Hodson, H.P.; Howell, R.J. The Role of Transition in High-Lift Low-Pressure Turbines for Aero-Engines. Prog. Aerosp. Sci. 2005, 41, 419–454. [Google Scholar] [CrossRef]
  20. Mahallati, A. Aerodynamics of a Low Pressure Turbine Airfoil under Steady and Periodically Unsteady Conditions. Ph.D. Thesis, Carleton University, Ottawa, ON, Canada, 2004. [Google Scholar]
  21. Geng, K.; Hu, C.; Yang, C.; Li, Y.; Yang, C. Loss evaluation and aerodynamics investigation of an aggressive intermediate turbine duct under off-design conditions. Proc. Inst. Mech. Eng. Part G J. Aerosp. Eng. 2022, 236, 3428–3443. [Google Scholar] [CrossRef]
  22. Fan, D.; Zhou, C. Streamwise vortex transportation and loss generation in an intermediate turbine duct. Proc. Inst. Mech. Eng. Part A J. Power Energy 2020, 234, 766–776. [Google Scholar] [CrossRef]
  23. Liu, J.; Du, Q. Numerical Investigation on the Effects of Cavity-Blowing Jet on Intermediate Turbine Duct Flowfield. Int. J. Aeronaut. Space Sci. 2020, 21, 172–185. [Google Scholar] [CrossRef]
  24. Zhou, C.; Dong, F.; Hou, J. The Effects of Incoming Vortex and Wake on the Aerodynamics of an Intermediate Turbine Duct. ASME J. Turbomach. 2022, 144, 051012. [Google Scholar] [CrossRef]
  25. Lei, Z.; Sun, S.; Li, G.; Liu, H.; Ouyang, X.; Zhang, Y.; Lu, X.; Xu, X.; Xu, G.; Zhu, J. Influence of Wake Sweeping Frequency on the Unsteady Flow Characteristics of an Integrated Aggressive Interturbine Duct. Appl. Sci. 2022, 12, 11751. [Google Scholar] [CrossRef]
  26. Lei, Z.; Liu, H.; Li, G.; Gong, J.; Zhang, Y.; Lu, X.; Xu, G.; Zhu, J. Influence of Wake Intensity on the Unsteady Flow Characteristics of the Integrated Aggressive Interturbine Duct. Appl. Sci. 2022, 12, 6655. [Google Scholar] [CrossRef]
Figure 1. Sketch of integrated AITD [26]. Section B0: computational domain inlet; Section B1: AITD inlet; Section B2–B6: cross-section perpendicular to the streamline within the AITD; Section B7, B8 and B9: located at 25%Cx, 50%Cx, and 100%Cx downstream of the LPT-GV (Cx represents the mid-span chord of the LPT-GV); Section C1–C5: the internal streamwise section in the integrated LPT-GV.
Machines 11 00728 g001
Figure 2. Computing domain and mesh for the integrated AITD. (a) Computing domain and grid. (b) Mesh independence.
Machines 11 00728 g002
Figure 3. Experimental and numerical simulation results: (a) integrated AITD for verification; (b) dispersion of total pressure coefficient in section A; (c) experimental results of total pressure distribution in section A; (d) numerical results of total pressure distribution in section A.
Machines 11 00728 g003
Figure 4. Turbulence intensity contour in the mid-span section of the integrated AITD: (a) N = 14; (b) N = 42; (c) N = 56. (Red arrow: Propagation trajectory of wake center; Dash line: the boundary of the wake).
Machines 11 00728 g004
Figure 5. Time-averaged streamwise vorticity contour in different sections of the integrated AITD. (a) N = 14; (b) N = 42; (c) N = 56. (Red line: wake center; Black arrow: stretching direction; Black circle: squeezing zone).
Machines 11 00728 g005
Figure 6. Radial distribution and contour of total pressure coefficient in section B6: (a) Radial distribution of Cp0; (b) Cp0 contour for N = 14 case; (c) Cp0 contour for N = 42 case; (d) Cp0 contour for N = 56 case.
Machines 11 00728 g006
Figure 7. Instantaneous limiting streamline on the suction face of LPT-GV: (a) wake cycle; (b) N = 14; (c) N = 42; (d) N = 56.
Machines 11 00728 g007
Figure 8. Spatiotemporal contour of shape factor and loss coefficient of the boundary layer at the mid-span of integrated LPT-GV.
Machines 11 00728 g008
Figure 9. Total pressure coefficient contour in the integrated LPT-GV passage: (a) N= 14; (b) N = 42; (c) N = 56.
Machines 11 00728 g009aMachines 11 00728 g009b
Figure 10. Pitchwise mass-averaged total pressure coefficient of the integrated LPT-GV.
Machines 11 00728 g010
Figure 11. Total pressure loss of the integrated AITD and its components.
Machines 11 00728 g011
Table 1. Geometric parameters of the integrated AITD.
AITD Integrated LPT-GV
Inlet passage height, H (mm)85Leading edge radius (mm)3.5
Inlet hub/casing ratio, R h u b / R t i p 0.656Trailing edge radius (mm)2.5
Mean rise angle, θ (°)28.08Staggle angle (°)35
Non-dimensional length, L/H1.97Inlet metal angle (°)−6
Outlet/inlet area ratio, AR1.34Outlet metal angle (°)62
Disclaimer/Publisher’s Note: The statements, opinions and data contained in all publications are solely those of the individual author(s) and contributor(s) and not of MDPI and/or the editor(s). MDPI and/or the editor(s) disclaim responsibility for any injury to people or property resulting from any ideas, methods, instructions or products referred to in the content.

