1. Introduction
Over the past few decades, continuum manipulators have garnered considerable attention due to their inherent flexibility and dexterity. These characteristics have made them popular in a wide range of industries, including inspection, assembly, manufacturing, surgery, and space exploration [
1,
2,
3,
4,
5]. Recently, flexible robots have become increasingly popular as enabling technologies for advanced surgical treatments. One of the primary reasons for this is the need to operate in difficult-to-reach anatomical regions using minimally invasive surgical methods, which enable surgeons to perform complex operations with smaller incisions, reduced patient discomfort, and faster recovery times. With their snake-like motion, flexible robots can potentially navigate through narrow and intricate anatomical structures, minimize collateral damage to healthy tissues, and improve the precision and safety of surgical interventions [
6,
7].
Stiffness is a crucial performance metric for flexible robots, particularly in medical applications. These compliant manipulators need adequate stiffness to effectively handle tissues during surgical procedures. However, their inherent compliance often leads to shape distortion and deflection issues when dealing with the payloads. Striking the right balance between flexibility and stiffness is vital, because it influences the robot’s capacity to exert force and maintain stability while navigating intricate anatomical structures. Hence, focusing on maximizing stiffness (or payload capacity) while considering the manipulator’s dimensions and shape constraints highlights the need for design optimization.
Transoral laser microsurgery (TLM) is an application wherein continuum robots with sufficient flexibility and stiffness can provide a promising solution to address current challenges associated with using standard rigid instruments. TLM is the preferred and recommended method for treating common laryngeal conditions, such as voice cord cysts, polyps, nodules, granulomas, and tumors [
8]. TLM has been shown to improve functional outcomes with the benefits of (i) no tracheotomy, (ii) minimal to no bleeding due to inherent tissue coagulation, (iii) fewer complications, (iv) custom resections, (v) high cost savings, and (vi) the better postoperative preservation of laryngeal function and voice quality [
9,
10].
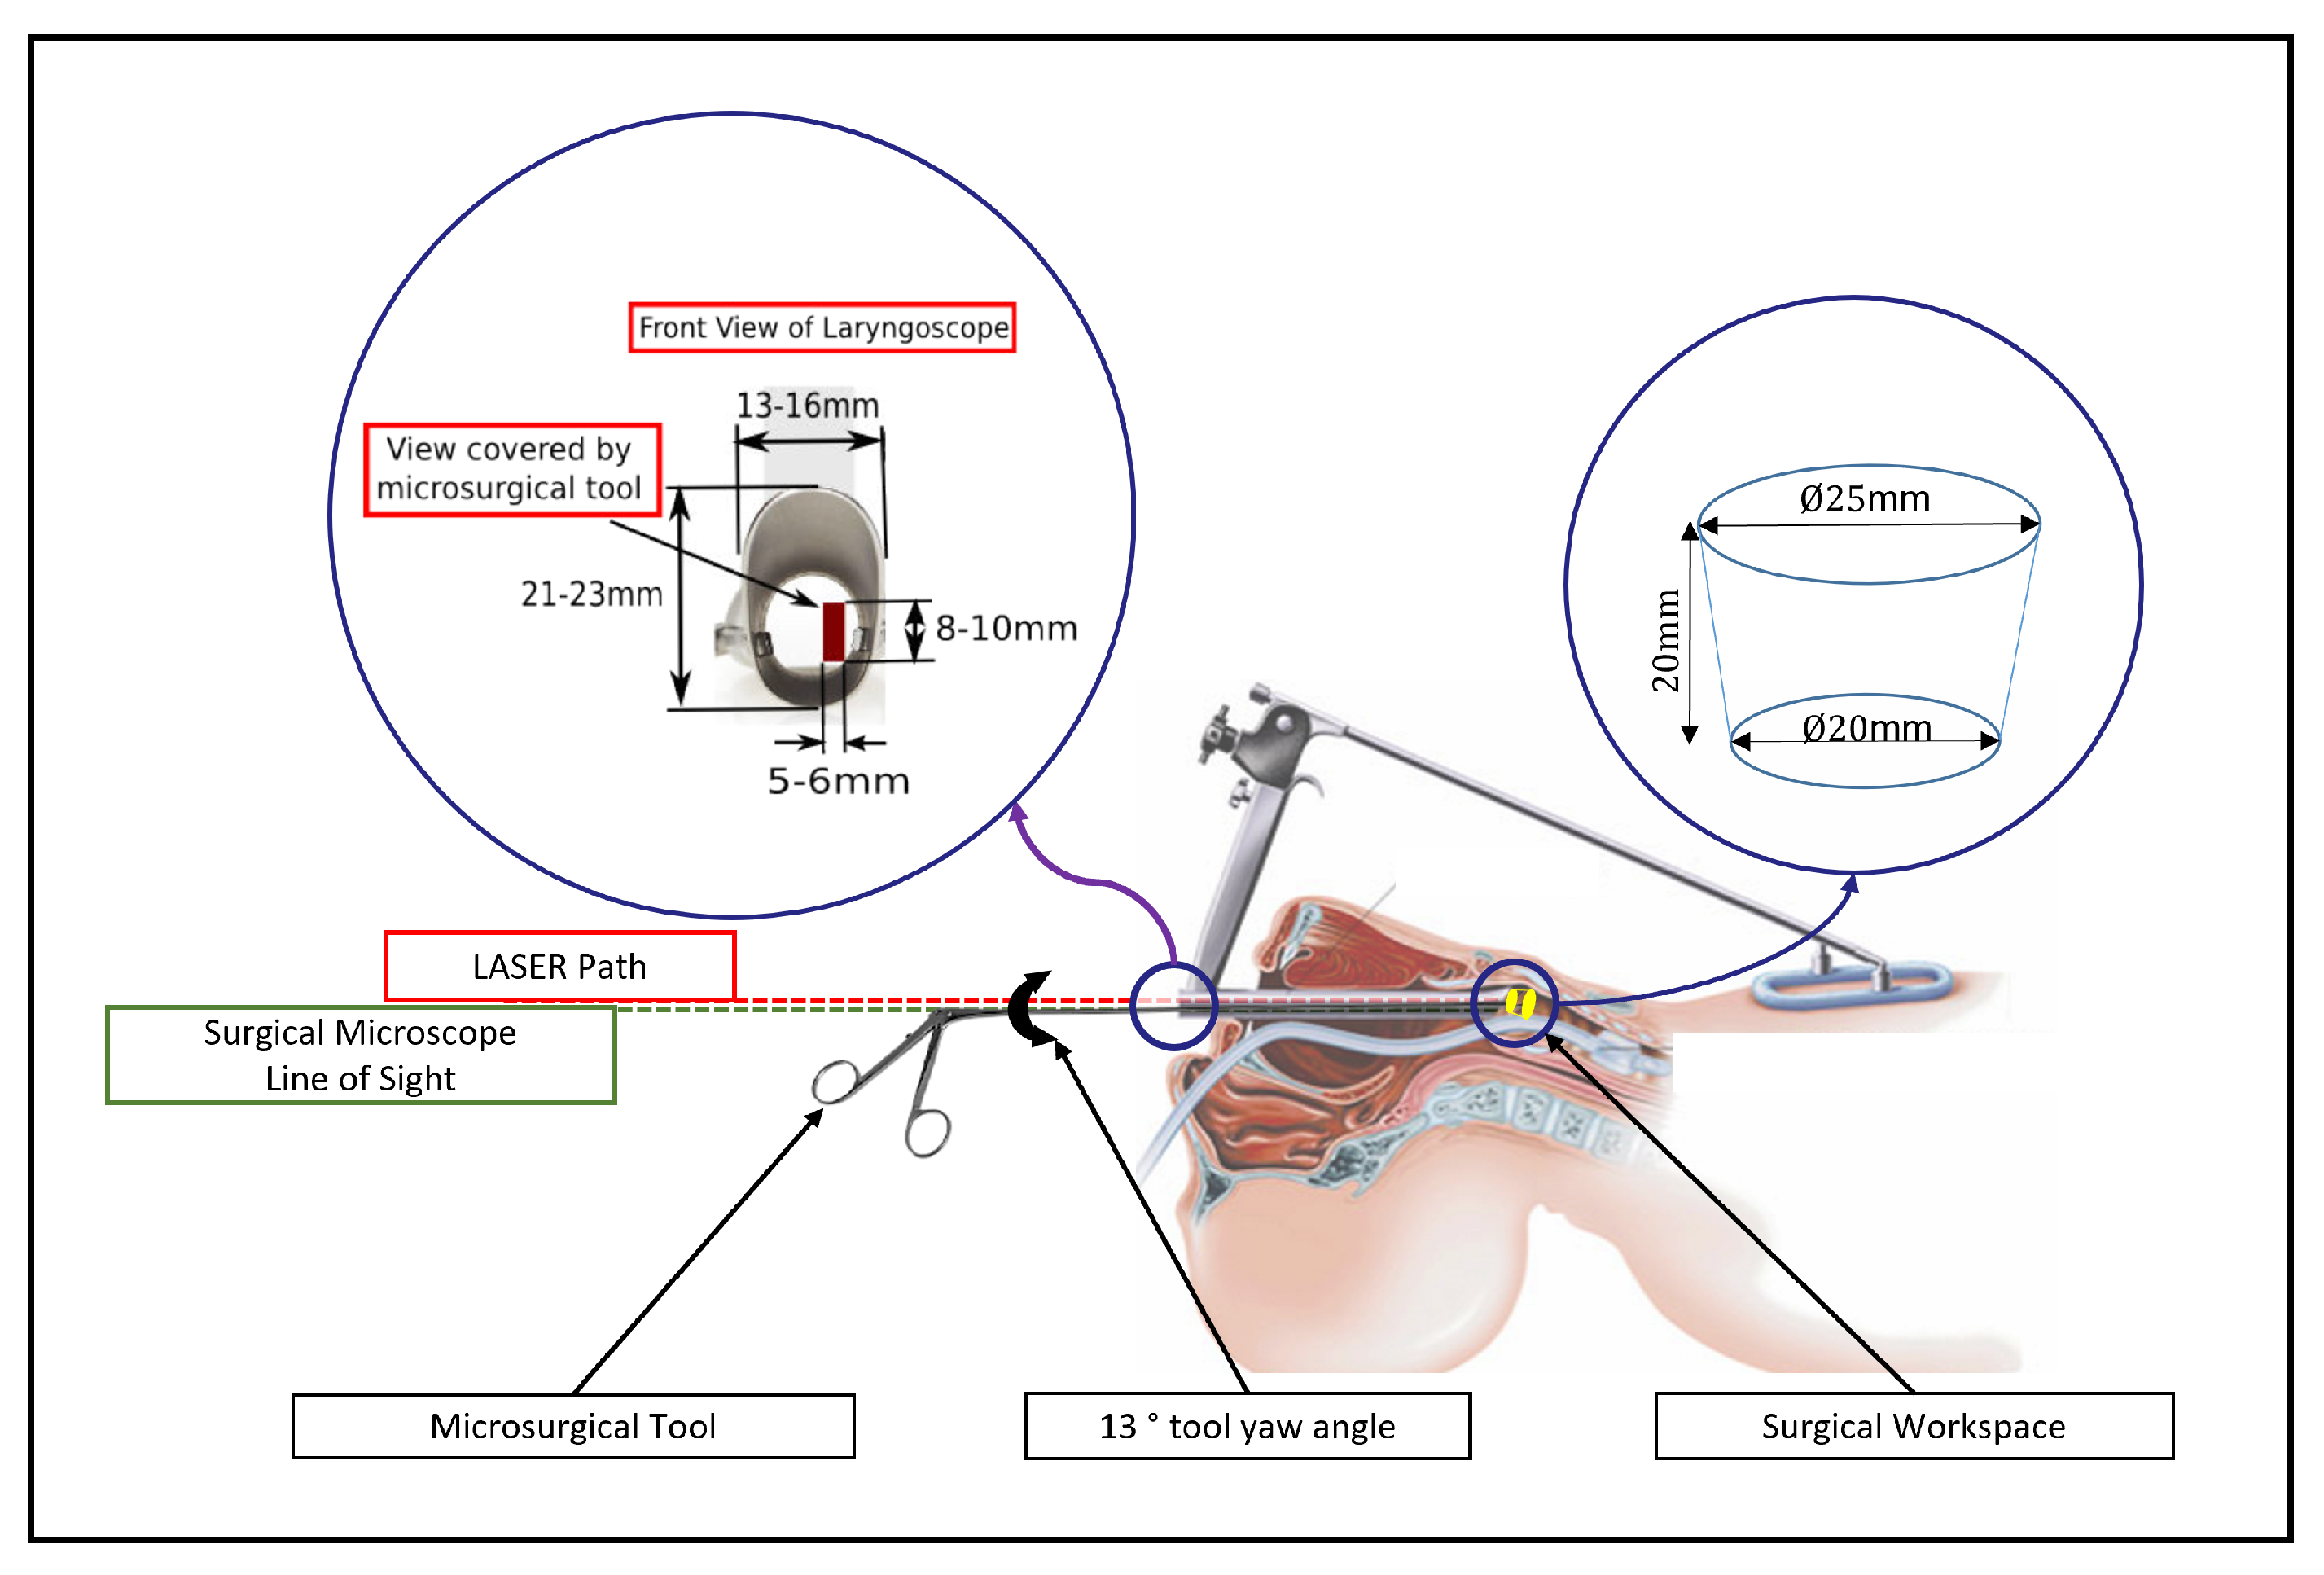
In the traditional TLM setup (see
Figure 1), a laryngoscope is used to provide a direct line of sight between the larynx and the surgical microscope and laser. It is also used as a working channel for rigid instruments such as forceps, which are required to manipulate tissue and keep it in traction for laser ablation. However, these rigid instruments should also be kept away from the laser path, which is challenging given the relatively narrow cross-section of the laryngoscope [
11]. In addition, the difficulties in achieving adequate laryngeal exposure, the dexterity deficiency of rigid tools, and the need for sub-millimeter precision during laser ablation make TLM a highly challenging microsurgical procedure. This has motivated research towards new instrumentation for TLM, including flexible manipulators [
12,
13].
Various design architectures have been proposed for flexible surgical robots, including continuum and hyper-redundant manipulators (i.e., based on several discrete joints). Continuum robots have infinite degrees of freedom (DoF), which allows them to offer smooth bending. However, they often require complex control methods and provide low compliance. On the other hand, hyper-redundant robots facilitate miniaturization and are easier to control, but have a limited number of DoF. Nonetheless, this number can be customized to the specific application, so it is not necessarily a performance-limiting property.
Flexible manipulators can also be broadly split into two groups: soft and hard, depending on the material from which they are made. The term ’soft manipulators’ refers to objects made of soft materials that resemble tentacles and trunks, as opposed to ’hard manipulators’, which are made of solid or super-elastic linkages and joints. Furthermore, they can be classified into different groups based on the actuation method. A brief comparison and classification of flexible robots used in the medical industry is presented in
Table 1.
In this study, a hyper-redundant manipulator with a rolling contact joint was chosen for the following reasons: (i) miniaturization, (ii) ease of control, (iii) compliance, and (iv) variable stiffness. Rolling contact joint manipulators have been explored by researchers for various surgical applications, such as retinal surgery [
16], cardiovascular interventions [
17], and endoluminal endoscopic surgery [
20]. These devices have external diameters ranging from 1 mm to 17 mm.
Most studies involving rolling contact joint manipulators have focused on the mechanism’s design, kinematics, and bending behavior [
16,
17,
18]. In addition, other studies have investigated the relationships between the mechanism’s stiffness and the joint geometry or the tendon path [
18,
19,
20]. Tapered [
32], convergent, or sigma-shaped tendon [
33,
34] paths have proven to considerably improve the stiffness against lateral forces compared to regular parallel tendon paths. Furthermore, multiple alternative approaches have been explored to constrain and lock the shape of the manipulator to increase stiffness and load capacity, including the use of auxiliary links [
35], dragon skin structures [
36], and latches with electromagnets [
37].
Design optimization is crucial in designing flexible manipulators, as it enables a methodical adjustment of the design parameters considering the device’s requirements and constraints. This facilitates the creation of devices with the best possible performance for the desired task. However, despite the substantial efforts to increase the stiffness and load capacity of hyper-redundant manipulators, design optimization studies are scarce [
33,
38,
39]. Furthermore, they have not examined all the design variables or the requirements and constraints of specific surgical applications.
Sensitivity analysis plays a vital role in the design optimization process, as it helps designers gain a deeper understanding of the problem at hand. It is a powerful statistical tool to assess the impact of input parameters on a system’s performance and identify how the output changes in response to input variations. This approach generates a set of contribution indices that quantify the variance of the system under analysis within the entire search space, which can be used for guiding design decisions. This allows the efficient allocation of resources by focusing on correctly setting important design parameters. Furthermore, parameters with a low impact can be fixed during the optimization process, improving the computational efficiency.
However, statistical inference is known to be complex and affected by factors such as noise, data quality and quantity, and false assumptions. To tackle these challenges, a problem must be approached from multiple angles to draw more robust conclusions [
40]. Therefore, the proposed global sensitivity analysis framework included a multi-model and multi-analysis characterization of a tendon-driven rolling contact joint hyper-redundant manipulator. Specifically, three different sensitivity analysis approaches were employed on two distinct device models. This allowed the identification of ambiguities between different models and approaches.
The rest of this article is organized as follows. First, the design of the desired TLM manipulator is presented, and two different stiffness models are introduced. Then, focus is placed on identifying the independent variables that determined its characteristics. Subsequently, the proposed global sensitivity analysis framework is described, including details on all three methods used in this work. Theoretical and experimental results regarding the characterization of the stiffness of the designed manipulator follow. Finally, the paper is concluded with a summary of its key findings and a discussion of the implications of the proposed sensitivity analysis method.
2. Manipulator Design for TLM and Stiffness Models
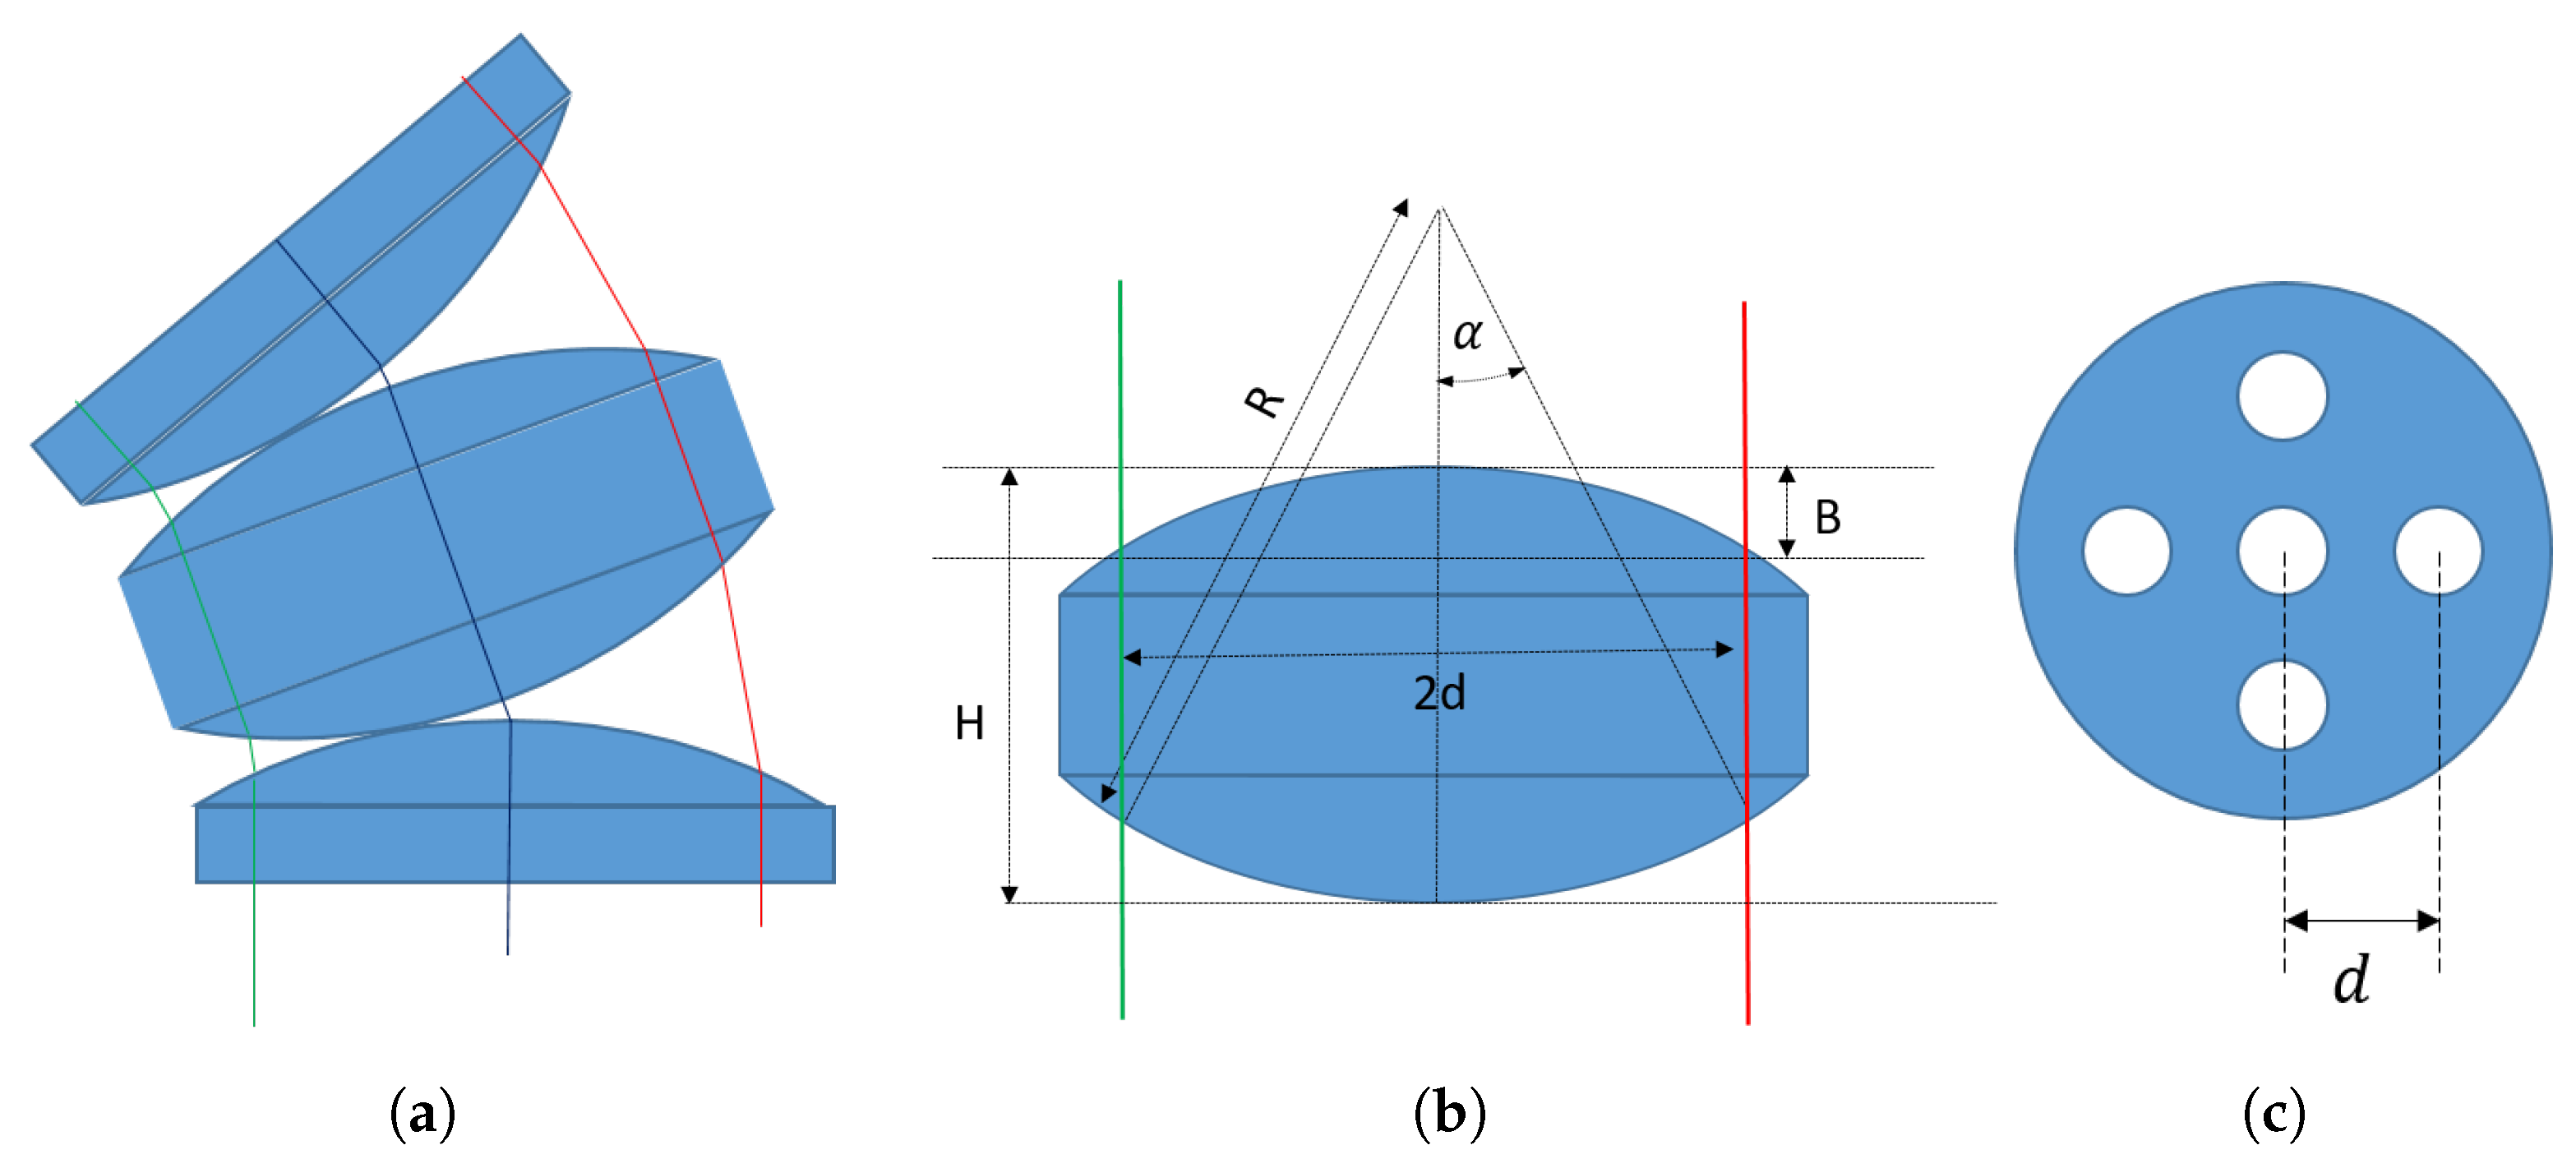
A rolling joint manipulator is made up of multiple identical rigid links. The links have cylindrical top and bottom surfaces, which create a rolling joint.
Figure 2a shows a simple schematic of a one-DoF rolling joint manipulator with two joints. Similarly, a two-DoF manipulator can be created [
16,
17,
19] by changing the geometry of these links and assembling them in an orthogonal manner so that the rolling joints are perpendicular to each other, thus creating two bending directions. For a one-DoF manipulator, only two tendons are needed. Nonetheless, four tendons are generally used, since the additional two tendons align the rolling joints and maintain rolling contact without slipping. For this reason, this study considered a one-DoF manipulator with four tendons.
The operative workspace and the tissue manipulation force required for surgery determine the desirable characteristics of a flexible manipulator. These are related to the following device characteristics: (i) bending range, (ii) bending radius, and (iii) stiffness. The independent variables that determine these characteristics are the number of joints (N), the radius of contact (R), the disk thickness (H), and the distance between the central axis and the wire hole (d). These variables along with dependable variables are displayed in the
Table 2.
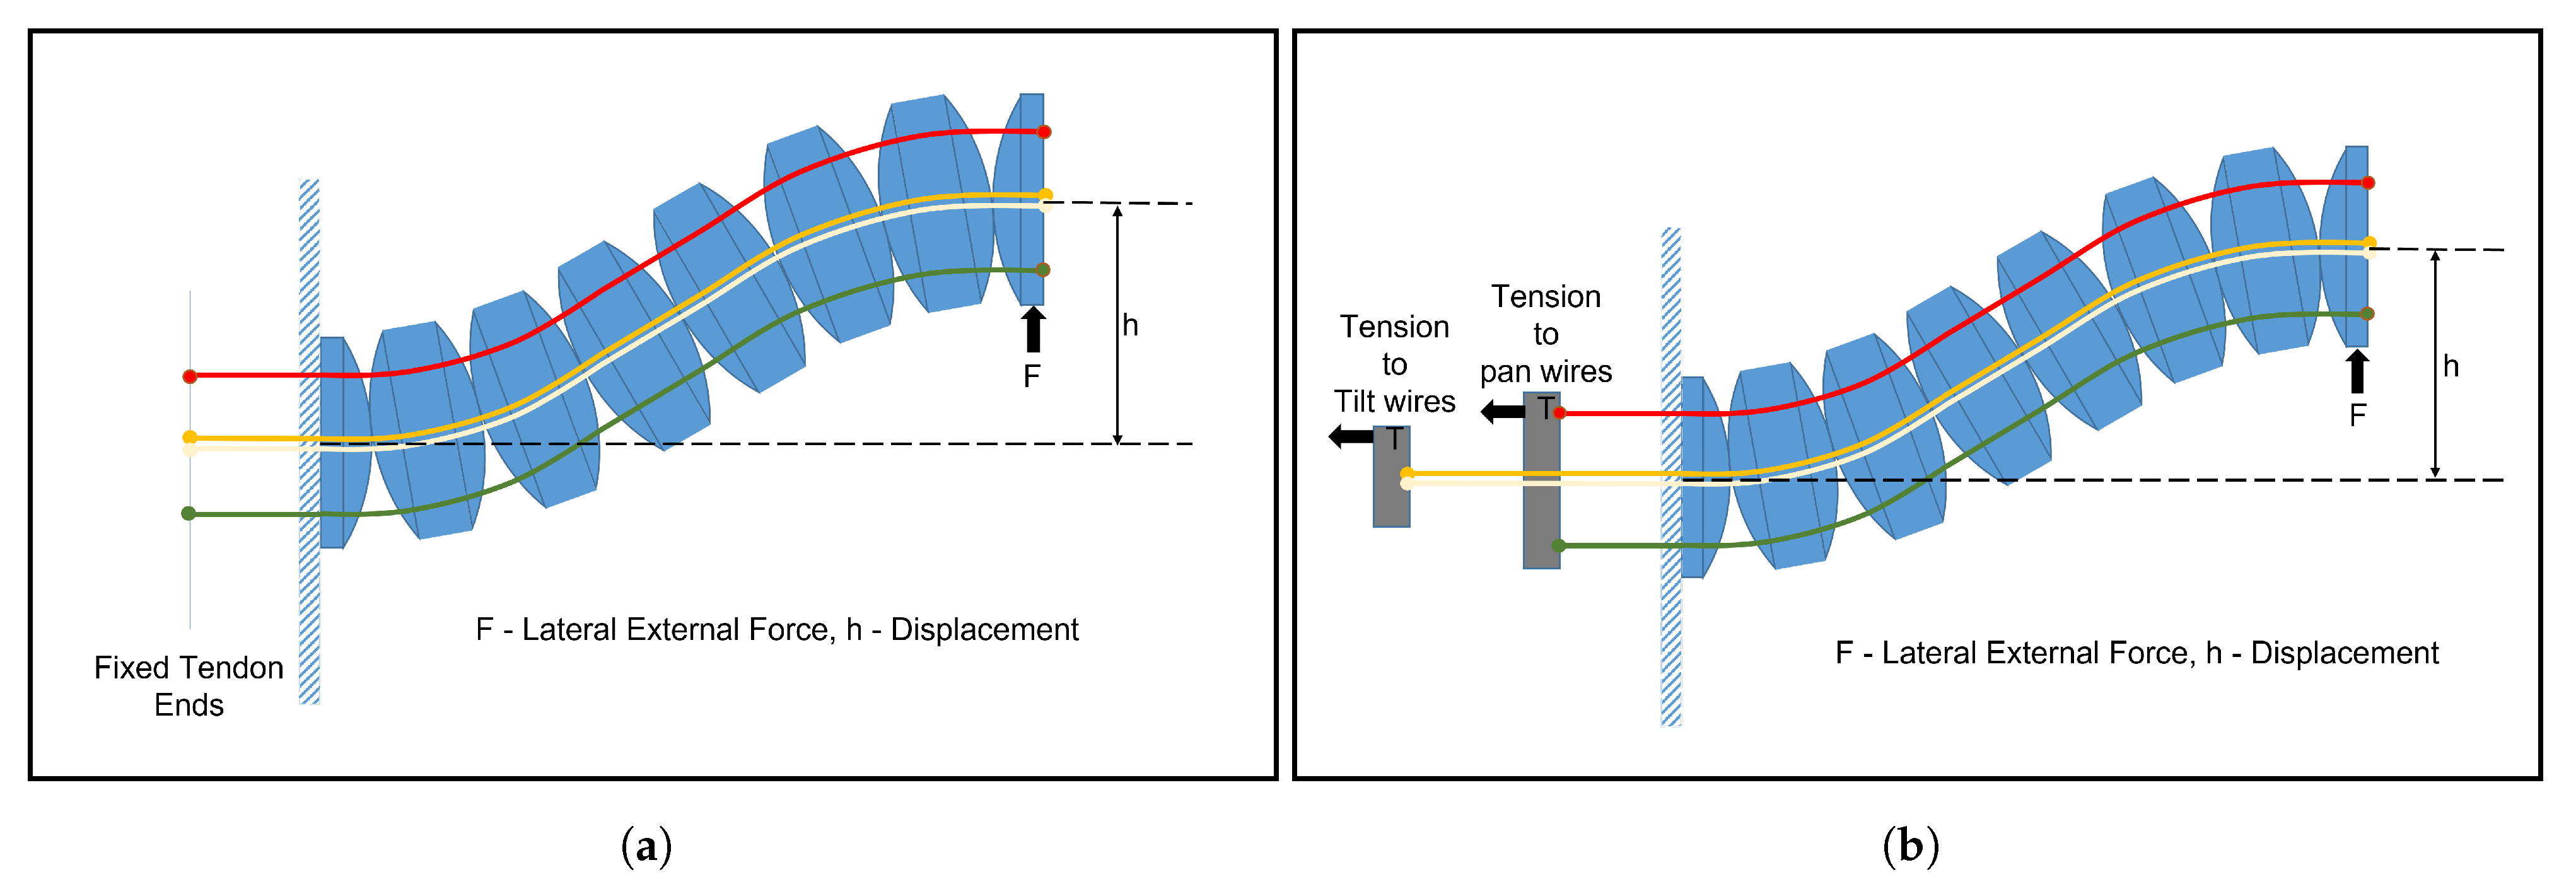
In this study, two different stiffness models were used to characterize the stiffness of the flexible manipulator through sensitivity analysis. The first model (Model 1) was proposed by Hwang and Kwon [
20]. The second model (Model 2) was introduced by Kim et al. [
19]. Both models present a similar approach to calculating the stiffness of the manipulator: they compute the manipulator’s bending shape under an external force (see
Figure 3). Then, the stiffness is determined by considering the external force (
F) and the resulting displacement (
h).
The concept behind both stiffness models revolves around using the virtual energy principle to find the work performed by F in displacing the manipulator over a distance h. This is then compared to the change in potential energy of the tendon system (in the case of Model 1), or to the work performed by the system (Model 2). Both models assume small displacements to simplify the calculations.
The key distinction between the two models lies in their assumptions about the tendons. Model 1 assumes that the tendons are fixed at the end and cannot move, leading to the conversion of all external work into elastic potential energy within the tendon. In contrast, Model 2 assumes that the tendon tension is maintained, allowing all external work to be balanced by the work performed to maintain constant tension. The differences are shown briefly in
Table 3.
Design Constraints for Transoral Laser Microsurgery
The available workspace for TLM is a narrow cylindrical area with a diameter in the range of
mm and a length of 20 mm [
11]. To design a manipulator that fits within this workspace, a bending radius of less than 10 mm is required, with a
bending angle. This allows access to the vocal cords from both sides. Additionally, it is crucial to ensure that the manipulator does not experience material failure throughout the entire workspace. Therefore, the maximum contact force generated within the manipulator should not exceed the material’s elastic limits. While these constraints are not necessary for sensitivity analysis, they are important for identifying feasible designs for TLM.
Traditional tools used in TLM have an outer diameter in the range of
mm [
13]. Hence, an upper bound for d of
mm was selected, ensuring an outer diameter of around 3 mm. With no specific constraints on N, R, and H, apart from manufacturing limitations, the lower bounds for these parameters were selected based on general manufacturing constraints and geometric design feasibility. The upper bounds were determined to provide sufficient designs for comparison and ample space for exploration. The specific ranges considered for each independent variable in the sensitivity analysis study are presented in the following section.
3. Sensitivity Analysis Methodology
Global sensitivity analysis is a statistical tool that allows a designer to understand the importance of input parameters to a system’s performance and how its output varies based on input variations [
41]. In robot design, this analysis can guide important design decisions and lead to the optimal use of available resources. The proposed approach was based on the general design optimization methodology described in [
42], refined to include a more meticulous multi-model and multi-method analysis. This improved the confidence level of the analysis results.
First, the complexity of the analysis could be reduced by setting parameters with a small effect as constants, which reduced the search space’s dimensionality and the required computational resources. Second, manufacturing precision could be decided based on the analysis results. Low-sensitivity components could be produced with cheaper methods, reducing production costs. Finally, understanding the system’s sensitivity to parameter variations could facilitate the design of robust devices with optimum performance.
In this study, a new design methodology was proposed based on sensitivity analysis that consisted of a series of experiments. Each experiment contributed to understanding the impact of different design parameters on the stiffness of the tendon-driven rolling joint hyper-redundant manipulator. The following three categories describe the experiments:
Correlation indices;
Performance indices;
Contribution indices.
The first category describes the distribution of the sampled data (i.e., if a correlation exists between the input data). For the experiments described in this work, the collinearity index was used. This metric examines if linear correlations exist between input variables. Well-distributed data should have a value close to one. The second category describes how accurately the algorithm explains the given data, quantifying the confidence in the outcome (i.e., in the contribution indices). For this, we used different performance indices, as described in the following section. Finally, the third category describes the main result, which is the contribution of each factor to the variance of the objective function. Variables with a higher impact have a higher value. The sum of all of the contribution indices for each experiment equaled one.
The variables presented in
Table 4 and their respective bounds were used for the experiments presented in the following subsections. The following steps were implemented in a proprietary and multi-disciplinary optimization software called modeFRONTIER [
43], and the two stiffness models were implemented in Matlab R2021a. The following subsections describe the algorithms and the results obtained when they were applied to the two stiffness models.
3.1. Design of Experiments
The first step in each part of an optimization methodology is the design of experiments (DOE), whereby suitable data for the experiment are generated. This is an essential part of every study, because the quality and quantity of the initial data determine the outcome. For the case of sensitivity analysis, the data need to be well-distributed with low correlation (to cover the search space adequately). A six-level full factorial algorithm generates = 7776 unique designs to achieve this. The algorithm generates designs for every combination of factors (input variables) and levels. In this study, five factors and six levels were used.
The resulting collinearity index for each variable was within the interval
, which shows that the generated sample was sufficient for this analysis [
41]. This dataset was used for all experiments in this article.
3.2. PCE-Based Sensitivity Analysis
Polynomial chaos expansion (PCE)-based sensitivity analysis is a variance-based [
44] method that uses a series of orthogonal polynomials to approximate the examined function and directly compute the first statistical moment of each variable.
The polynomial series is generated up to a given order called the order of expansion, with decimals of a higher order truncated. This method can estimate non-linear responses, and the examined models’ simplicity and low-dimensional input space allowed us to perform experiments with an order of seven, guaranteeing higher precision.
3.3. DRF-Based Sensitivity Analysis
The second sensitivity analysis algorithm estimated the effect of each design variable on the manipulator’s total stiffness using a distributed random forest (DRF)-based sensitivity analysis. DRF uses an ensemble of trees to approximate a linear regression model that fits the data [
45]. The contribution parameters are correlated and obtained from the regression model values, and the final values are obtained by averaging the performance of multiple trees.
The examined problem was non-linear; hence, this linear approach was also used to avoid the problem of overfitting. An advantage of this algorithm is that it is significantly more efficient regarding computational resources than the other two approaches.
3.4. SS-ANOVA Sensitivity Analysis
The third sensitivity analysis in the proposed methodology was based on a smoothing spline analysis of variance (SS-ANOVA) method [
46]. The advantage of this method over the previous ones is that it also computes interaction effects, i.e., the effects of every single parameter and the second-order interactions between them using a non-parametric function approximation (smoothing splines). Interaction effects describe how combinations of two input parameters affect the objective function variance. However, the extra information (interaction effects) increases the computational cost compared to the previous methods.
4. Sensitivity Analysis Results
In this section, the results from the sensitivity analysis are presented, demonstrating how the variance of the five examined design parameters (
Table 4) affected the variance of the manipulator’s stiffness.
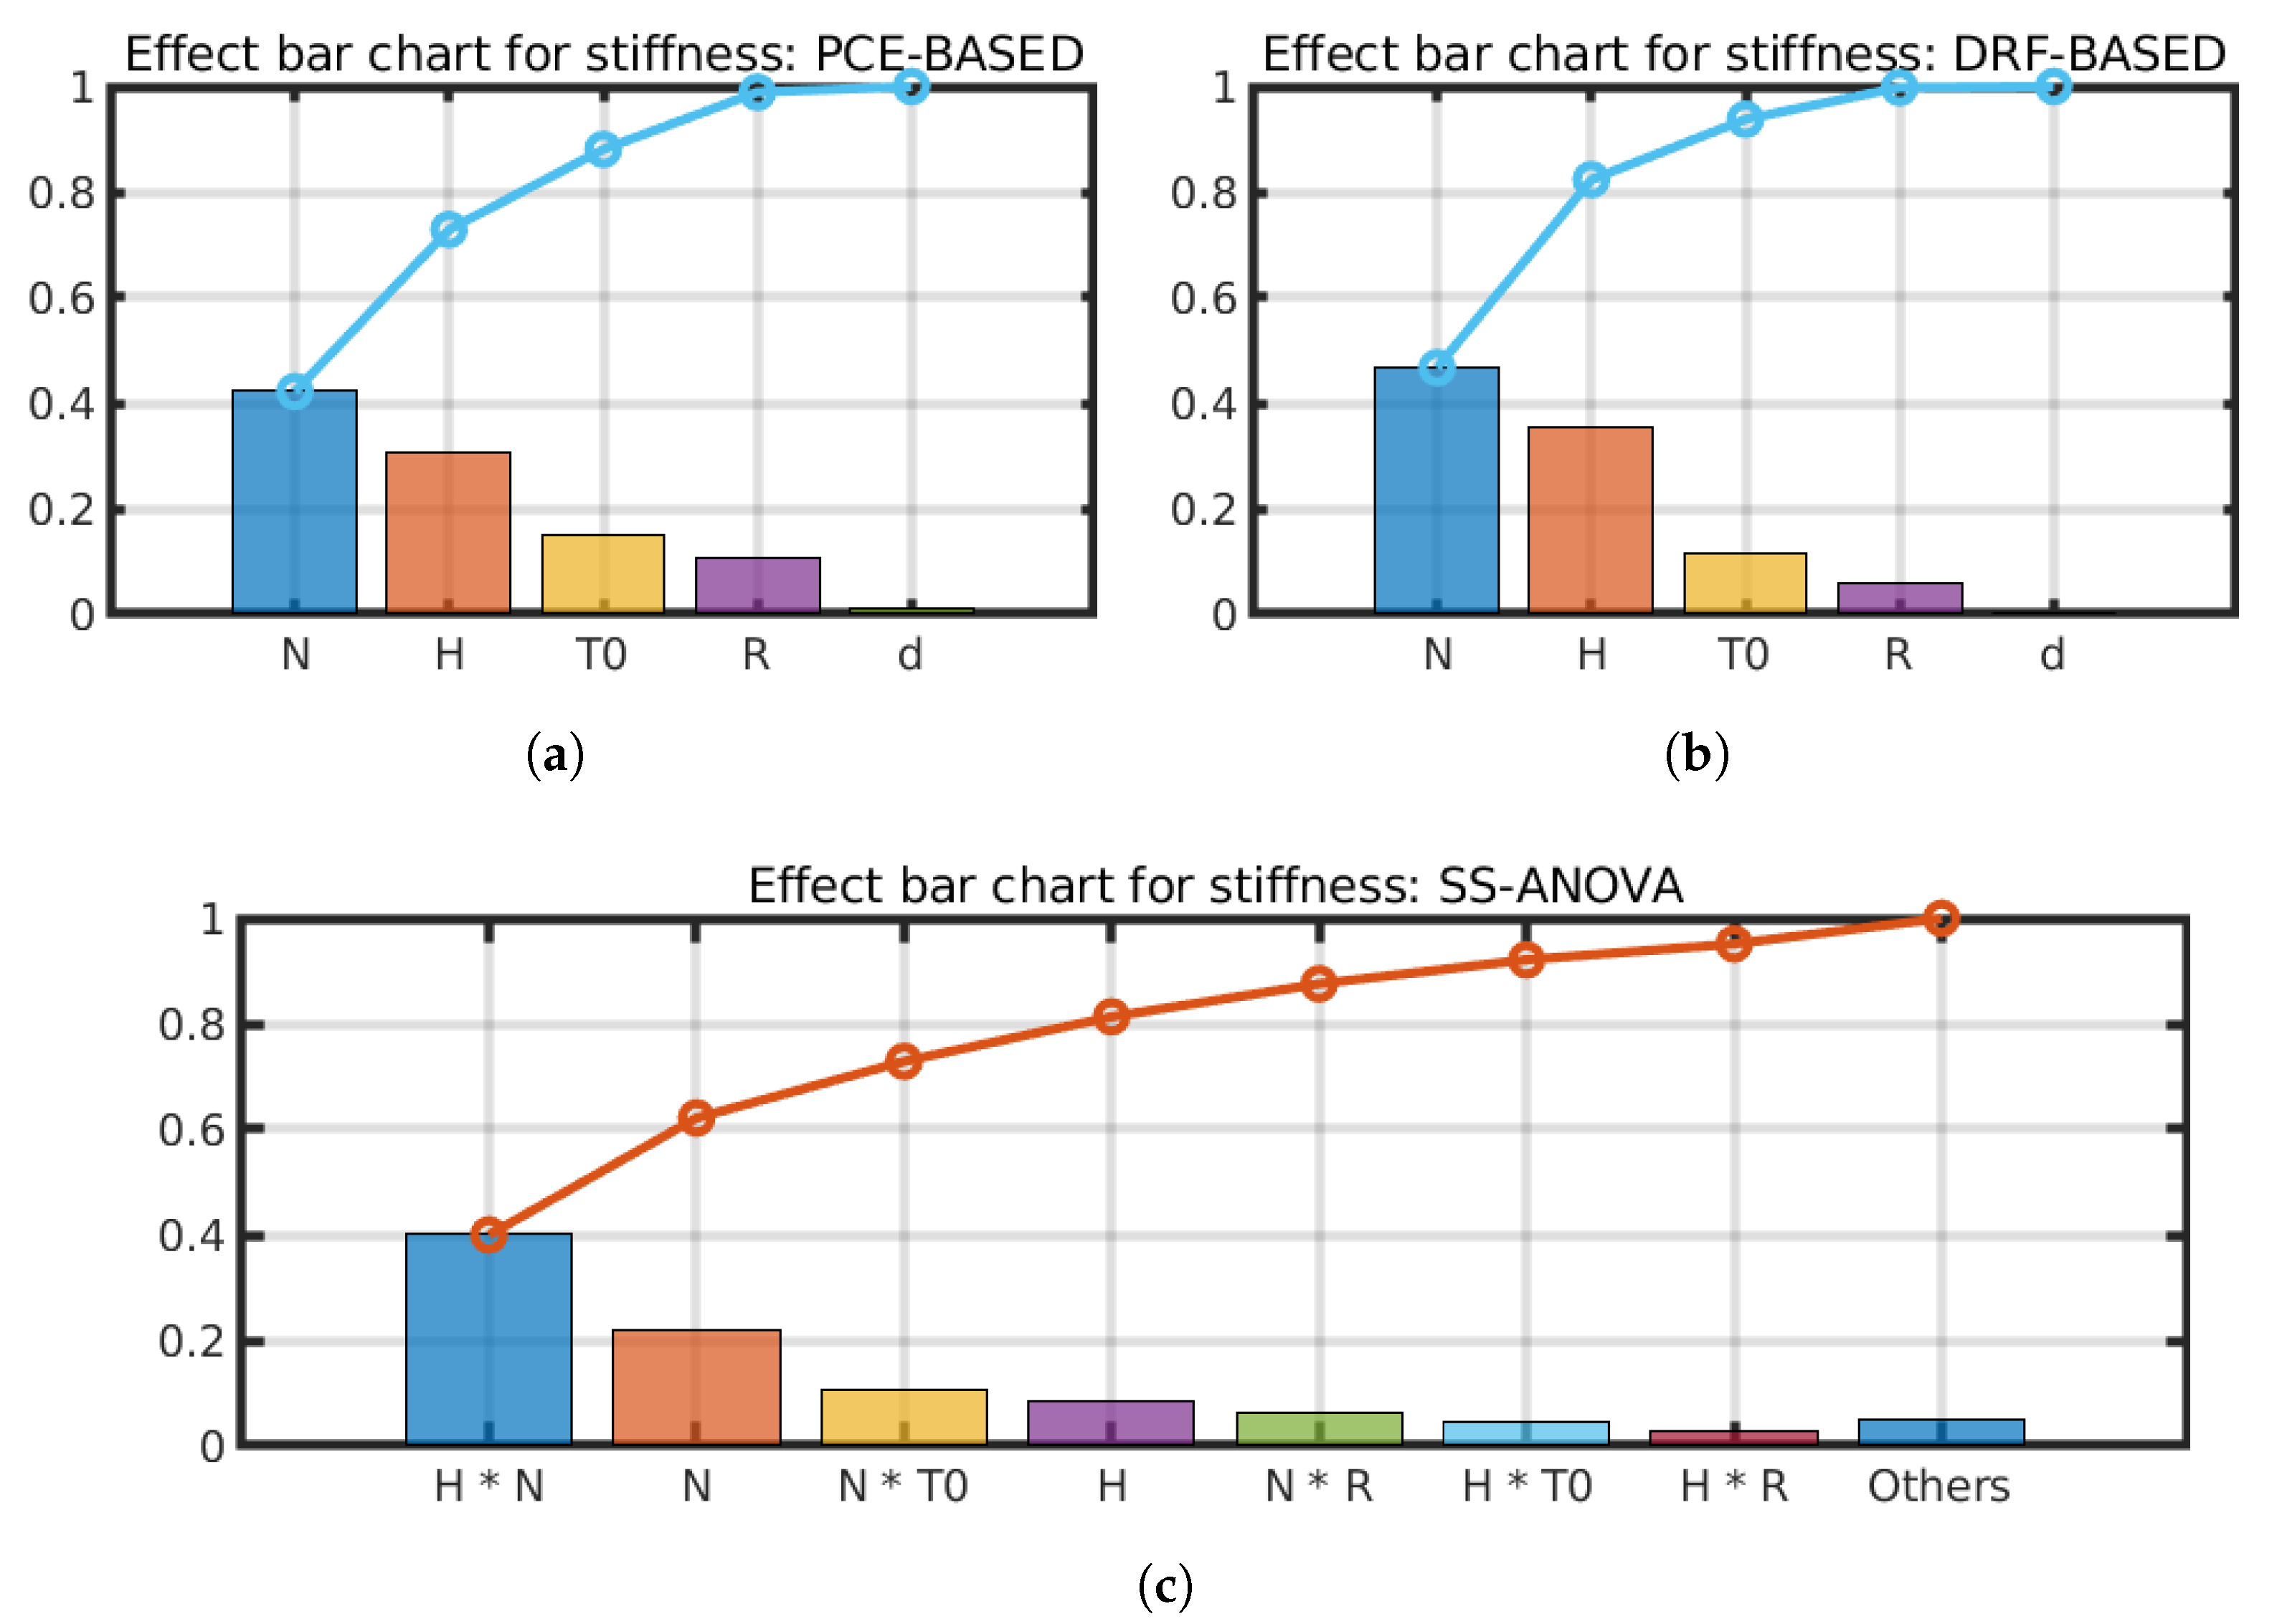
Figure 4 and
Figure 5 demonstrate the outcome of the three sensitivity analysis algorithms when applied to each of the two stiffness models presented in
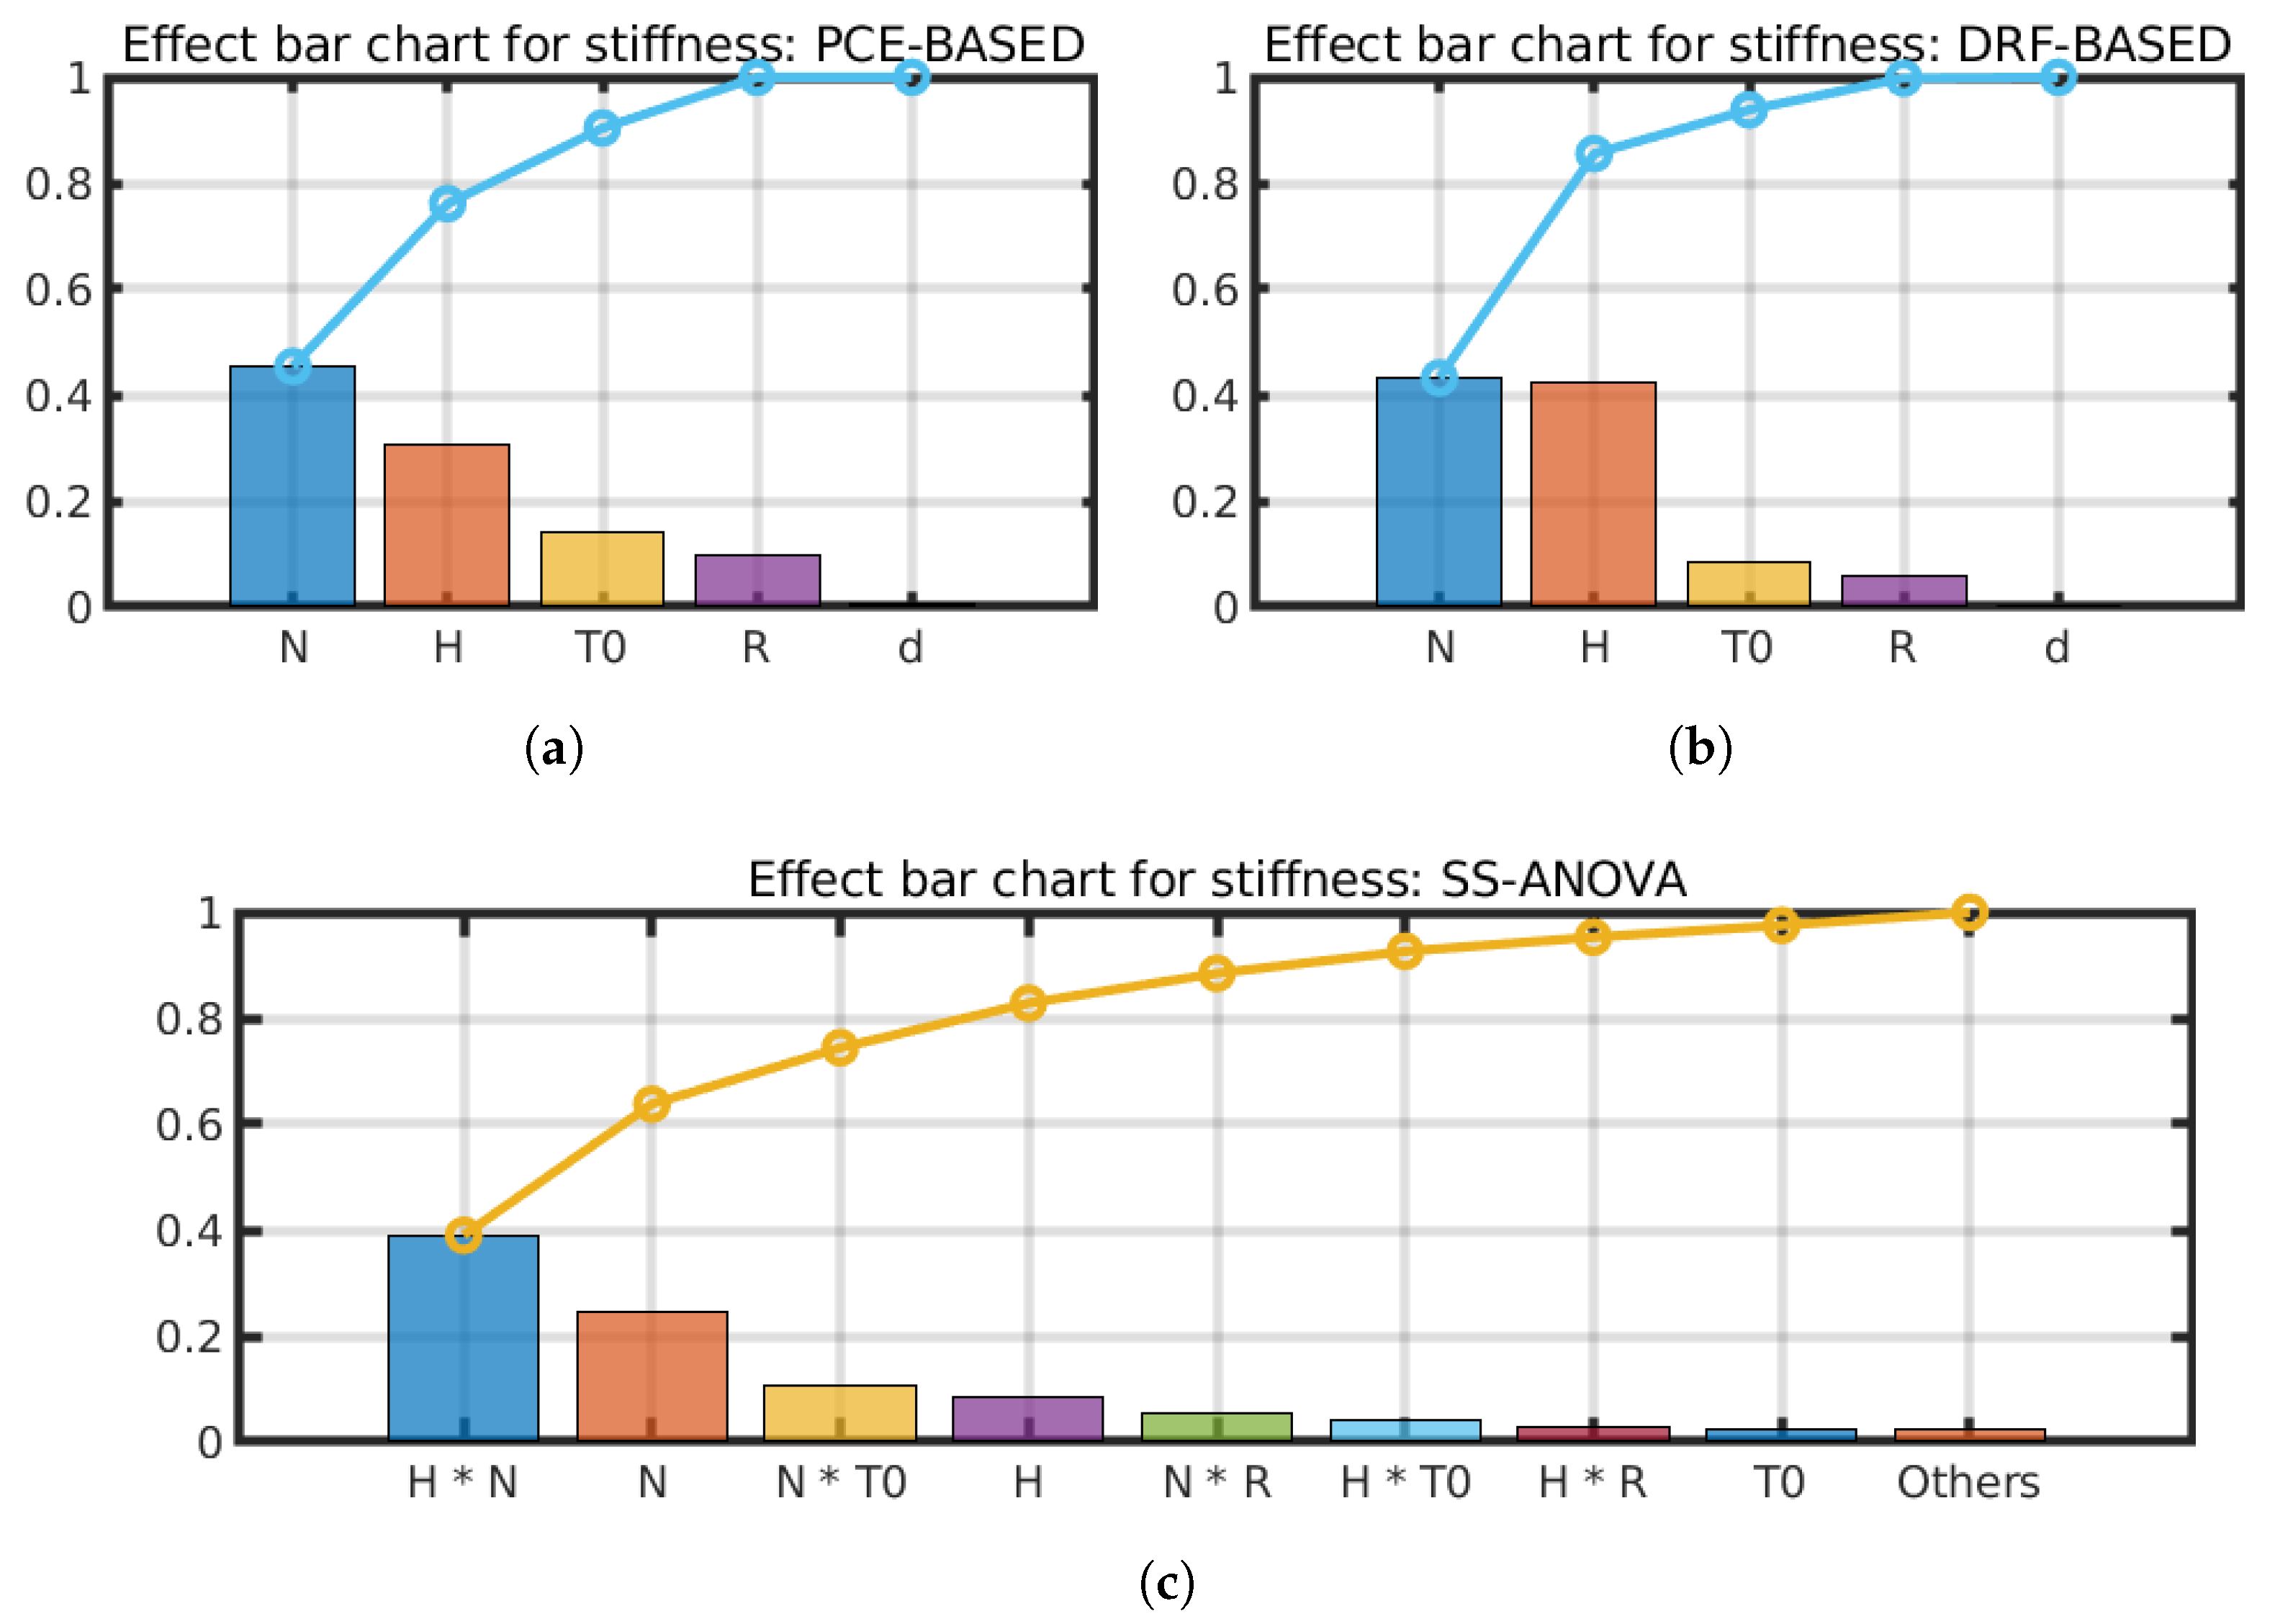
Section 2. Overall, the results mostly agreed with each other and provided interesting insights regarding the examined mechanism. These results were used to efficiently allocate the available resources and facilitate the design and experimental procedures.
Of the five examined parameters, N and H were shown to have the strongest effect on the stiffness of the mechanism, making them the most critical parameters to optimize during the design process. Parameters T0, R, and their interactions significantly affected the manipulator’s performance, meaning that they should also be considered in an optimization study. However, fewer resources could be spent on them. Finally, parameter d and its second-order interactions seemed to have no apparent effect on the stiffness of the manipulator. This finding suggested that an early design decision could be made to predefine the value of this parameter for the designer’s convenience based on manufacturing or any other criteria. Thus, the designer could (a) exclude this parameter from the optimization study and save computational resources, (b) make better use of available resources by allocating only those necessary for the design, and (c) facilitate the experimental and prototyping process by investigating other parameters with a higher sensitivity.
In the following subsections, the results of each approach are discussed considering their application to the two stiffness models.
4.1. PCE-Based Sensitivity Analysis Results
The performance indices were examined as a first step in each experiment to determine whether the results could be trusted.
Table 5 shows the performance index for this algorithm, the residual sum of squares (RSS), which represents the difference between the response values predicted by the sensitivity model and the simulation values. An RSS value close to zero indicates a good fit between the sensitivity model and the simulated data, which was the case for both models examined in this experiment.
The results of this approach applied to both models are shown in
Figure 4a and
Figure 5a. Both experiments agreed closely. The number of joints (variable N) had the highest contribution, followed by variables H, T0, and R, respectively. These parameters were also deemed important for the stiffness of the manipulator. On the contrary, variable d was shown to have no contribution to the outcome, with a contribution index lower than
.
4.2. DRF-Based Sensitivity Analysis Results
Table 6 shows the performance scores for the DRF approach. Parameter R
describes how well the model could predict the response value in terms of percentage and was calculated by the following formula:
where S
is the sum of squares of the regression, and S
is the variation in the input data.
Although the results mostly agreed with those of the PCE-based approach (
Section 3.2), the performance index R
did not provide high confidence regarding the model’s reliability (the closer the value is to one, the better the reliability). This could be attributed to factors such as the inability of this approach (or its implementation) to model the given system adequately or the fact that the given problem was highly non-linear, which was also indicated by the high performance index scores of the PCE-based approach (
Section 3.2), a method for non-linear models. Such scenarios demonstrate why multiple methods should be considered for sensitivity analysis.
The outcomes of the DRF approach applied to both models are presented in
Figure 4b and
Figure 5b. The results agreed with those in
Section 3.2; however, in this case, the number of joints (parameter H) seemed to have a contribution value close to that of N. Parameters R and T0 had a low but non-negligible contribution, and parameter d was shown to have no effect in both models.
4.3. SS-ANOVA Sensitivity Analysis Results
Table 7 displays the performance indices for this experiment. According to these values, a perfect fit was not achieved; however, these were acceptable values, and the results were cross-validated with two more methods.
The results of this approach are presented in
Figure 4c and
Figure 5c. The main purpose of this experiment was to identify which parameters were important to the objective function and which were not. This meant that despite the difference in the order between the most significant contributors, both results agreed as to the outcome.
Both experiments showed the second-order interaction between N and H to have the highest impact. Factor N was shown to have the strongest main effect and seemed to be the most important contributor to the variance in the objective function by also having strong interaction effects with parameters T0 and R. Parameter H had the second highest contribution when examined alone and in terms of interactions. On the other hand, factor T0 had a non-negligible main effect and a significant contribution to interaction effects.
The category ’others’ contained all factors with a contribution index of less than two percent. These parameters and their interactions could be considered insignificant to the outcome. Parameter R was shown to have a very small effect on its own but contributed via its second-order interactions with N and H. Finally, factor d did not affect the objective function whatsoever.
5. Experimental Validation
This section describes the stiffness model’s validation and the sensitivity analysis outcomes based on experiments with scaled-up 3D-printed prototypes. This validation focused particularly on Model 1, which was justified by several factors. First, the substantial agreement between the results of the three sensitivity analysis methods applied to both models suggested that validating a single model would suffice for drawing meaningful conclusions. Second, Model 1 facilitated both the implementation of the experimental setup and the execution of the tests compared to Model 2. Lastly, validating Model 1 experimentally reinforced its credibility and established a basis for future investigations that may integrate Model 2 or other more sophisticated models.
5.1. Design Selection
The experiments designed to verify the stiffness model and sensitivity analysis findings were carried out using three-times scaled-up 3D-printed prototypes fabricated with an SLS printer and nylon material. The decision to use scaled-up prototypes was based on the fact that larger prototypes allowed for more precise measurements during the experimental process. In addition, scaling up the prototypes simplified the assembly and reduced the chances of assembly errors.
It is important to note that the tension was not scaled up while scaling up the manipulator. This decision was made to prevent the plastic deformation of the 3D-printed parts, which may have been more susceptible to deformation than their metal counterparts. By maintaining the tension at the original scale, the structural integrity of the scaled-up prototypes was ensured, and any inaccuracies in the experimental results due to deformation were avoided.
Although the sensitivity analysis was conducted at the original scale, the experimental verification was carried out on the
scale model. When scaling up the model by
and measuring its stiffness experimentally, the theoretical stiffness was also calculated for the
scaled-up model using the model/equations described in
Table 3. This allowed a direct comparison between the experimental and theoretical values and, thus, a proper evaluation of the accuracy of the stiffness model. The relationships between the design parameters and stiffness are expected to be preserved, so that designers can draw meaningful conclusions from the experimental results. This expectation assumes that the system’s fundamental principles remain the same, regardless of the scale.
Based on the sensitivity analysis results from the previous section, parameter d was fixed due to its minimal impact on stiffness, and four distinct prototypes were created for each of the remaining parameters (R, H, N, and T). This resulted in 16 unique design combinations (listed in
Table 8), which were used to experimentally verify the effects of each parameter on the device stiffness.
The selection of values for the variables in
Table 8 was carefully guided by a preliminary design feasibility study that considered the required bending range and bending radius for the manipulator based on the TLM constraints at the actual scale and then scaled these up by 3 times.
Here, the primary aim was to understand the stiffness variation in relation to the independent design variables, which could be more easily analyzed by varying one parameter while keeping all other parameters constant. Using
Table 4 as a reference, the design parameters were systematically varied, and their effect on the manipulator’s stiffness was computed across the entire design space, thereby achieving the goal of examining its variation in relation to each independent design variable.
5.2. Experimental Setup
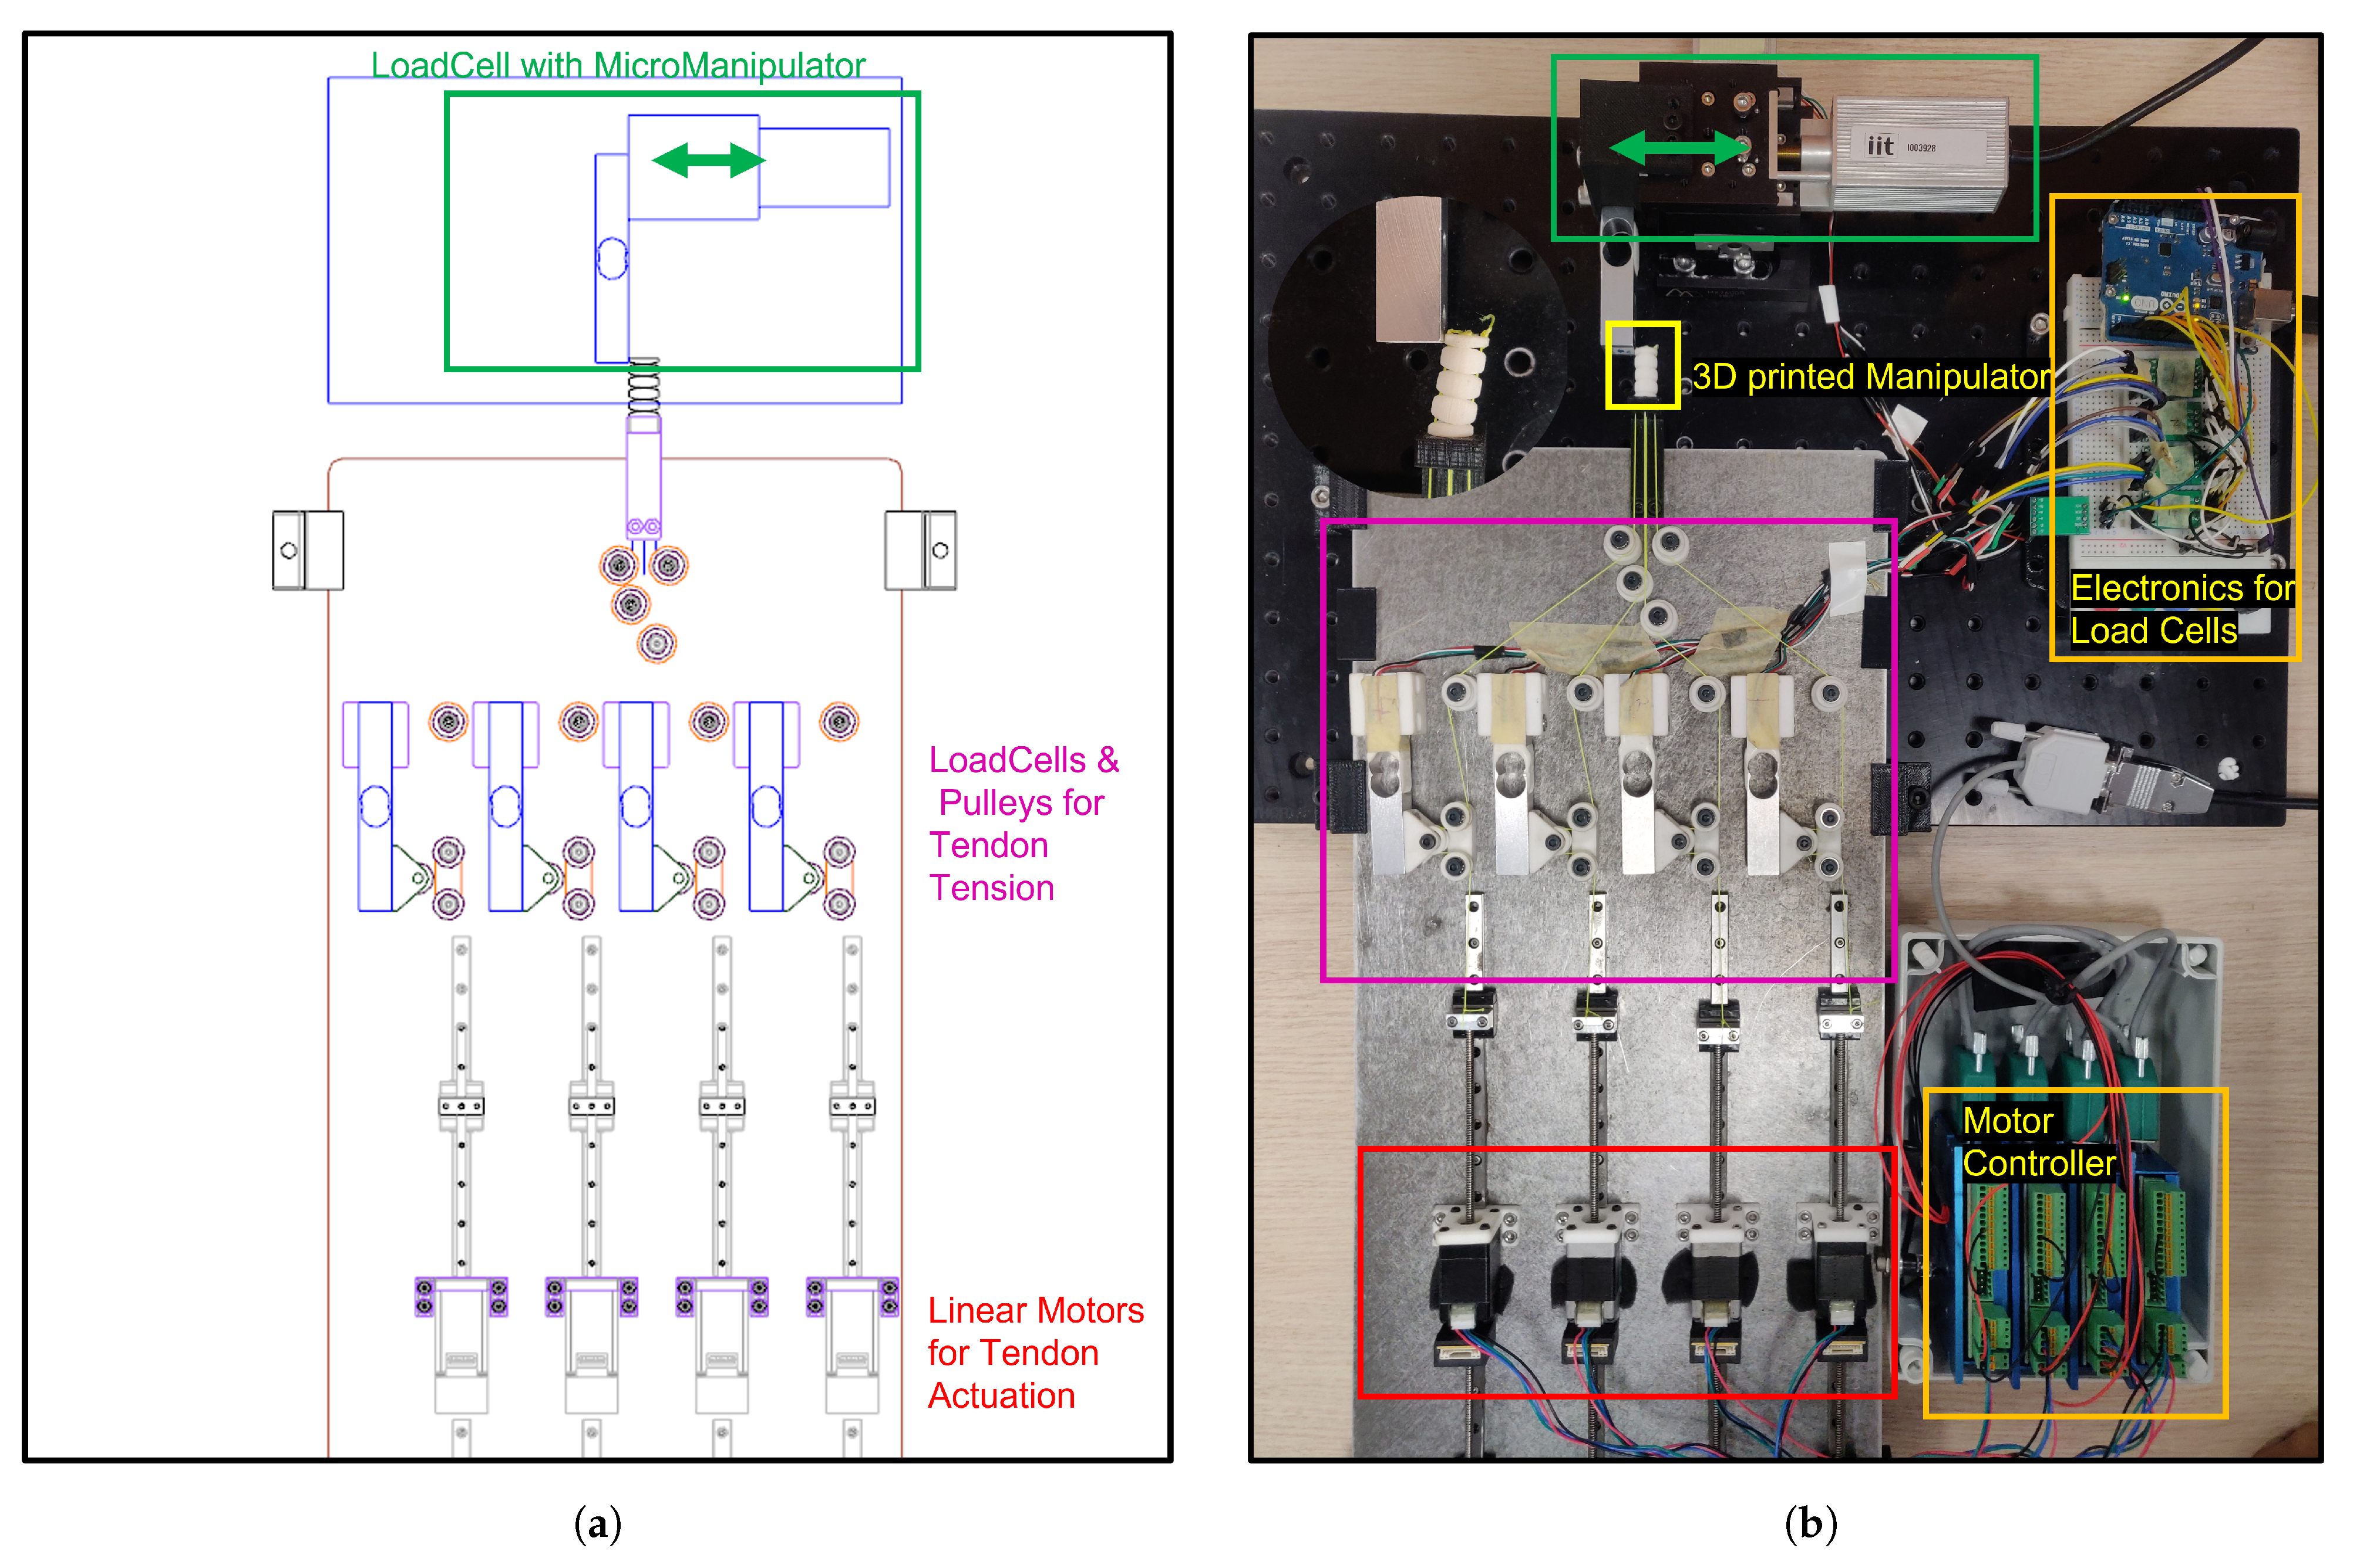
A comprehensive experimental setup was designed to validate the stiffness model and sensitivity analysis results, as shown in
Figure 6. Specifically, this design focused on implementing a setup providing high accuracy, reliability, and repeatability, which are required to ensure the acquisition of trustworthy experimental results that enable appropriate comparisons with theoretical models.
The experimental setup included a tendon-driven continuum manipulator with four tendons independently controlled by four linear actuators (NEMA 8 Stepper motors from Nanotec Electronic GmbH and Co. KG, Feldkirchen, Germany). The tendons were passed through a pulley system attached to independent load cells to measure tendon tension. Using four independent PID controllers, the measured tendon tensions were used as feedback to maintain equal tension in all four tendons. A Siskiyou MX7600 series micromanipulator was used with an additional load cell for force measurement to apply external force to the manipulator.
The linear actuators were controlled using an SMCI33-2 Nanotec motor controller. Data from the load cells were acquired using an Arduino Uno. A Siskiyou MC2010 controller was used for the Siskiyou micromanipulator. These devices were all connected independently to a main computer using serial communication connections.
To automate the experimental process and collect data, a MATLAB application was developed. This application could communicate with all the hardware components, including the linear actuators, load cells, and Siskiyou micromanipulator. The application employed PID controllers to maintain equal tension in all four tendons, apply the external load, record the corresponding force and displacement data, and automatically store the readings.
5.3. Experimental Procedure
The experimental procedure focused solely on force loading, avoiding unloading to minimize errors due to mechanical backlash. The setup was assembled according to the description in the previous section, and the experimental procedure involved the following steps:
The four tendons were pretensed to the desired tension using the PID controllers.
The controller was turned off, and an external load was applied using the Siskiyou micromanipulator.
The manipulator was loaded by displacing it until reaching the specified distance of 5 mm.
During the displacement, the external load (measured using the load cell attached to the micromanipulator) and the manipulator displacement (measured using the micromanipulator’s encoder) were continuously recorded.
Steps 1 to 4 were repeated five times for each design to ensure statistical accuracy and avoid experimental variability or mechanical issues.
The manipulator stiffness was calculated by determining the slope of the force-versus-displacement graph. To account for the small angular displacement assumption in Model 1, the slope was computed only where the force-versus-displacement graph exhibited a linear relationship.
Overall, the experimental procedure was designed to be automated and repeatable, with a measurement protocol that involved moving the manipulator by the specified distance at a constant speed, acquiring data, and repeating the measurement. This approach was designed to obtain accurate stiffness measurements while considering the assumptions and constraints of the theoretical model, thus providing a solid basis for comparing the experimental results and the sensitivity analysis findings.
5.4. Experimental Results
This section details the experimental results obtained during the validation tests.
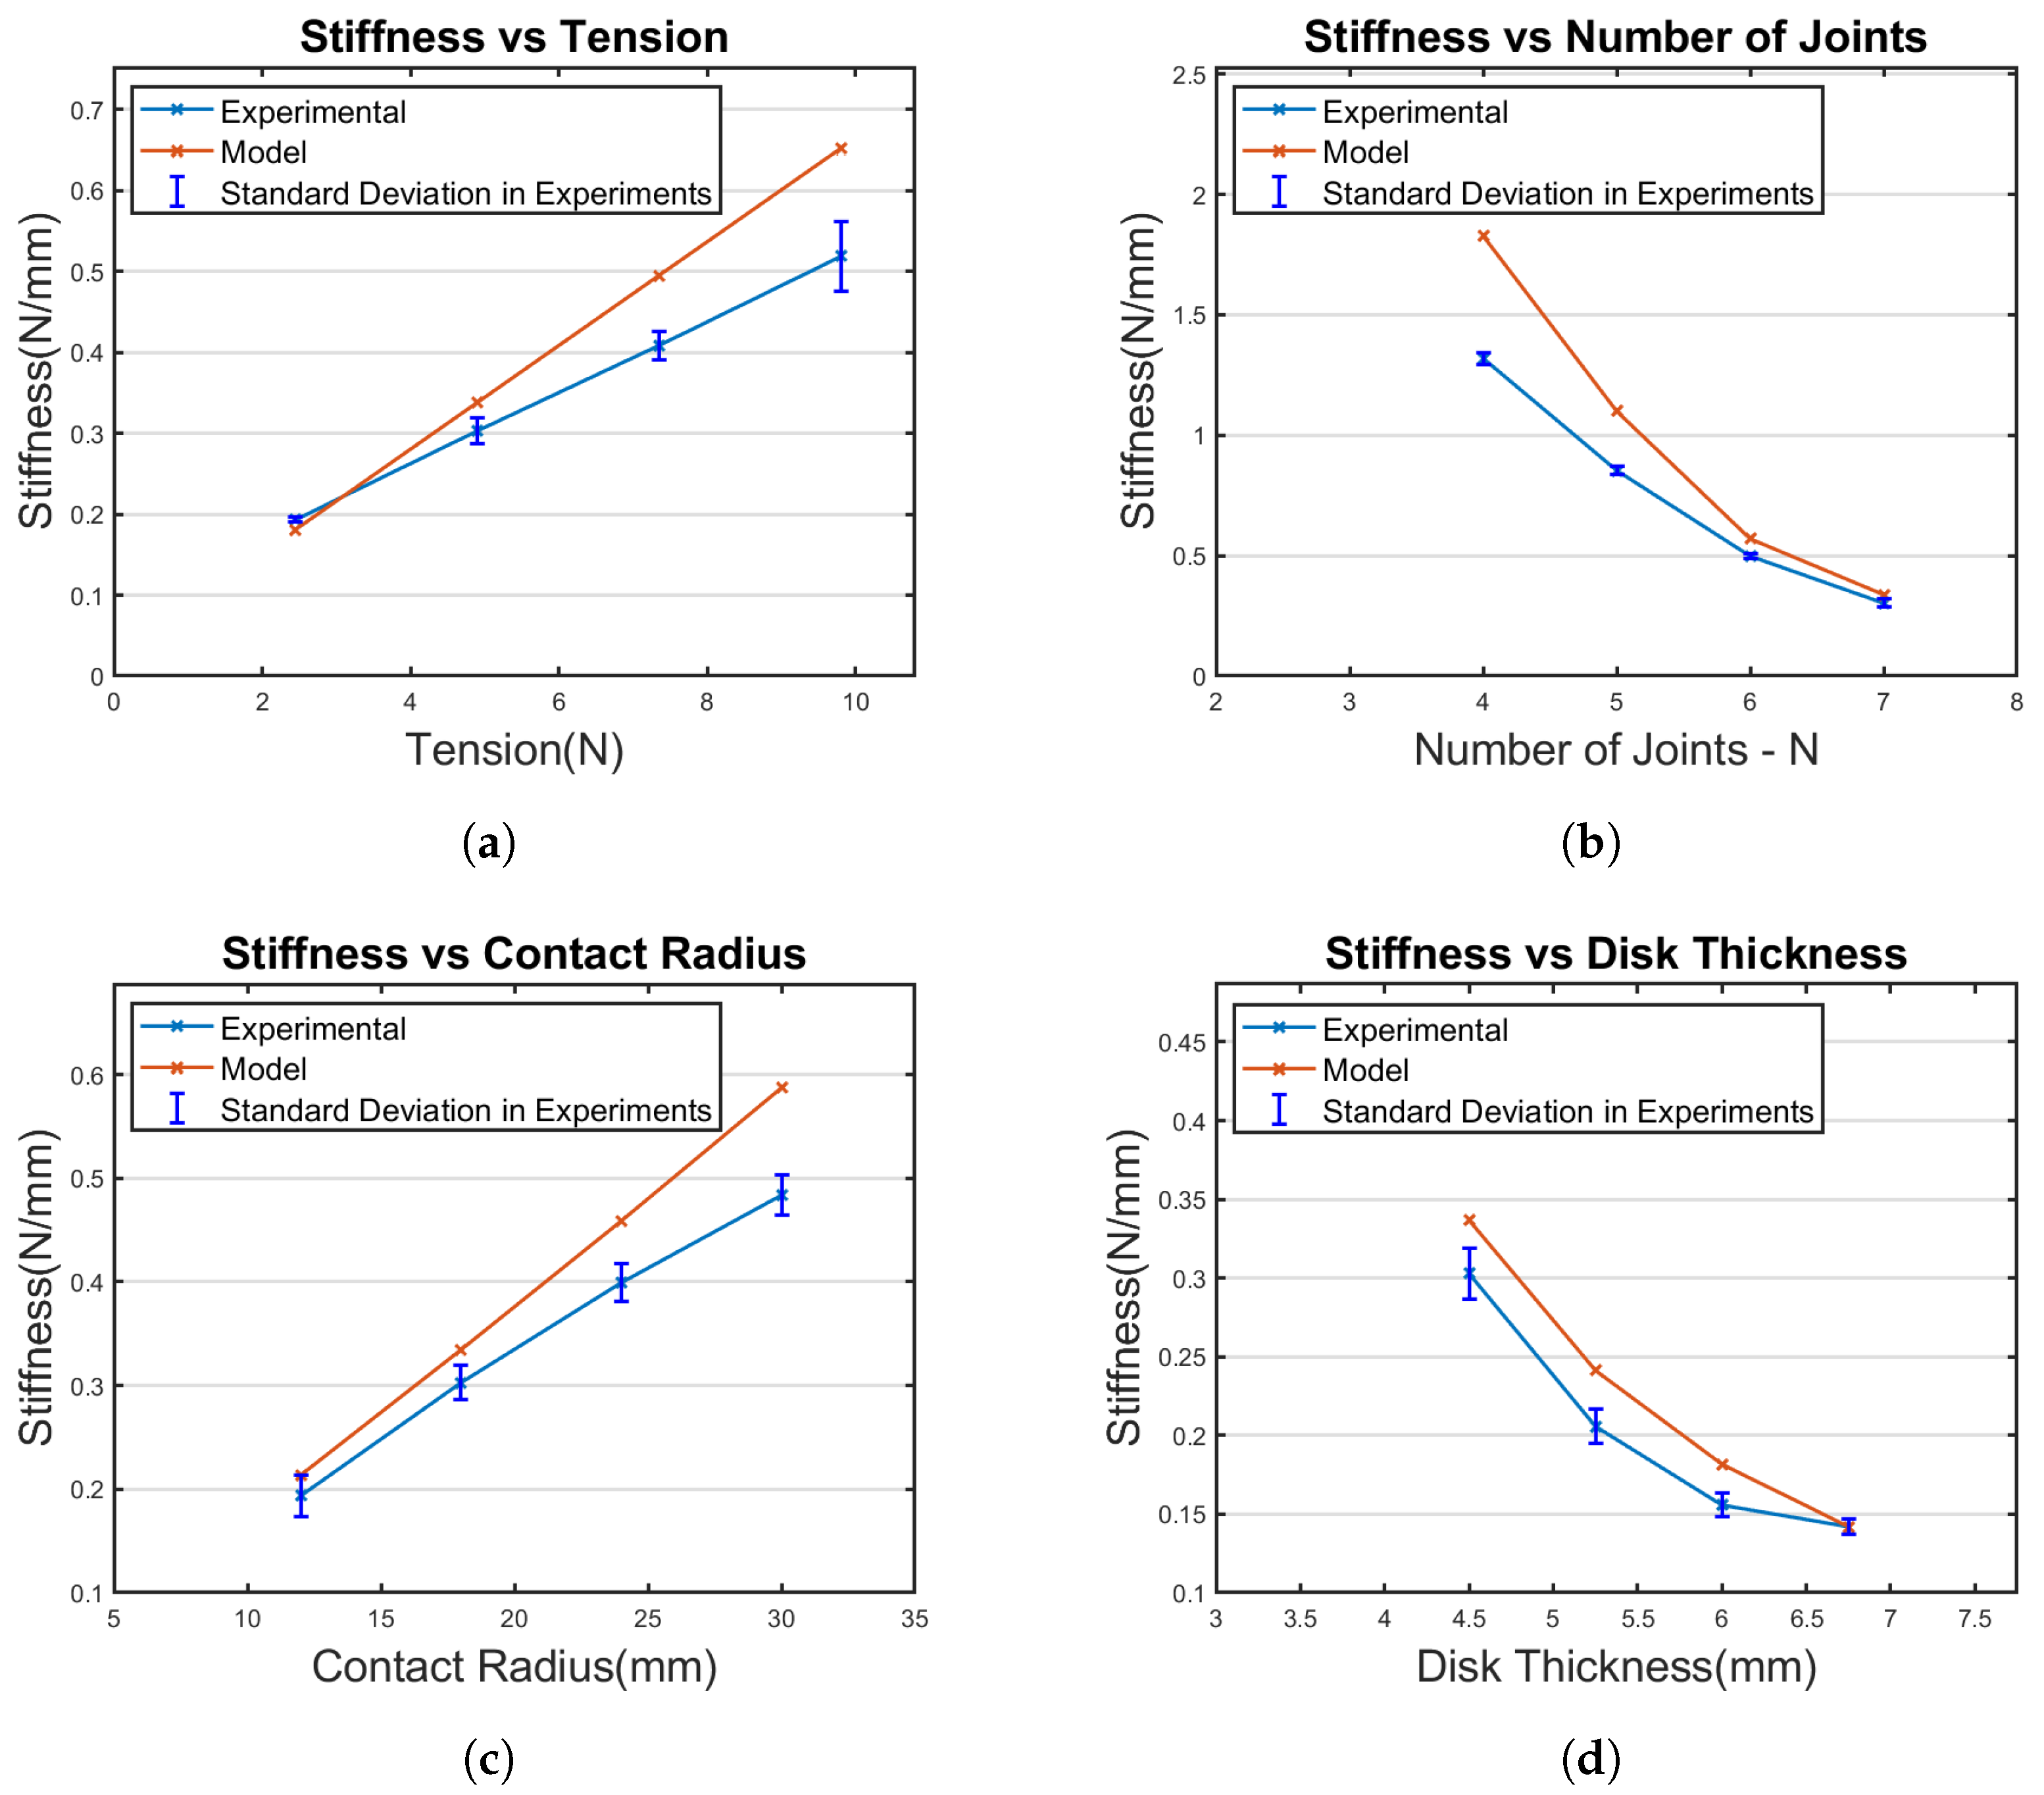
Table 9 presents the detailed experimental results and the analysis performed. In
Figure 7, the stiffness values are plotted against the design parameters T, N, R, and H, offering an overview of how these parameters impacted the manipulator’s stiffness.
The data revealed a linear relationship between the stiffness and the parameters R and T. As these parameters increased or decreased, the manipulator’s stiffness changed proportionally, directly influencing the overall stiffness. In contrast, an exponential trend was observed between the stiffness and the parameters N and H. This indicated that small changes in N and H could significantly change the manipulator’s stiffness.
Various design configurations were investigated during the experiments to better understand the manipulator’s behavior in different situations. The percentage error data presented in
Table 9 suggest that some configurations strongly aligned the stiffness model with the experimental results, while others displayed discrepancies. This finding implies that certain designs might have been more robust and reliable than others, providing useful insights for the manipulator’s future development and optimization.
In summary, the experimental results showcased distinct trends in the relationship between the manipulator’s stiffness and the design parameters R, T, N, and H. These trends offer valuable insights into the manipulator’s behavior, which could be useful in further developing and optimizing the manipulator design. Further discussion of these findings is provided in the next section.
6. Discussion
By employing three distinct sensitivity analysis algorithms and two different stiffness models, this work aimed to investigate how the variance in the input design parameters influenced the variance in stiffness in the examined tendon-driven continuum manipulator. The ultimate goal of this investigation was to provide valuable guidance for the design process of such mechanisms, which could allow their faster introduction into surgical rooms and improve related surgical treatments.
The results obtained from applying the three sensitivity analysis methods across both models exhibited a high level of agreement, which underscored the reliability and robustness of the chosen approach. Among the parameters analyzed, N (the number of joints) and H (disk thickness) emerged as the most significant contributors to the manipulator’s stiffness in terms of main and interaction effects. In contrast, parameter d (distance between the central axis and the wire hole) was shown to have an insignificant effect. In contrast, parameters T (tendon tension) and R (the radius of curvature) showed a significant, but lesser, impact on stiffness. We would like to note that an interaction-effect analysis was also performed with the PCE-based approach, and the results closely agreed with those produced using the SS-ANOVA method. Since the outcomes of the two methods were almost identical, only the results of one method were presented.
The experimental validation further supported these findings, revealing that N and H displayed exponential behavior with respect to stiffness, while T and R exhibited linear behavior. Consequently, these results suggested that designers and engineers should prioritize N and H when designing rolling-joint manipulators. Furthermore, the analysis of the manipulator stiffness as a function of each design parameter suggested that minimizing N and H while maximizing R and T within the design feasibility constraints would lead to an optimized design in terms of stiffness.
The experimental results also demonstrated that the stiffness model had a reasonable level of accuracy. While [
17] previously validated this stiffness model, the analysis presented in the current work thoroughly examined it in relation to all design variables, providing a deeper insight that will hopefully aid and facilitate the widespread use of this mechanism.
Nonetheless, it is important to note that the stiffness model became less accurate as the stiffness value increased, with the theoretical and experimental values demonstrating non-negligible but acceptable deviations. These deviations could be attributed to model assumptions, flaws, or uncontrollable deviations between the model and real parameters (e.g., arising from manufacturing tolerances). The former case, introduced in the context of robot design in [
47], will be the subject of a future study.
In summary, out of the five parameters examined in this comprehensive study, two were found to contribute significantly to the manipulator’s stiffness, two displayed a relatively weak effect, and one parameter appeared to have a negligible effect. These findings led to two key outcomes: (i) the reduced dimensionality of the search space, resulting in reduced computational resources for the modeling and design optimization, and (ii) the simplified and more efficient allocation of resources during the prototyping stage, which could ultimately lead to cost savings and increased efficiency in the development process. Specifically, the design and experimental procedures should prioritize accurately determining the parameter H (controlling N is straightforward), followed by parameters T and R. Adopting this approach would not only facilitate experimental validation but also optimize resource allocation to ensure the best possible outcome, enhancing the overall efficiency of the design process.


