Article

Design Optimization of 1.5-Stage Transonic Compressor Based on BPNN Surrogate Model and NSGA-II

1
Advanced Gas Turbine Laboratory, Institute of Engineering Thermophysics, Chinese Academy of Sciences, Beijing 100190, China
2
Innovation Academy for Light-Duty Gas Turbine, Chinese Academy of Sciences, Beijing 100190, China
3
Key Laboratory of Advanced Energy and Power, Chinese Academy of Sciences, Beijing 100190, China
4
School of Engineering Science, University of Chinese Academy of Sciences, Beijing 100049, China
*
Author to whom correspondence should be addressed.
Machines 2023, 11(6), 631; https://doi.org/10.3390/machines11060631
Submission received: 10 April 2023 / Revised: 9 May 2023 / Accepted: 1 June 2023 / Published: 6 June 2023
(This article belongs to the Special Issue Aerodynamic Design and Optimization for Turbomachinery)

Abstract

:
To achieve multi-objective aerodynamics design optimization for a 1.5-stage transonic compressor, a design platform incorporating blade parameterization methods, a BPNN surrogate model, and the NSGA-II optimization method was developed. The stagger angle distribution of three blade rows was selected as the optimization variable, with isentropic efficiency at the new design condition and stall margin set as the goal functions. Results demonstrated that, without altering the blade profile shape and endwall contour, the flow rate at design condition increased by 7.1%, stall margin increased by 1.8%, isentropic efficiency decreased by 0.0087, and total pressure ratio experienced a slight increase. The flow field at different conditions before and after optimization was compared and analyzed. The analysis indicated that the tangential velocity of rotor outlet becomes the determining factor for the compressor’s work capacity. The relative Mach number at the rotor inlet emerged as the key parameter affecting shock wave intensity and shock wave/boundary layer interaction, which directly influenced the efficiency of the rotor passage. At near stall condition, the stator vane root’s stagger angle is crucial for the compressor’s performance.

1. Introduction

As one of the three major components of gas turbines, compressor performance is highly related to the performance and stable operating margin of gas turbines [1,2]. In order to further improve the compression capability of the compressor, the transonic stage is widely used in the design of the inlet stage. Due to the existence of a strong adverse pressure gradient, shock wave-induced boundary layer separation, corner separation, rotor-stator interaction, and other steady and unsteady complex flow problems in the internal flow field of the transonic stage, the difficulty of compressor design is further increased. Currently, the design of the transonic stage has reached a high level, but even small efficiency improvements in the compressor can bring huge savings in terms of fuel costs for the gas turbine, which is key to the success of a gas turbine product [3].
In recent years, evolutionary algorithms have been successfully applied to aerodynamic optimization design problems by a large number of researchers due to their simplicity, ease of use, wide application range, and global perspective [4]. Oyama et al. [5] developed a reliable and efficient aerodynamic design optimization tool based on an evolutionary algorithm and applied it to the aerodynamic redesign of NASA Rotor67. Entropy generation minimization was used as the objective function to achieve higher aerodynamic efficiency. Benini [6] utilized a new genetic diversity evaluation method to establish the fitness allocation criterion in the conventional evolutionary algorithm and applied it to the optimization of NASA Rotor37 to improve its efficiency.
In studies regarding aerodynamic performance optimization for compressors, multi-objective optimization problems have gradually become mainstream. The most typical genetic algorithm in evolutionary algorithms is widely used by researchers due to its high adaptability in multi-objective optimization [7]. Lian and Lion [8] utilized the genetic algorithm as an optimization tool to build a multi-objective and multi-disciplinary optimization design platform, which was applied to optimize the aerodynamic structure of three-dimensional transonic compressor blades, significantly reducing the calculation time. Razavi et al. [9] employed a genetic algorithm optimizer for multi-objective optimization in the lean and sweep design of NASA Rotor 67, improving its stage pressure ratio, efficiency, and stall margin. Wang et al. [10] constructed a coupled optimization platform integrating multi-objective genetic algorithms and approximate models, enhancing the accuracy of mathematical prediction models, which was verified on NASA Rotor37. Li et al. [11] applied the sweep angle optimization design method based on surrogate models and genetic algorithms to the optimization design under total pressure distortion inflow conditions for a transonic axial compressor. In order to study the influence of aspect ratio and solidity on the performance of heavy-duty gas turbine transonic compressors, Liu et al. [12] built a multi-objective optimization platform based on genetic algorithms to improve the efficiency and stall margin of an inlet 1.5 stage transonic compressor at design condition. Although genetic algorithms are widely used as optimization tools in transonic compressor optimization design, most studies focus on improving efficiency and stall margin. There are few studies that focus on enhancing the flow capacity of transonic compressors. Flow capacity is the so-called choke-limit, which can be altered by controlling aerodynamic and geometric blockage. This implies that optimization tools can be employed to enhance the compressor’s flow capacity.
After a gas turbine is successfully developed, it can be used as a prototype to derive many modified products according to the needs of different scenarios, thus bringing huge economic benefits [13,14]. The object of research in this paper is the transonic inlet 1.5 stage of a gas turbine multi-stage compressor. To further improve the output power of the gas turbine, the design mass flow of the compressor usually needs to be increased. One of the solutions one can use to achieve this involves increasing the flow capacity of the inlet stage while keeping the endwall contour of flow passage unchanged, which can reduce the cost of research and lead to the development of new gas turbines. According to traditional design methods, this can be achieved by increasing the rotation speed and changing the stagger angle of the three blade rows. To maximize the efficiency and stall margin of this new 1.5 stage transonic compressor under the constraints of mass flow rate and total pressure ratio at design condition, a compressor aerodynamic optimization platform based on blade parameterization, neural network surrogate models, and a multi-objective optimization method called NSGA-Ⅱ was built. The spanwise stagger angles of blade sections for the three blade rows were taken as optimization variables, while the isentropic efficiency of the new design condition and stall margin were considered as optimization objectives. The optimized compressor’s total pressure ratio at design condition must not be less than that of the prototype.

2. Optimization Method

2.1. Research Object

The research object of this paper is the transonic inlet 1.5 stage of a gas turbine multi-stage axial compressor. Both the inlet guide vane and the stator vane are adjustable. Some design parameters of the prototype are shown in Table 1. A small hub-tip ratio of about 0.37 was adopted in rotor design. The negative pre-swirl design is used near the hub to strengthen the work capacity of the rotor root and reduce the radial mixing. A positive pre-swirl design was adopted near the rotor tip to limit the relative Mach number at the rotor inlet. At design condition, the total pressure ratio of this prototype 1.5 stage transonic compressor is 1.44, the isentropic efficiency is 0.8867, and the stall margin is 22.4%. The stall margin is defined as follows:
SM = ( π NS / m NS π DP / m DP 1 ) × 100 %
where π represents the total pressure ratio, m represents the flow rate, the subscript DP represents the design point, and the NS represents the near stall condition. The near stall condition is defined as the last converged point with the maximum average static pressure at the stage outlet. When the outlet static pressure increases by 100 Pa, the numerical calculation will blow up.

2.2. Optimization Objective

According to the design requirements for the new gas turbine, the target design mass flow of the modified compressor needs to be increased by 7.1%, and the rotation speed needs to be increased by 2%. To ensure the safety of the gas turbine, the stall margin of the modified compressor needs to be at least 22.4%. Within the constraints of the design total pressure ratio, the isentropic efficiency needs to be maximized. Under the condition where the profile of the compressor remains unchanged, a significant increase in the design flow rate will inevitably impact the compressor’s isentropic efficiency.
In this paper, the objective function of multi-objective optimization is selected as efficiency drop value and margin improvement. Functions are defined as follows:
O b j 1 = c 1 ( η r e f η ) ,   O b j 2 = c 2 S M S M r e f S M r e f
where the subscript ref refers to the performance parameters of the design condition and c1 and c2 are the weight coefficients of the objective function.

2.3. Numerical Calculation Method

The mesh required for three-dimensional numerical calculation was generated in the AutoGrid5 module using the structural mesh of the O4H topology [15]. To assess the influence of computational grid size on the accuracy of calculation results, the grid independence of four different amounts of grids was studied. It can be found in Figure 1 that the simulation results tend to be consistent when the grid size exceeds 3 million. Therefore, the total number of fluid grid was 3.72 million, which can not only take into account the calculation accuracy but also maintain the calculation efficiency. The mesh near the wall was refined to keep the y+ value below 5 to capture the flow details in the boundary layer. The rotor tip clearance was 0.6 mm, and 17 layers of grids were arranged radially in the clearance to accurately capture the variation of clearance flow. The calculation domain and grid mesh on solid wall are shown in Figure 2.
In this paper, the NUMECA Fine/Turbo EURANUS solver was used to perform the steady numerical simulation [16]. The finite volume scheme and Spalart–Allmaras turbulence model were used to solve the three-dimensional compressible Reynolds-averaged Navier–Stokes equations of each component in the relative coordinate system, and the multigrid method was used to accelerate the convergence. The inlet boundary condition was given as total temperature, total pressure, flow direction, and the working fluid was the ideal gas. The mass flow was given as the outlet boundary at the design condition, and the average static pressure was given at other conditions. The solid wall was under adiabatic non-slip conditions. When calculating different samples, the mesh topology and grid distribution, and boundary conditions were consistent to eliminate possible errors caused by the calculation.
The research team conducted a test on a reduced-scale 1.5-stage transonic compressor of a heavy-duty gas turbine and obtained the compressor characteristic curve [12]. To verify the accuracy of the numerical calculation, a three-dimensional numerical simulation of the test piece was performed using the same meshing topology and boundary condition settings as the numerical calculation carried out in this paper. In Figure 3, the numerical results of total pressure ratio and isentropic efficiency agree well with the experimental results, but there was a little deviation in value and stall margin. The total pressure ratio of the test was higher than the calculation results. The isentropic efficiency of the test at small mass flow conditions was less than the calculation results. The stall margin of the compressor test was significantly higher than that of the numerical simulation because the steady numerical calculation could not accurately predict the near stall condition of the compressor.

2.4. Blade Parameterization Method

In this paper, the three-dimensional blade parameterization was completed based on the Autoblade module in NUMECA software [17]. The blade profile was fitted using the camber superposition thickness approach with six control points of the 5-order Bezier curve adopted to fit the thickness distribution and eight control points of the 7-order Bezier curve adopted to fit the camber curve. The leading and trailing edge points of the profile each occupied one control point. A three-dimensional blade was formed by stacking the blade profiles along the center of gravity. The stacking line was fitted by a three-dimensional line. The geometric fitting results are shown in Figure 4. These results indicate that the difference between the original and the fitted profiles only appears near the leading and trailing edges and that the difference was quite small. Figure 5 shows the performance comparison of the compressor before and after parameterization. The results demonstrate that the performance curves of the parameterized compressor, including aspects such as peak efficiency and stall margin, are in good agreement with the prototype compressor, which indicates that the prototype compressor can be substituted by the parameterized compressor.

2.5. Optimization Variables

Prior to optimization, a large number of three-dimensional numerical calculations and aerodynamic analyses based on the prototype compressor were completed. The results showed that a decrease in the guide vane stagger angle would increase the flow rate of the compressor, but it would also decrease the isentropic efficiency and stall margin. The decrease in the rotor stagger angle would have the same effect. The stagger angle of the stator mainly affects the mass flow at peak efficiency conditions.
Based on the above analysis, the spanwsie stagger angles of blade sections for the three blade rows was chosen as the optimization variable. Considering that there are 11 sections in each row of blades, resulting in a total of 33 control variables, it is indeed crucial to reduce the optimization variables in order to enhance the optimization efficiency. In this paper, three third-order Bezier curves are used to control the spanwise distribution of stagger angles for blade section for each blade row. This approach improves optimization efficiency, ensures the smoothness of the optimized blades, and greatly reduces the calculation sample space.
For the prototype 1.5 stage transonic compressor, the spanwise distribution of stagger angle for the three blade rows is shown in Figure 6 with discrete symbols, and the fitted curve with three third-order Bezier curve is also shown in Figure 6. For each blade row, the Bezier curve can represent the spanwise stagger angle of each blade row reasonably well. During optimization, the abscissa of the control point moves horizontally while the spanwise position remains unchanged. Thus, the twist shape of each blade row is changed.

2.6. Aerodynamic Optimization Method

NUMECA is a high-precision CFD software that integrates the functions of geometric parameterization, meshing, three-dimensional numerical calculation, and post-processing of turbomachinery. All modules can run automatically through corresponding scripts. An automatic optimization platform based on MATLAB was built in this paper. The platform includes an initial sample generation module, a three-dimensional numerical calculation module, an optimization module, and a convergence judgment module. The optimization flow chart is shown in Figure 7. The functions and specific implementation methods of each module are discussed in detail below.
The initial sample generation module, indicated by a red dotted line, involves obtaining the stagger angle distribution of blade rows through the three-dimensional parameterization of the prototype compressor. The compressor modeling can then be realized with 12 control points. The sample space of this paper was obtained by Latin hypercube sampling, which ensured that the samples were fully distributed in the range of all variables. Each sample contained 12 different control points, and a program code was written to calculate the stagger angles of different blade spans. The parameterization file was generated after parameterization, and the parameterization file of the new compressor could be obtained by a program to replace the original stagger angle distribution in the file. This approach ensured that only the stagger angle distribution of the compressor varied between different samples while other design parameters were kept unchanged. The main function of this module was to obtain parameterization files for all initial samples.
The numerical calculation module, indicated by a blue dotted line, mainly includes functions such as geometric generation, grid meshing, three-dimensional numerical simulation, and CFD results post processing. The automatic operation of the above functions can be realized by a MATLAB program that can call different modules in NUMECA software through different scripts. The main function of this module is to perform a numerical simulation of the input parametric files and export the results.
The optimization module, indicated by a green dotted line, mainly includes two functions: surrogate model training and multi-objective optimization. The surrogate model uses BPNN (Back Propagation neural network)—optimized by GA (Genetic Algorithms)—and the NSGA-II (Non-Dominated Sorting Genetic Algorithms II) algorithm was adopted in the multi-objective optimization. In practical optimization problems, using mathematical surrogate models instead of high-precision simulation to improve the efficiency of optimization has become one of the most commonly used approaches.
Compared with conventional artificial neural networks, BPNN uses the principle of gradient descent to calculate the correction of network connection weights and constantly corrects the weights until the error meets the predetermined requirements [18]. However, BPNN is sensitive to the initial weights and biases randomly generated in the network during training. To improve the accuracy of model prediction, a single-objective genetic algorithm is used to optimize BPNN. The error of the training set is used as the fitness function, and the weight and bias of each node in the neural network are used as the optimization independent variables to optimize the forward propagation of network parameter initialization. The model is retrained after obtaining the optimal initialization parameters. Two neural networks were used to train the standard data set (Abalone Data) to verify the optimization function of genetic algorithm on BPNN. The training results are shown in Figure 8. The results for the 10-times repeated training showed that the mean error of BPNN optimized by GA decreased by 12.8% compared to the original BPNN. The number of hidden layers of the neural network was finally selected as seven by multiple experiments on the sample set, providing a better compromise between the efficiency of training and the accuracy of the model. The structure of the neural network is shown in Figure 9.
The optimization algorithm used in this paper is NSGA-II, which is a widely used multi-objective genetic algorithm [19]. It reduces the complexity of non-inferior sorting genetic algorithms and advantages of the algorithm include fast running speed and good convergence of solution set. Due to its wide application, it has become a benchmark for measuring the performance of other multi-objective optimization algorithms.

3. Optimization Results

The optimization in this paper is a continuous iterative process, and the convergence criterion is to meet the optimization objectives while ensuring that the relative error between the neural network prediction value and the three-dimensional CFD result is less than 1%.
Ten instances of repeated training will be carried out for the BPNN prediction model. The two models with the largest and smallest errors are selected for multi-objective optimization, and then some of the advantages are added to the sample set of the previous generation. Such measures can avoid falling into local optimum and improve the prediction accuracy of neural network. The performance distribution and Pareto front of all sample points is shown in Figure 10. The green dots represent the performance of the prototype compressor, while the remaining black dots represent other samples.
Considering the matching with subsequent stages, the optimized compressor exhibits a limitation on the total pressure ratio, as illustrated by the blue dotted line. While the efficiency of all sample points declines after the design flow rate of the compressor increases, the efficiency of the maximum efficiency point experiences the least severe reduction and meets the constraint conditions. However, the point of maximum margin lies outside the limits and does not fulfill the design requirements. Consequently, taking various factors into account comprehensively, this study selects the maximum efficiency point as the final optimization result for the compressor.
Figure 11 displays a performance comparison between the prototype and optimized 1.5 stage transonic compressors, labeled as ORI and OPT, respectively. It highlights choke (choked condition), DP (design condition), and NS (near stall condition). Table 2 lists the key performance parameters for both compressors. In comparison to ORI, OPT shows a slight increase in the total pressure ratio at design condition, a decrease in isentropic efficiency by 0.0087, an increase in margin by 1.8%, and a 7.1% increase in design mass flow.
Figure 12 illustrates the spanwise distributions of stagger angles for the three blade rows. The black dotted line in the figure marks the boundary of the blade profile’s stagger angle during optimization. The inlet guide vane stagger angle for OPT generally shifts to the left, with greater variation below the 30% span. OPT’s rotor stagger angle is similar to ORI’s near the endwall, but within the main blade span, it is notably smaller, with the maximum deviation occurring around mid-span. OPT’s stator vane stagger angle, overall, shifts to the right, with decreasing variation toward the shroud wall and the largest decrease near the 20% span. In order to further analyze the impact of stagger angle variations on compressor performance, the flow field of the compressor under different operating conditions is examined in the following sections.

4. Discussion

4.1. Flow Field Analysis at Design Condition

The primary focus of this paper is to analyze the impact of stagger angle change on performance at the design point. 
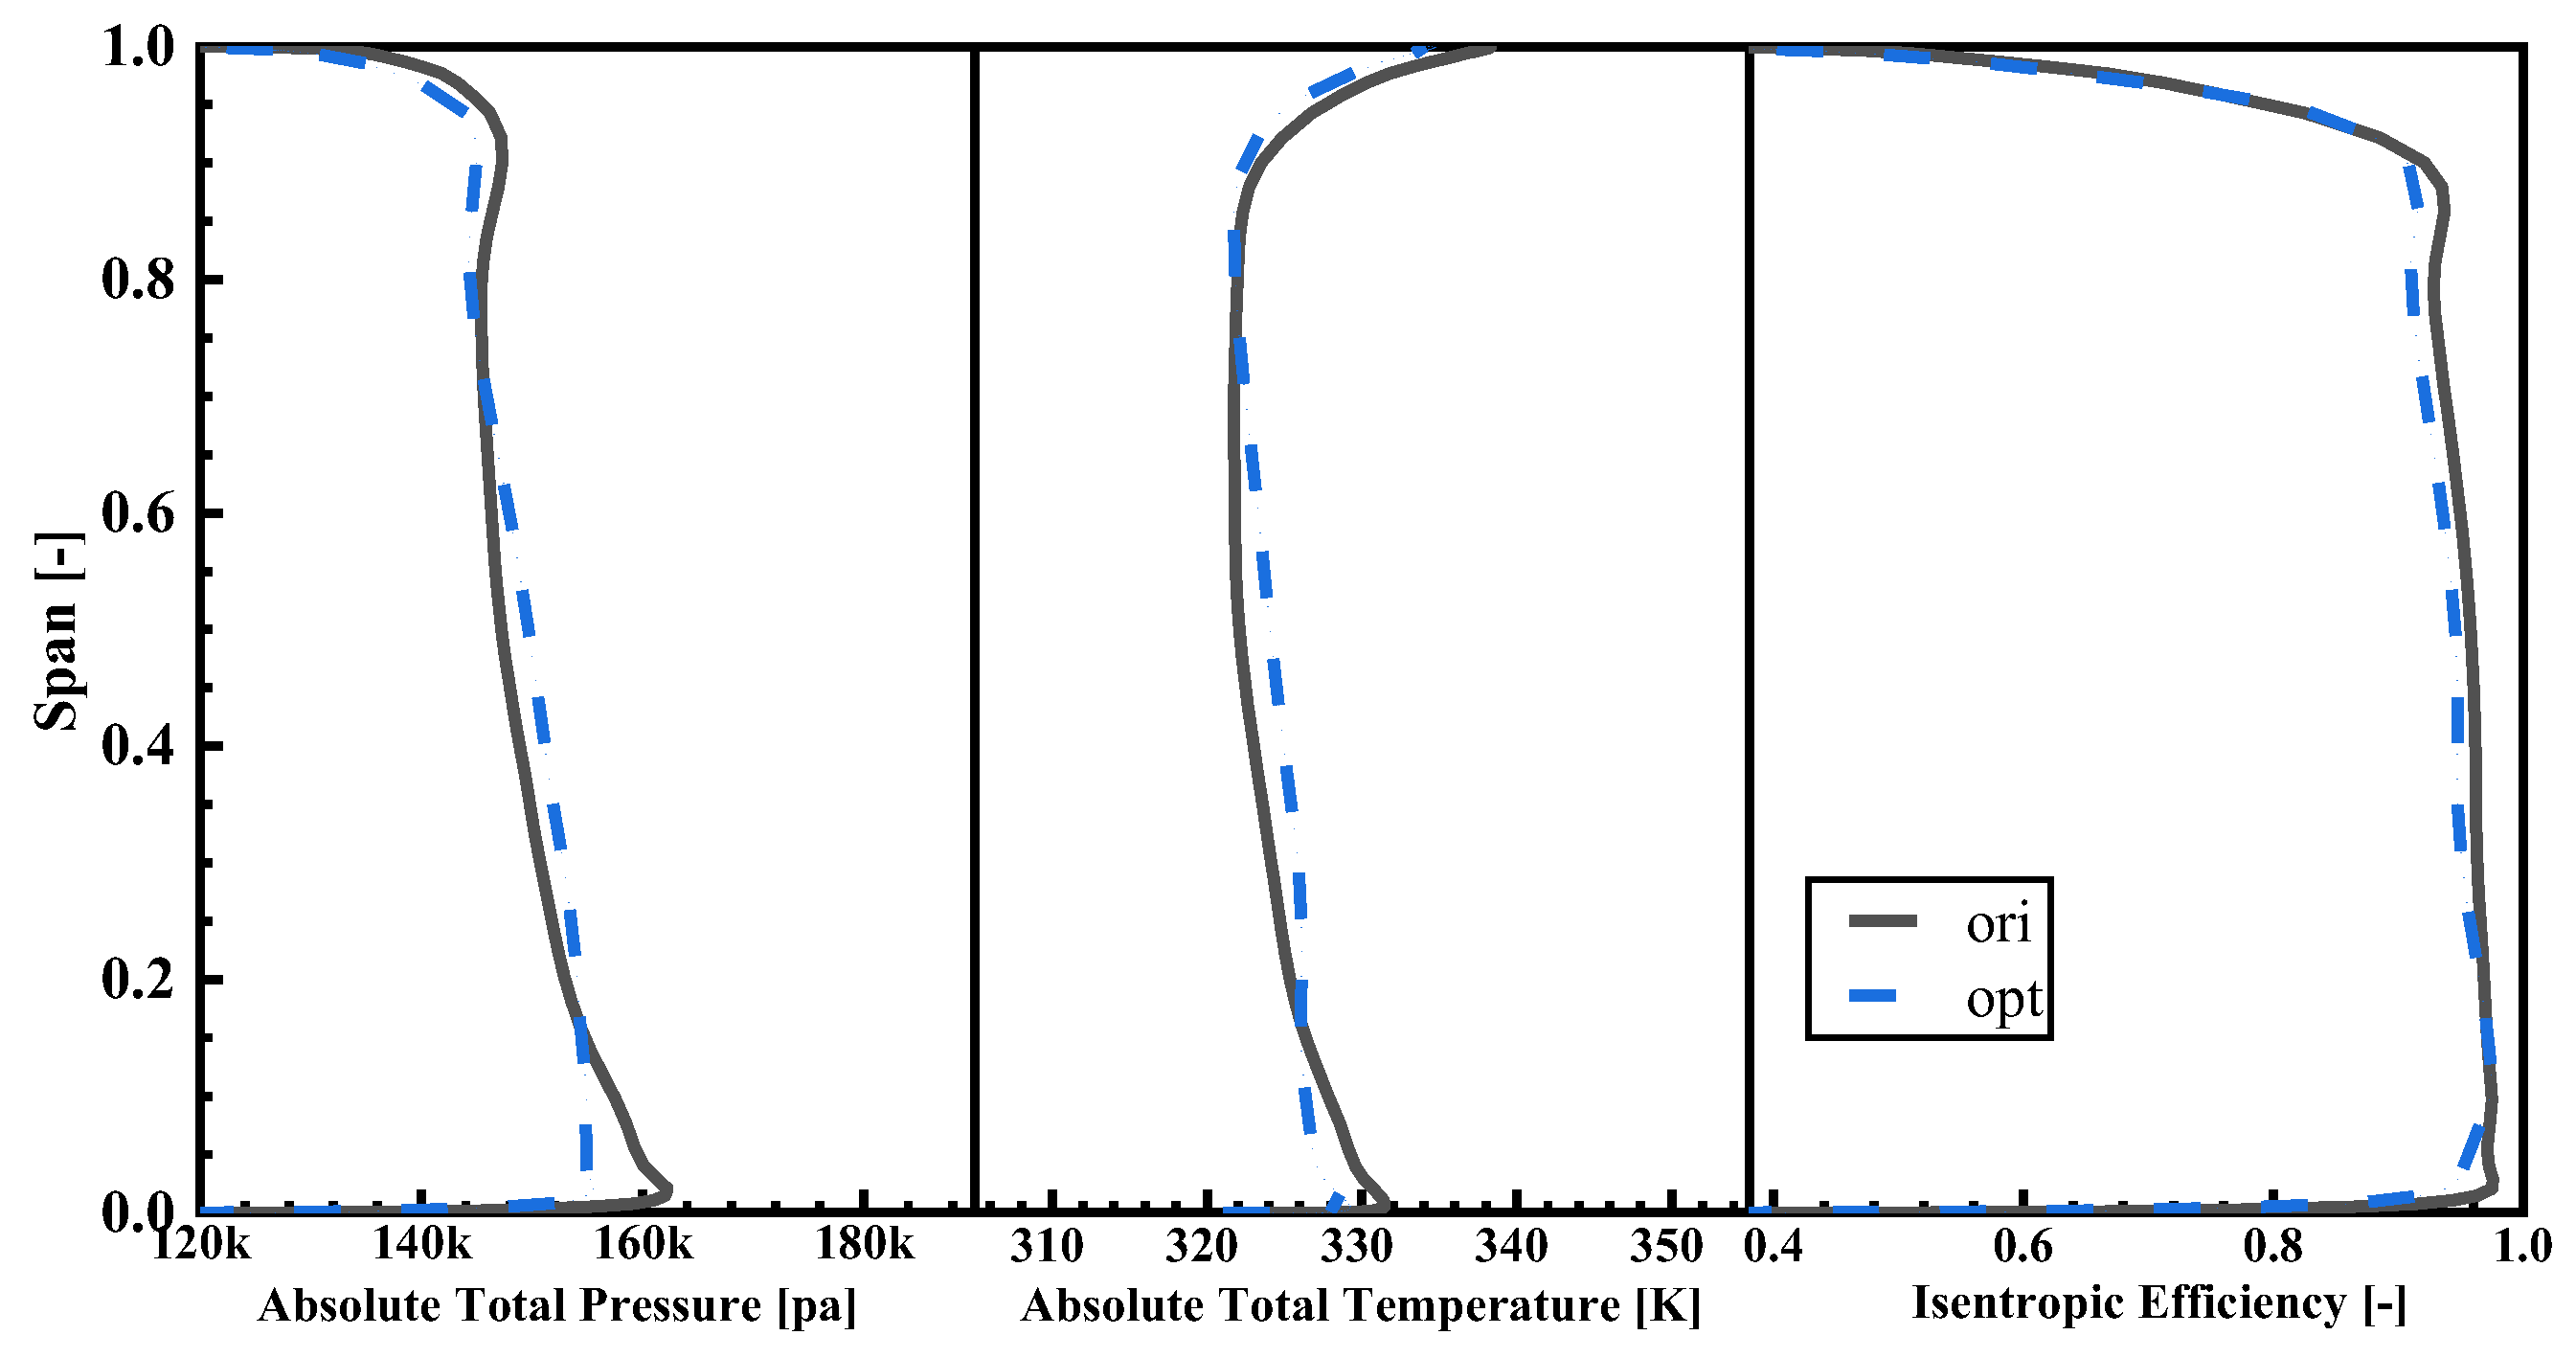
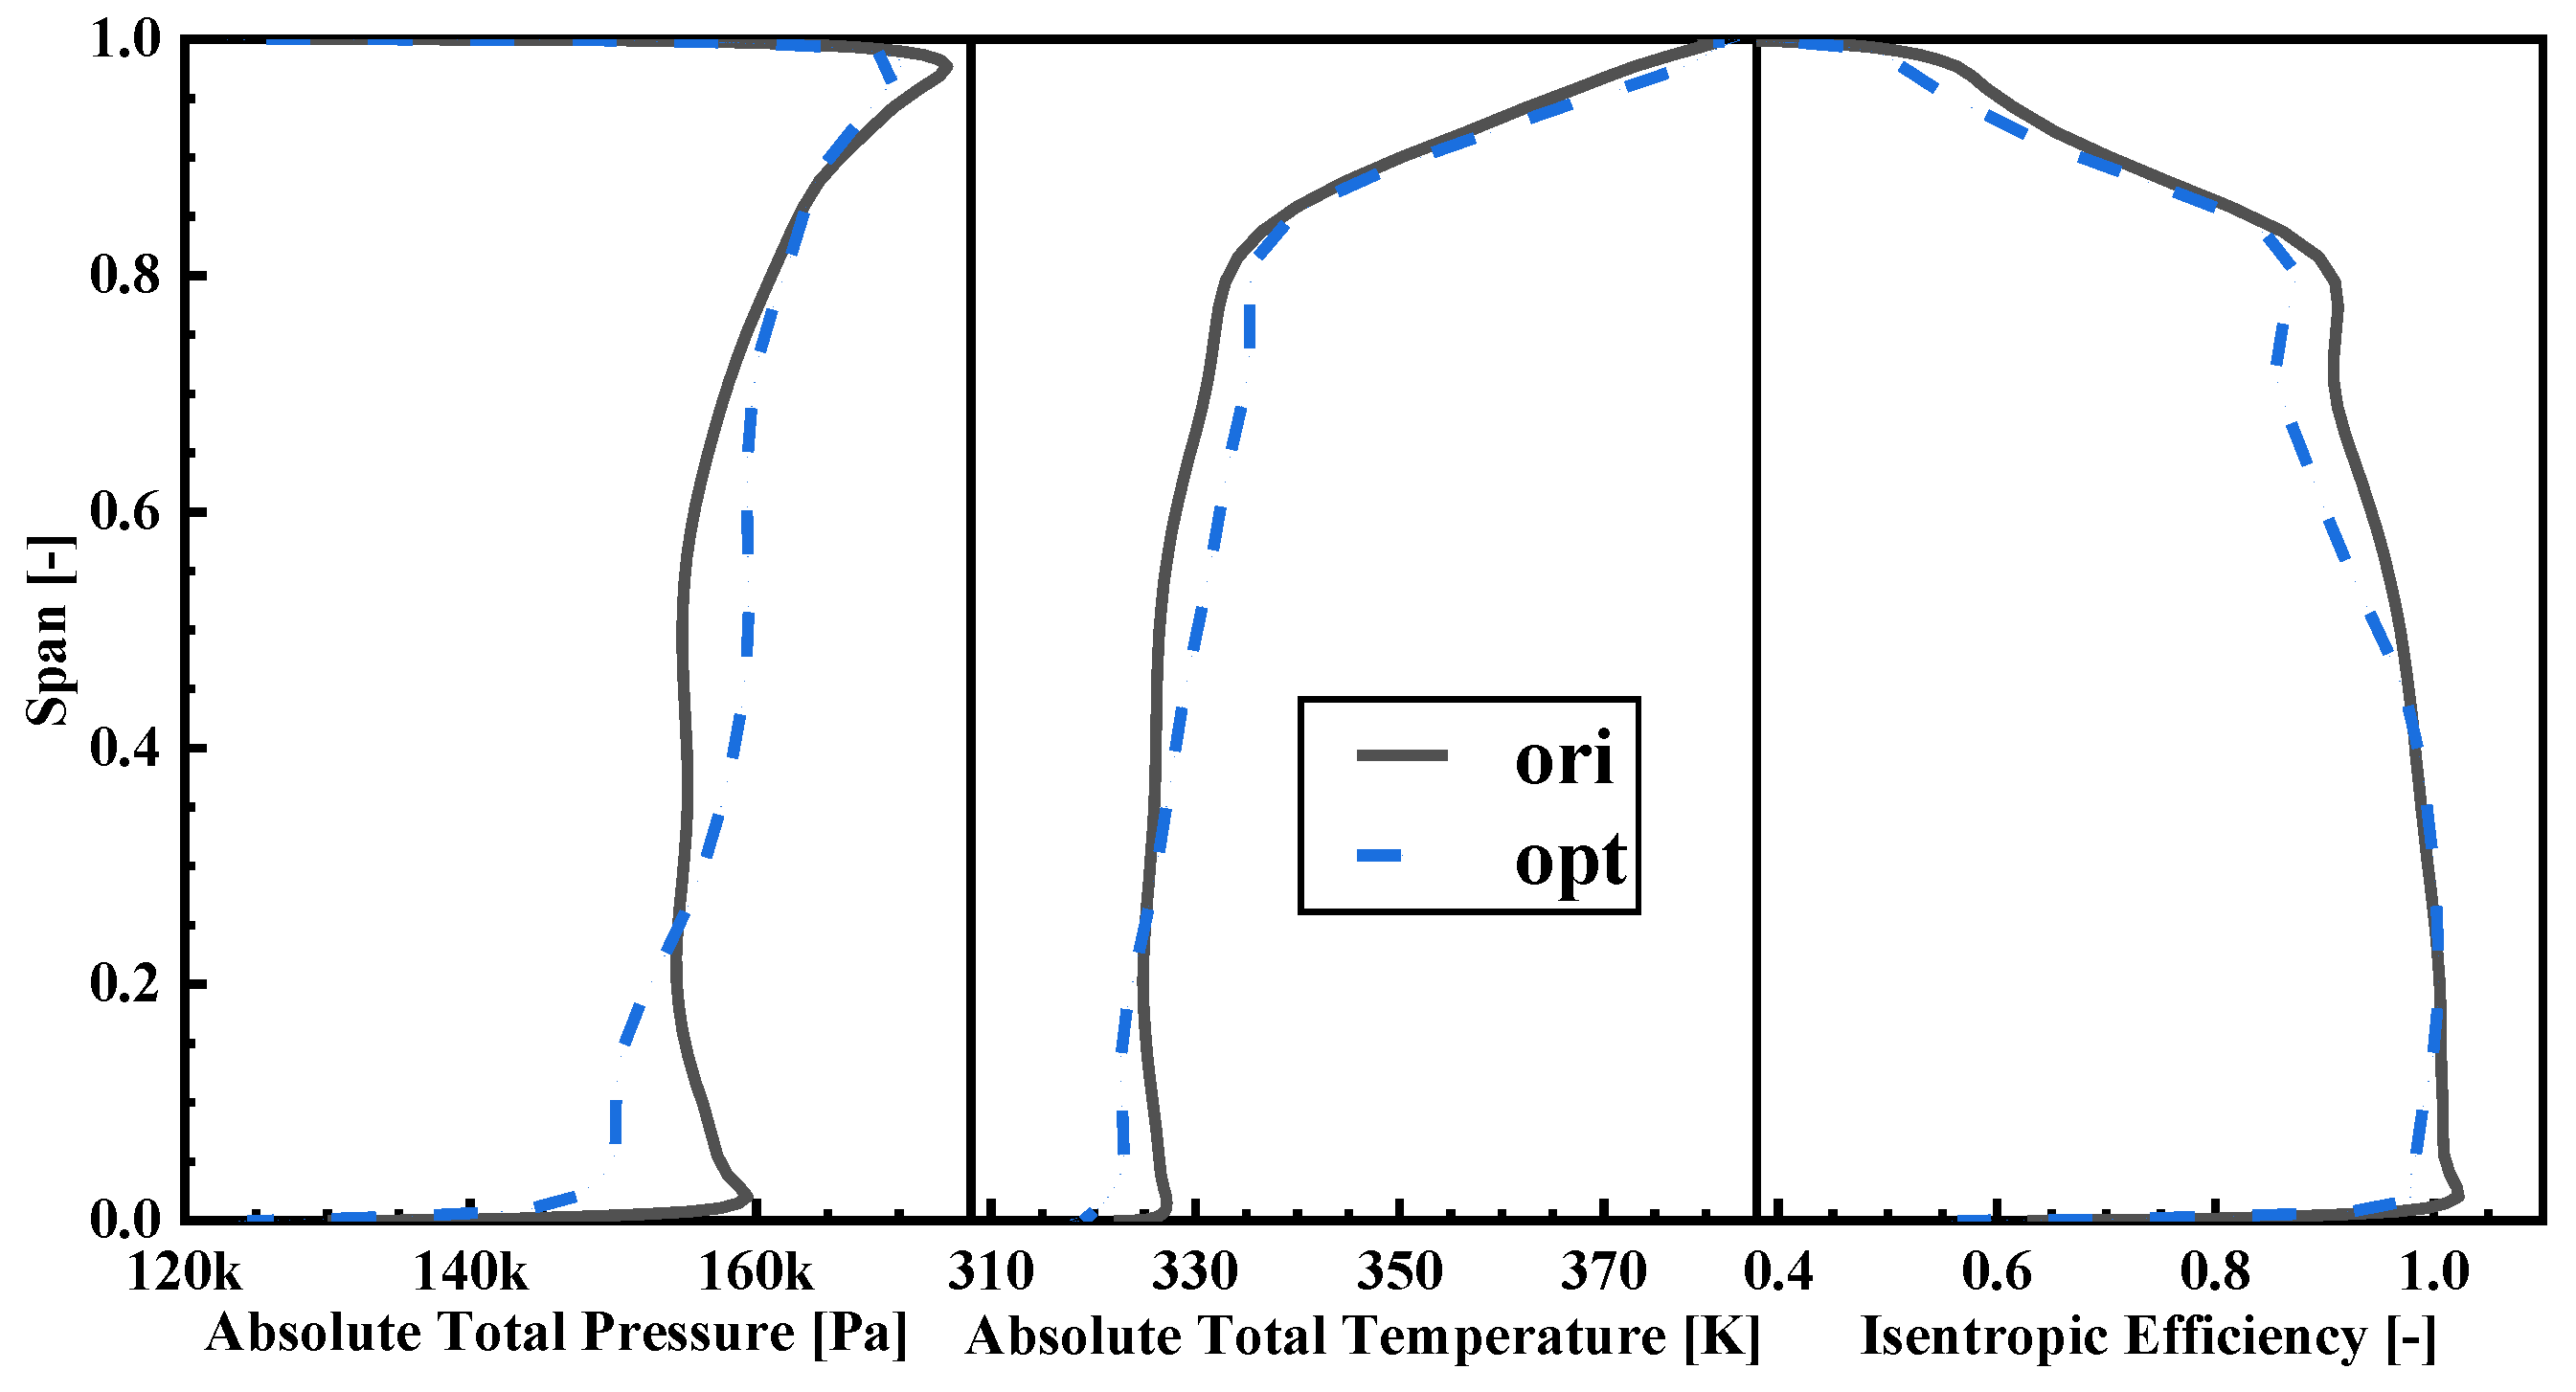
Figure 13 displays the spanwise distributions of total pressure, total temperature, and isentropic efficiency at the rotor outlet. OPT’s total pressure is smaller than ORI’s above 80% span and below 20% span, while it is larger within the remaining span. The comparison of total temperature between ORI and OPT mirrors that of total pressure. The total temperature at the rotor outlet represents the work performed by the compressor with respect to the airflow, suggesting that work is intensified in the passage for OPT and weakened near the endwall. The isentropic efficiency of OPT above 90% span aligns with ORI’s but is slightly lower below 90% span, and the isentropic efficiencies of the two coincide near the 10% span.
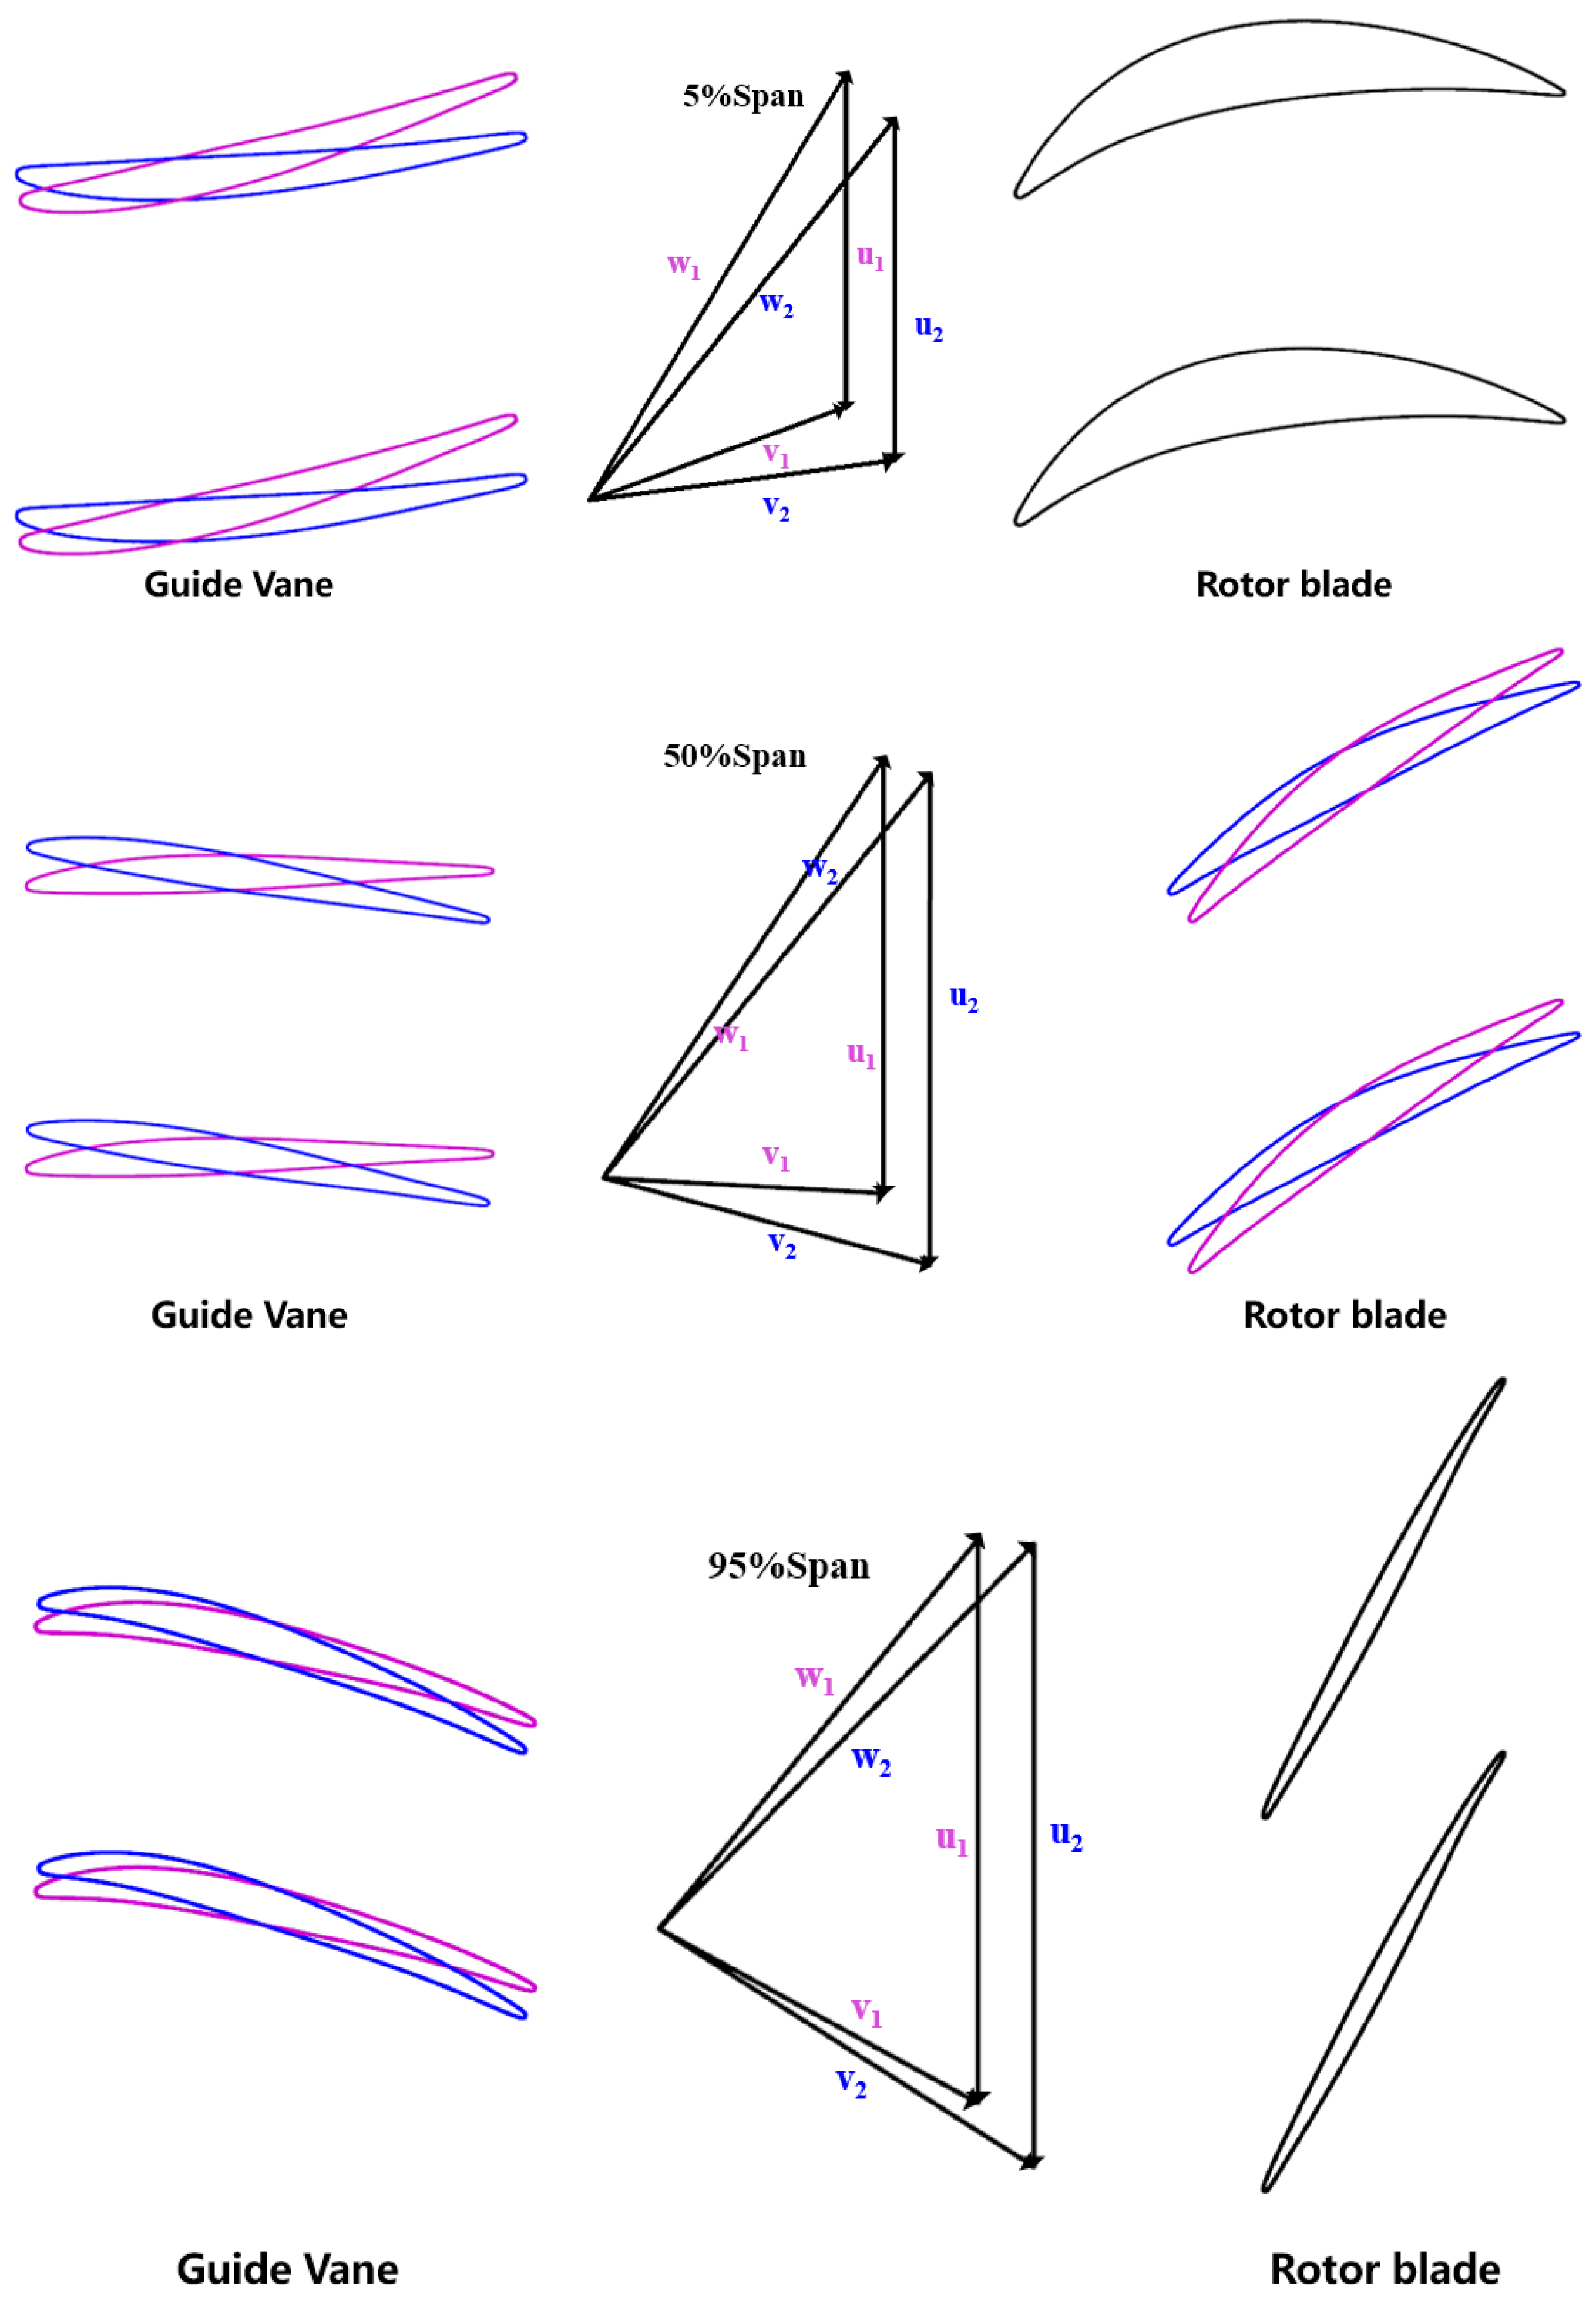
To gain a more intuitive understanding of how changes in stagger angles impact airflow incidence at the rotor inlet, Figure 14 presents velocity triangle diagrams for three typical blade spans. In the figure, pink denotes ORI and blue signifies OPT. Since the rotor stagger angles at the blade tip and root remain almost constant, rotor blades are represented by black curves. At 5% span, the reduction in the guide vane stagger angle causes a corresponding decrease in rotor counter-swirl, leading to a diminished rotor inlet airflow incidence. As the optimization in this study did not involve adjusting blade profiles, the working capacity of OPT blade roots declines significantly when both incidence and inlet Mach number decrease. At 50% span, the decrease in the guide vane stagger angle also results in reduced airflow angles at the rotor inlet. However, the decline in the rotor stagger angle for mid-span is more pronounced than that of the airflow angle, ultimately causing OPT’s incidence in mid-span to exceed that of ORI.
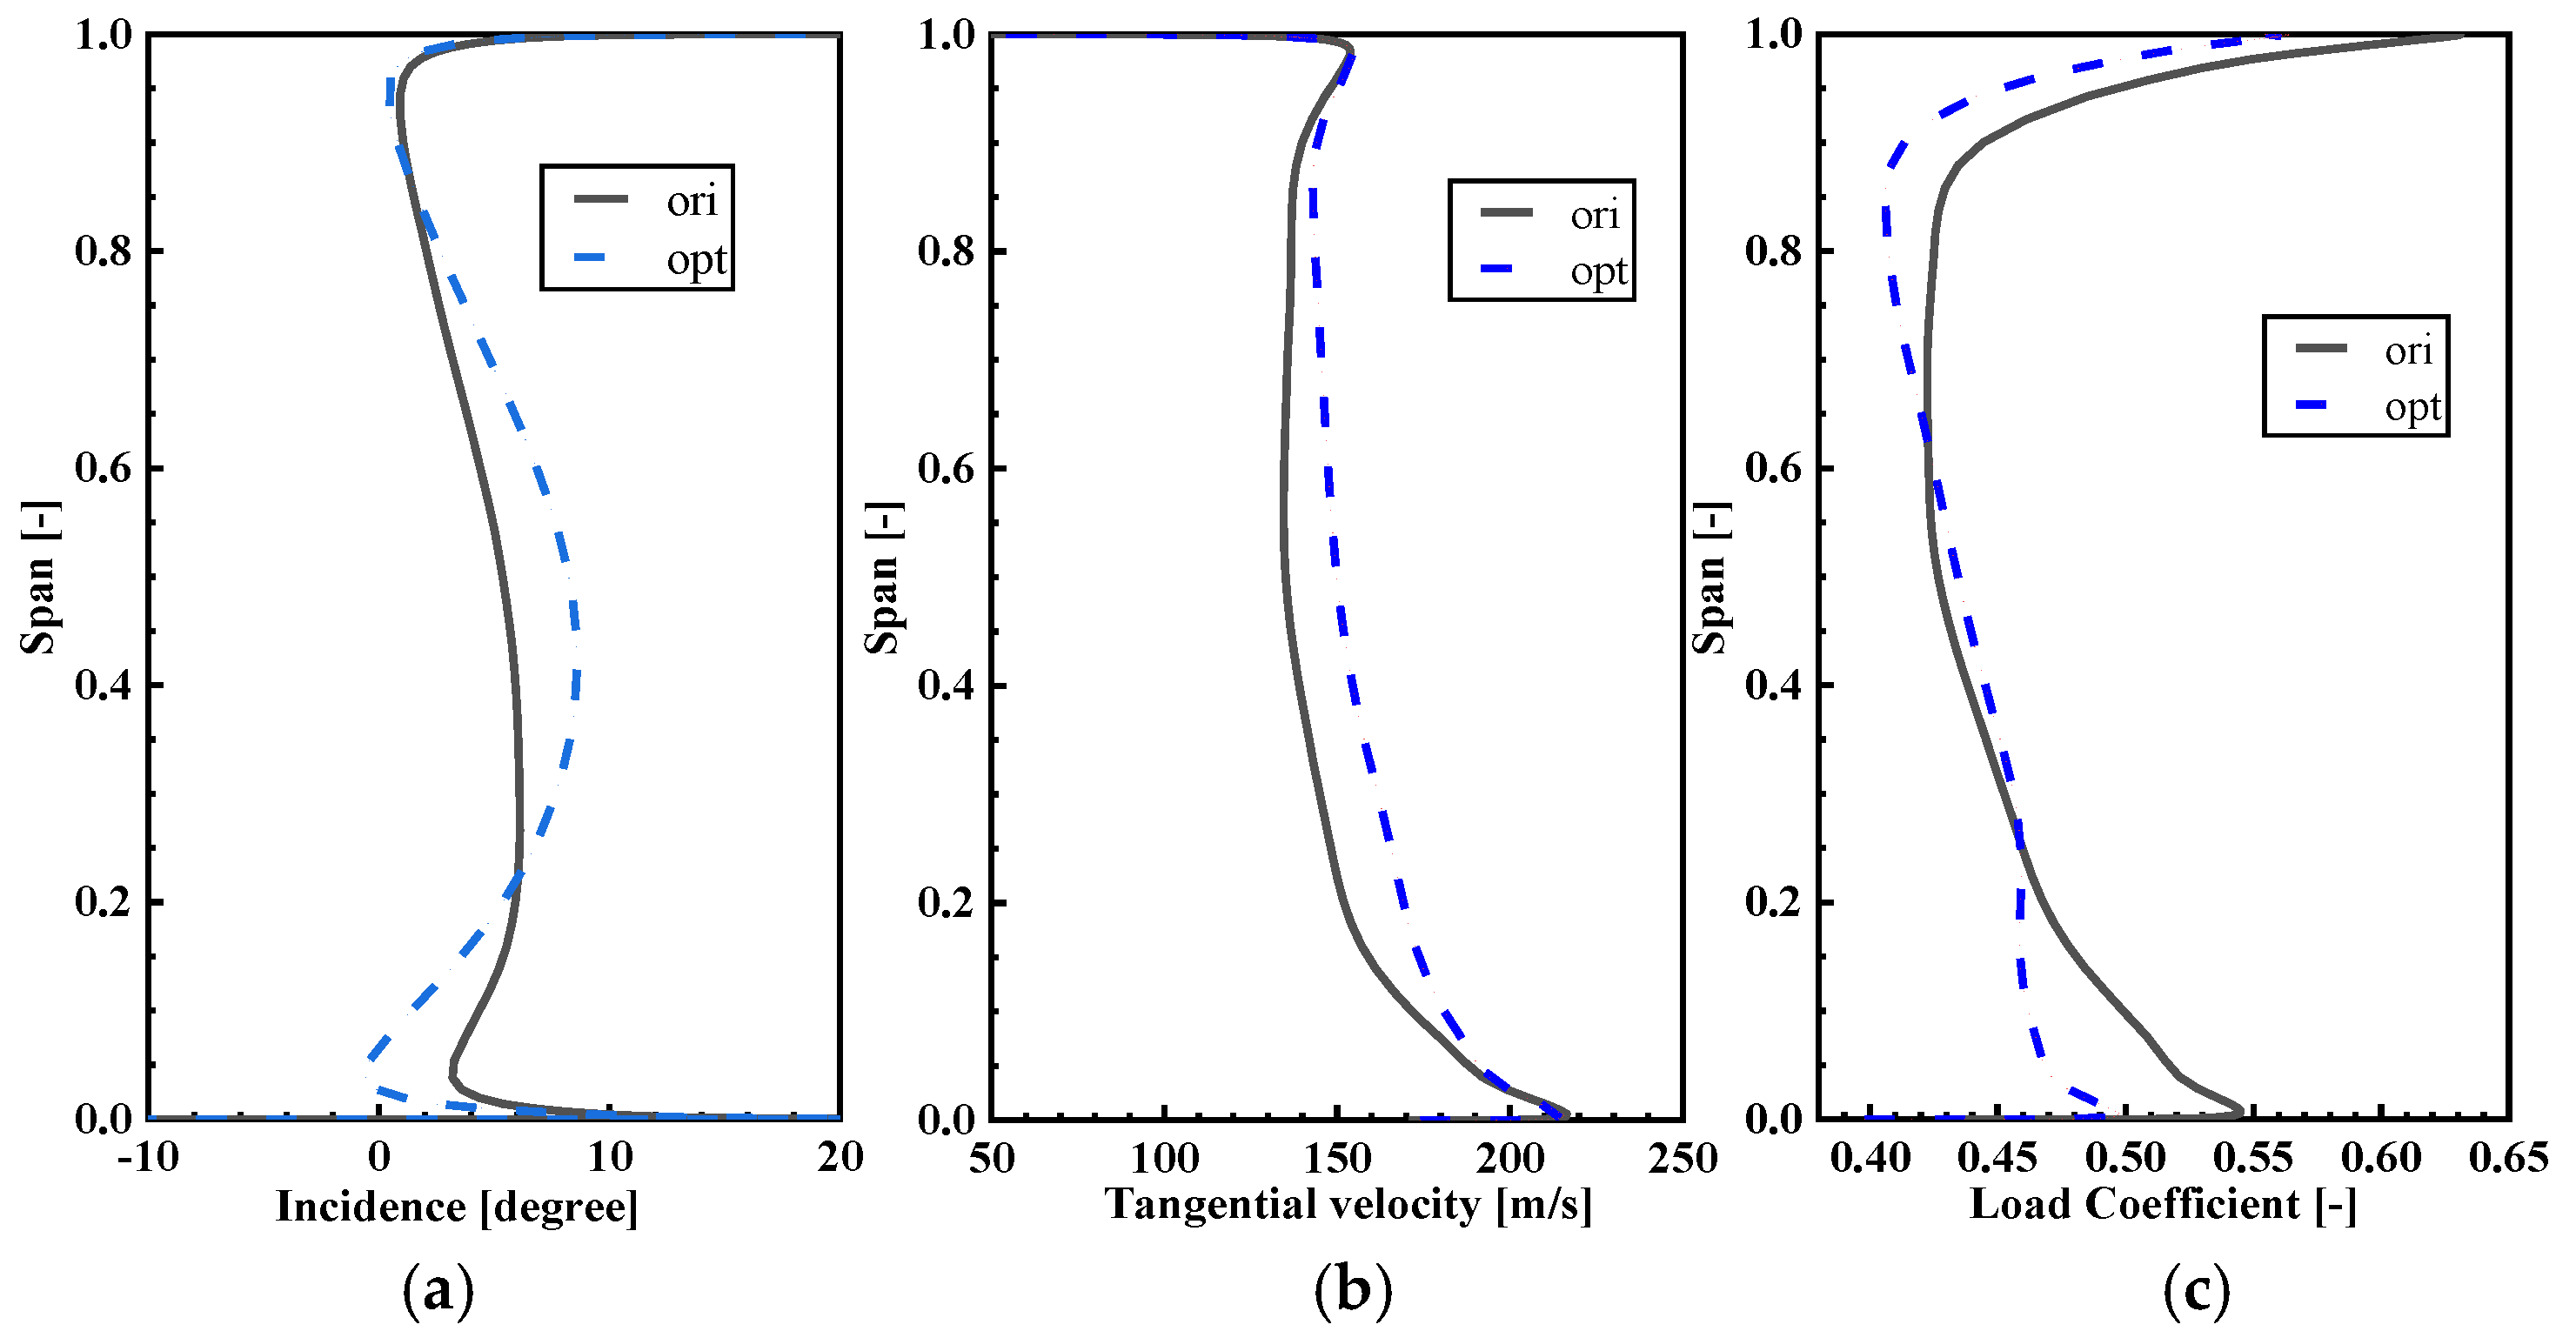
Figure 15 presents the spanwise distributions of the inlet incidence, flow turning angle, and working coefficient of the transonic compressor’s rotor blade. In Figure 15a, it can be observed that, below 20% blade span, the OPT inlet incidence is smaller than that of ORI incidence. From 20% to 80% blade span, the OPT inlet incidence increases, while above 80% blade span, the OPT incidence slightly decreases compared to the ORI. Based on previous analysis, this variation is attributed to changes in the stagger angle of the guide vane and rotor blade. While the blade profile remains unchanged, alterations in the stagger angle lead to significant changes in the tangential velocity of the outlet. Figure 15b demonstrates that the tangential velocity of the OPT is generally higher than that of the ORI, with a significant improvement in the mid-span region and minor variations near the endwall. Figure 15c reveals that the loading coefficient of the OPT is only slightly higher than that of the ORI within the 30% to 60% span range, while at other locations, the loading coefficient of the OPT is lower than that of the ORI. Considering the total temperature distribution at the rotor outlet, although the work done by the rotor blades increases, the OPT rotational speed also increases by 2%. Therefore, the actual loading on the rotor blade near the mid-span does not show a significant improvement but rather a notable decrease near the endwall. With the increase in rotational speed, the overall tangential velocity at the outlet of the moving blades should increase. However, due to the combined effect of changes in the stagger angle of the guide vane and rotor blade, the tangential velocity near the endwall remains nearly unchanged. In summary, the changes in the stagger angles of the rotor and guide vane alter the distribution of tangential velocity at the rotor outlet, consequently affecting the performance of the compressor in terms of work capability.
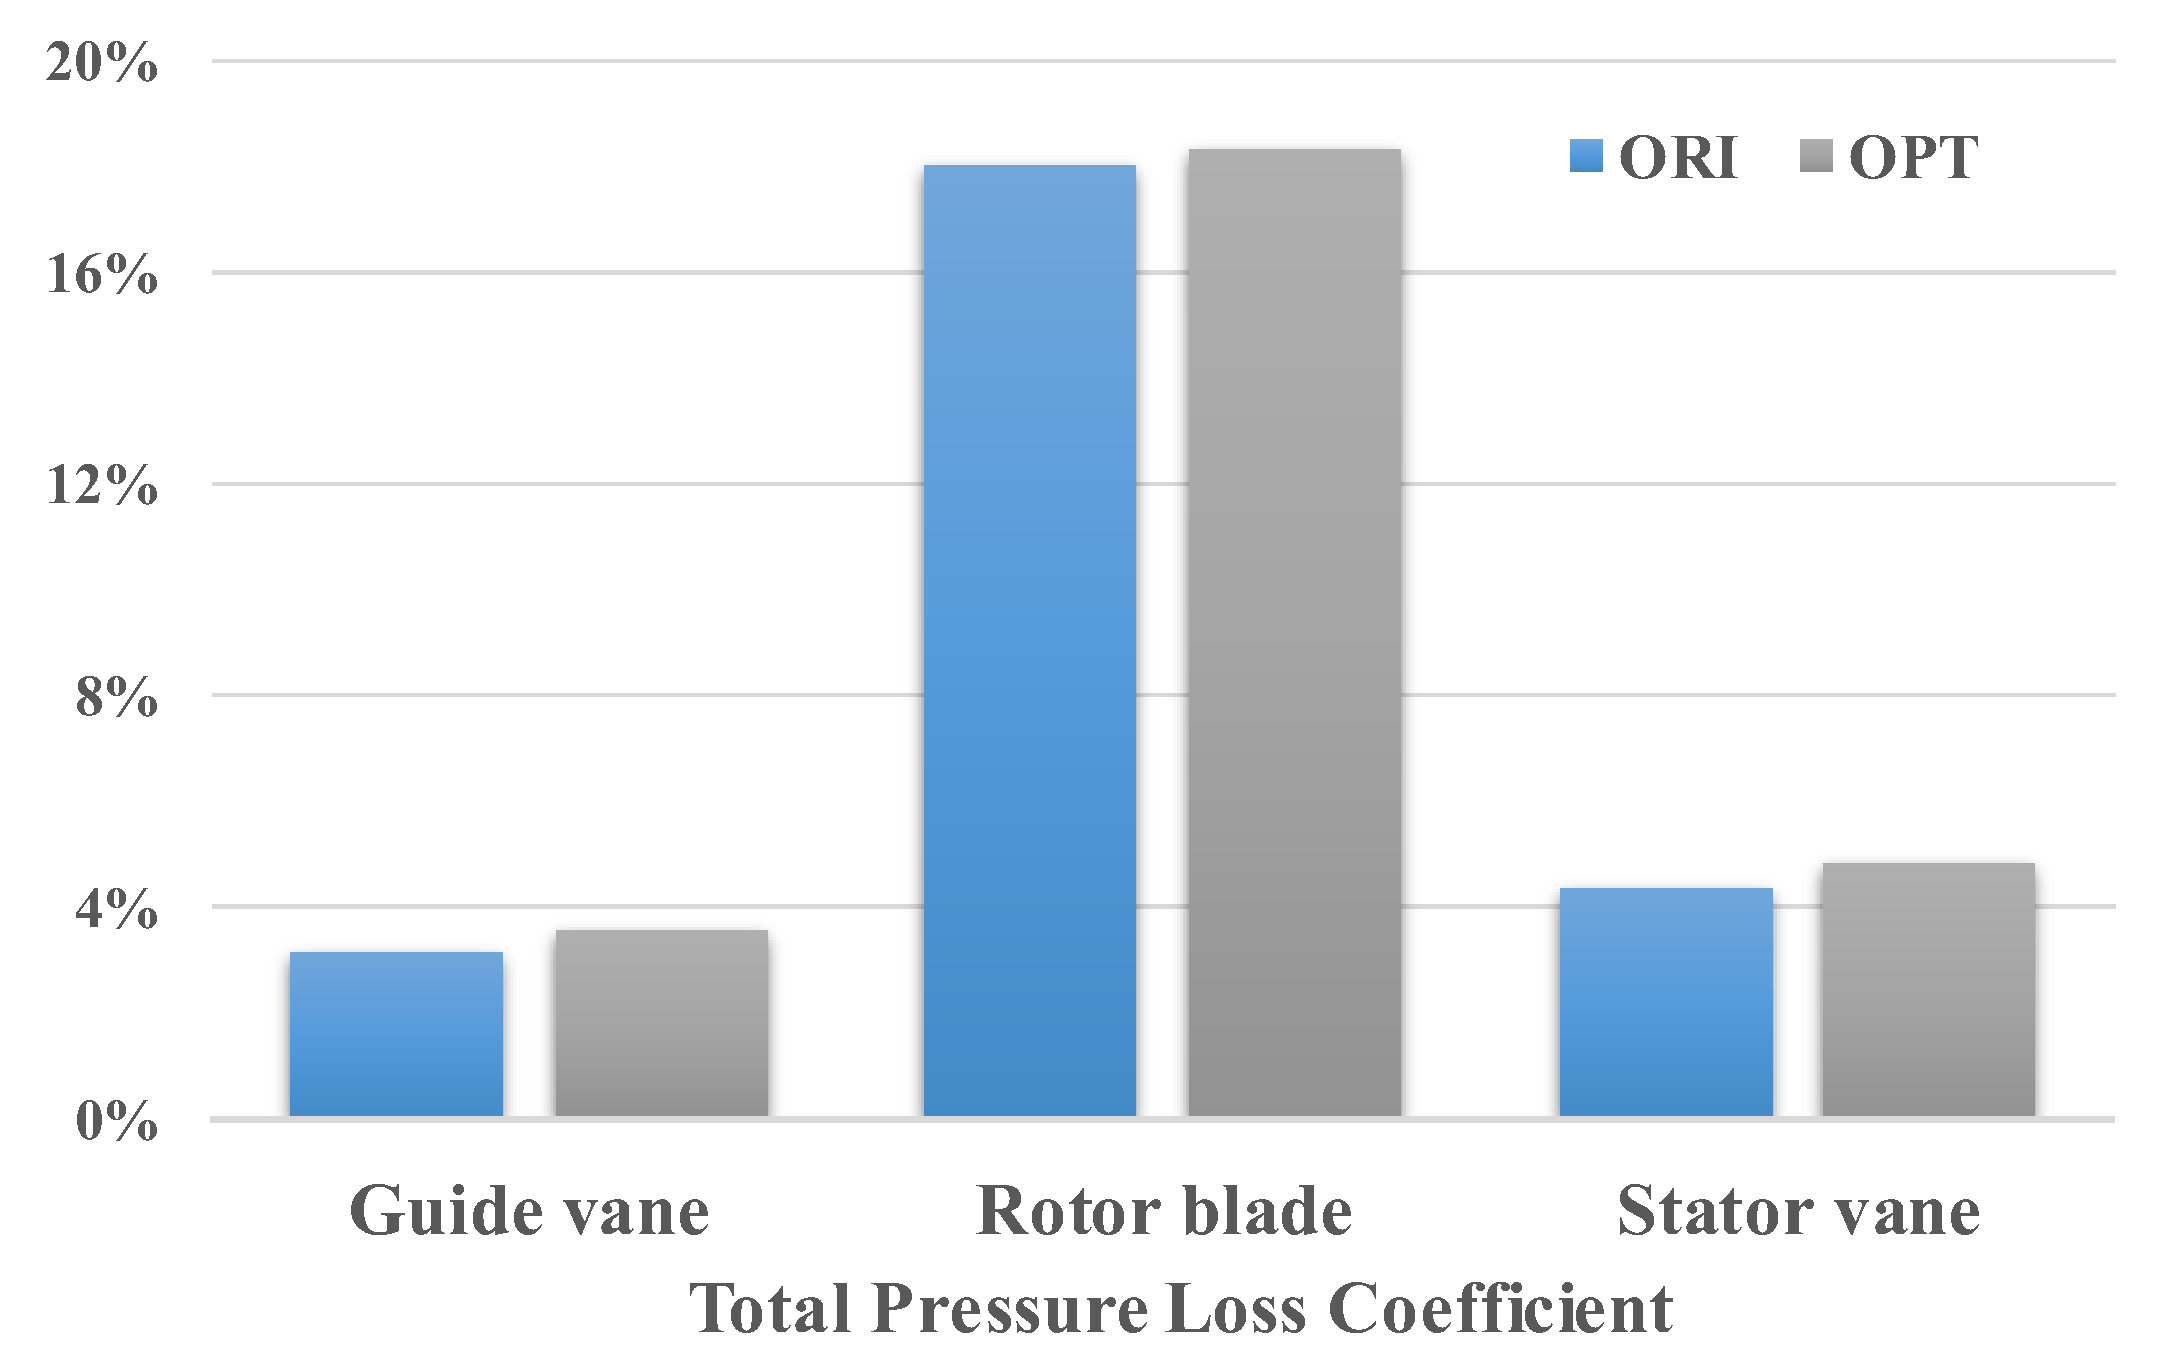
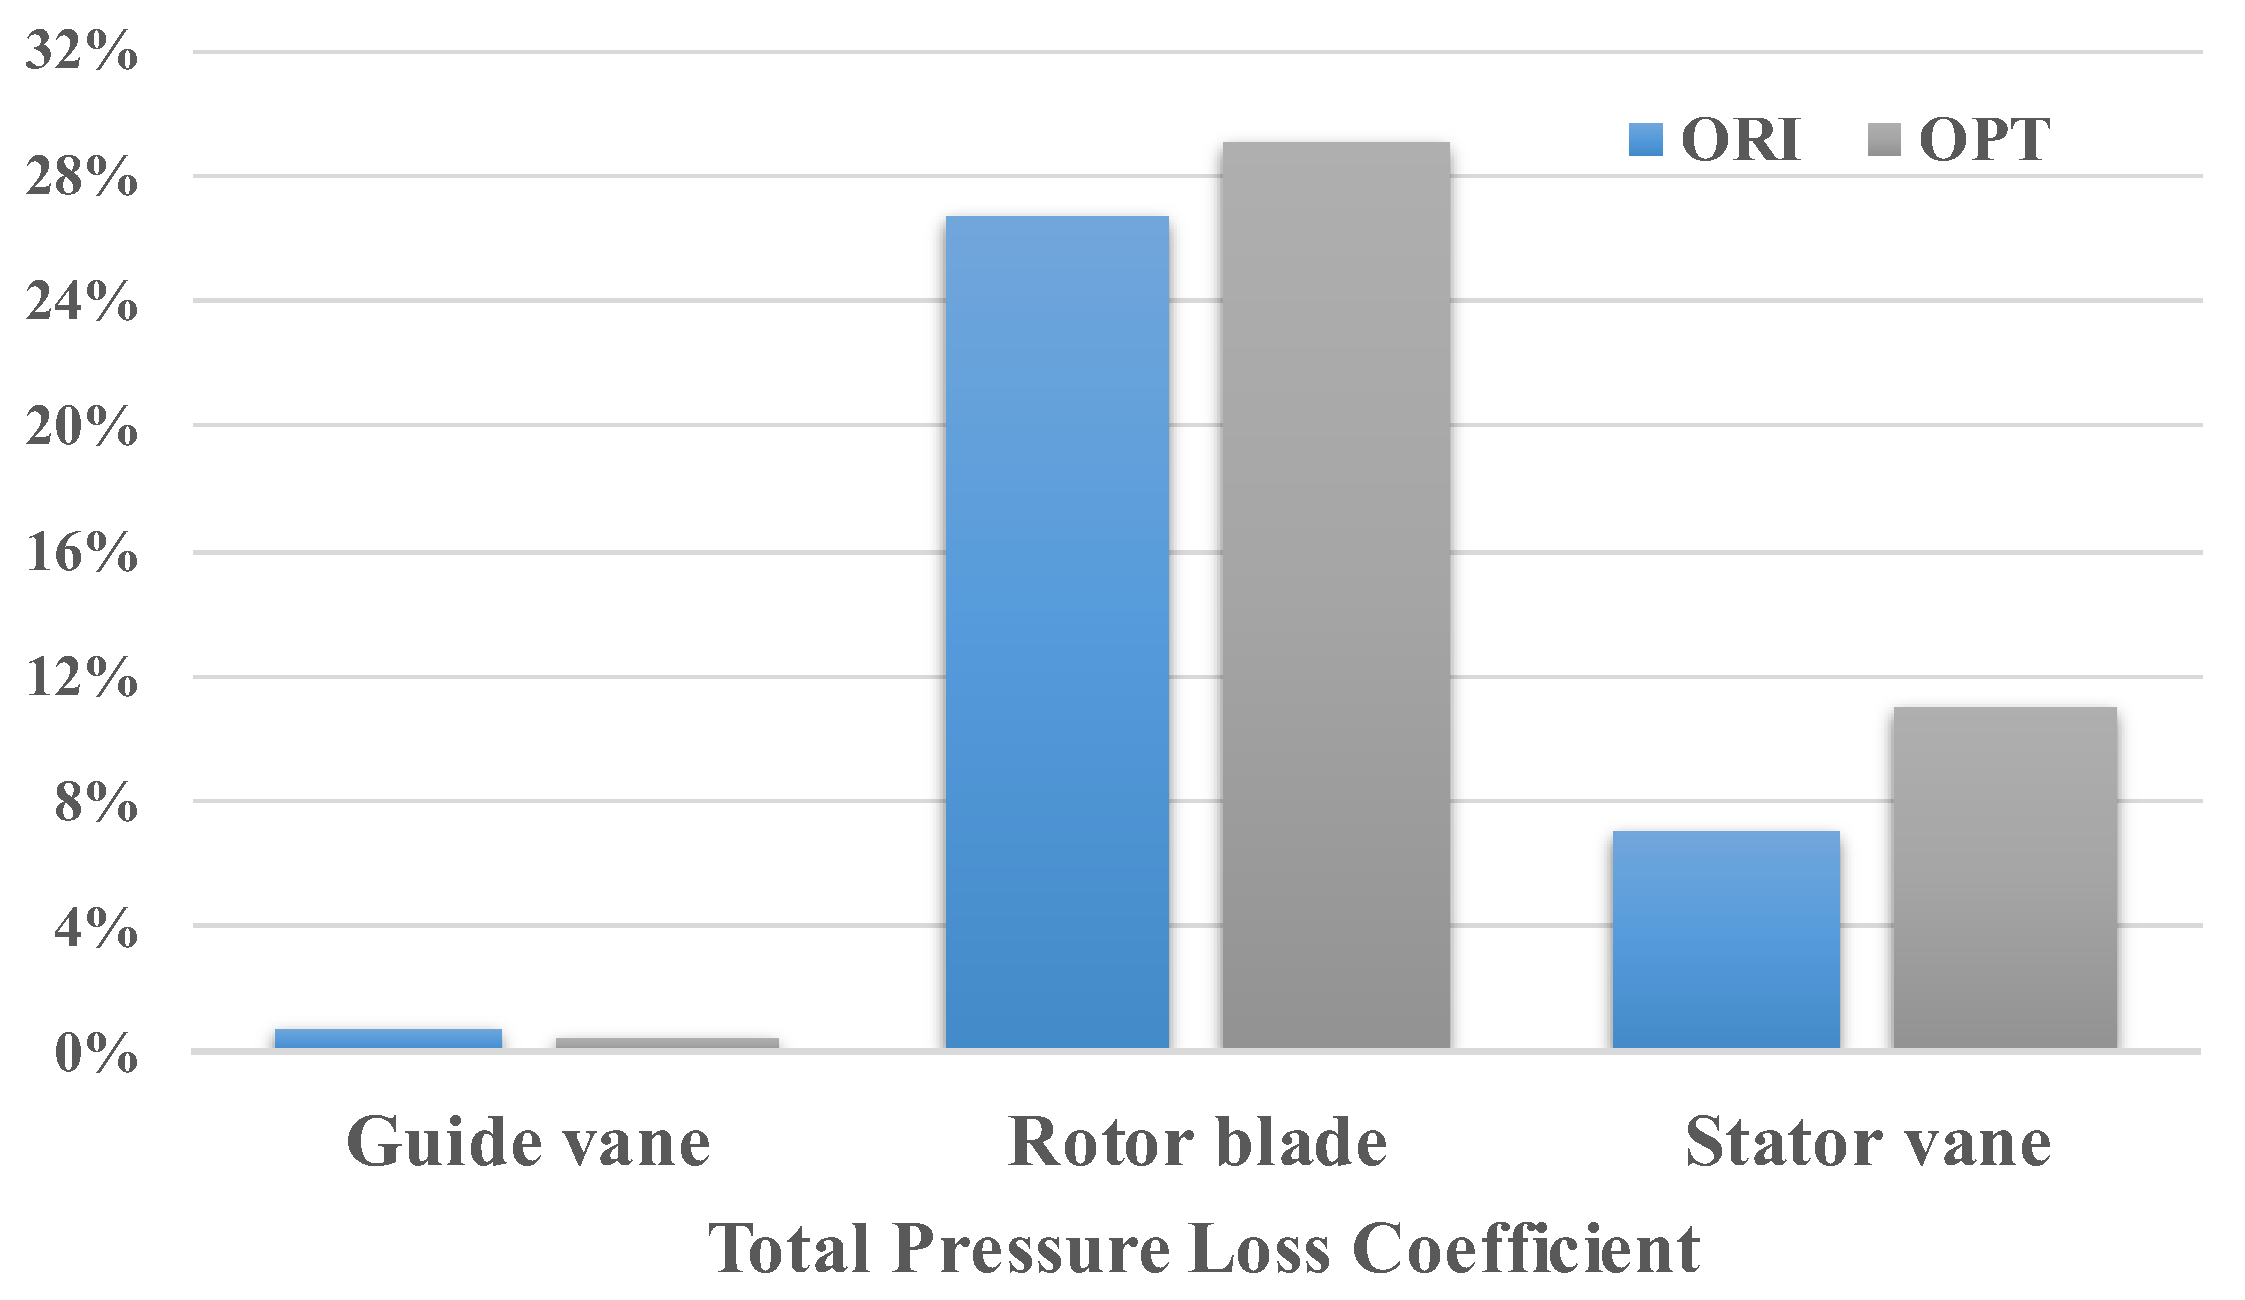
To effectively illustrate the variations in the loss of the three blade rows at the design condition, the total pressure loss coefficient for each blade row is provided in Figure 16. Loss coefficient is defined as follows:
ω = p 1 p 2 p 1 p 1 × 100 %
where the subscripts 1 and 2 represent the blade inlet and outlet, respectively; the superscript * represents the stagnation state.
Figure 16 demonstrates that the losses of the three blade rows for OPT are all higher than those for ORI, with the rotor loss experiencing the most significant increase. The airflow in the guide vane is characterized as accelerated flow, and the increase in its loss is attributed to the rise in Mach number resulting from the enhanced flow rate.
The loss within the rotor mainstream flow domain is primarily divided into shockwave loss and profile loss. Shock wave loss is predominantly influenced by the inlet Mach number, while profile loss mainly stems from wake mixing and airflow separation on the blade surface. The spanwise isentropic efficiency distribution in Figure 13 reveals that the isentropic efficiency of ORI surpasses that of OPT below 90% span. 
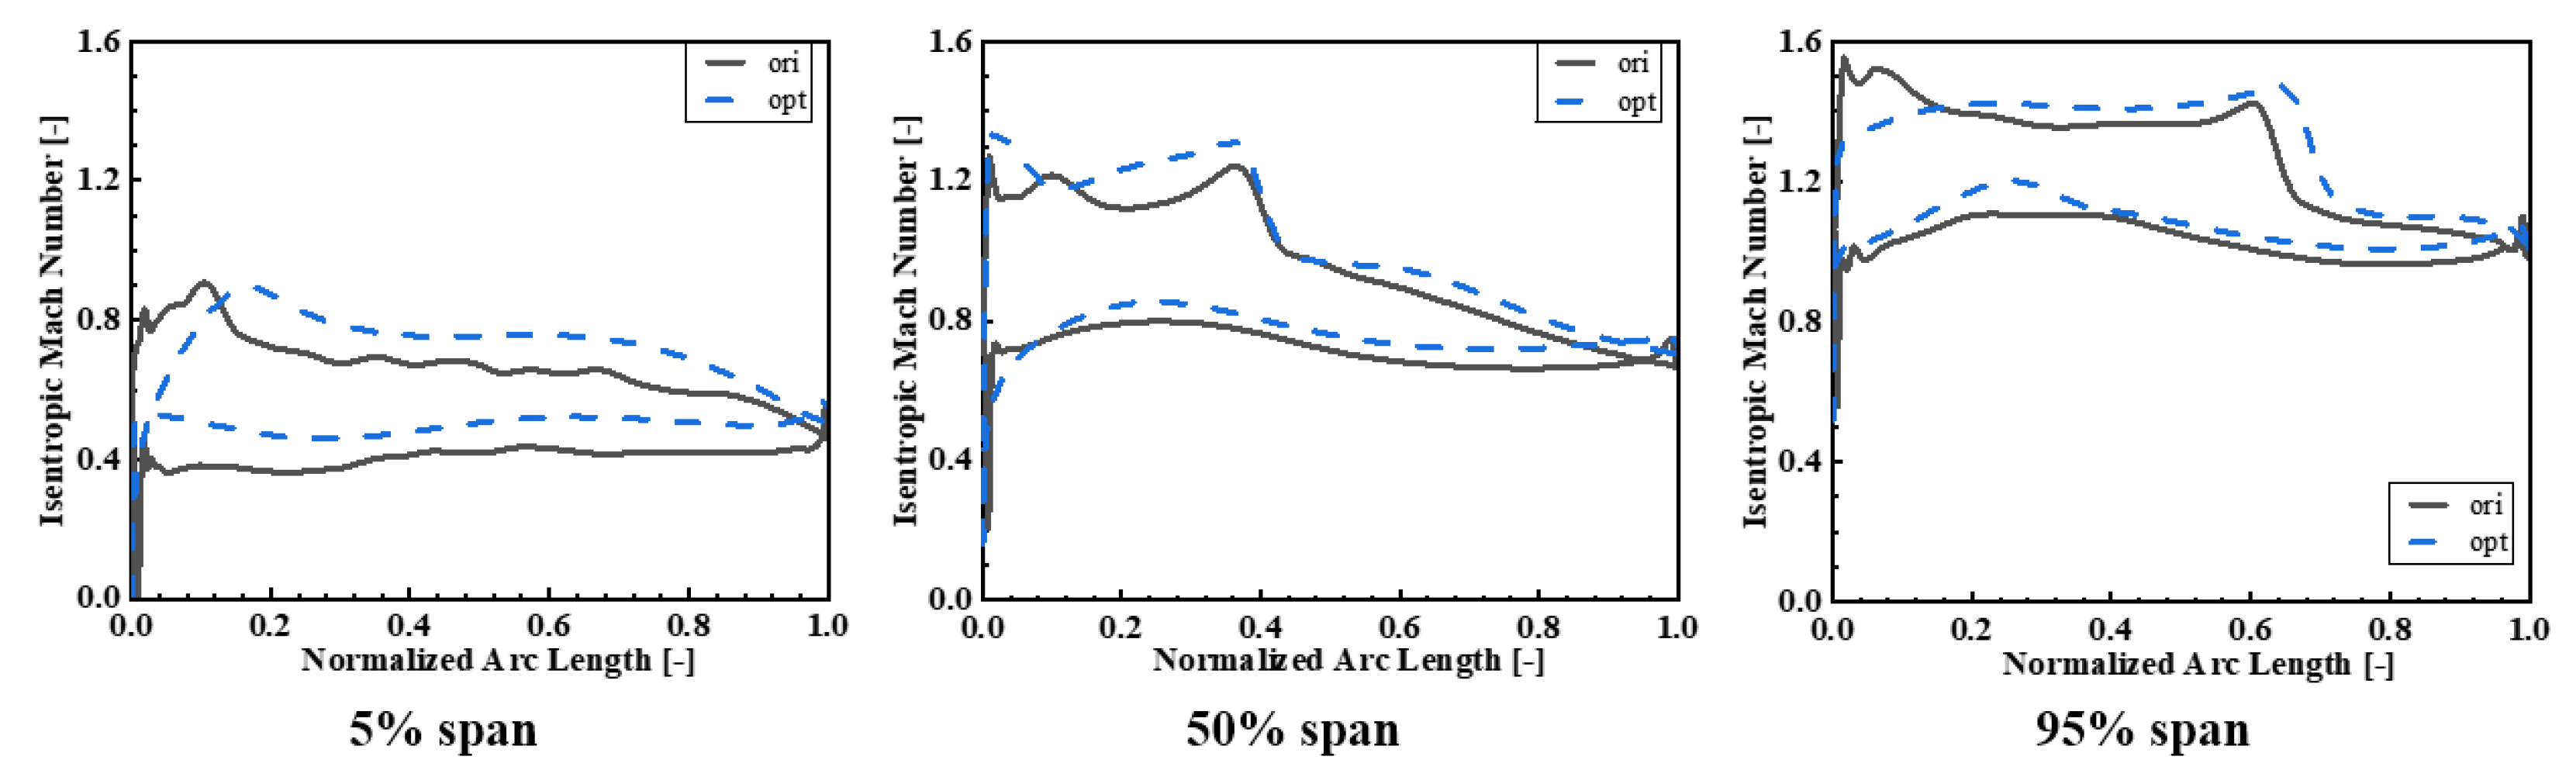
Figure 17 demonstrates that, at 5% span, OPT’s surface isentropic Mach number is substantially greater than ORI’s, with no shockwave occurrence in passage. Given the significantly higher surface isentropic Mach number of OPT compared to ORI, due to the same blade profile, the blade loss induced by OPT is markedly greater than that of ORI. Consequently, this results in lower isentropic efficiency near the hub for OPT compared to ORI. At 50% and 95% span, the Mach number in front of shock wave of OPT is greater than that of OPT, indicating that the shock loss of OPT is higher than that of ORI.
Within the transonic rotor’s passage, shockwave/boundary layer interaction occurs on the suction surface, with the associated loss being proportional to the shockwave intensity. Moreover, airflow separation resulting from shockwave/boundary layer interaction also impacts wake mixing. 
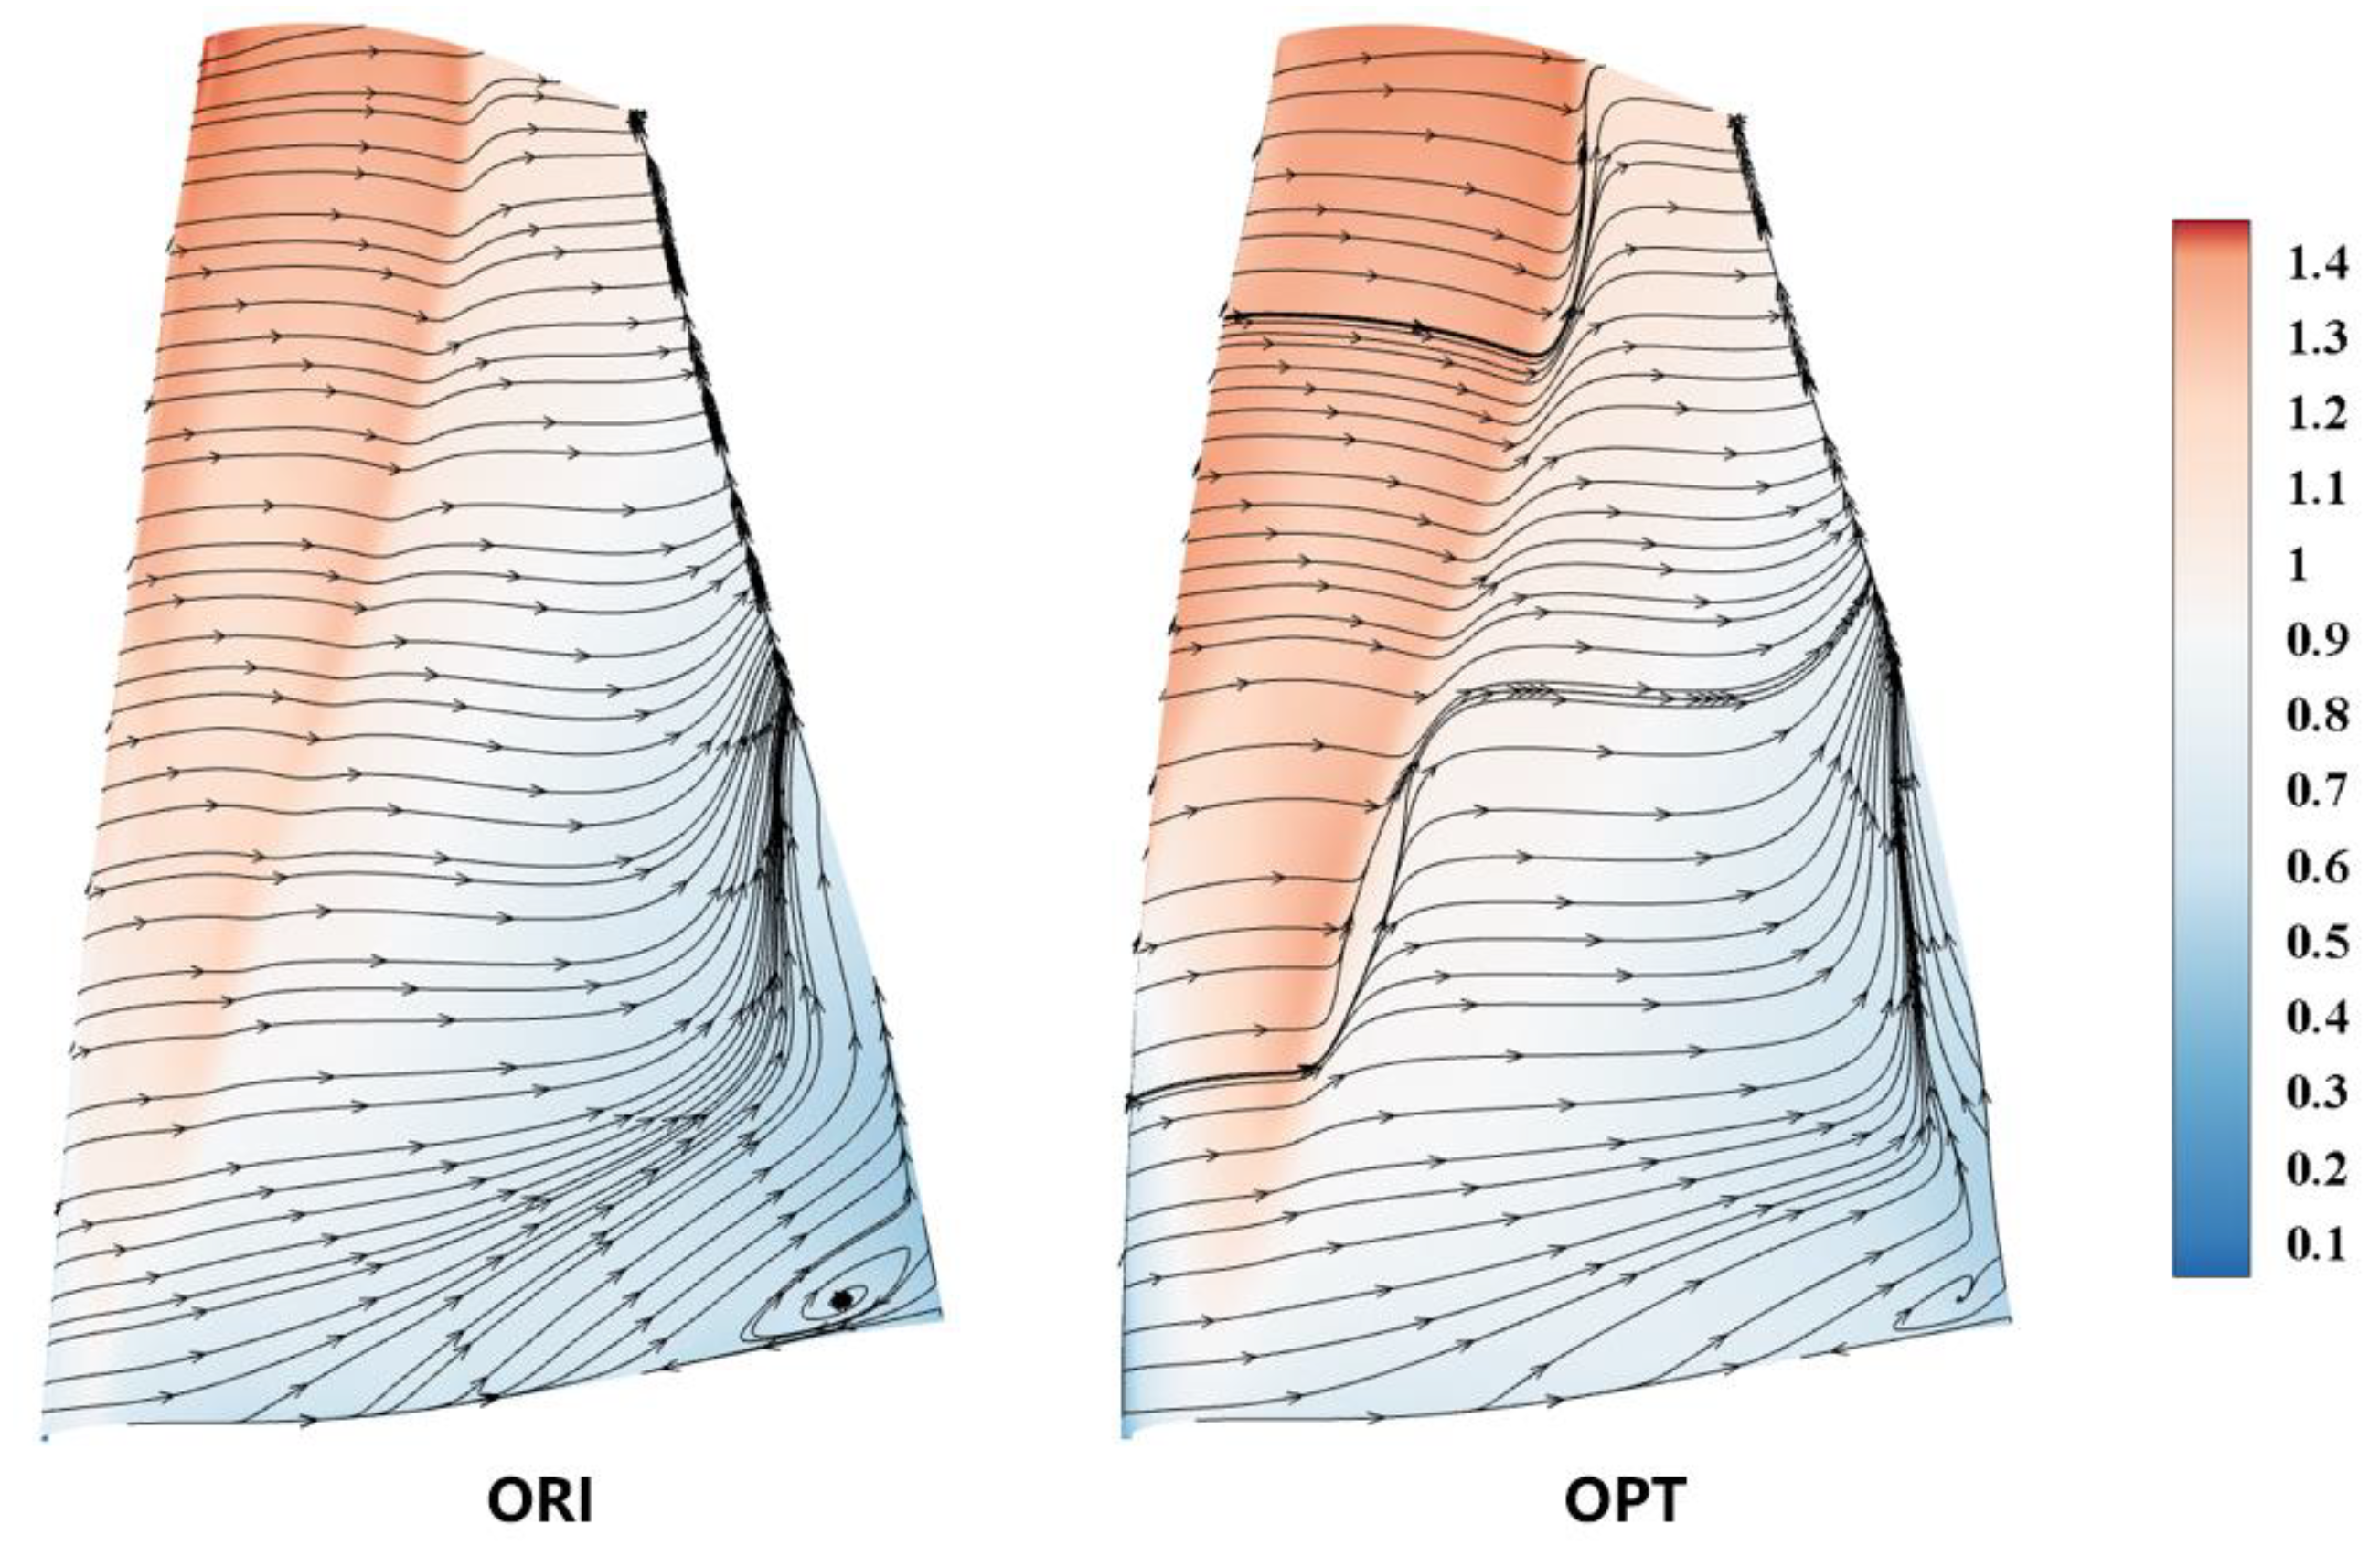
Figure 18 presents the limiting streamline and isentropic Mach number contours on the suction surface of the rotor blade. The streamline distribution reveals that some of OPT’s streamlines are noticeably disrupted by the shockwave, indicating that the shockwave-boundary layer interaction in OPT is significantly stronger, ultimately leading to a decrease in OPT’s isentropic efficiency. The difference arises solely from the variation in the stagger angle, suggesting that the inlet Mach number primarily influences the rotor blade. In conclusion, the main reason for the discrepancy in the spanwise distribution of rotor blade isentropic efficiency is the variation in the inlet Mach number.
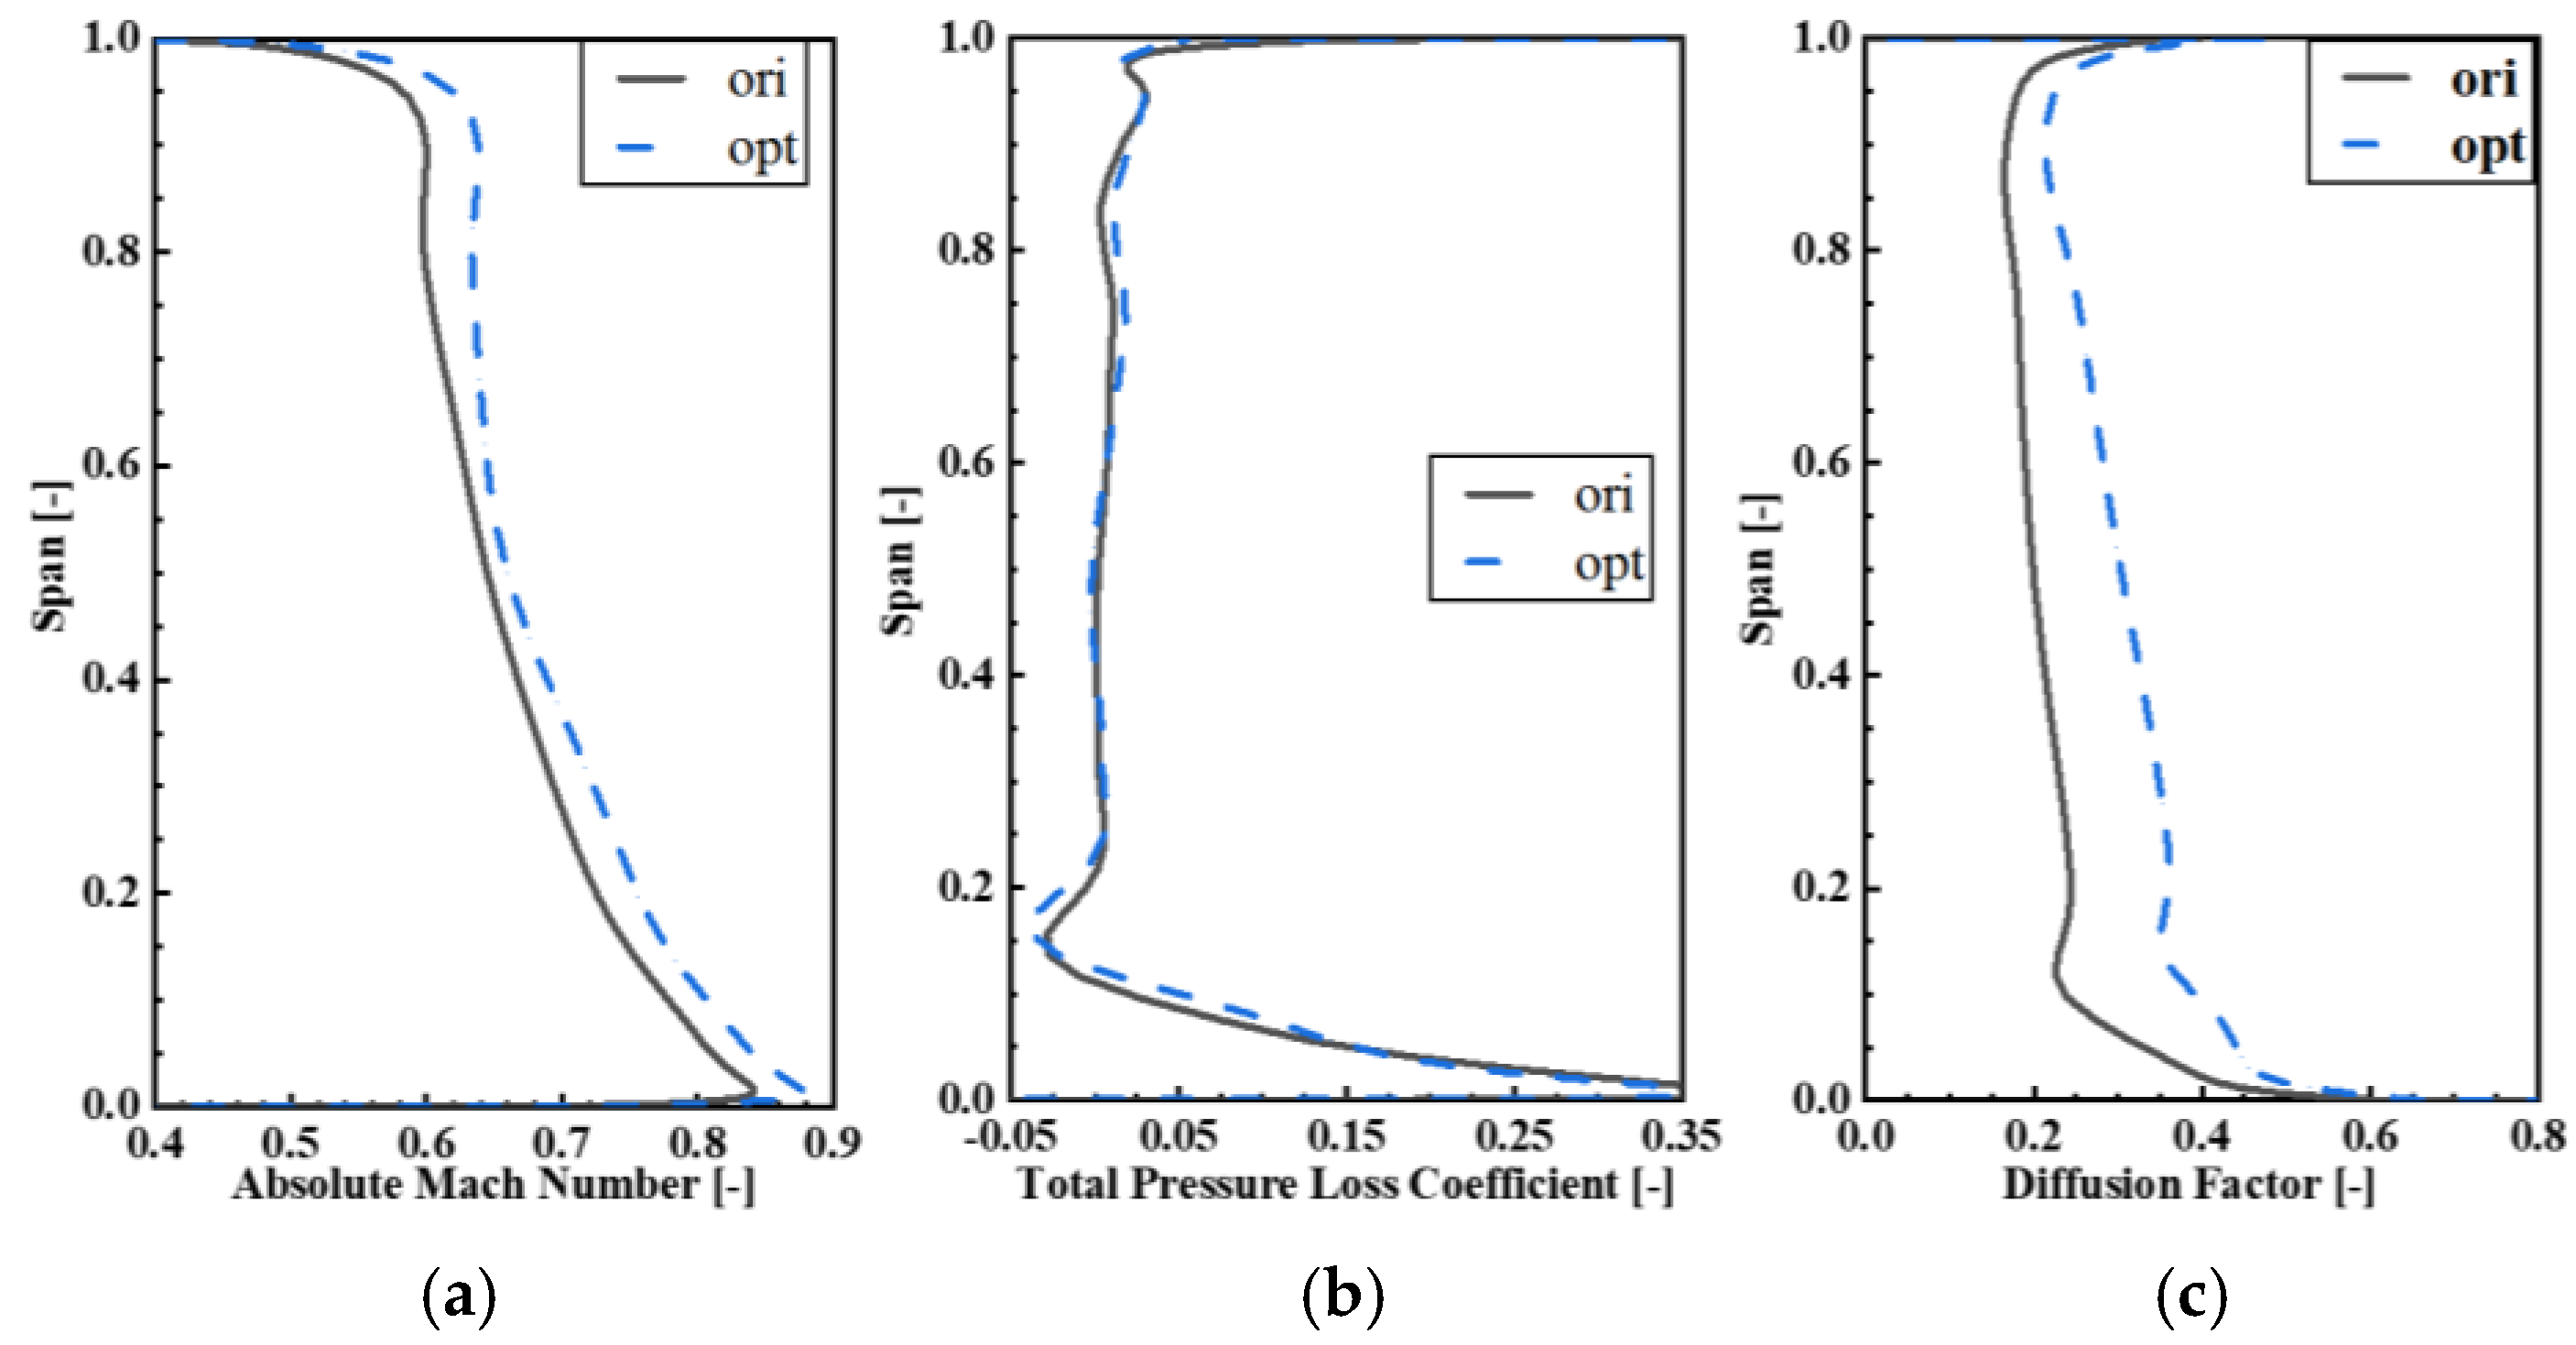
Due to the low hub-tip ratio adopted in the rotor design, the rim speed near the hub is low. In order to improve the working ability of the rotor root, a counter swirl of the guide vane and a large camber angle of the rotor root are adopted. However, these designs lead to a large rotor outlet velocity, which is not conducive to the flow of the stator root. The spanwise distribution of the total pressure loss coefficient, the inlet absolute Mach number, and diffusion factor of the stator blade are shown in Figure 19. The diffusion factor is defined as follows:
D = 1 V 2 V 1 + Δ V t 2 σ V 1
where σ Indicates the solidity of the stator vane; V indicates absolute velocity.
The overall stator inlet velocity of OPT is higher than that of ORI, primarily due to OPT having a larger flow rate, which results in a corresponding increase in its axial velocity. The distribution of loss coefficient depicted in the figure reveals that the difference between ORI and OPT is minimal, but the loss coefficient is larger in vane roots. The average relative loss of the vane in Figure 16 also corroborates this observation, indicating that the stator loss does not change significantly at the design point. Moreover, the distribution of the stator diffusion factor discussed in the paper demonstrates that the loading of OPT is higher than that of ORI overall, and the loading of the stator blade progressively decreases from the vane root to the vane tip.
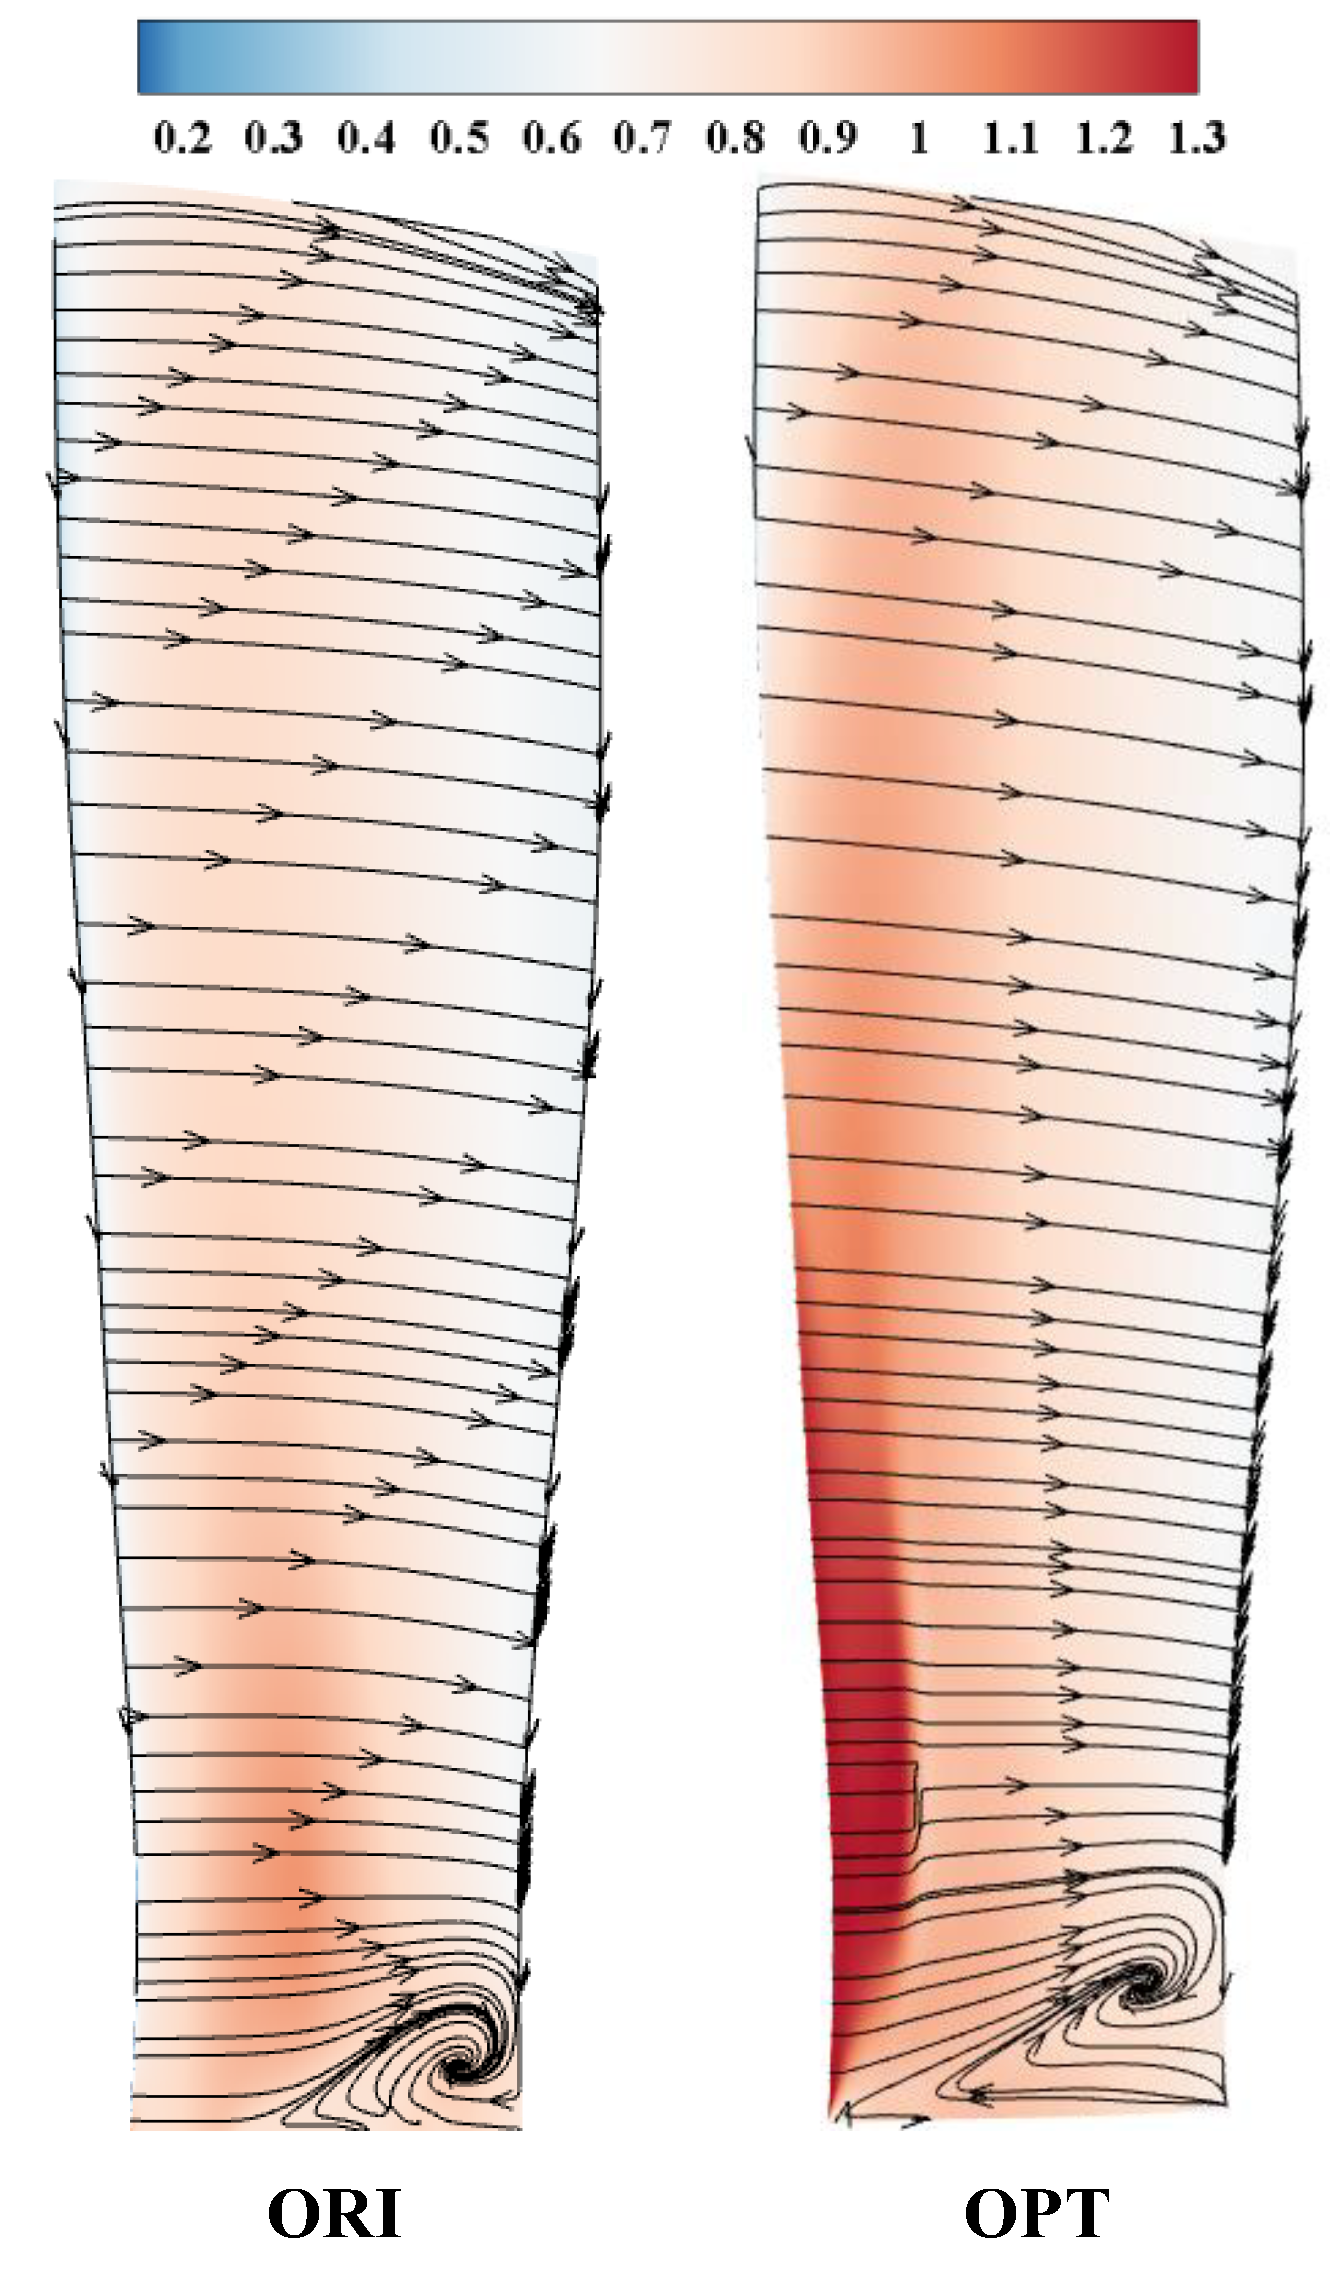
To analyze the changes in the stator flow field, 
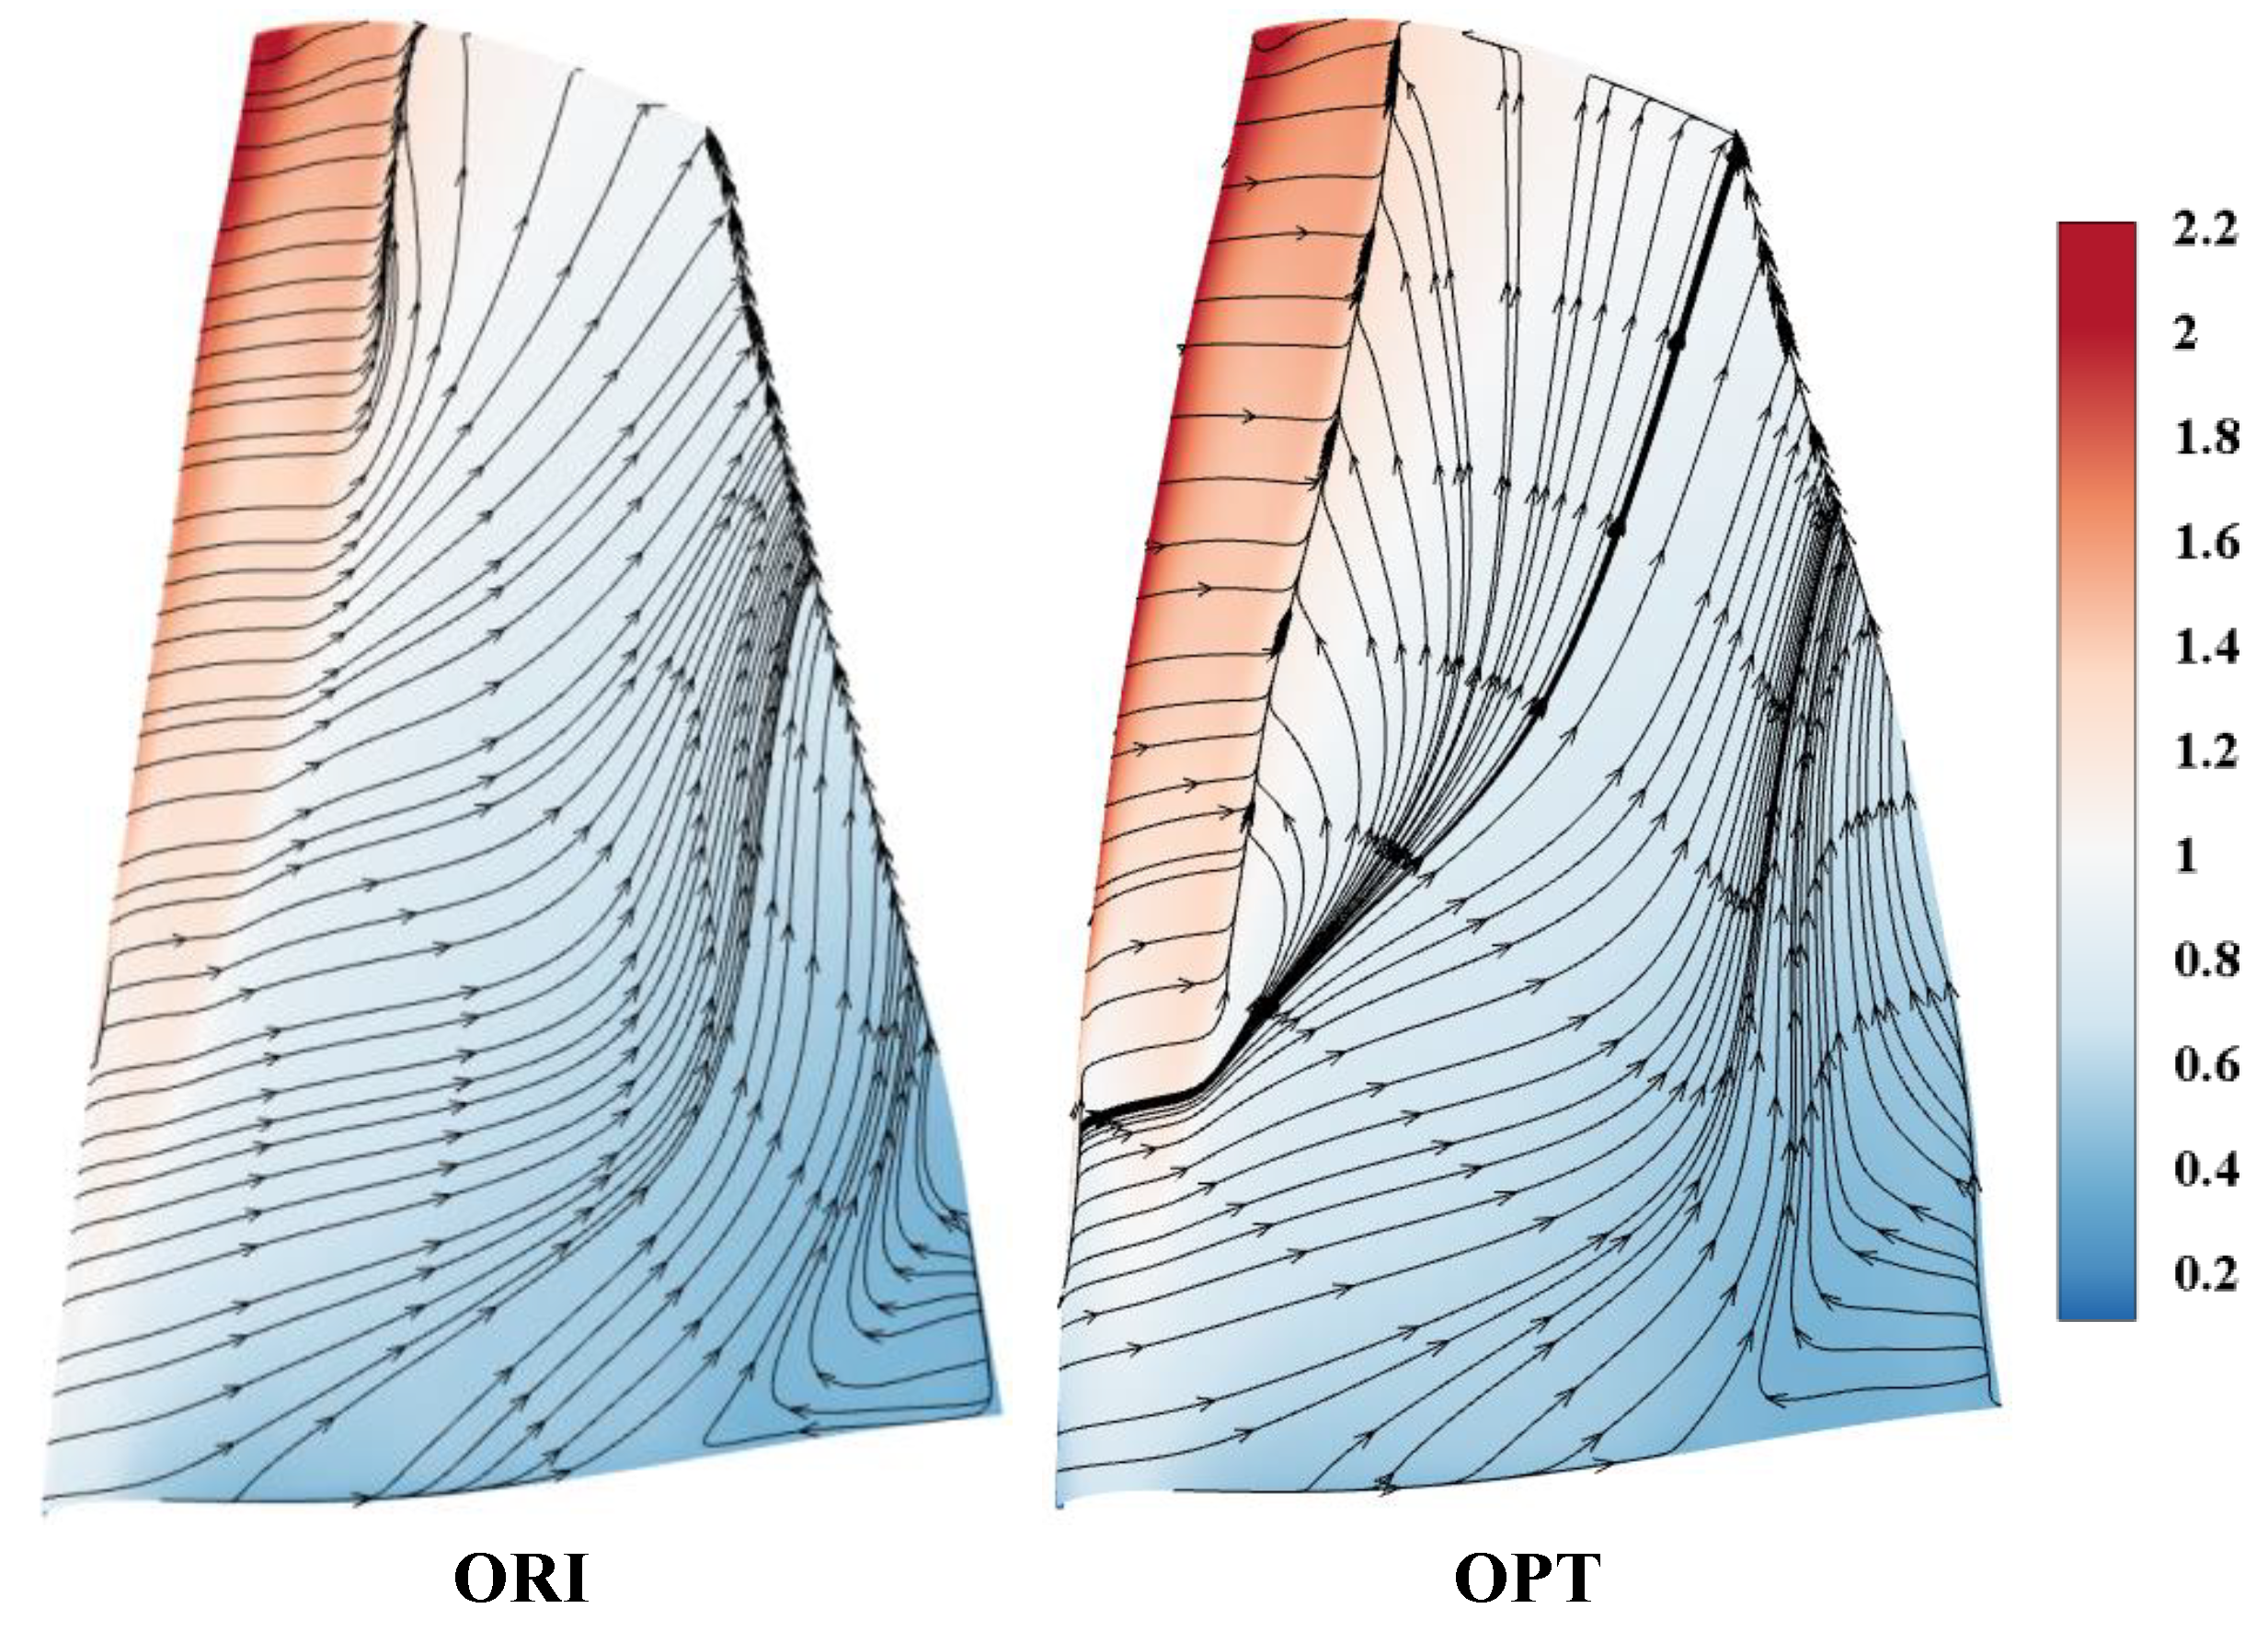
Figure 20 presents the limiting streamlines and isentropic Mach number contours on the suction surface of the stator vane. The figure clearly shows that a significant corner separation exists in the root region of the ORI stator, which is primarily caused by the excessively high inlet Mach number. However, an even larger corner separation appears in the root region of the OPT stator, with the separation initiation location moving upstream. The inlet Mach number at the root of the ORI stator is already quite high, and as the stagger angle of the OPT stator decreases, the root loading further increases, leading to a more extensive stall. Although the inlet Mach number and loading of the OPT stator have both increased overall, the differences in streamlines in the remaining suction surface locations are not significant. This indicates that the stator is still operating within a low-loss range outside the root region—consistent with the total pressure loss distribution.

4.2. Flow Field Analysis at Near Stall Condition

To analyze the impact of stagger angle variation on the flow field at the design point of the compressor, the flow field at near-stall conditions is examined in detail below. Figure 21 presents the total pressure loss coefficient for the three rows of blades near stall condition—using the same calculation method as in Figure 16. Compared to the design point, the loss in the guide vane is reduced, which is primarily due to the decreased flow rate and flow velocity within the guide vane passage. The loss in the rotor passage dominates the compressor loss, and although the loss increases compared to the design point, OPT experiences a greater increase. In comparison to the design point, the vane loss increase for ORI is minimal, but the vane loss for OPT nearly doubles. Based on the performance curve of the compressor, the isentropic efficiency of OPT drops sharply near stall condition, indicating a significant loss in the stator vane of OPT. The isentropic efficiency of the ORI rotor is 0.814, while the isentropic efficiency of the OPT rotor is 0.79. In summary, the sharp losses in the passage of the OPT rotor blade and vane combined leads to a rapid decline in its stage performance.
Figure 22 displays the spanwise distribution of the rotor outlet total temperature, total pressure, and isentropic efficiency. Compared to ORI, OPT’s total pressure is higher at mid-span, lower at the blade root, and slightly lower near the blade tip. The total temperature distribution demonstrates that, at near stall condition, the working capacity of the rotor blade tip is significantly improved while the profile remains unchanged. In comparison to ORI, OPT’s working ability at the blade root is weakened, increasing at mid-span and remaining almost the same at the blade tip. Efficiency distribution indicates that OPT experiences greater losses than ORI above 50% span. 
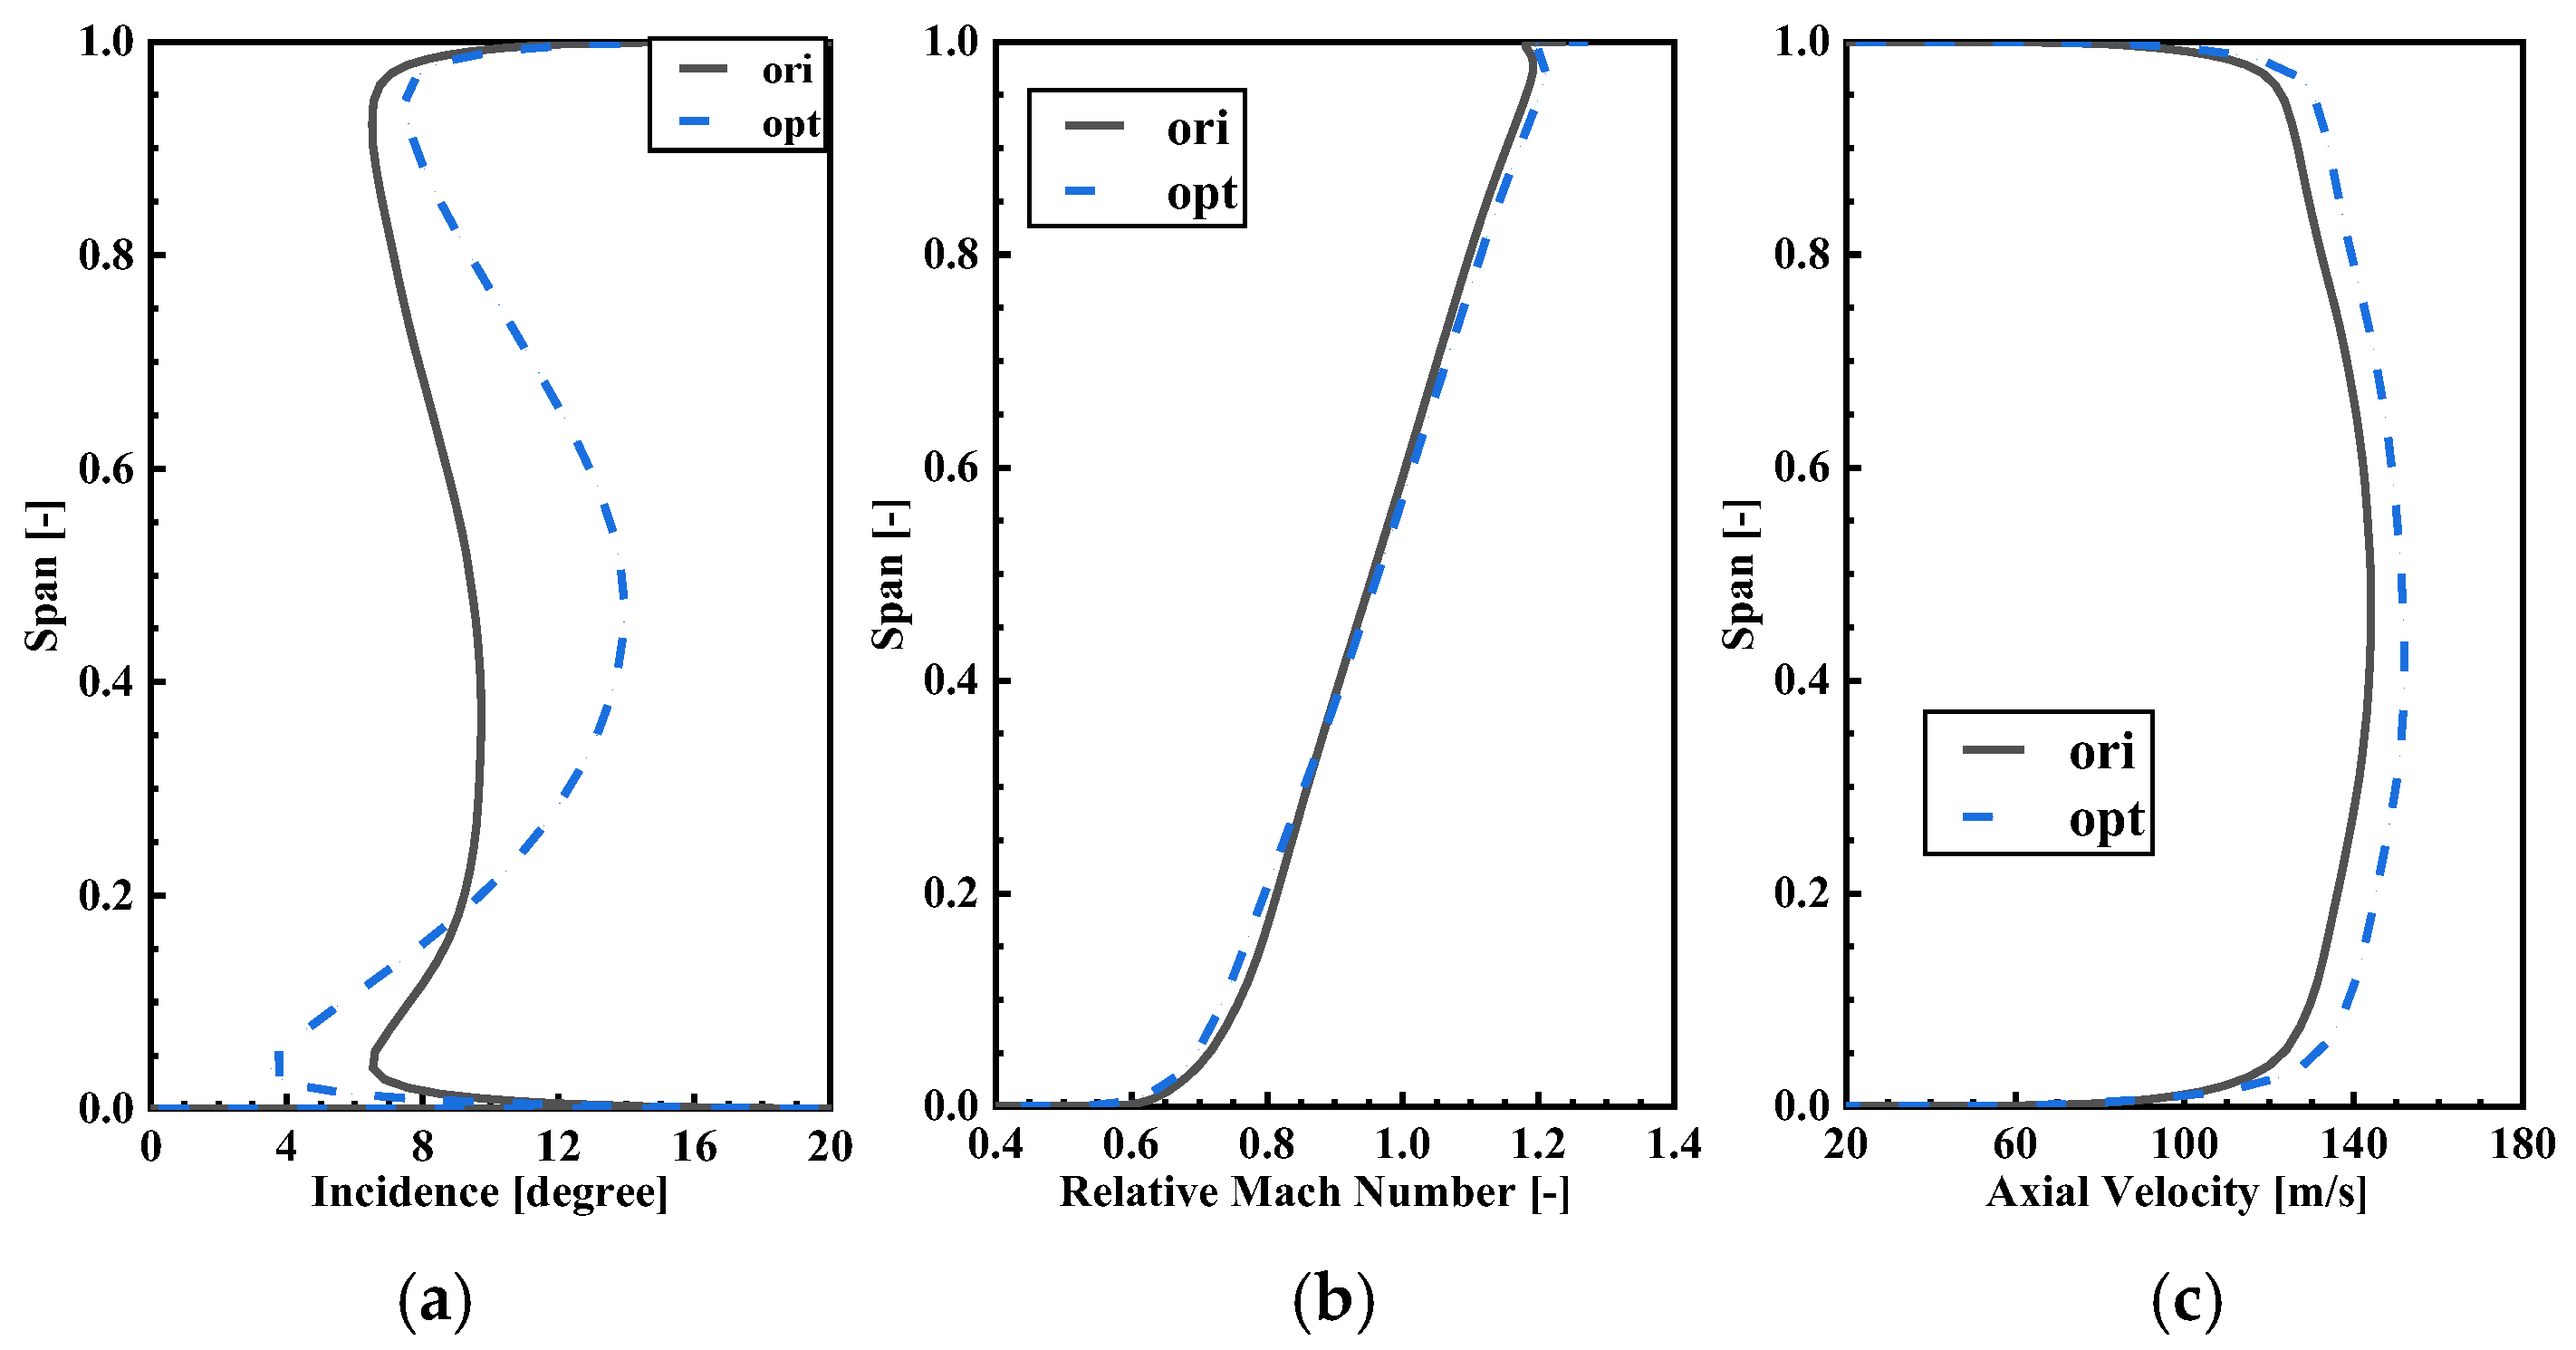
Figure 23 presents the spanwise distribution of rotor inlet incidence, relative Mach number, and axial velocity. The distribution of incidence reveals that the incidence near OPT’s tip is greater than that of ORI, and the distribution at other positions is consistent with distribution at the design condition. Although the inlet Mach number distribution variation between OPT and ORI is similar, the difference between them is minimal. The axial velocity distribution represents the airflow distribution through different sections. Compared to the design condition, the proportion of flow through the tip is significantly reduced. This is primarily due to the decreasing flow rate, which causes the shock wave’s position to gradually move towards the leading edge and increases the shock wave’s strength, thereby limiting the flow rate in the passage.
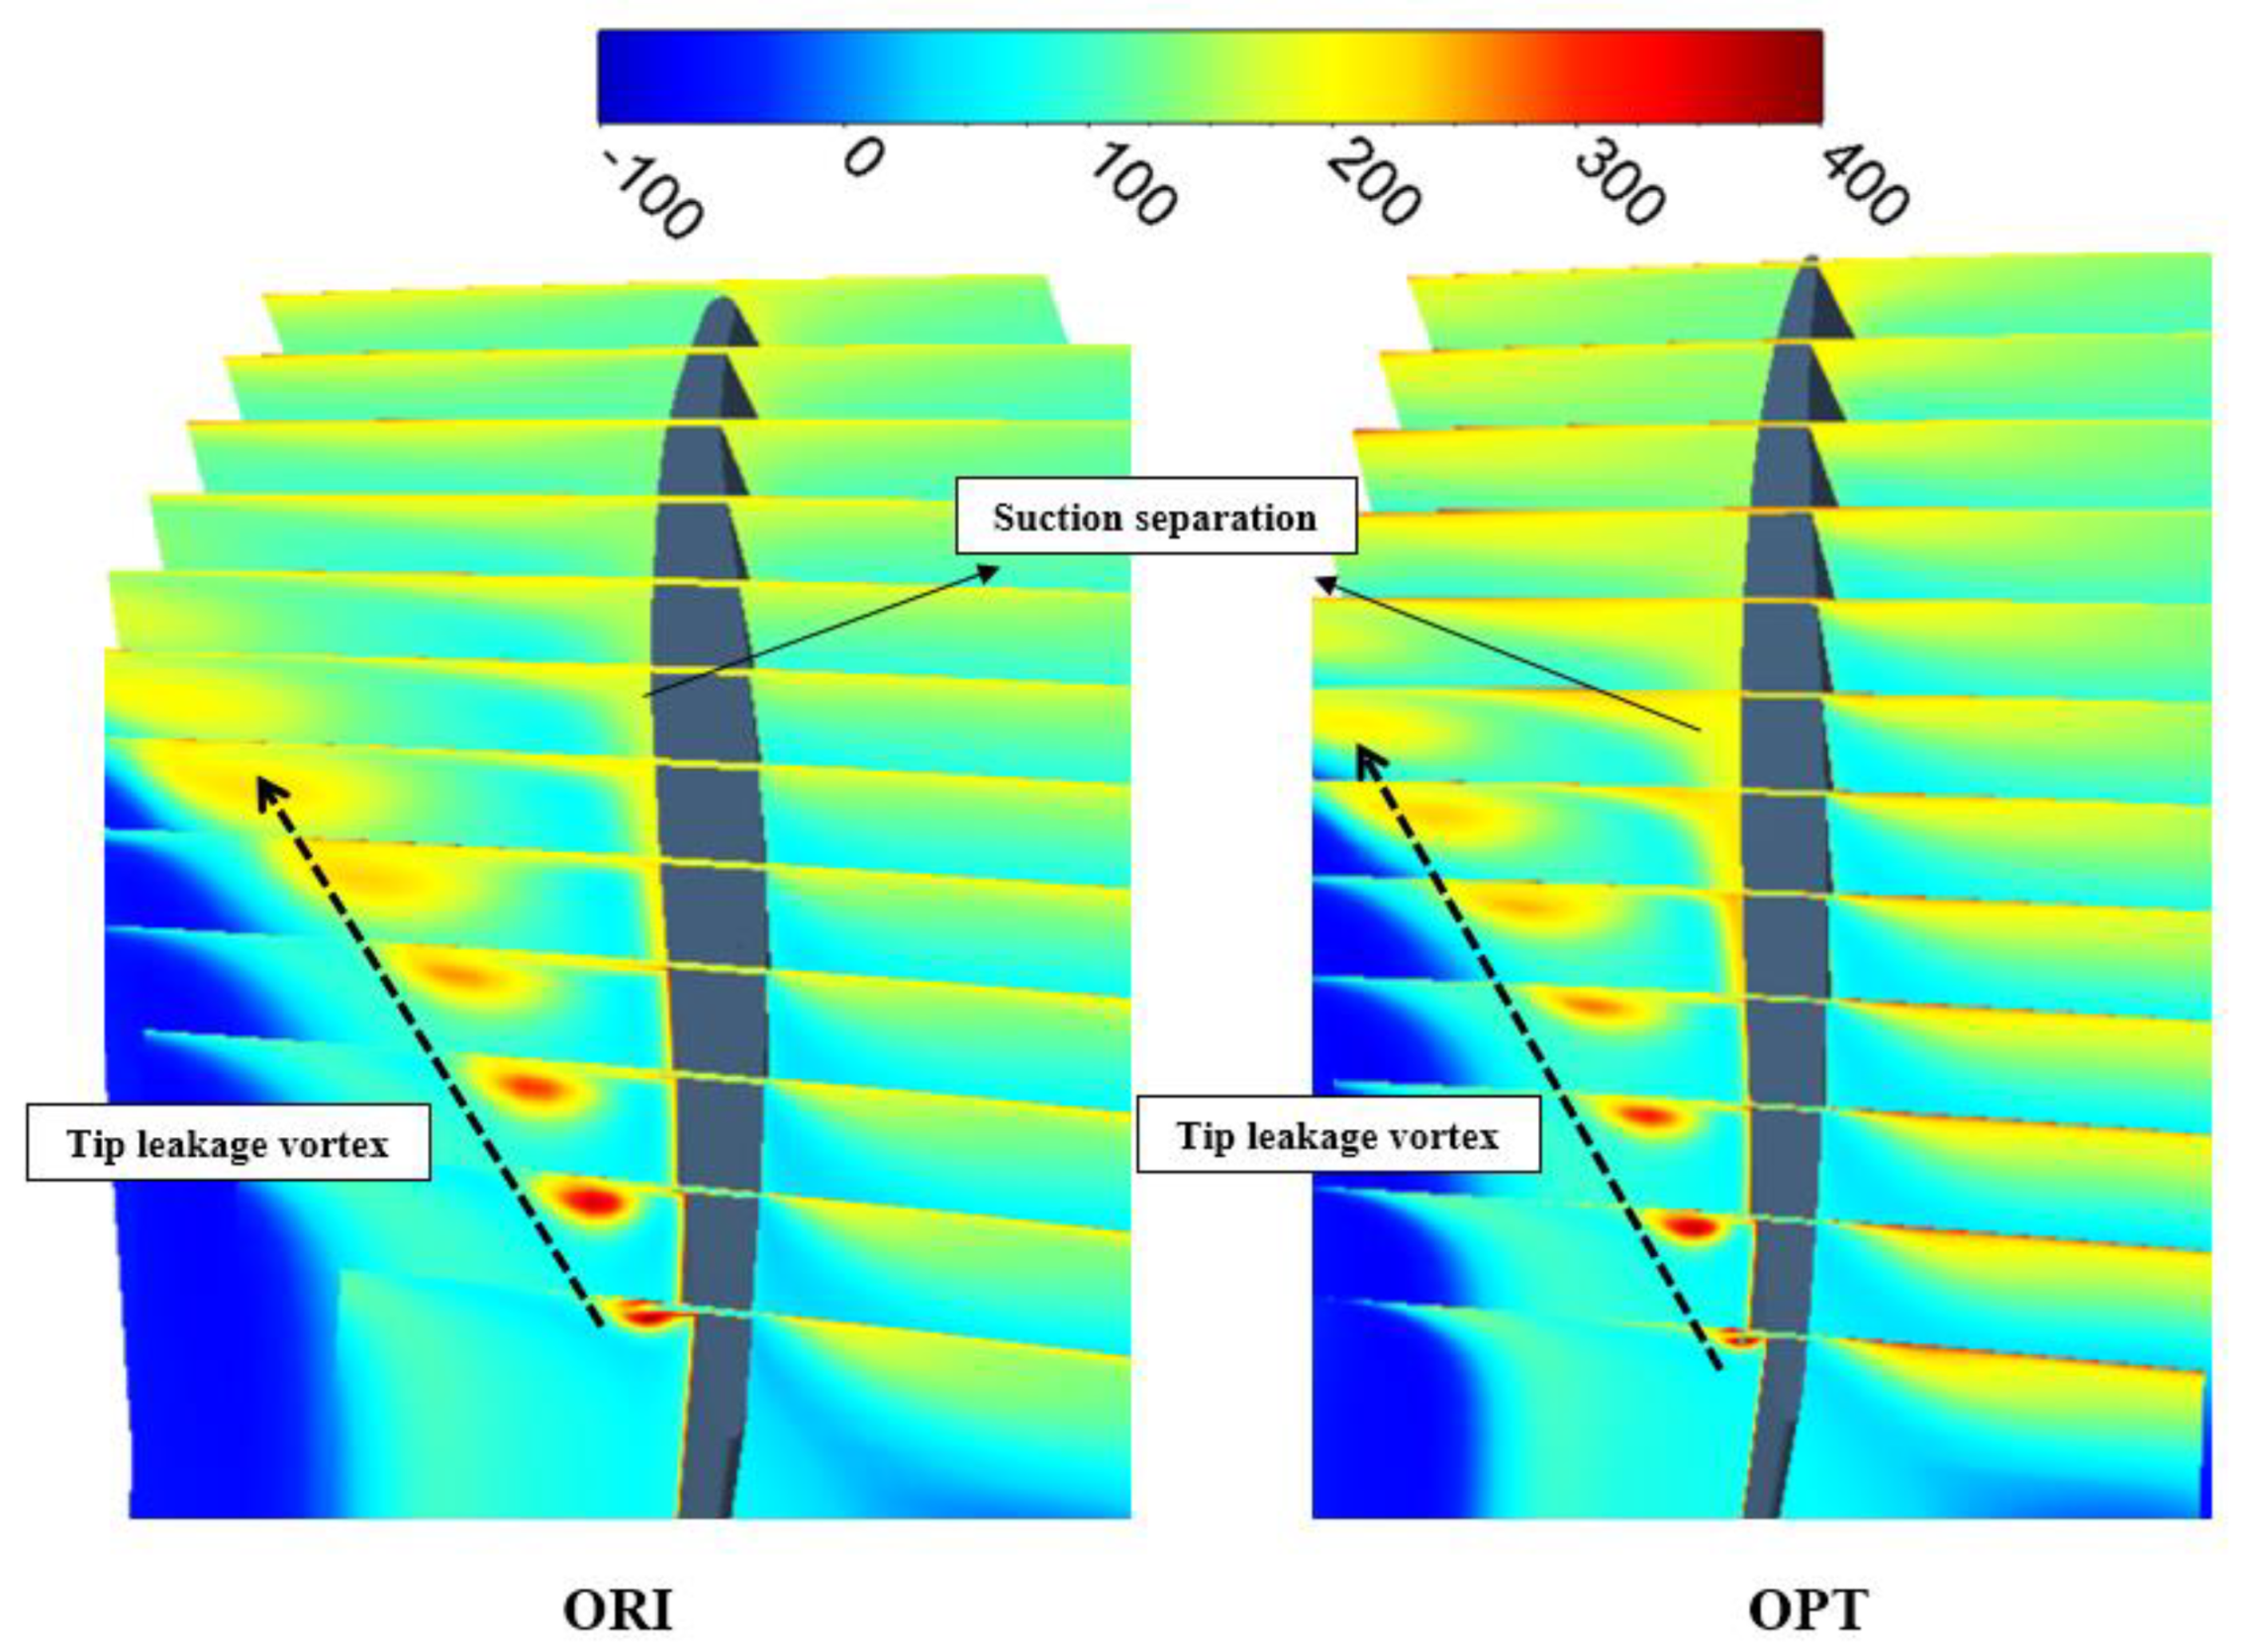
Figure 24 aims to explore the reasons for the decrease in rotor blade efficiency above 50% span by showing the entropy contour of the rotor blade tip region. The initial position of the tip leakage vortex is close to the leading edge, and the development of the leakage vortex has a severe impact on the downstream and flow field of the lower span. In addition, compared to ORI, the suction surface separation of OPT is more serious, and under the influence of blade tip leakage, the high entropy area in the flow field becomes larger. In summary, tip leakage and suction surface separation are the main reasons for the decline in tip efficiency.
Figure 25 displays the isentropic Mach number contour and limiting streamlines on the suction surface of the rotor blade. Compared to the design point, the position of the shock wave moves toward the leading edge, the intensity of the shock wave increases, and the corner separation of the blade root intensifies. According to the previous analysis, the increase in shock wave intensity leads to greater separation of the suction surface. Compared with ORI, the upwash phenomenon on the suction surface of OPT is more pronounced, which is one of the main reasons for OPT’s lower efficiency compared to ORI. 
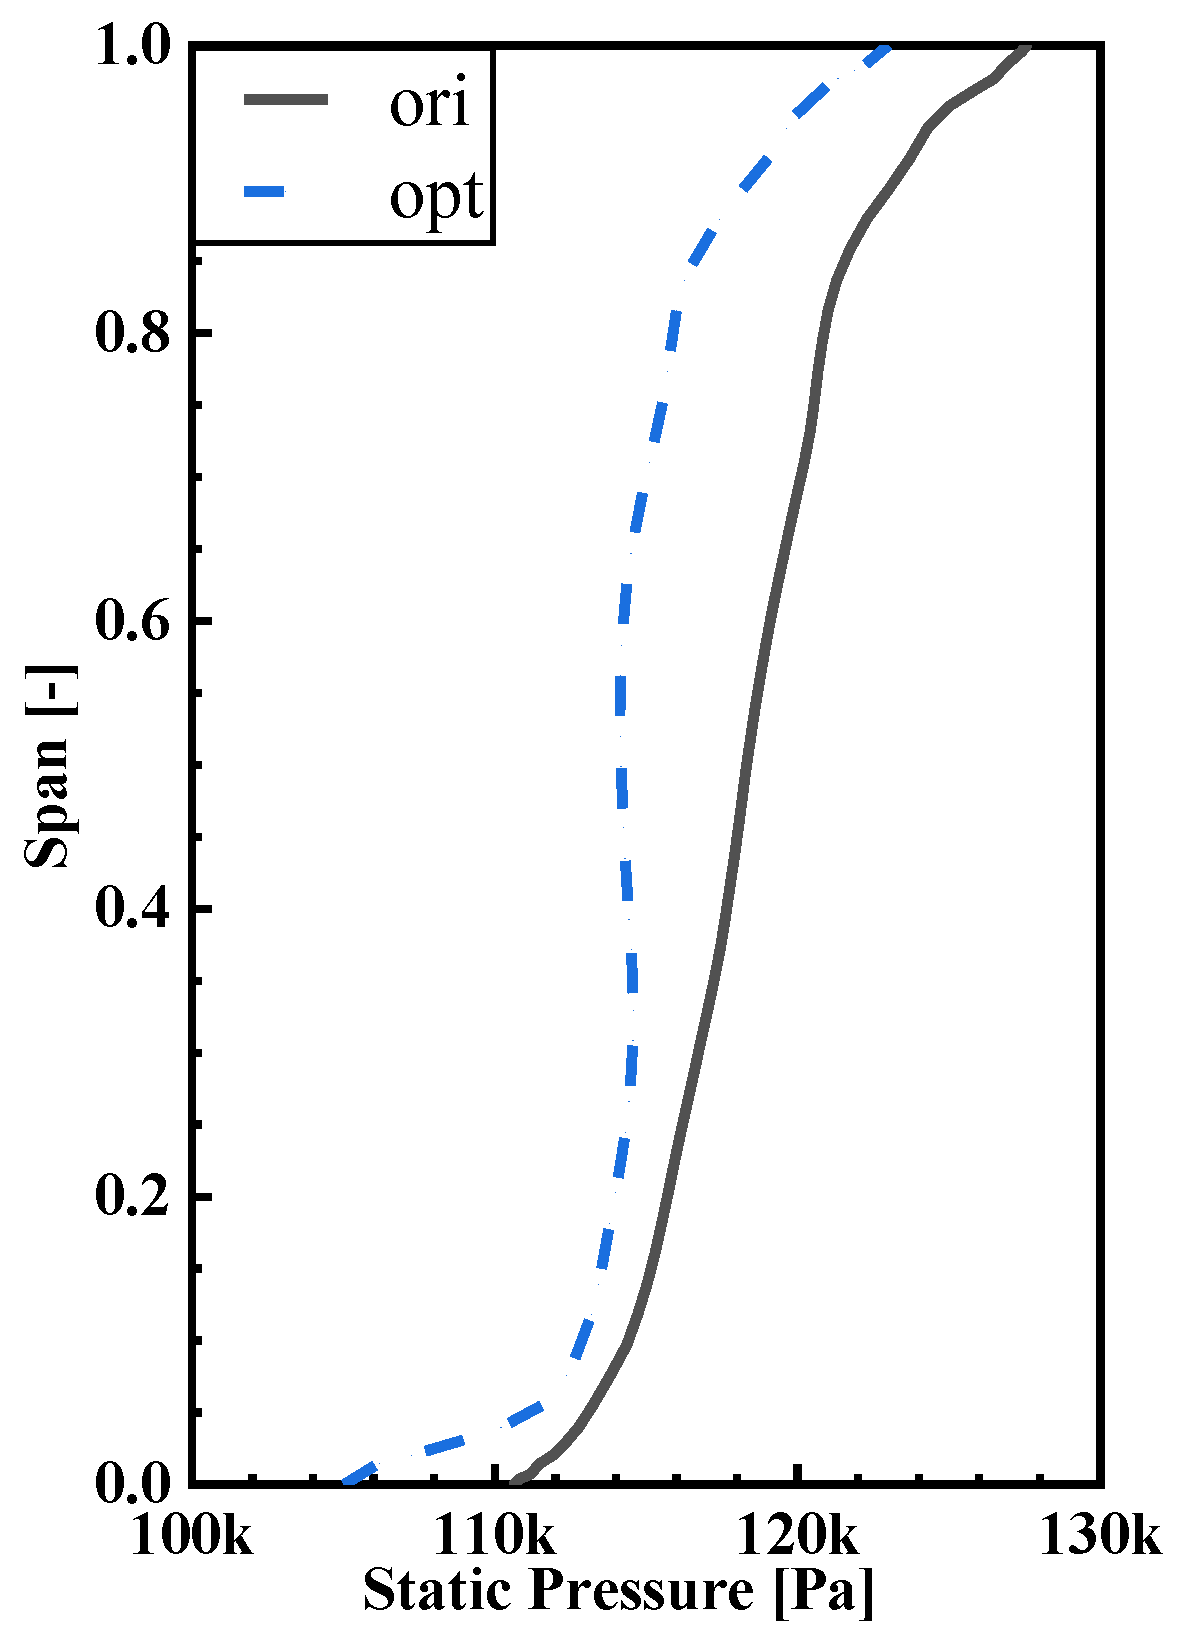
Figure 26 shows the spanwise distribution of stator static pressure at the rotor exit. The distribution of static pressure indicates that it remains nearly constant between 15% and 60% span, suggesting an imbalance in the load distribution of OPT at near stall condition. As a result, the flow will move upward under the action of centrifugal force, forming upwash.
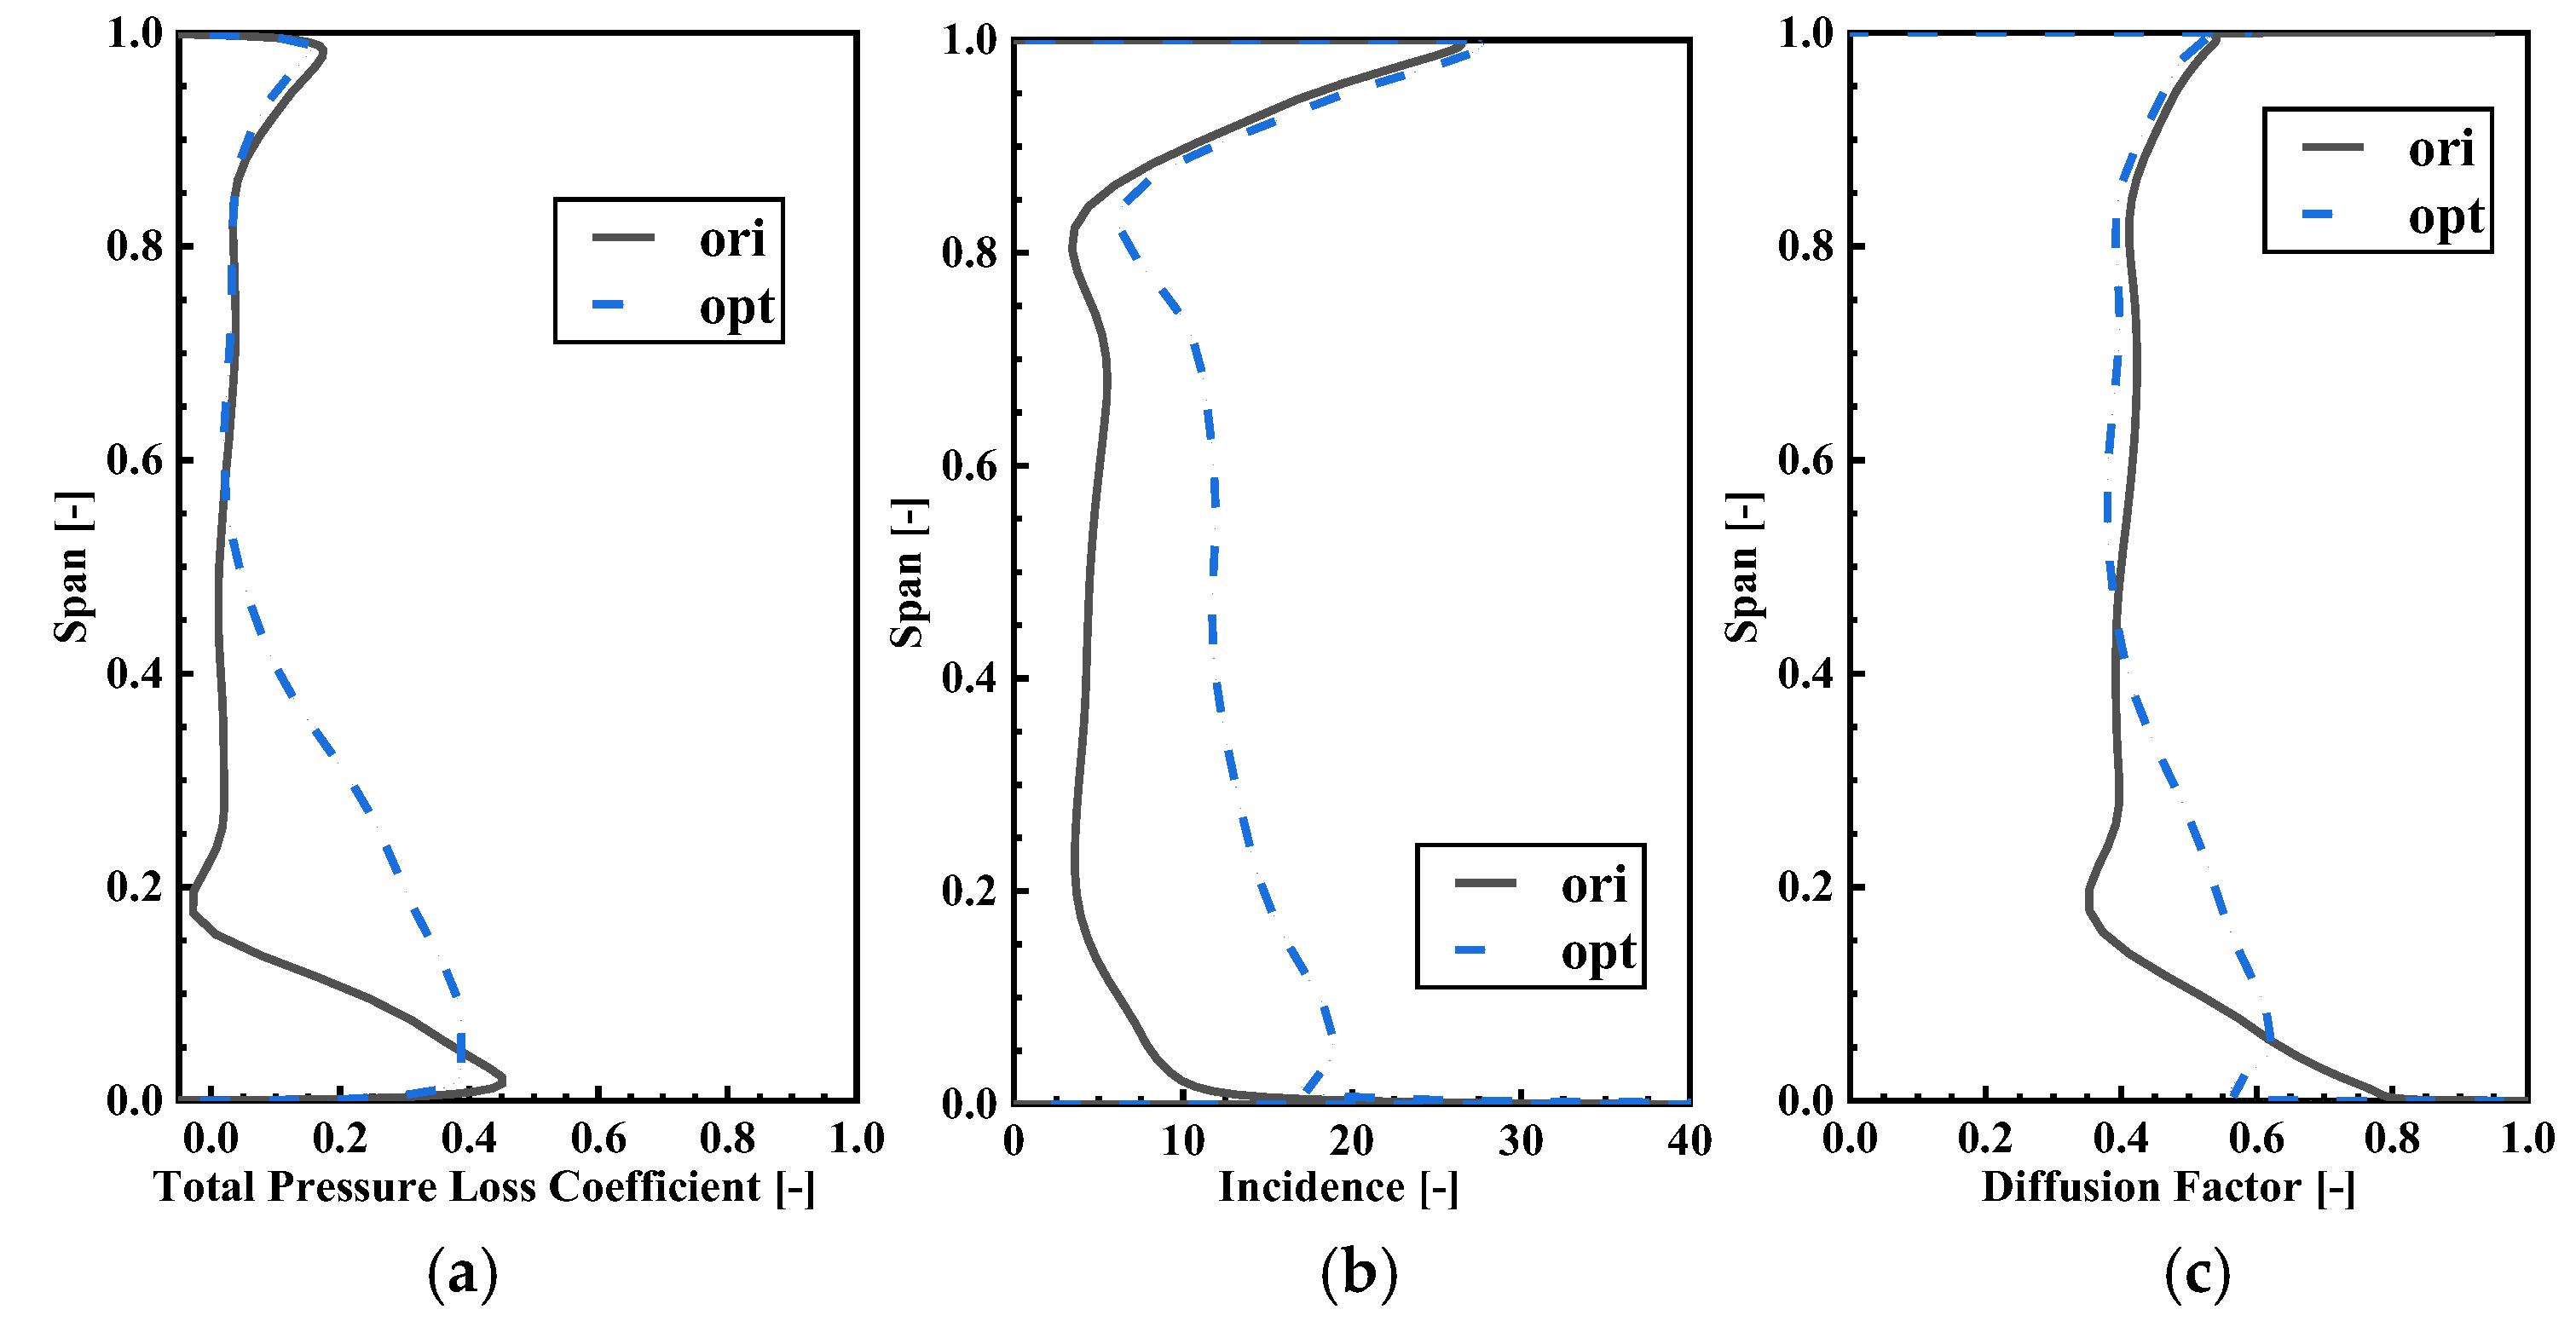
Figure 27 displays the spanwise distribution of the stator total pressure loss coefficient, incidence, and diffusion factor at near stall condition. The total pressure loss coefficient reveals that OPT has a larger total pressure loss below 50% span. The incidence distribution indicates that the incidence of OPT increases rapidly below 80% span. This is primarily due to the significant decrease in the stagger angle of the stator vane of OPT, especially around 15% span. Figure 27c shows that the diffusion factor of OPT is slightly lower than ORI above 50% span, while it is higher than ORI below 50% span. To explain the change in stator loading, a more detailed analysis of the flow field is required.
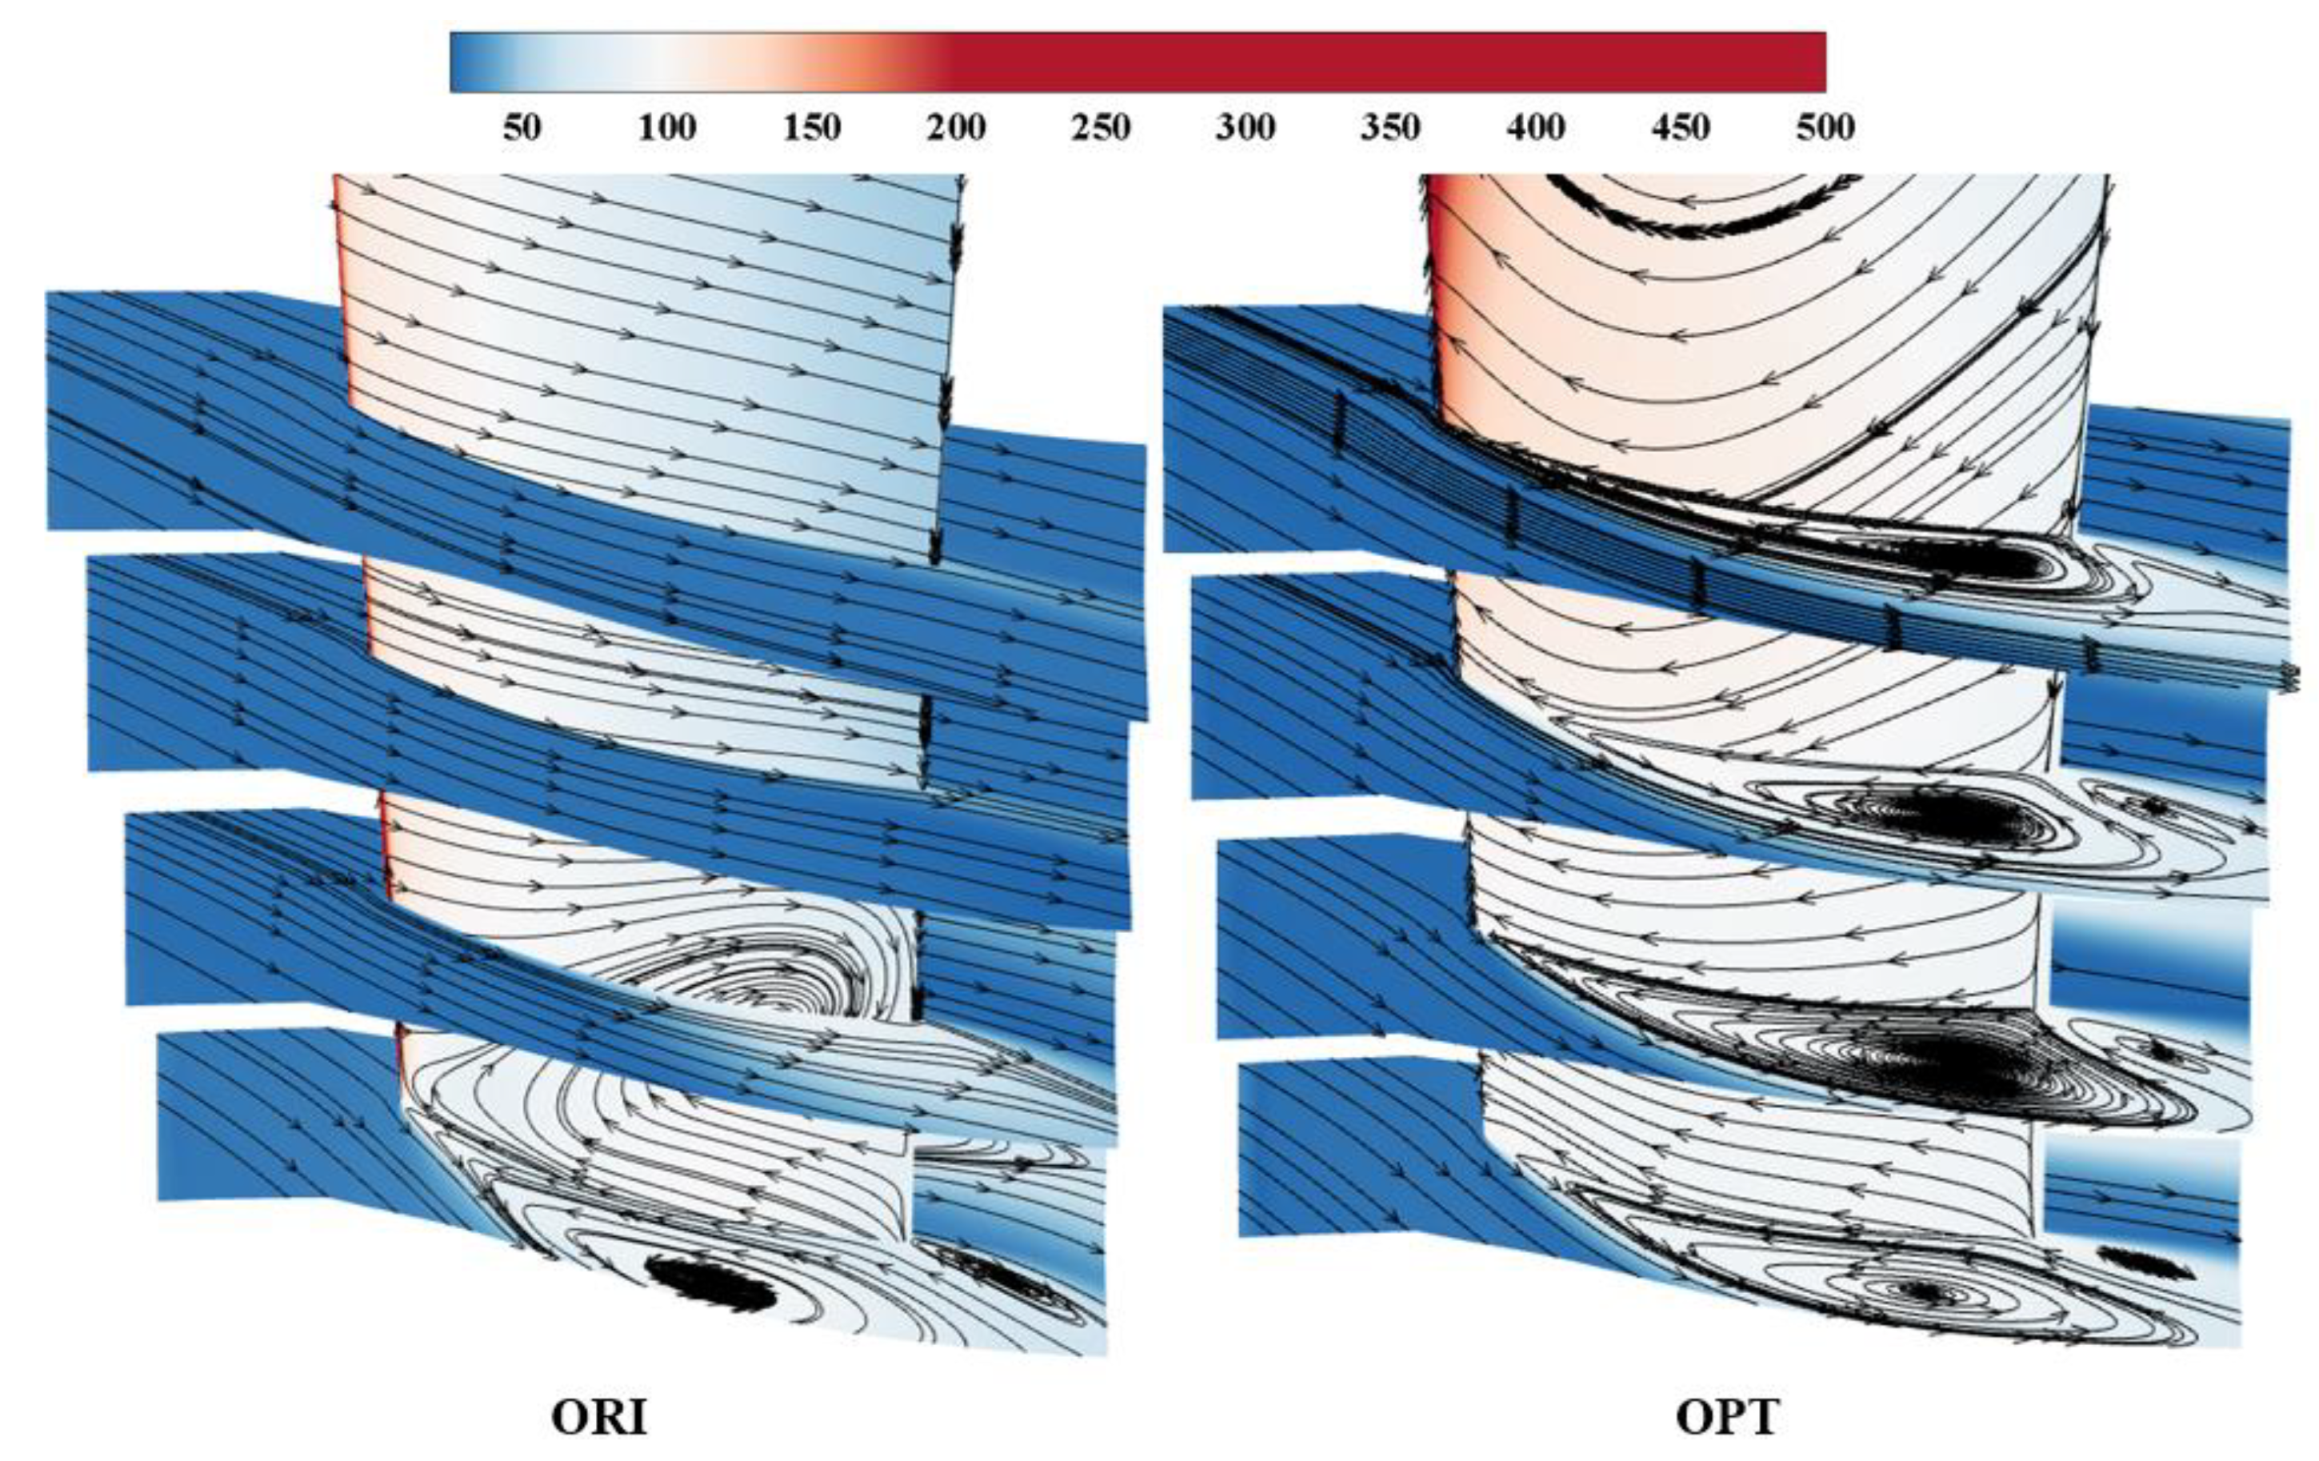
Figure 28 presents the entropy contour and limiting streamline of the suction surface of the stator vane at different span. The figure clearly illustrates that the root of the vane has severe corner separation, and the airflow separation range of OPT reaches 30% span. This observation suggests that the greater loss at the root of the stator is due to the serious corner separation at the stator root and the severe airflow separation on the suction surface of OPT below 40% span, which ultimately results in significant total pressure loss.
From Figure 27 and previous analysis, we can conclude that the stagger angle near the stator root of OPT is significantly reduced, causing the stator to operate at an incidence far beyond its normal range. This ultimately results in severe separation on the suction side of the blade, leading to decreased loads and increased losses.

5. Conclusions

In this study, a compressor aerodynamic design optimization platform, which incorporates a Non-Dominated Sorting Genetic Algorithm II (NSGA-II) and a Backpropagation Neural Network (BPNN) optimized by a Genetic Algorithm (GA) surrogate model, is developed and applied to optimize a 1.5-stage transonic compressor. The prototype compressor and optimized compressor with maximum efficiency are analyzed to assess the impact of the spanwise distributions of the stagger angles for three blade rows at the design condition and near stall condition. The primary findings are as follows:
(1)
Utilizing the stagger angle distribution of the three blade rows as the optimization variable, the optimization objective is successfully achieved, with minimal alterations via the compressor aerodynamic optimization platform. Consequently, the design mass flow of optimized compressor experiences a 7.1% increase, the total pressure ratio improves by 0.002, and the isentropic efficiency decreases by 0.0087 at the updated design condition. Simultaneously, the stall margin experiences a 1.8% increase.
(2)
At the design point, variations in stagger angle affect the tangential velocity of the rotor outlet, which, in turn, influences the load of the rotor blade. The inlet Mach number exerts a significant influence on the intensity of the shock wave and the shock wave/boundary layer interaction within the transonic rotor, rendering the inlet relative Mach number as the crucial factor impacting the isentropic efficiency of the rotor blade.
(3)
At near stall condition, the decline in compressor efficiency is primarily due to the combined effects of tip leakage, shockwave loss, and shock/boundary layer interference in the rotor passage. Additionally, the inlet incidence in the stator passage surpasses the normal range, causing corner separation in the blade. As the incidence continues to increase, the flow separation spreads radially, resulting in a substantial rise in the number of losses. These factors ultimately contribute to the deterioration of the compressor’s performance.
It should be clarified that the content presented in this paper forms only the first step in the redesign process of the gas turbine compressor inlet stage. Subsequent considerations will involve modifications to the subsequent stages and even matching with the turbine. Although the optimized compressor meets design requirements, there is still room for improvement. At the new design condition, the efficiency of the optimized compressor is lower than that of the original compressor. To further improve performance, blade design parameters (such as bending angle and suction surface profile) can be optimized. Additionally, the performance of the optimized compressor declines significantly under off-design conditions; therefore, this issue should be thoroughly considered in future studies pertaining to design optimization research.

Author Contributions

Conceptualization, X.L. and S.G.; methodology, X.L., Y.J. and S.L.; software, X.L., Y.J. and S.L.; validation, X.L., Y.J. and S.L.; formal analysis, X.L. and S.G.; investigation, X.L., Y.J. and S.L.; resources, X.L. and S.G.; data curation, X.L. and X.Z.; writing—original draft preparation, X.L. and S.L.; writing—review and editing, X.L. and S.G.; visualization, X.L.; supervision, S.G. and H.Z.; project administration, S.G. and H.Z.; funding acquisition, S.G. and H.Z. All authors have read and agreed to the published version of the manuscript.

Funding

This research was funded by National Science and Technology Major Project grant number [2017-II-0006-0020, 2017-II-0007-0021] and The APC was funded by [2017-II-0006-0020].

Data Availability Statement

Not applicable.

Acknowledgments

The authors gratefully acknowledge the support they received from the National Science and Technology Major Project (2017-II-0006-0020, 2017-II-0007-0021).

Conflicts of Interest

The authors declare no conflict of interests. The funders had no role in the design of the study; in the collection, analyses, or interpretation of data; in the writing of the manuscript; or in the decision to publish the results.

References

  1. Yang, L.S.; Zheng, P.Y.; Nie, H.G.; Zhu, M. Technology development approach discuss of high power and high efficiency marine gas turbine derived from aeroengine. Aeroengine 2013, 39, 74–78. [Google Scholar]
  2. Ren, L.X.; Li, D.; Wang, Q.; Wen, X.Y. Aerodynamic design of marine high power axial-compressor. J. Eng. Therm. Energy Power 2019, 34, 40–47. [Google Scholar]
  3. Biollo, R.; Benini, E. Recent advances in transonic axial compressor aerodynamics. Prog. Aerosp. Sci. 2013, 56, 1–18. [Google Scholar] [CrossRef]
  4. Lian, Y.S.; Oyama, A.; Liou, M.S. Progress in design optimization using evolutionary algorithms for aerodynamic problems. Prog. Aerosp. Sci. 2010, 46, 199–223. [Google Scholar] [CrossRef]
  5. Oyama, A.; Liou, M.S.; Obayashi, S. Transonic Axial-Flow Blade Shape Optimization Using Evolutionary Algorithm and Three-Dimensional Navier-Stoke Solver. In Proceedings of the 9th AIAA/ISSMO Symposium on Multidisciplinary Analysis and Optimization, AIAA, Atlanta, GA, USA, 4–6 September 2002. [Google Scholar]
  6. Benini, E. Three-dimensional multi-objective design optimization of a transonic compressor rotor. J. Propuls. Power 2004, 20, 559–565. [Google Scholar] [CrossRef]
  7. Gaspar-Cunha, A.; Covas, J.A. Robustness in multi-objective optimization using evolutionary algorithms. Comput. Optim. Appl. 2008, 39, 75–79. [Google Scholar]
  8. Lian, Y.S.; Liou, M.S. Aerostructural optimization of a transonic compressor rotor. J. Propuls. Power 2006, 22, 880–888. [Google Scholar] [CrossRef] [Green Version]
  9. Razavi, S.R.; Sammak, S.; Boroomand, M. Multidisciplinary design and optimizations of swept and leaned transonic rotor. J. Eng. Gas Turbine Power 2017, 139, 122601. [Google Scholar] [CrossRef]
  10. Wang, X.D.; Hirsch, C.; Kang, S.; Lacor, C. Multi-objective optimization of turbomachinery using improved NSGA-II and approximation model. Comput. Methods Appl. Mech. Eng. 2011, 200, 883–895. [Google Scholar] [CrossRef]
  11. Li, D.; Lu, H.A.; Yang, Z.; Pan, T.Y.; Du, H.; Li, Q.S. Optimization of a transonic axial-flow compressor under inlet total pressure distortion to enhance aerodynamic performance. Eng. Appl. Comput. Fluid Mech. 2020, 14, 1002–1022. [Google Scholar]
  12. Liu, S.P.; Geng, S.J.; Li, X.L.; Jin, Y.; Zhang, H.W. Optimization Design of Aspect Ratio and Solidity of a Heavy-Duty Gas Turbine Transonic Compressor Rotor. Machines 2023, 11, 82. [Google Scholar] [CrossRef]
  13. Meo, R.D.; D’Ercole, M.; Russo, A.; Gamberi, F.; Gravame, F.; Mucz, D. PGT25+ G4 gas turbine development, validation and operating experience. In Proceedings of the Turbo Expo: Power for Land, Sea, and Air, Berlin, Germany, 9–13 June 2008; pp. 529–538. [Google Scholar]
  14. Jing, Q. Application of LM2500 + G4 gas turbine in distributed energy system. Huadian Technol. 2013, 35, 14–15. [Google Scholar]
  15. NUMECA/AutoGrid5. Numeca International. Available online: https://www.numeca.com/product/autogrid5 (accessed on 1 June 2019).
  16. NUMECA/Fine/Turbo. Numeca International. Available online: https://www.numeca.com/product/fineturbo (accessed on 1 June 2019).
  17. NUMECA/Autoblade. Numeca International. Available online: https://www.numeca.com/product/autoblade (accessed on 1 June 2019).
  18. Rumelhart, D.E.; Widrow, B.; Lehr, M.A. The basic ideas in neural networks. Commun. ACM 1994, 37, 87–93. [Google Scholar] [CrossRef]
  19. Deb, K.; Pratap, A.; Agarwal, S.; Meyarivan, T. A fast and elitist multiobjective genetic algorithm: NSGA-II. IEEE T. Evolut. Comput. 2002, 6, 182–197. [Google Scholar] [CrossRef] [Green Version]
Figure 1. Grid independence verification.
Machines 11 00631 g001
Figure 2. Computation domain and grid mesh.
Machines 11 00631 g002
Figure 3. Comparison of calculation and test results for a reduced-scale 1.5-stage transonic compressor.
Machines 11 00631 g003
Figure 4. Results of blade parameterization.
Machines 11 00631 g004
Figure 5. Performance curves of 1.5 stage transonic compressor for prototype and parameterization.
Machines 11 00631 g005
Figure 6. Spanwise distribution of stagger angle for three blade rows.
Machines 11 00631 g006
Figure 7. Flow chart of aerodynamic optimization.
Machines 11 00631 g007
Figure 8. Error distribution of neural network repeated training.
Machines 11 00631 g008
Figure 9. Neural network structure diagram.
Machines 11 00631 g009
Figure 10. Distribution of optimized sample and Pareto front: (a) isentropic efficiency—stall margin; (b) total pressure ratio—isentropic efficiency.
Machines 11 00631 g010
Figure 11. Performance curves of prototype and optimized 1.5 stage transonic compressor.
Machines 11 00631 g011
Figure 12. Spanwise distribution of stagger angle for prototype and optimized compressor.
Machines 11 00631 g012
Figure 13. Spanwise distribution of aerodynamic parameters at rotor outlet.
Machines 11 00631 g013
Figure 14. Velocity triangle diagram of three span of rotor inlet.
Machines 11 00631 g014
Figure 15. Spanwise distribution of inlet incidence, tangential velocity, and load coefficient at rotor domain: (a) incidence; (b) tangential velocity; (c) load coefficient.
Machines 11 00631 g015
Figure 16. Total pressure loss coefficient of three blade rows at design condition.
Machines 11 00631 g016
Figure 17. Distribution of isentropic Mach number on blade surface at different span.
Machines 11 00631 g017
Figure 18. Isentropic Mach number contour and limiting streamline on suction surface of rotor blade.
Machines 11 00631 g018
Figure 19. Spanwise distribution of inlet absolute Mach number, total pressure loss coefficient, and diffusion factor of stator blade at design condition: (a) inlet absolute Mach number; (b) total pressure loss coefficient; (c) diffusion factor.
Machines 11 00631 g019
Figure 20. Isentropic Mach number contour and limiting streamlines of stator suction surface.
Machines 11 00631 g020
Figure 21. Total pressure loss coefficient of three blade rows at near stall condition.
Machines 11 00631 g021
Figure 22. Spanwise distribution of aerodynamic parameters at rotor outlet at near stall condition.
Machines 11 00631 g022
Figure 23. Spanwise distribution of incidence, relative Mach number, and axial velocity at rotor inlet at near stall condition: (a) incidence; (b) relative Mach number; (c) axial velocity.
Machines 11 00631 g023
Figure 24. Streamwise Entropy contour of rotor tip region at near stall condition.
Machines 11 00631 g024
Figure 25. Isentropic Mach number contour and limiting streamline on suction surface of rotor blade at near stall condition.
Machines 11 00631 g025
Figure 26. Spanwise distribution of static pressure at rotor outlet.
Machines 11 00631 g026
Figure 27. Spanwise distribution of total pressure loss coefficient, incidence, and diffusion factor of stator blade at near stall condition: (a) total pressure loss coefficient; (b) incidence; (c) diffusion factor.
Machines 11 00631 g027
Figure 28. Entropy contour and limiting streamlines on stator suction surface and streamlines at different blade span.
Machines 11 00631 g028
Table 1. Design parameters of 1.5-stage transonic compressor.
Number of BladeHub-Tip-RatioSolidityAspect Ratio
IGV420.391.045.54
Rotor160.371.581.4
Stator400.441.284.2
Table 2. Key performance parameters of prototype and optimized 1.5 stage transonic compressor at design point.
Total Pressure RatioIsentropic EfficiencyStall Margin
ORI1.4400.886722.4%
OPT1.4420.878024.2%
Disclaimer/Publisher’s Note: The statements, opinions and data contained in all publications are solely those of the individual author(s) and contributor(s) and not of MDPI and/or the editor(s). MDPI and/or the editor(s) disclaim responsibility for any injury to people or property resulting from any ideas, methods, instructions or products referred to in the content.

