
Leading-Edge Erosion and Floating Particles: Stagnation Point Simulation in Particle-Laden Turbulent Flow via Lagrangian Particle Tracking


Abstract
:1. Introduction
2. Methods
2.1. Theory
2.2. Turbulent Flow Characterizations
2.3. Stokes Number
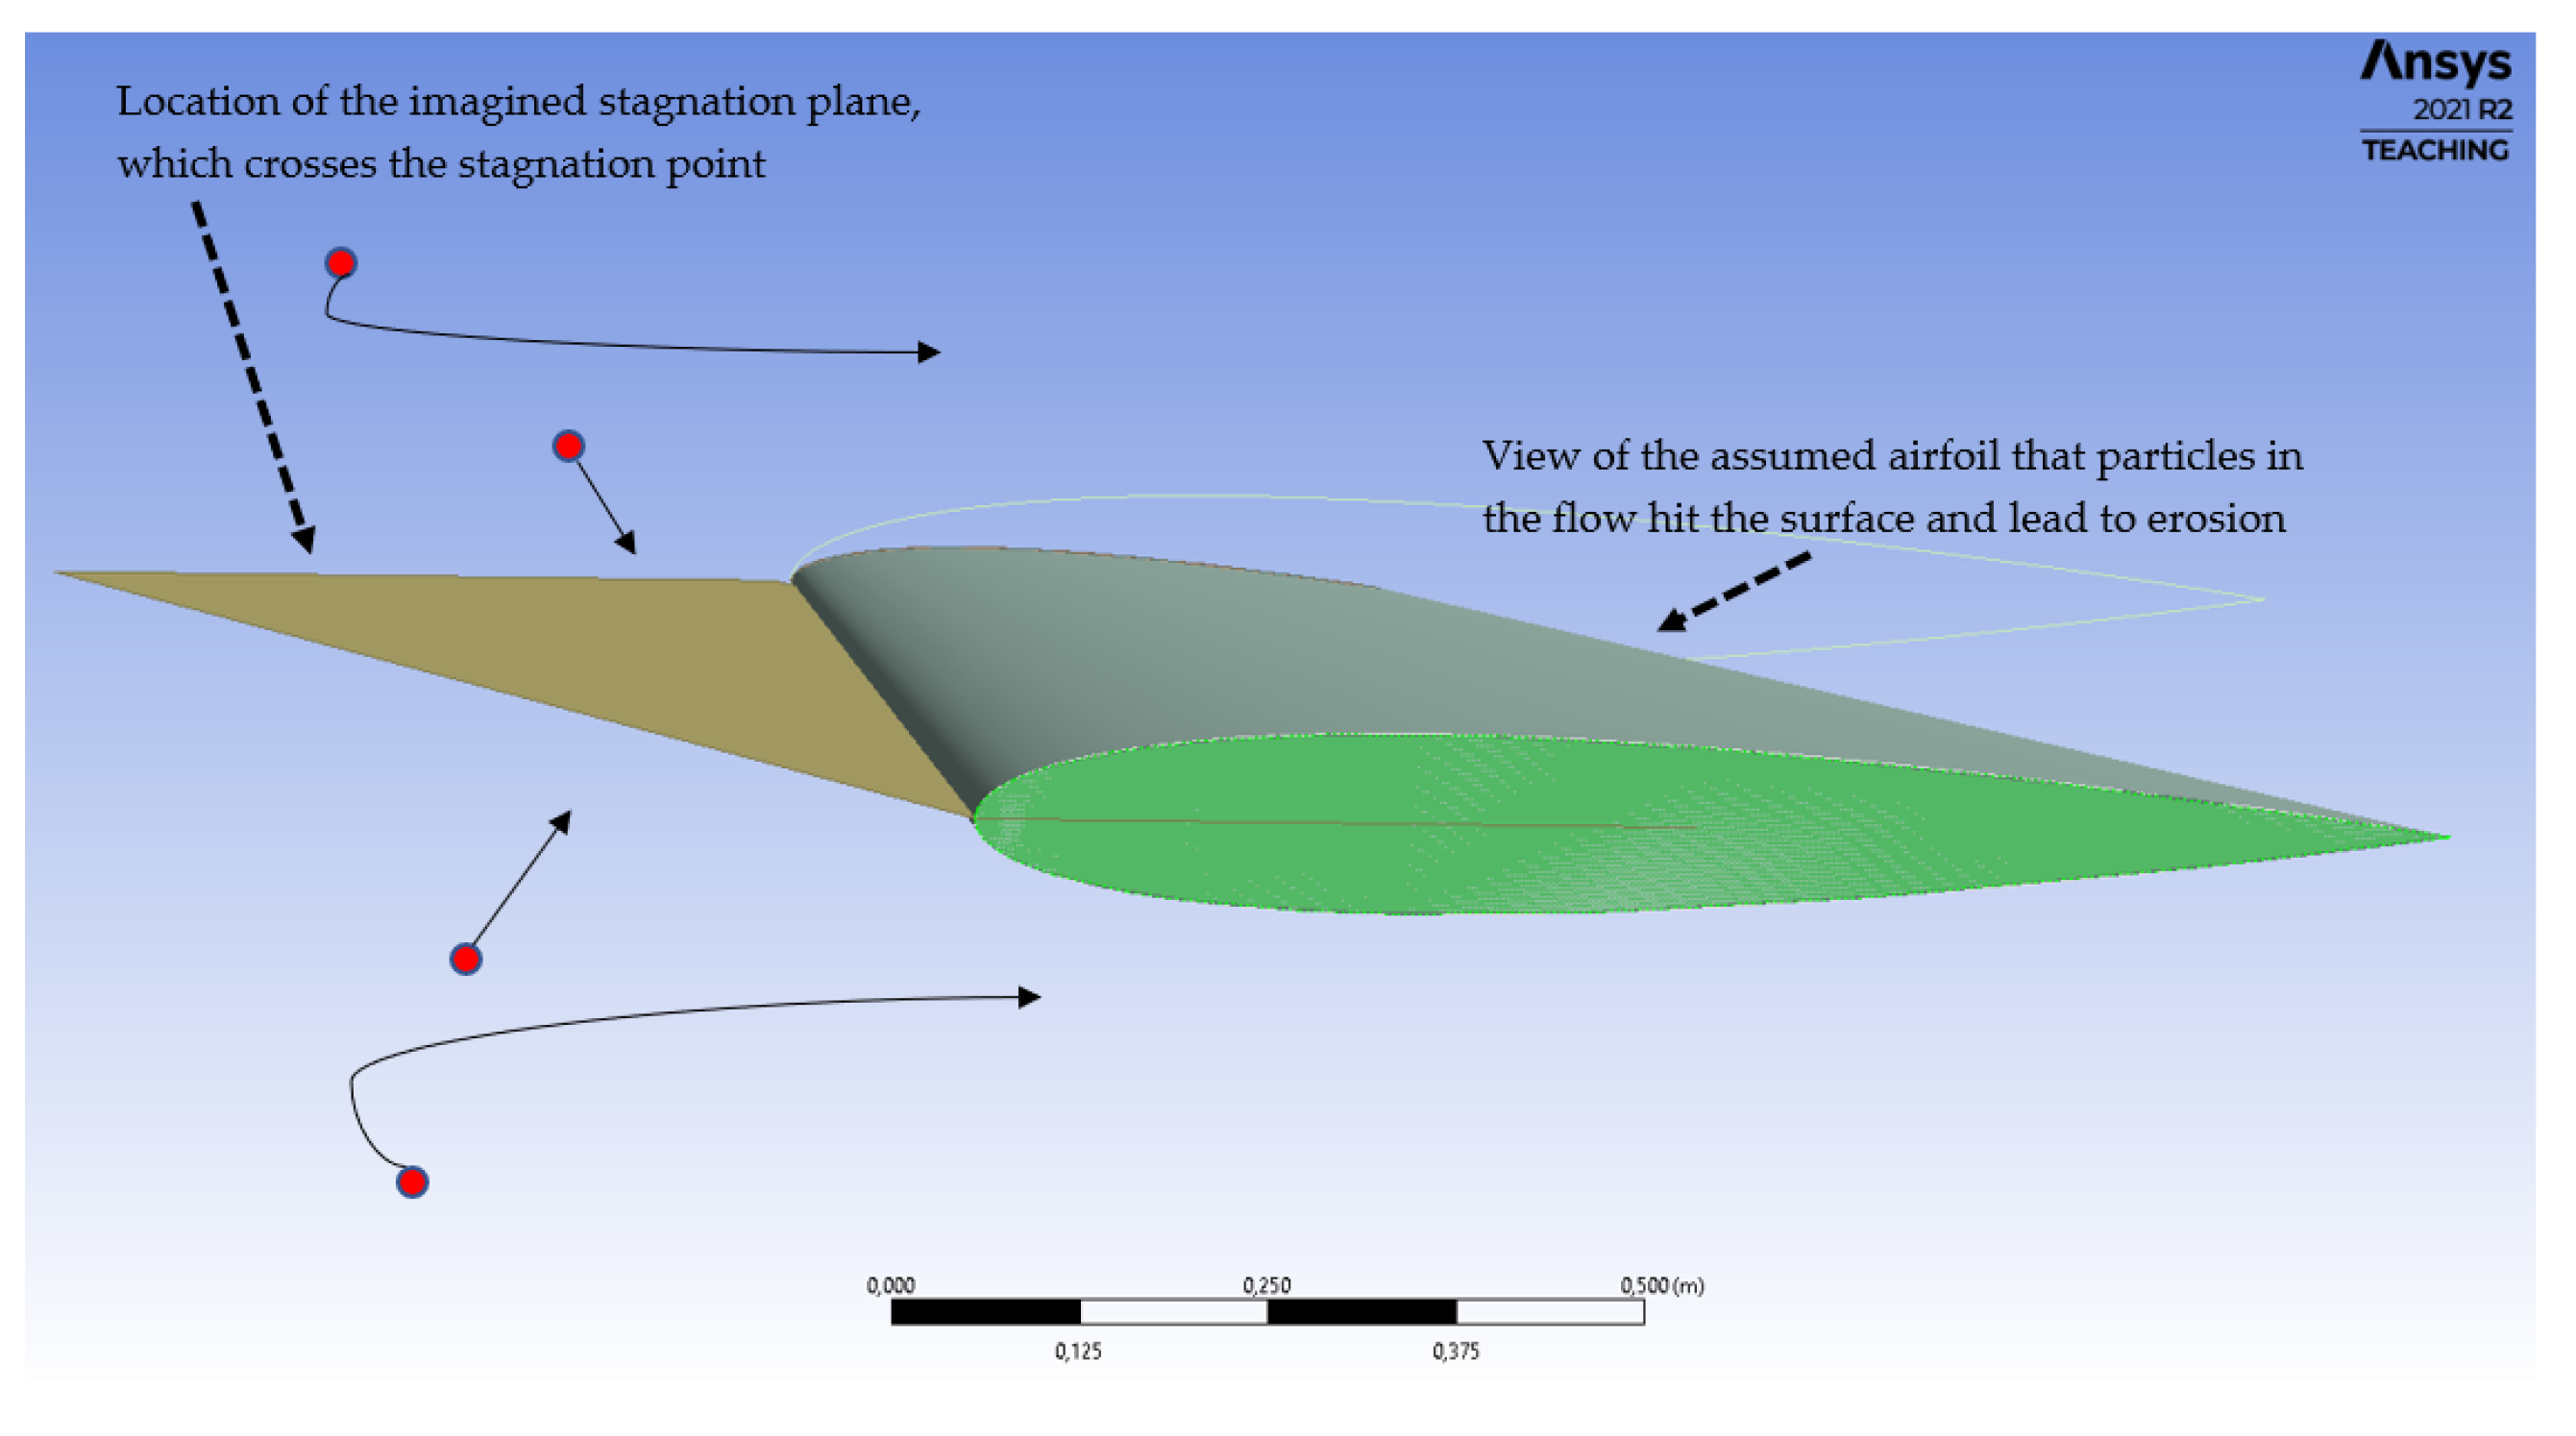
2.4. Stagnation Plane Definition
- In the Lagrangian particle tracking method (LPT), the path line of each particle can be followed from the time it entered the study area to the time it left.
- When particles encircle the streamlined body, two-particle states can be observed; the particles either pass the stagnation plane or continue their path without crossing the stagnation plane.
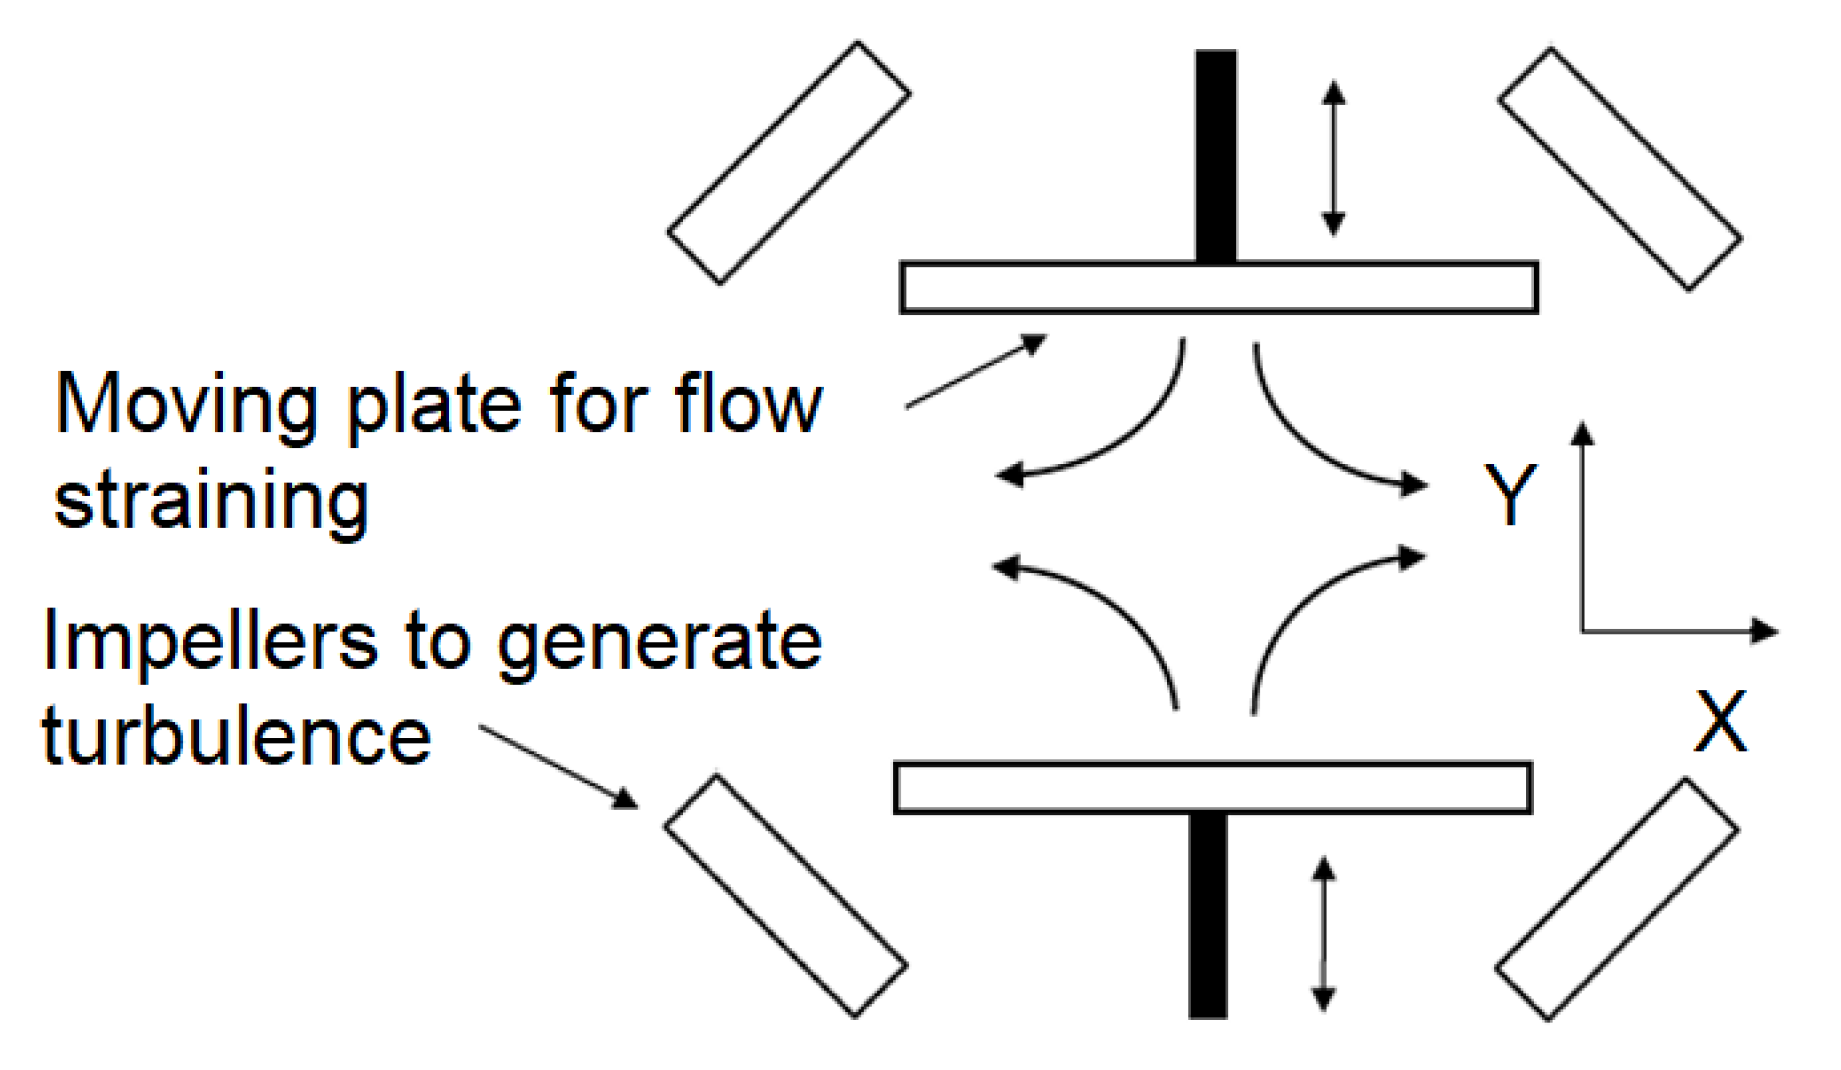
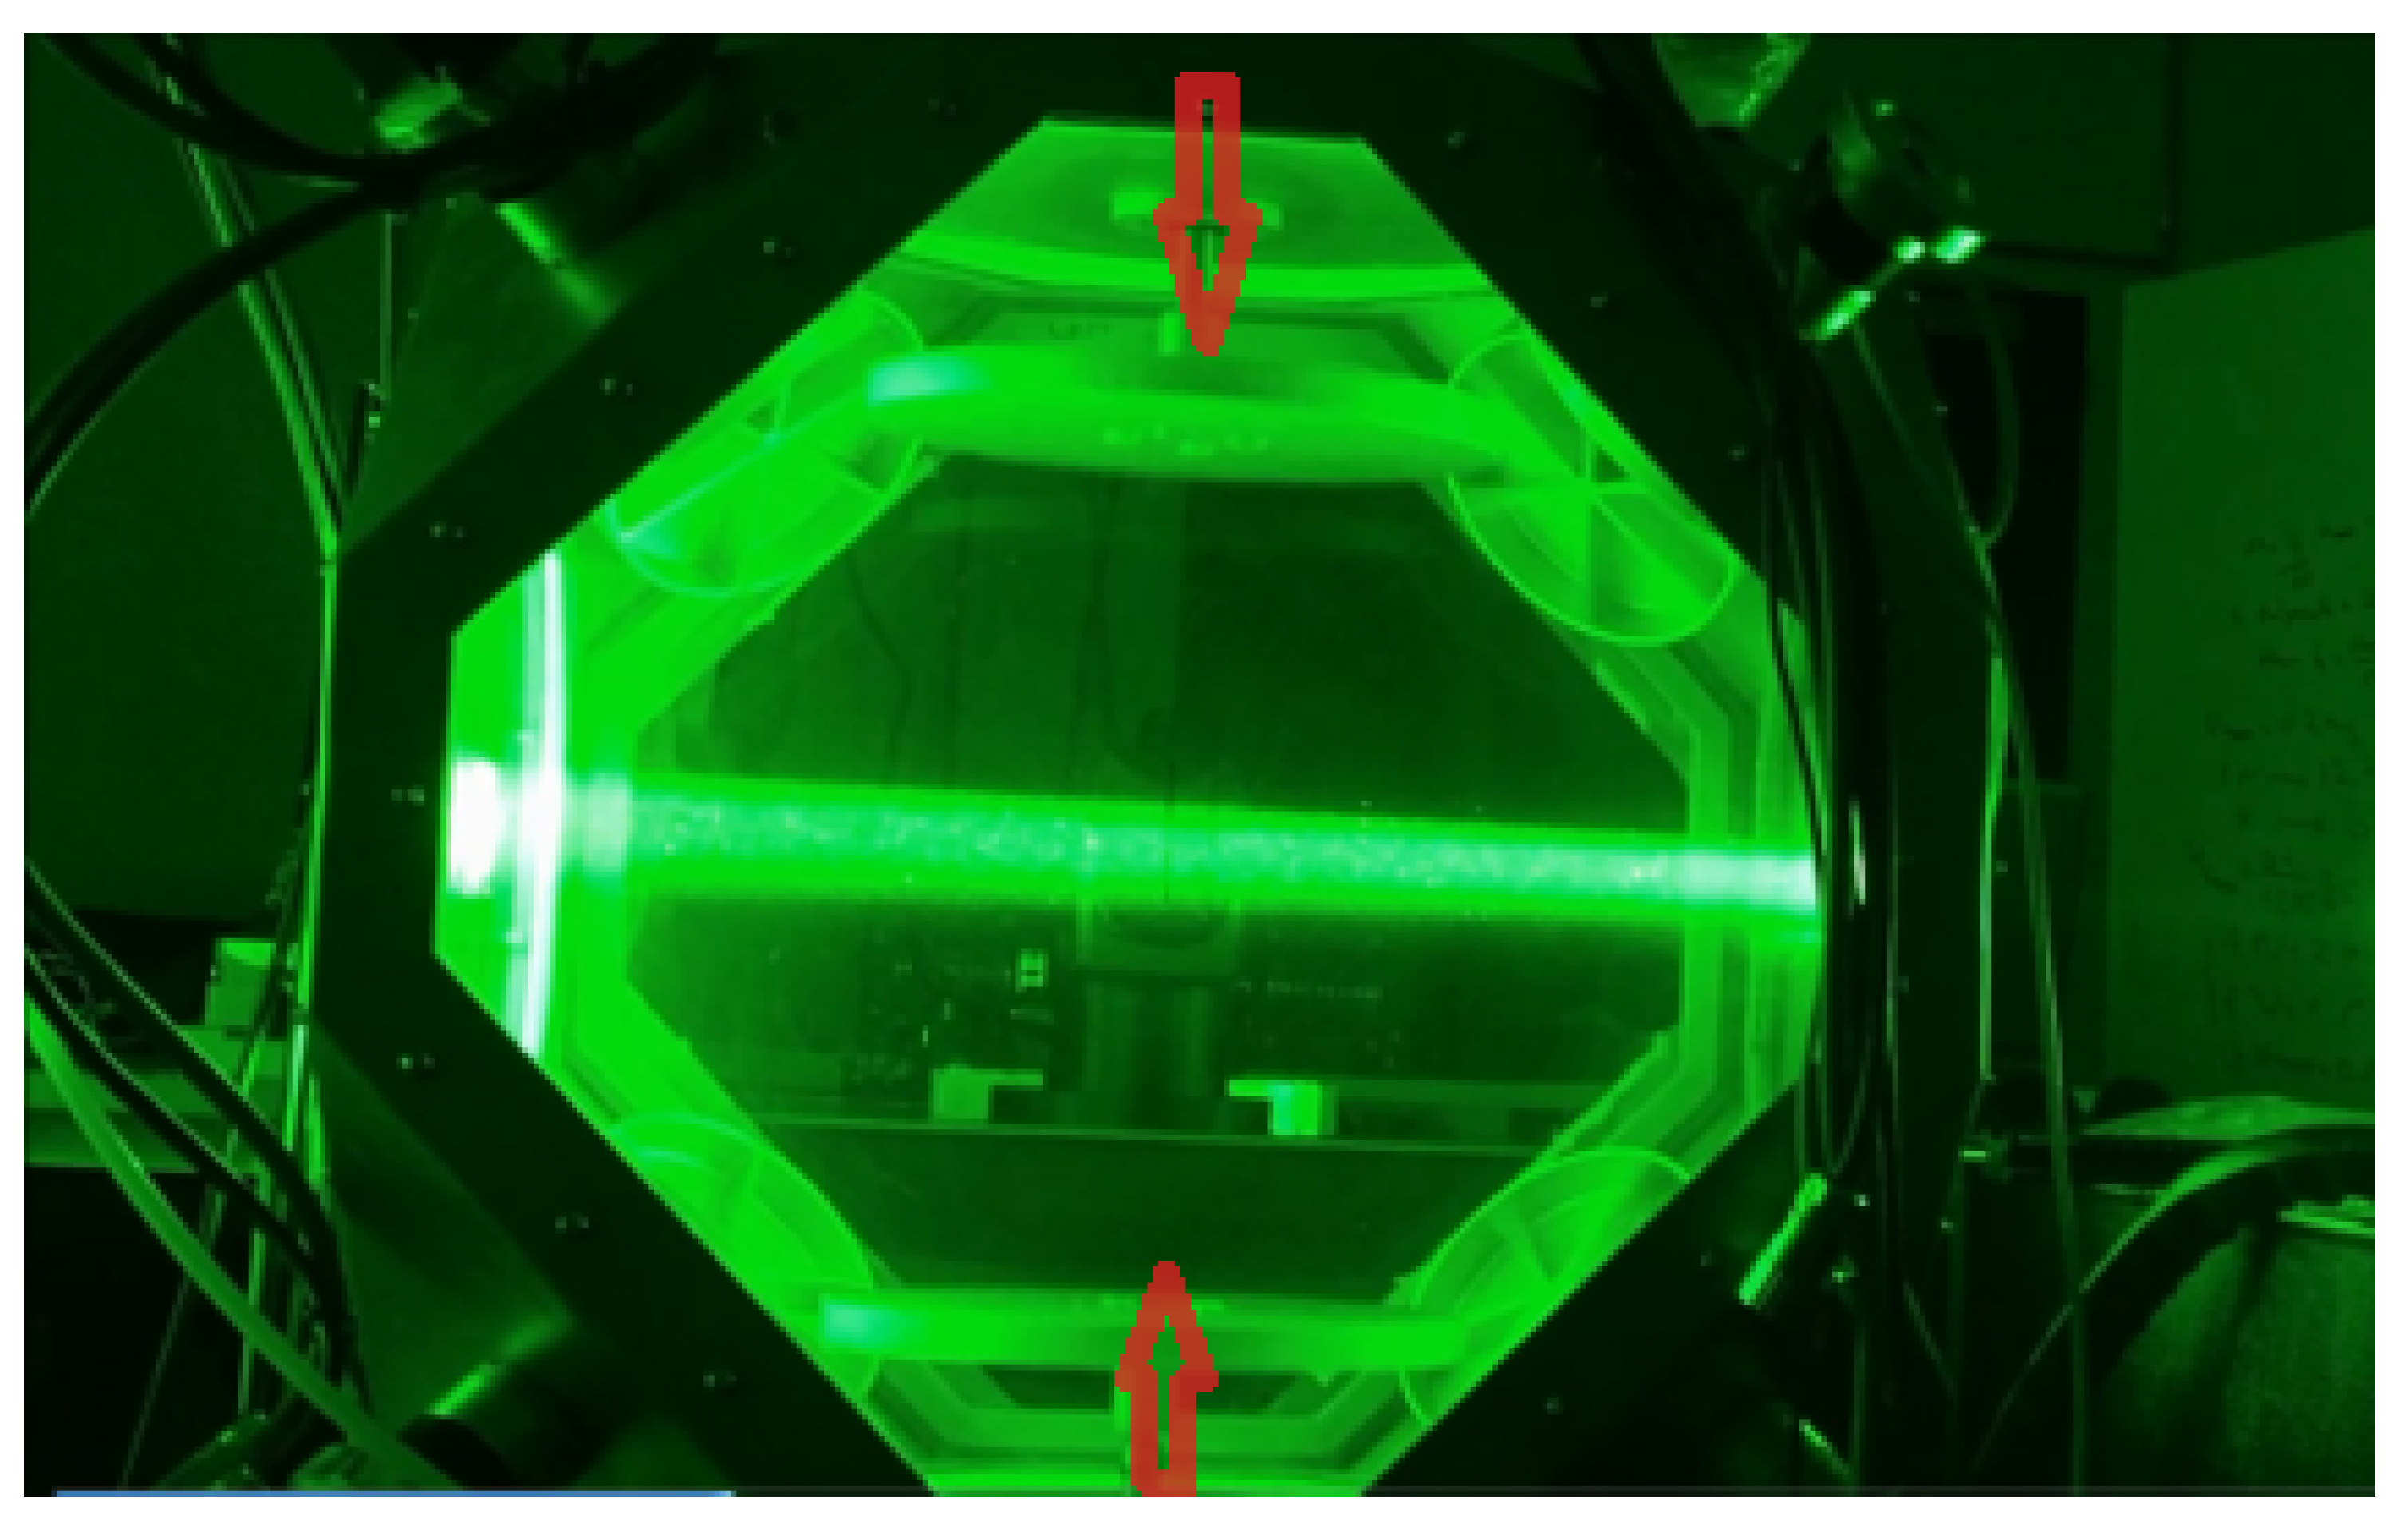
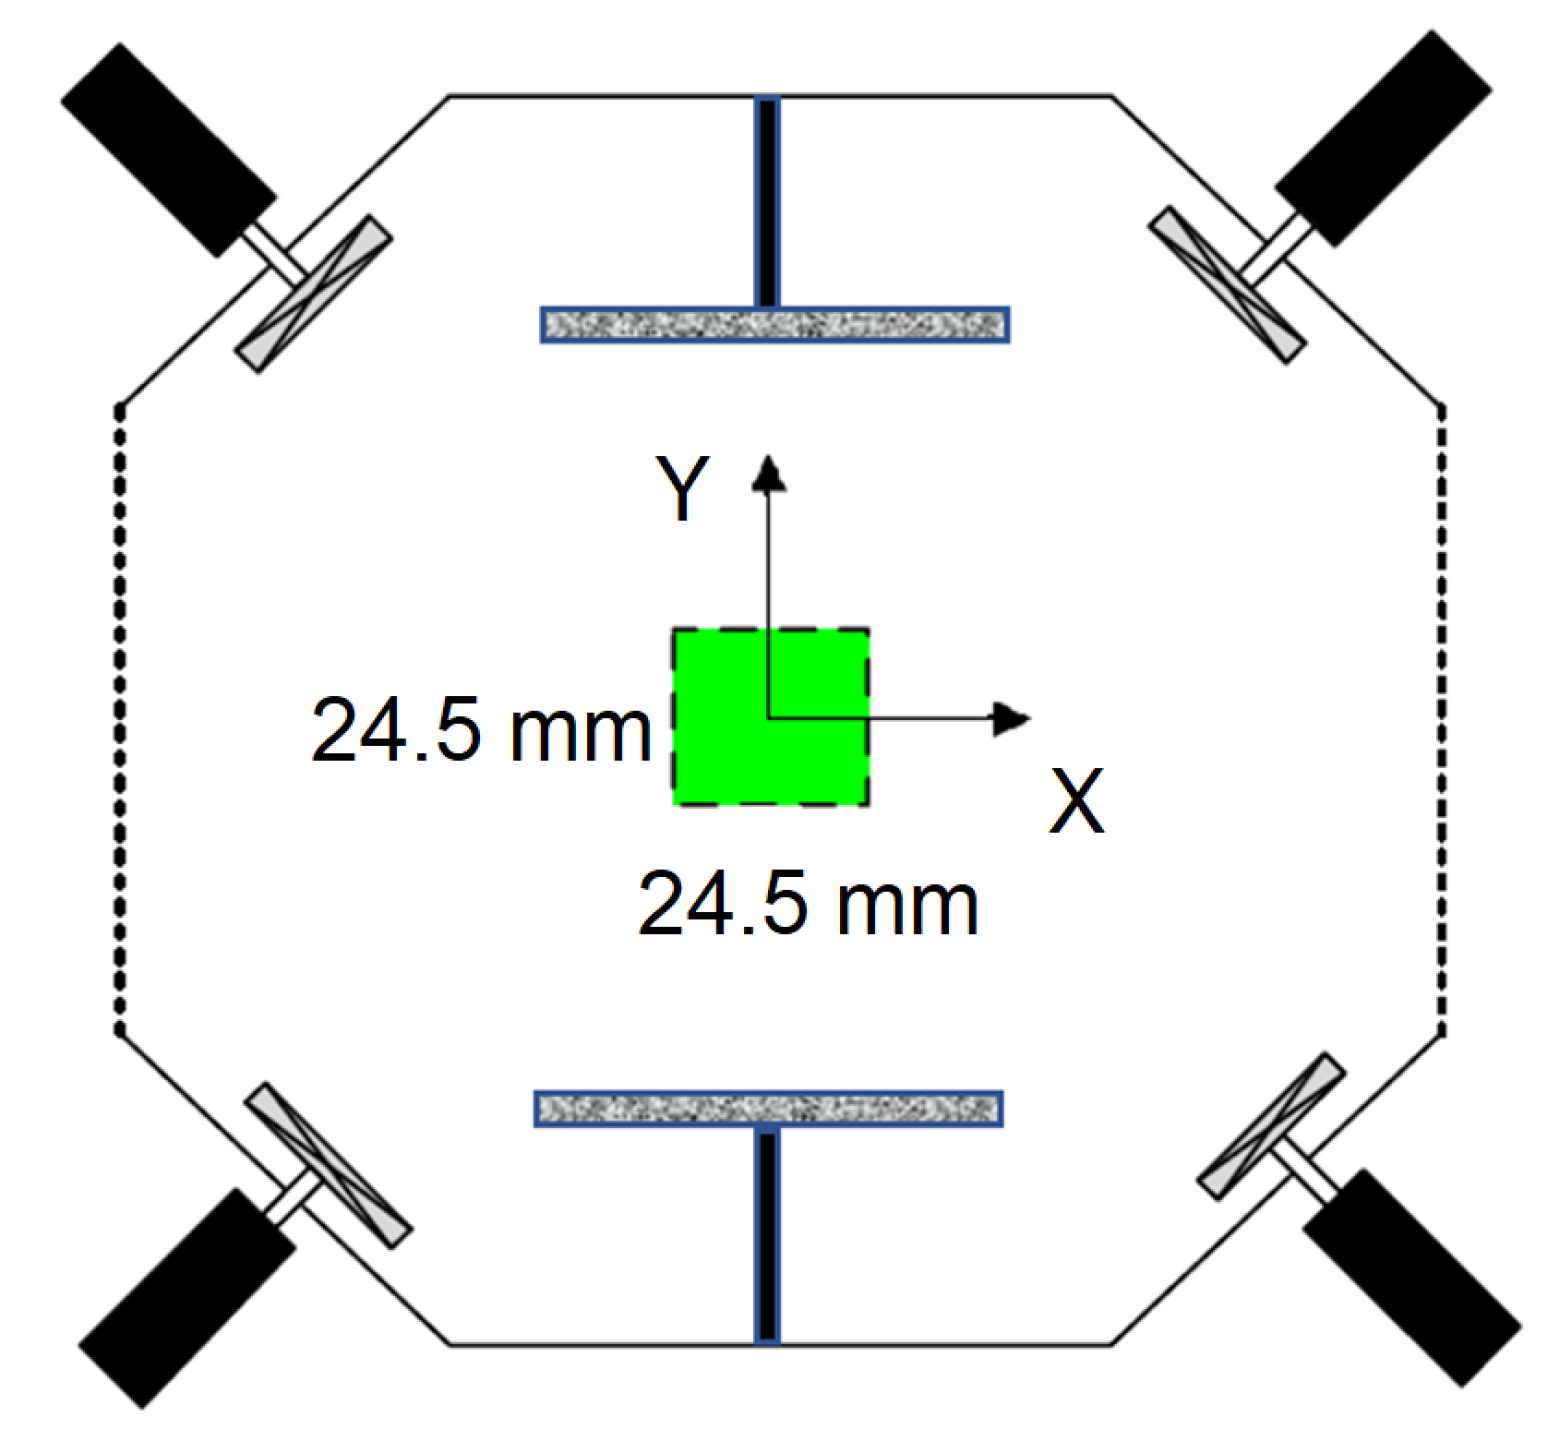
3. Apparatus
4. Results and Discussion
4.1. Particle Characterization
4.2. Particle Leading to Erosion and Stagnation Plane
4.3. Erosion Caused by Turbulence and Flow Strain
5. Conclusions
Author Contributions
Funding
Institutional Review Board Statement
Informed Consent Statement
Data Availability Statement
Acknowledgments
Conflicts of Interest
Abbreviations
| LPT | Lagrangian Particle Tracking |
| PTV | Particle Tracking Velocimetry |
| PIV | Particle Image Velocimetry |
References
- Schramm, M.; Rahimi, H.; Stoevesandt, B.; Tangager, K. The Influence of Eroded Blades on Wind Turbine Performance Using Numerical Simulations. Energies 2017, 10, 1420. [Google Scholar] [CrossRef]
- Herring, R.; Dyer, K.; Martin, F.; Ward, C. The increasing importance of leading edge erosion and a review of existing protection solutions. Renew. Sustain. Energy Rev. 2019, 115, 109382. [Google Scholar] [CrossRef]
- Bonu, V.; Jeevitha, M.; Praveen Kumar, V.; Srinivas, G.; Siju; Barshilia, H.C. Solid particle erosion and corrosion resistance performance of nanolayered multilayered Ti/TiN and TiAl/TiAlN coatings deposited on Ti6Al4V substrates. Surf. Coat. Technol. 2020, 387, 125531. [Google Scholar] [CrossRef]
- Bonu, V.; Jeevitha, M.; Praveen Kumar, V.; Barshilia, H.C. Nanolayered multilayer Ti/TiN coatings: Role of bi-layer thickness and annealing on solid particle erosion behaviour at elevated temperature. Surf. Coat. Technol. 2019, 357, 204–211. [Google Scholar] [CrossRef]
- Ahmad, M. An Overview of Droplet Impact Erosion, Related Theory and Protection Measures in Steam Turbines. In Cavitation; Borek, W., Tański, T., Król, M., Eds.; IntechOpen: Rijeka, Croatia, 2018. [Google Scholar] [CrossRef]
- Brandes, T.; Koch, C.; Staudacher, S. Estimation of Aircraft Engine Flight Mission Severity Caused by Erosion. J. Turbomach. 2021, 143, 111001. [Google Scholar] [CrossRef]
- Lorenz, M.; Klein, M.; Hartmann, J.; Koch, C.; Staudacher, S. Prediction of Compressor Blade Erosion Experiments in a Cascade Based on Flat Plate Specimen. Front. Mech. Eng. 2022, 8, 925395. [Google Scholar] [CrossRef]
- Sallee, G.P. Performance Deterioration Based on Existing (Historical) Data; JT9D Jet Engine Diagnostics Program; Contractor Report (CR) CR-135448; NASA, Pratt & Whitney Aircraft Group: Cleveland, OH, USA, 1987. [Google Scholar]
- Grant, G.; Tabakoff, W. Erosion Prediction in Turbomachinery Resulting from Environmental Solid Particles. J. Aircr. 1975, 12, 471–478. [Google Scholar] [CrossRef]
- Balan, C.; Tabakoff, W. Axial flow compressor performance deterioration. In Proceedings of the 20th Joint Propulsion Conference, Cincinnati, OH, USA, 11–13 June 1984. [Google Scholar] [CrossRef]
- Ghenaiet, A. Study of Sand Particle Trajectories and Erosion Into the First Compression Stage of a Turbofan. J. Turbomach. 2012, 134, 051025. [Google Scholar] [CrossRef]
- Bons, J.P.; Prenter, R.; Whitaker, S. A Simple Physics-Based Model for Particle Rebound and Deposition in Turbomachinery. J. Turbomach. 2017, 139, 081009. [Google Scholar] [CrossRef]
- Sommerfeld, H.; Koch, C.; Schwarz, A.; Beck, A. High velocity measurements of particle rebound characteristics under erosive conditions of high pressure compressors. Wear 2021, 470–471, 203626. [Google Scholar] [CrossRef]
- Kopper, P.; Beck, A.; Ortwein, P.; Krais, N.; Kempf, D.; Koch, C. High-order large eddy simulation of particle-laden flow in a T106C low-pressure turbine linear cascade. In Proceedings of the 8th European Conference for Aeronautics and Space Sciences, Madrid, Spain, 1–4 July 2019. [Google Scholar] [CrossRef]
- Vimalakanthan, K.; van der Mijle Meijer, H.; Bakhmet, I.; Schepers, G. Computational fluid dynamics (CFD) modeling of actual eroded wind turbine blades. Wind Energy Sci. 2023, 8, 41–69. [Google Scholar] [CrossRef]
- Law, H.; Koutsos, V. Leading edge erosion of wind turbines: Effect of solid airborne particles and rain on operational wind farms. Wind Energy 2020, 23, 1955–1965. [Google Scholar] [CrossRef]
- Pryor, S.C.; Barthelmie, R.J.; Cadence, J.; Dellwik, E.; Hasager, C.B.; Kral, S.T.; Reuder, J.; Rodgers, M.; Veraart, M. Atmospheric Drivers of Wind Turbine Blade Leading Edge Erosion: Review and Recommendations for Future Research. Energies 2022, 15, 8553. [Google Scholar] [CrossRef]
- López, J.C.; Kolios, A.; Wang, L.; Chiachio, M. A wind turbine blade leading edge rain erosion computational framework. Renew. Energy 2023, 203, 131–141. [Google Scholar] [CrossRef]
- Li, D.; Zhao, Z.; Li, Y.; Wang, Q.; Li, R.; Li, Y. Effects of the particle Stokes number on wind turbine airfoil erosion. Appl. Math. Mech. 2018, 39, 639–652. [Google Scholar] [CrossRef]
- Lee, C.M.; Gylfason, Á.; Perlekar, P.; Toschi, F. Inertial particle acceleration in strained turbulence. J. Fluid Mech. 2015, 785, 31–53. [Google Scholar] [CrossRef]
- Hassanian, R. An Experimental Study of Inertial Particles in Deforming Turbulence Flow, in Context to Loitering of Blades in Wind Turbines. Doctoral Dissertation, Reykjavik University, Reykjavik, Iceland, 2020. [Google Scholar]
- Toschi, F.; Bodenschatz, E. Lagrangian Properties of Particles in Turbulence. Annu. Rev. Fluid Mech. 2009, 41, 375–404. [Google Scholar] [CrossRef]
- Batchelor, G.K. The Theory of Homogeneous Turbulence; Cambridge University Press: Cambridge, UK, 1982. [Google Scholar]
- Arabnejad, M.H.; Amini, A.; Farhat, M.; Bensow, R.E. Numerical and experimental investigation of shedding mechanisms from leading-edge cavitation. Int. J. Multiph. Flow 2019, 119, 123–143. [Google Scholar] [CrossRef]
- Petersen, A.J.; Baker, L.; Coletti, F. Experimental study of inertial particles clustering and settling in homogeneous turbulence. J. Fluid Mech. 2019, 864, 925–970. [Google Scholar] [CrossRef]
- Lee, J.; Lee, C. The effect of wall-normal gravity on particle-laden near-wall turbulence. J. Fluid Mech. 2019, 873, 475–507. [Google Scholar] [CrossRef]
- Ayyalasomayajula, S.; Warhaft, Z. Nonlinear interactions in strained axisymmetric high-Reynolds-number turbulence. J. Fluid Mech. 2006, 566, 273–307. [Google Scholar] [CrossRef]
- Gualtieri, P.; Meneveau, C. Direct numerical simulations of turbulence subjected to a straining and destraining cycle. Phys. Fluids 2010, 22, 065104. [Google Scholar] [CrossRef]
- Brandt, L.; Coletti, F. Particle-Laden Turbulence: Progress and Perspectives. Annu. Rev. Fluid Mech. 2022, 54, 159–189. [Google Scholar] [CrossRef]
- Pope, S.B. Turbulent Flows; Cambridge University Press: Cambridge, UK, 2000. [Google Scholar]
- Tanuma, T. Advances in Steam Turbines for Modern Power Plants; Woodhead Publishing: Sawston, UK, 2017. [Google Scholar]
- Davidson, P.A. Turbulence: An Introduction for Scientists and Engineers; Oxford University Press: Oxford, UK, 2004. [Google Scholar]
- John, L.; Lumley, H.T. A First Course in Turbulence; MIT Press: Cambridge, MA, USA, 1972. [Google Scholar]
- Taherkhani, B.; Anaraki, A.P.; Kadkhodapour, J.; Farahani, N.K.; Tu, H. Erosion Due to Solid Particle Impact on the Turbine Blade: Experiment and Simulation. J. Fail. Anal. Prev. 2019, 19, 1739–1744. [Google Scholar] [CrossRef]
- Hunt, J.C.R. A theory of turbulent flow round two-dimensional bluff bodies. J. Fluid Mech. 1973, 61, 625–706. [Google Scholar] [CrossRef]
- Ireland, P.J.; Bragg, A.D.; Collins, L.R. The effect of Reynolds number on inertial particle dynamics in isotropic turbulence. Part 1. Simulations without gravitational effects. J. Fluid Mech. 2016, 796, 617–658. [Google Scholar] [CrossRef]
- Baker, L.J.; Coletti, F. Particle–fluid–wall interaction of inertial spherical particles in a turbulent boundary layer. J. Fluid Mech. 2021, 908, A39. [Google Scholar] [CrossRef]
- Xiao, W.; Jin, T.; Luo, K.; Dai, Q.; Fan, J. Eulerian–Lagrangian direct numerical simulation of preferential accumulation of inertial particles in a compressible turbulent boundary layer. J. Fluid Mech. 2020, 903, A19. [Google Scholar] [CrossRef]
- Hassanian, R.; Helgadóttir, Á.; Riedel, M. Deep Learning Forecasts a Strained Turbulent Flow Velocity Field in Temporal Lagrangian Framework: Comparison of LSTM and GRU. Fluids 2022, 7, 344. [Google Scholar] [CrossRef]
- Hassanian, R.; Helgadottir, A.; Bouhlali, L.; Riedel, M. An Experiment Generates a Specified Mean Strained Rate Turbulent Flow: Dynamics of Particles. Phys. Fluids 2023, 35, 015124. [Google Scholar] [CrossRef]
- Kompenhans, M.R.J.; Willert, C.E.; Scarano, F.; Kähler, C.J.; Wereley, S.T. Particle Image Velocimetry; Springer International Publishing AG: Cham, Switzerland, 2018. [Google Scholar]
- Ouellette, N.T.; Xu, H.; Bodenschatz, E. A quantitative study of three-dimensional Lagrangian particle tracking algorithms. Exp. Fluids 2006, 40, 301–313. [Google Scholar] [CrossRef]
- Cengel, Y.; Cimbala, J. Fluid Mechanics: Fundamentals and Applications; McGraw Hill: New York, NY, USA, 2017. [Google Scholar]
- Gomes, A.O.; Brito, R.F.; Rosa, H.; RosaShow, H.; Campos, J.C.C.; Tibiriçá, Á.M.B.; Casanova, P. Experimental Analysis of an S809 Airfoil. In Proceedings of the ENCIT 2014, 15th Brazilian Congress of Thermal Sciences and Engineering, Belem, Brazil, 10–13 November 2014. [Google Scholar] [CrossRef]
- Kühsel, S.; Brückner, A.; Schmelzle, S.; Heethoff, M.; Blüthgen, N. Surface area–volume ratios in insects. Insect Sci. 2017, 24, 829–841. [Google Scholar] [CrossRef] [PubMed]
- Collins, L.R.; Keswani, A. Reynolds number scaling of particle clustering in turbulent aerosols. New J. Phys. 2004, 6, 119. [Google Scholar] [CrossRef]
- Zaichik, L.I.; Alipchenkov, V.M. The effect of Brownian motion on collisions between aerosol particles in turbulent flow. High Temp. 2008, 46, 502–511. [Google Scholar] [CrossRef]
- Lin, J.Z.; Huang, L.Z. Review of some researches on nano- and submicron Brownian particle-laden turbulent flow. J. Hydrodyn. Ser. B 2012, 24, 801–808. [Google Scholar] [CrossRef]
- Ansys Workbench Teaching Version; Ansys Inc.: Canonsburg, PA, USA, 2021.


| Particle Type | Diameter [mm] | Density [kg/m] | [ms] | Strain Rate on a Prototype Airfoil S809 [s] | Non-Dimensional Time Scale |
|---|---|---|---|---|---|
| Hail | 5.00 | 8.2 × 10 | 6.3 × 10 | 14 | 8.8 × 10 |
| Raindrop | 1.00 | 1.0 × 10 | 3.0 × 10 | 14 | 4.3 × 10 |
| Sand | 0.67 | 1.4 × 10 | 7.1 × 10 | 14 | 9.9 × 10 |
| Insects | 5.00 | 2.4 × 10 | 3.5 × 10 | 14 | 4.7 × 10 |
| Tracer | 0.01 | 1.1 × 10 | 1.6 × 10 | 14 | 2.3 × 10 |
| Inertial | 0.25 | 2.5 × 10 | 2.8 × 10 | 14 | 3.9 × 10 |
| Flow Case | Mean Strain Rate [s] | x-Coordinate [mm] | y-Coordinate [mm] |
|---|---|---|---|
| 4 | −4.6 | 7.3 | |
| 8 | −2.3 | 7.0 | |
| 4 | 1.9 | 1.6 | |
| 8 | 2.8 | −3.1 |
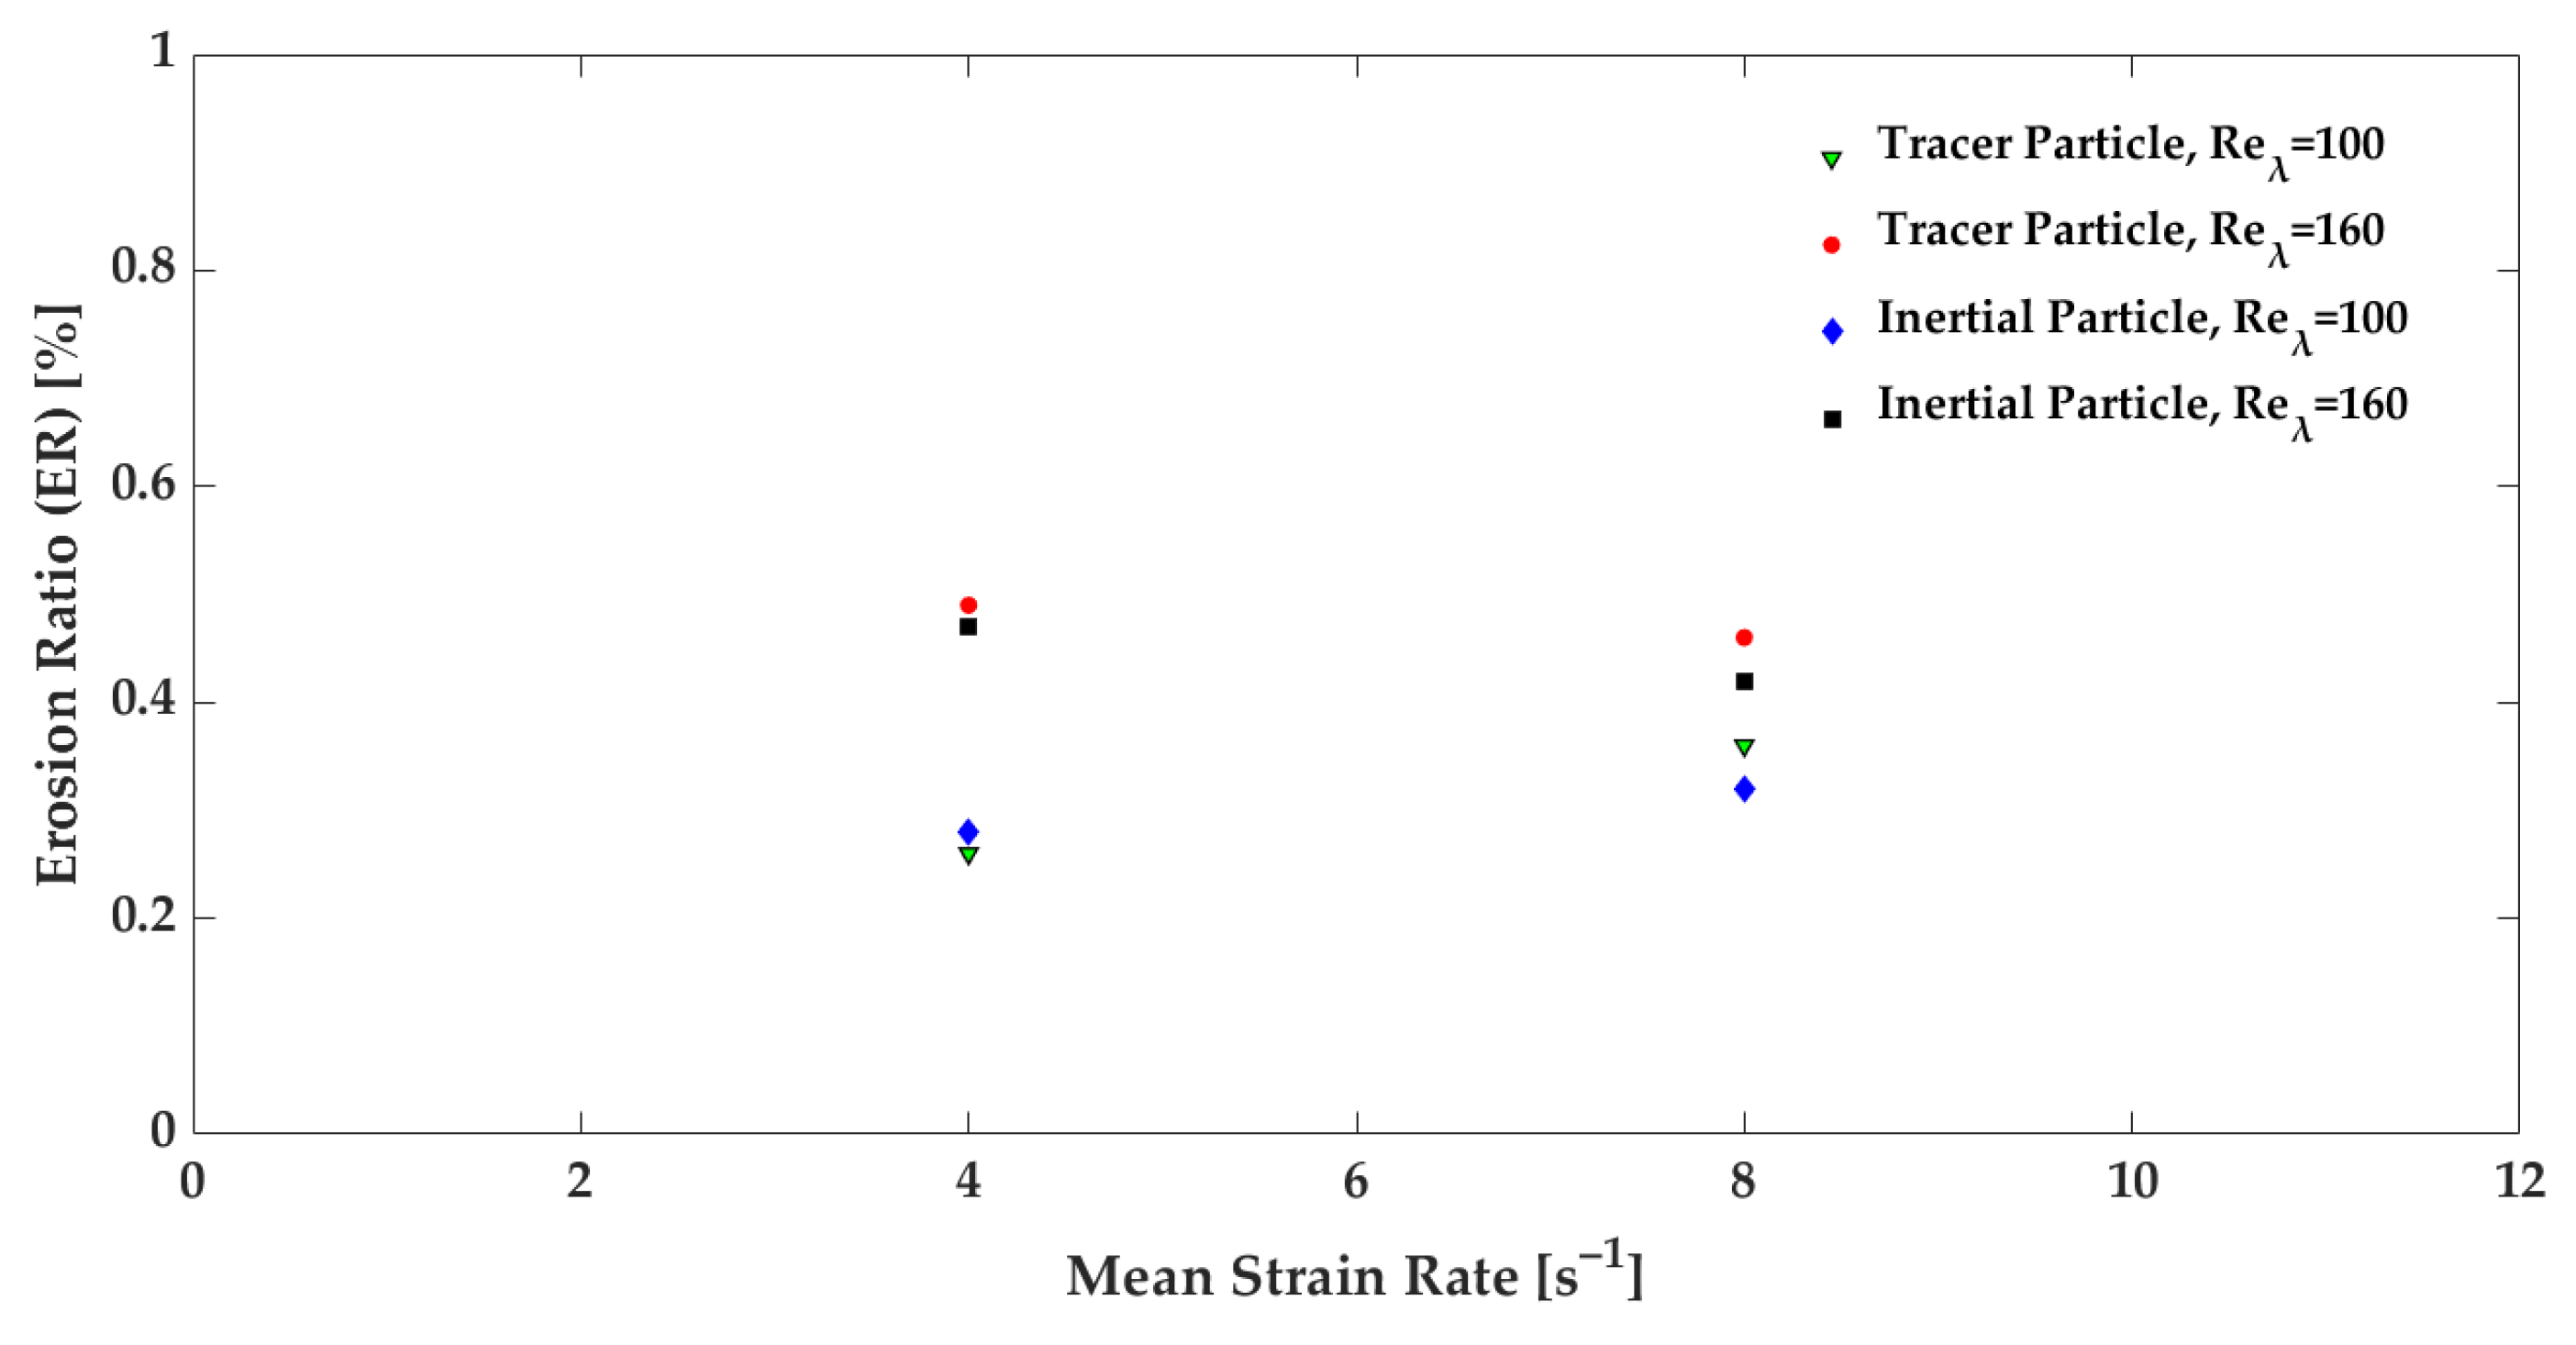
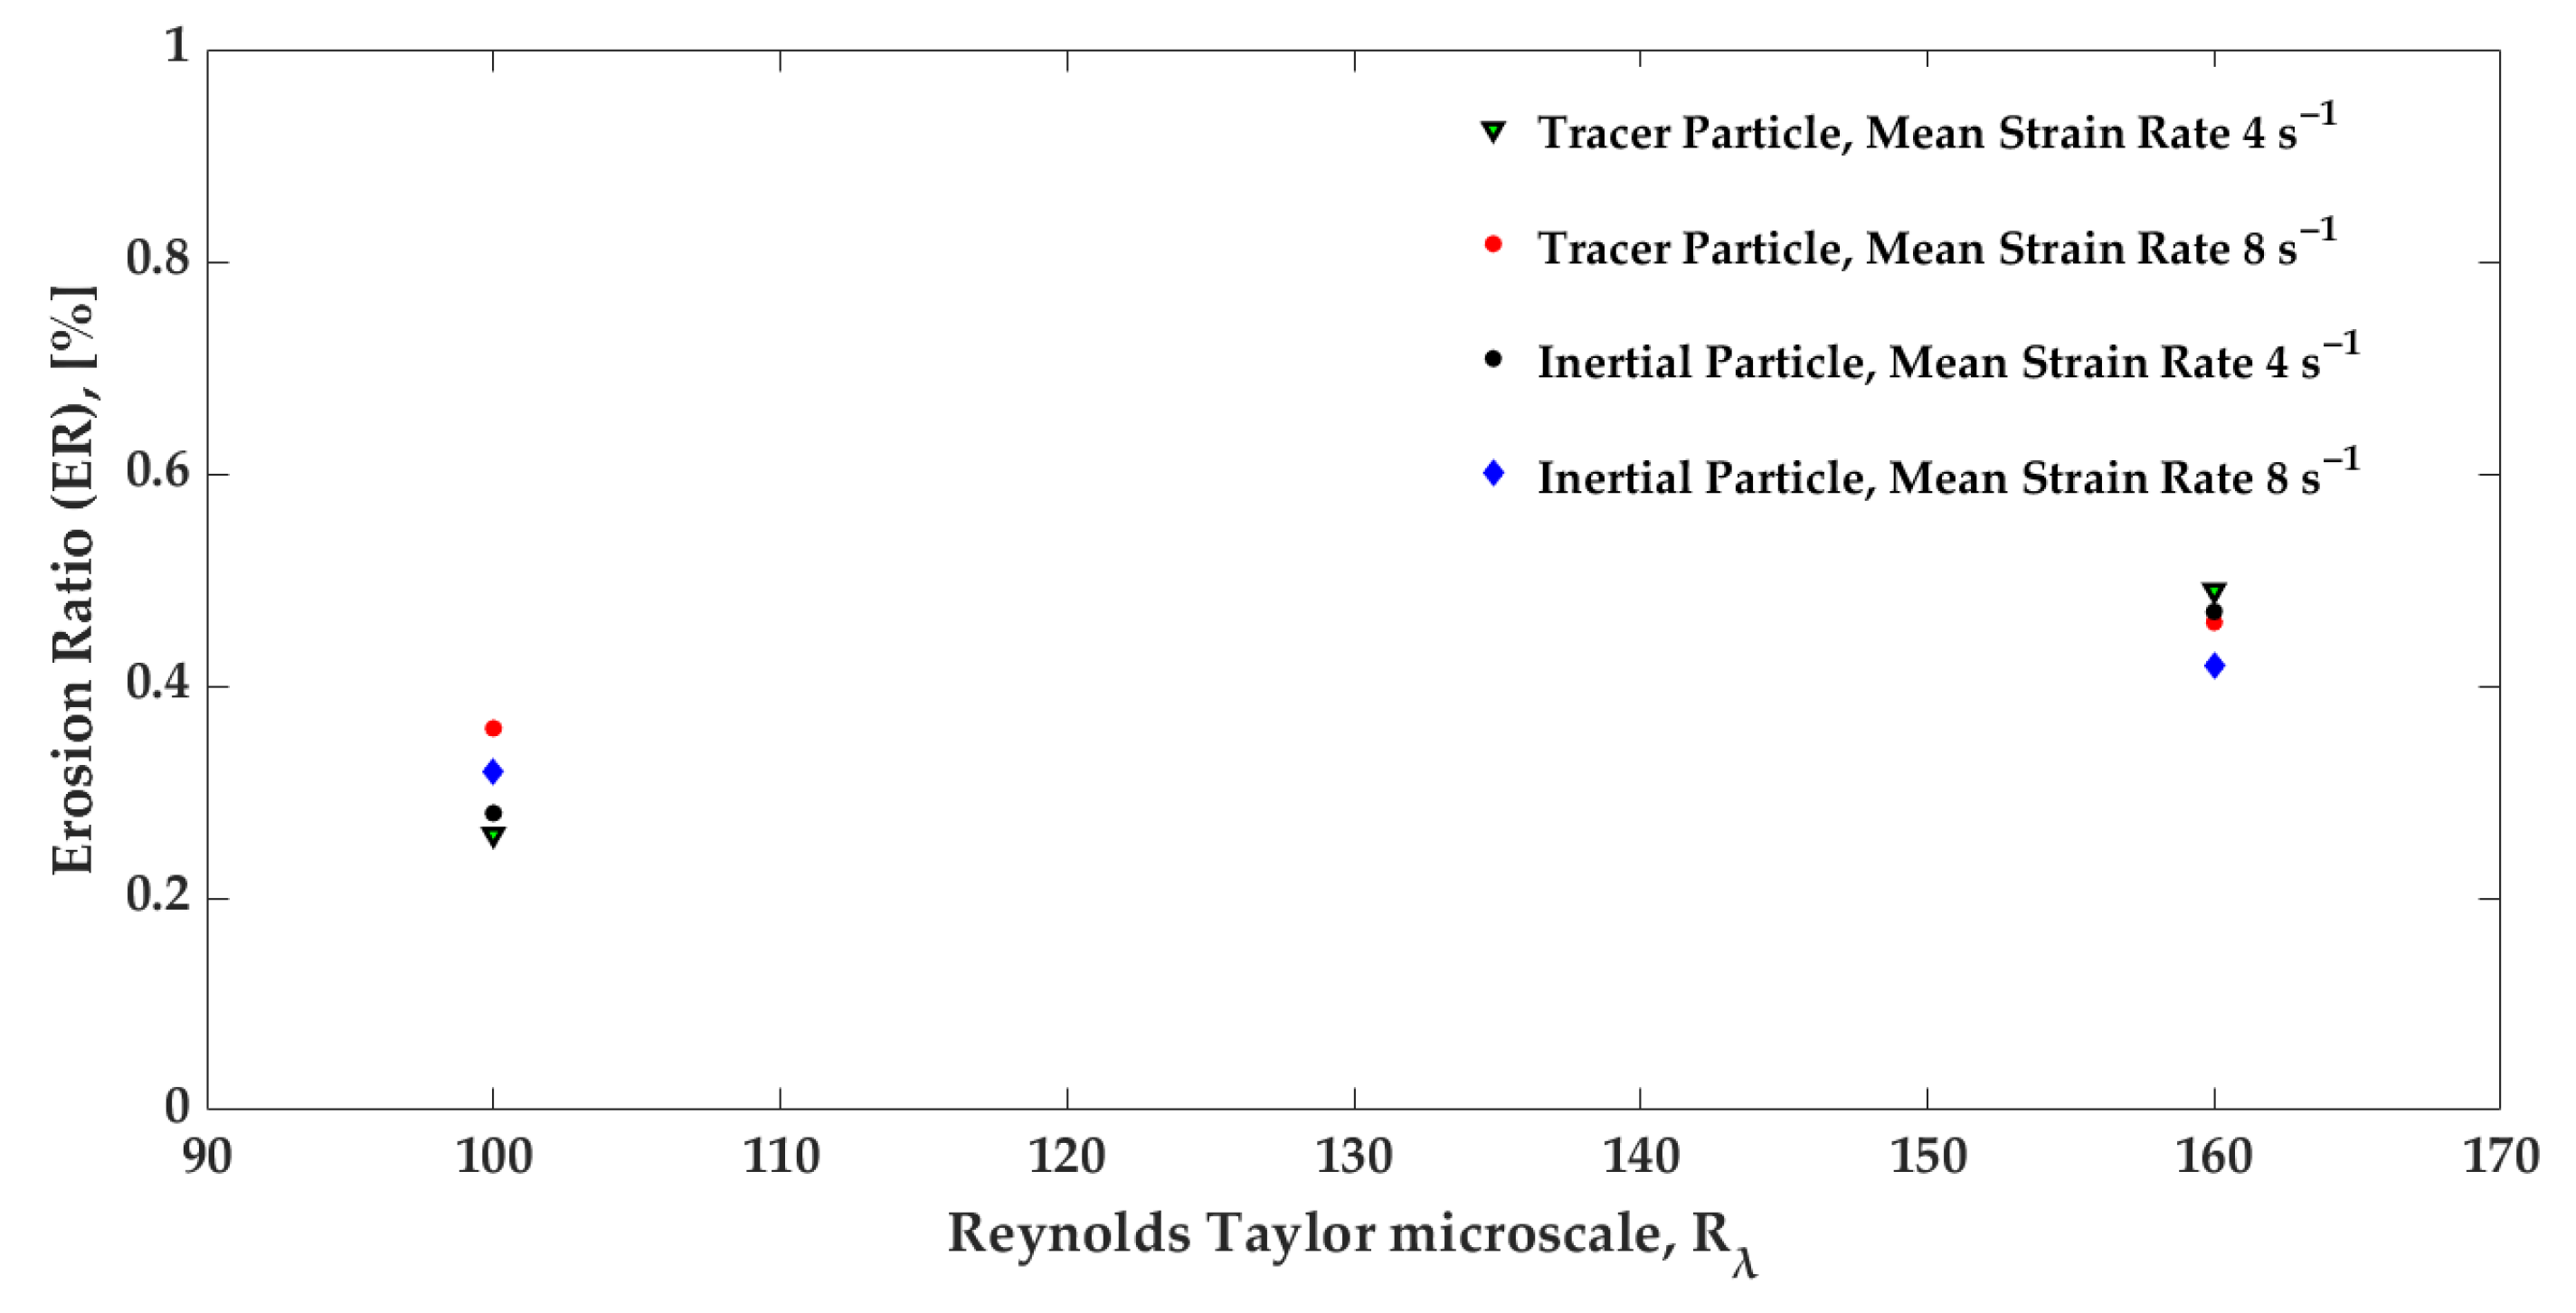
| Turbulence Intensity | Mean Strain Rate [s] | Particle Type | Erosion Ratio (ER) |
|---|---|---|---|
| 4 | Tracer | 26% | |
| 4 | Inertial | 28% | |
| 8 | Tracer | 36% | |
| 8 | Inertial | 32% | |
| 4 | Tracer | 49% | |
| 4 | Inertial | 47% | |
| 8 | Tracer | 46% | |
| 8 | Inertial | 42% |
Disclaimer/Publisher’s Note: The statements, opinions and data contained in all publications are solely those of the individual author(s) and contributor(s) and not of MDPI and/or the editor(s). MDPI and/or the editor(s) disclaim responsibility for any injury to people or property resulting from any ideas, methods, instructions or products referred to in the content. |
© 2023 by the authors. Licensee MDPI, Basel, Switzerland. This article is an open access article distributed under the terms and conditions of the Creative Commons Attribution (CC BY) license (https://creativecommons.org/licenses/by/4.0/).
Share and Cite
Hassanian, R.; Riedel, M. Leading-Edge Erosion and Floating Particles: Stagnation Point Simulation in Particle-Laden Turbulent Flow via Lagrangian Particle Tracking. Machines 2023, 11, 566. https://doi.org/10.3390/machines11050566
Hassanian R, Riedel M. Leading-Edge Erosion and Floating Particles: Stagnation Point Simulation in Particle-Laden Turbulent Flow via Lagrangian Particle Tracking. Machines. 2023; 11(5):566. https://doi.org/10.3390/machines11050566
Chicago/Turabian StyleHassanian, Reza, and Morris Riedel. 2023. "Leading-Edge Erosion and Floating Particles: Stagnation Point Simulation in Particle-Laden Turbulent Flow via Lagrangian Particle Tracking" Machines 11, no. 5: 566. https://doi.org/10.3390/machines11050566