Article

DLP of Translucent Alumina: In-Depth Investigation on Slurry Development and Debinding Regimes

1
Department of Mechanical Engineering, University of Birmingham, Birmingham B15 2TT, UK
2
The Manufacturing Technology Centre Limited, Ansty Park, Coventry CV7 9JU, UK
*
Authors to whom correspondence should be addressed.
Machines 2023, 11(3), 321; https://doi.org/10.3390/machines11030321
Submission received: 31 January 2023 / Revised: 16 February 2023 / Accepted: 21 February 2023 / Published: 23 February 2023
(This article belongs to the Special Issue High Performance and Hybrid Manufacturing Processes)

Abstract

:
Exploring the feasibility of producing near-net-shape components with advanced properties and geometrical features via 3D printing has incrementally become the research focus of various studies. Digital light processing (DLP) technology can manufacture complex-structured components for various technical applications. The aims of this research were to investigate Al2O3 ceramic slurry preparation procedures to identify the ideal components to add to an in-house-developed ceramic slurry, to determine the optimal DLP printing parameters and conditions while understanding their effect on the green part properties and to evaluate the appropriate debinding regime to achieve fully dense crack-free fired parts capable of exhibiting translucent behaviours. The slurry obtained from the ball-milled powder at 800 rpm for 1 h, together with 2 wt.% BYK-145 as a dispersant and the highest achievable solid loading of 85 wt.%, showed the desired rheological and photopolymerisation properties. Full-factorial design of experiments (DOE) was employed to study the impact of the printing parameters on the density and the dimensions of the samples. Different debinding regimes were investigated and it was proven that the lowest debinding heat rate (0.2 °C/min) and longer holding times helped to reduce defects and promote densification (>99.0%), providing optimal grounds to obtain translucent fired parts.

1. Introduction

Additive manufacturing (AM) represents a possible alternative to conventional production. It is a technique for producing three-dimensional objects by adding individual layers based on a sliced computer-a design (CAD) model. In terms of processed materials, plastics and metals are now the industry leaders, although ceramic additive manufacturing has lately garnered a great deal of attention [1,2,3]. Indirect and direct ceramic AM are the two most common classifications [4]: the former comprises, among other characteristics, selective laser sintering (SLS), selective laser melting (SLM), and direct inkjet printing (DIP), while the latter includes laminated object manufacturing (LOM) and stereolithography (SLA). SLA is one of the most popular kinds of ceramic-additive-manufacturing techniques and digital light processing (DLP) is one of the most promising processes that originate from the SLA approach while improving it at the same time. The benefit of DLP technology is the more rapid and efficient fabrication of the part, as the projected light source solidifies one layer of slurry at a time [5] rather than a point or a single line.
A crucial objective of AM is the achievement of dimensional precision and reproducibility in the produced parts [6]. For AM of metals, it is common to find extensive research on the effect of printing settings on the part dimensions. For instance, in previous literature, it is possible to find examples of studies where laser powder bed fusion [7,8,9] and selective laser melting [10,11] were adopted to create complex metallic structures, and exhaustive research on the effect of the process parameters was conducted. However, on the other hand, the influence of AM processing parameters on the final properties of ceramic components has begun to be investigated only more recently and, even though the conducted studies have been providing progressively more information, further investigations can strengthen the existing knowledge base. Regarding slurry-based methods, in particular, the effects of slurry preparation and printing settings of ceramic stereolithography-based methods on the dimensional accuracy and obtained density have not been thoroughly researched when linked to the final properties of the fired samples. Fu et al. [12] investigated the effect of laser power on the dimensional accuracy of the SLA of bulk items and concluded that the length and breadth increased with increasing laser power due to an increase in light scattering. In a separate investigation, the printing parameters were experimentally altered during the production of a gear shape using LCM and it was discovered that the horizontal resolution rose as the exposure energy decreased [13].
The slurries used for ceramic additive manufacturing via DLP generally comprise ceramic filler, binder, photoinitiator, and other additives. The interactions between all of them must be taken into account when considering possible combinations. For instance, while dimensional error in ceramic-based stereolithography is usually due to the dispersion level of the added ceramic particles to UV resin [14,15], a high index of refraction mismatch between ceramic particles and photopolymerisable resins can reduce the cure depth and alter the resolution [15,16], affecting the achievable accuracy. In the existing literature, there are various examples of the selection process of starting slurry components and different methods for preparing ceramic suspensions are presented. The ceramic powder may be utilised as-is [17,18,19,20,21] or the surface of the ceramic particles may be pre-treated with a dispersant prior to the addition to the photopolymerisable resin [22,23,24]. There is a dearth of information about the photopolymerisation behaviour and rheology, as well as a lucid description of the optimal way of preparation and achievement of a solid loading greater than 40 vol%, which is a key aspect in the development of ceramic slurries able to obtain successfully dense parts [17,25,26]. High solid loadings are also desired, as they enhance mechanical characteristics while decreasing sintering shrinkages. However, the addition of hydrophilic ceramic particles to the hydrophobic resin dramatically increases viscosity, which directly affects the printing feasibility. To obtain a high solid loading and an excellent dispersion of ceramic particles in the resin, it is necessary to add a dispersant to create steric barriers between ceramic particles that compensate for the van der Waals attractive forces and avoid Brownian motion-induced particle collisions [17].
In addition to the preprocessing and printing parameters, the debinding and sintering processes need to be optimised and strict controls must be established to obtain samples free of cracks [27,28], as low solid loadings can result in 70% shrinkage during the thermal postprocessing. In fact, the 3D-printed ceramic green body is subjected to heat treatment methods in order to produce sintered bodies with the required final qualities. During the debinding procedure, the ceramic slurry’s binder must be pyrolysed away. As the binder diffuses through the ceramic green body, microcracks are caused by high heating rates and unsuitable holding temperatures and holding durations [29]. When microcracks are not eliminated, their presence during sintering degrades the mechanical characteristics. Therefore, the heating rate and the dwelling temperatures within the temperature range where the binder decomposes must be accurately calculated prior to thermally stabilising the ceramic green body for an appropriate holding period [27]. In addition, a sufficient sintering temperature is necessary, as the ceramic densification process is incompletely attained when an improper heating temperature is used in the sintering process, resulting in a degradation of the material’s physical properties. Therefore, optimal sintering temperatures should be investigated appropriately in advance to fully exploit the potentialities of ceramic materials [30].
Recently, several intriguing experiments have been devoted to the fabrication via AM of ceramic components for special applications in micro-electro-mechanical-system [31] or catalyst-substrate manufacturing [32,33,34]. However, due to the great optical transparency and characteristic ceramic features of transparent ceramics, they are equally suitable for a wide variety of high-performance applications, such as lasers, armours, and lighting. There is a pressing need to simultaneously lower the weight of transparent armour systems and boost their ballistic protective qualities. When both mechanical strength and abrasion resistance are essential performance characteristics, material options are frequently restricted to a few materials [35,36,37], such as aluminium oxynitride (AlON) [38,39,40], sapphire (Al2O3) [41], and magnesium aluminate spinel (MgAl2O4) [42,43]. Due to their great strength and hardness, these three materials have been investigated as possible replacements for ballistic glasses in transparent armour applications for quite some time, and ballistic tests have demonstrated that spinel, AlON, and sapphire exhibit comparable performance. Payne and colleagues [44,45] claimed that transparent yttrium aluminium garnet (YAG) ceramics may be created via a direct ink writing (DIW) approach, but that the subsequent CIP and HIP processes are still required. Wu et al. [46] continued to use the extrusion-based AM method employing copolymer-assisted slurry so that complex-shaped transparent YAG ceramics could be immediately produced. Hostaša et al. [47] manufactured YAG laser ceramics by lithography-based ceramic manufacturing (LCM) to demonstrate the benefit of lithography-based techniques in terms of spatial resolution and product form. Two-photon printing was used to create small transparent YAG objects with nanometric precision in the nanometre and micrometre ranges (TPP) [48]. However, studies on the DLP of translucent alumina starting from an in-house systematically developed slurry and its consecutive post-processing have yet to be explored.
In conclusion, complex interactions between process settings, printer resolution, and composition of the photopolymerizable slurry determine the precision of DLPed components. Although numerous studies have focused on the effects of printing parameters on the performance of manufactured parts, a systematic examination of the effects of slurry preparation and printing parameters on the geometrical properties of DLPed advanced alumina ceramics is necessary. The impact of different ball-milling pre-treatments, diverse slurry components and, hence, curing behaviours and debinding regimes has to be evaluated by analysing the evolution of the density and the geometrical accuracy at various layer thicknesses and energy dosages. This research aims to analyse the ceramic slurry preparation steps and establish optimal printing and debinding settings for achieving translucency in alumina-based structures even in air-sintering conditions. In this study, the influence of the pre-treatment of ceramic particles relative to the as-received powder was investigated, as well as the additions in the ceramic slurry of different components in various proportions. A full-factorial design of experiment (DoE) was used to explore the influence of layer thickness, exposure power, and exposure time on dimensional accuracy. On the basis of a comparison of the printing’s dimensional correctness and on the estimation of the density, the optimal printing parameters were determined. Different debinding regimes were then analysed and, finally, samples were sintered. In the end, the entire process was repeated following the now-established optimal route and adding MgO as a sintering aid in a minimal quantity (1000 ppm) without altering the slurry printability, in order to obtain even a slightly translucent sample.

2. Materials and Methods

2.1. Ceramic Powder Pretreatment

Alumina was used as the ceramic powder (CT 3000 LS SG, Almatis GmbH, Ludwigshafen, Germany) for the photopolymerisable slurry. The as-received aluminium oxide powder (D50 = 0.92 µm) was ball milled together with 0.8 mm of aluminium oxide grinding media (Industrie Bitossi S.p.A., Spicchio-Sovigliana, Italy) in a 1:1 ball-to-powder ratio (BPR) at different rotating speeds and holding times in a planetary ball milling (HMK-1901, Dandong HMKTest Instrument Co., Ltd., Dandong, Liaoning, China) in order to see if, within a limited window of investigation, any changes in the pretreated powders could be appreciated. Table 1 illustrates the various values of speed and time tested.
The set of parameters producing the best results was adopted and finally sieved via a 250 μm mesh screen. The particle size distribution of the ceramic powder was measured by laser diffraction particle size analysis (Sympatec GmbH, Clausthal-Zellerfeld, Germany), which was performed in a liquid dispersion consisting of water and two drops of tetrasodium pyrophosphate as a dispersant. Additionally, SEM images were obtained to analyse the shape of the powder (JEOL JSM-6060LV, Tokyo, Japan).

2.2. Slurry Preparation
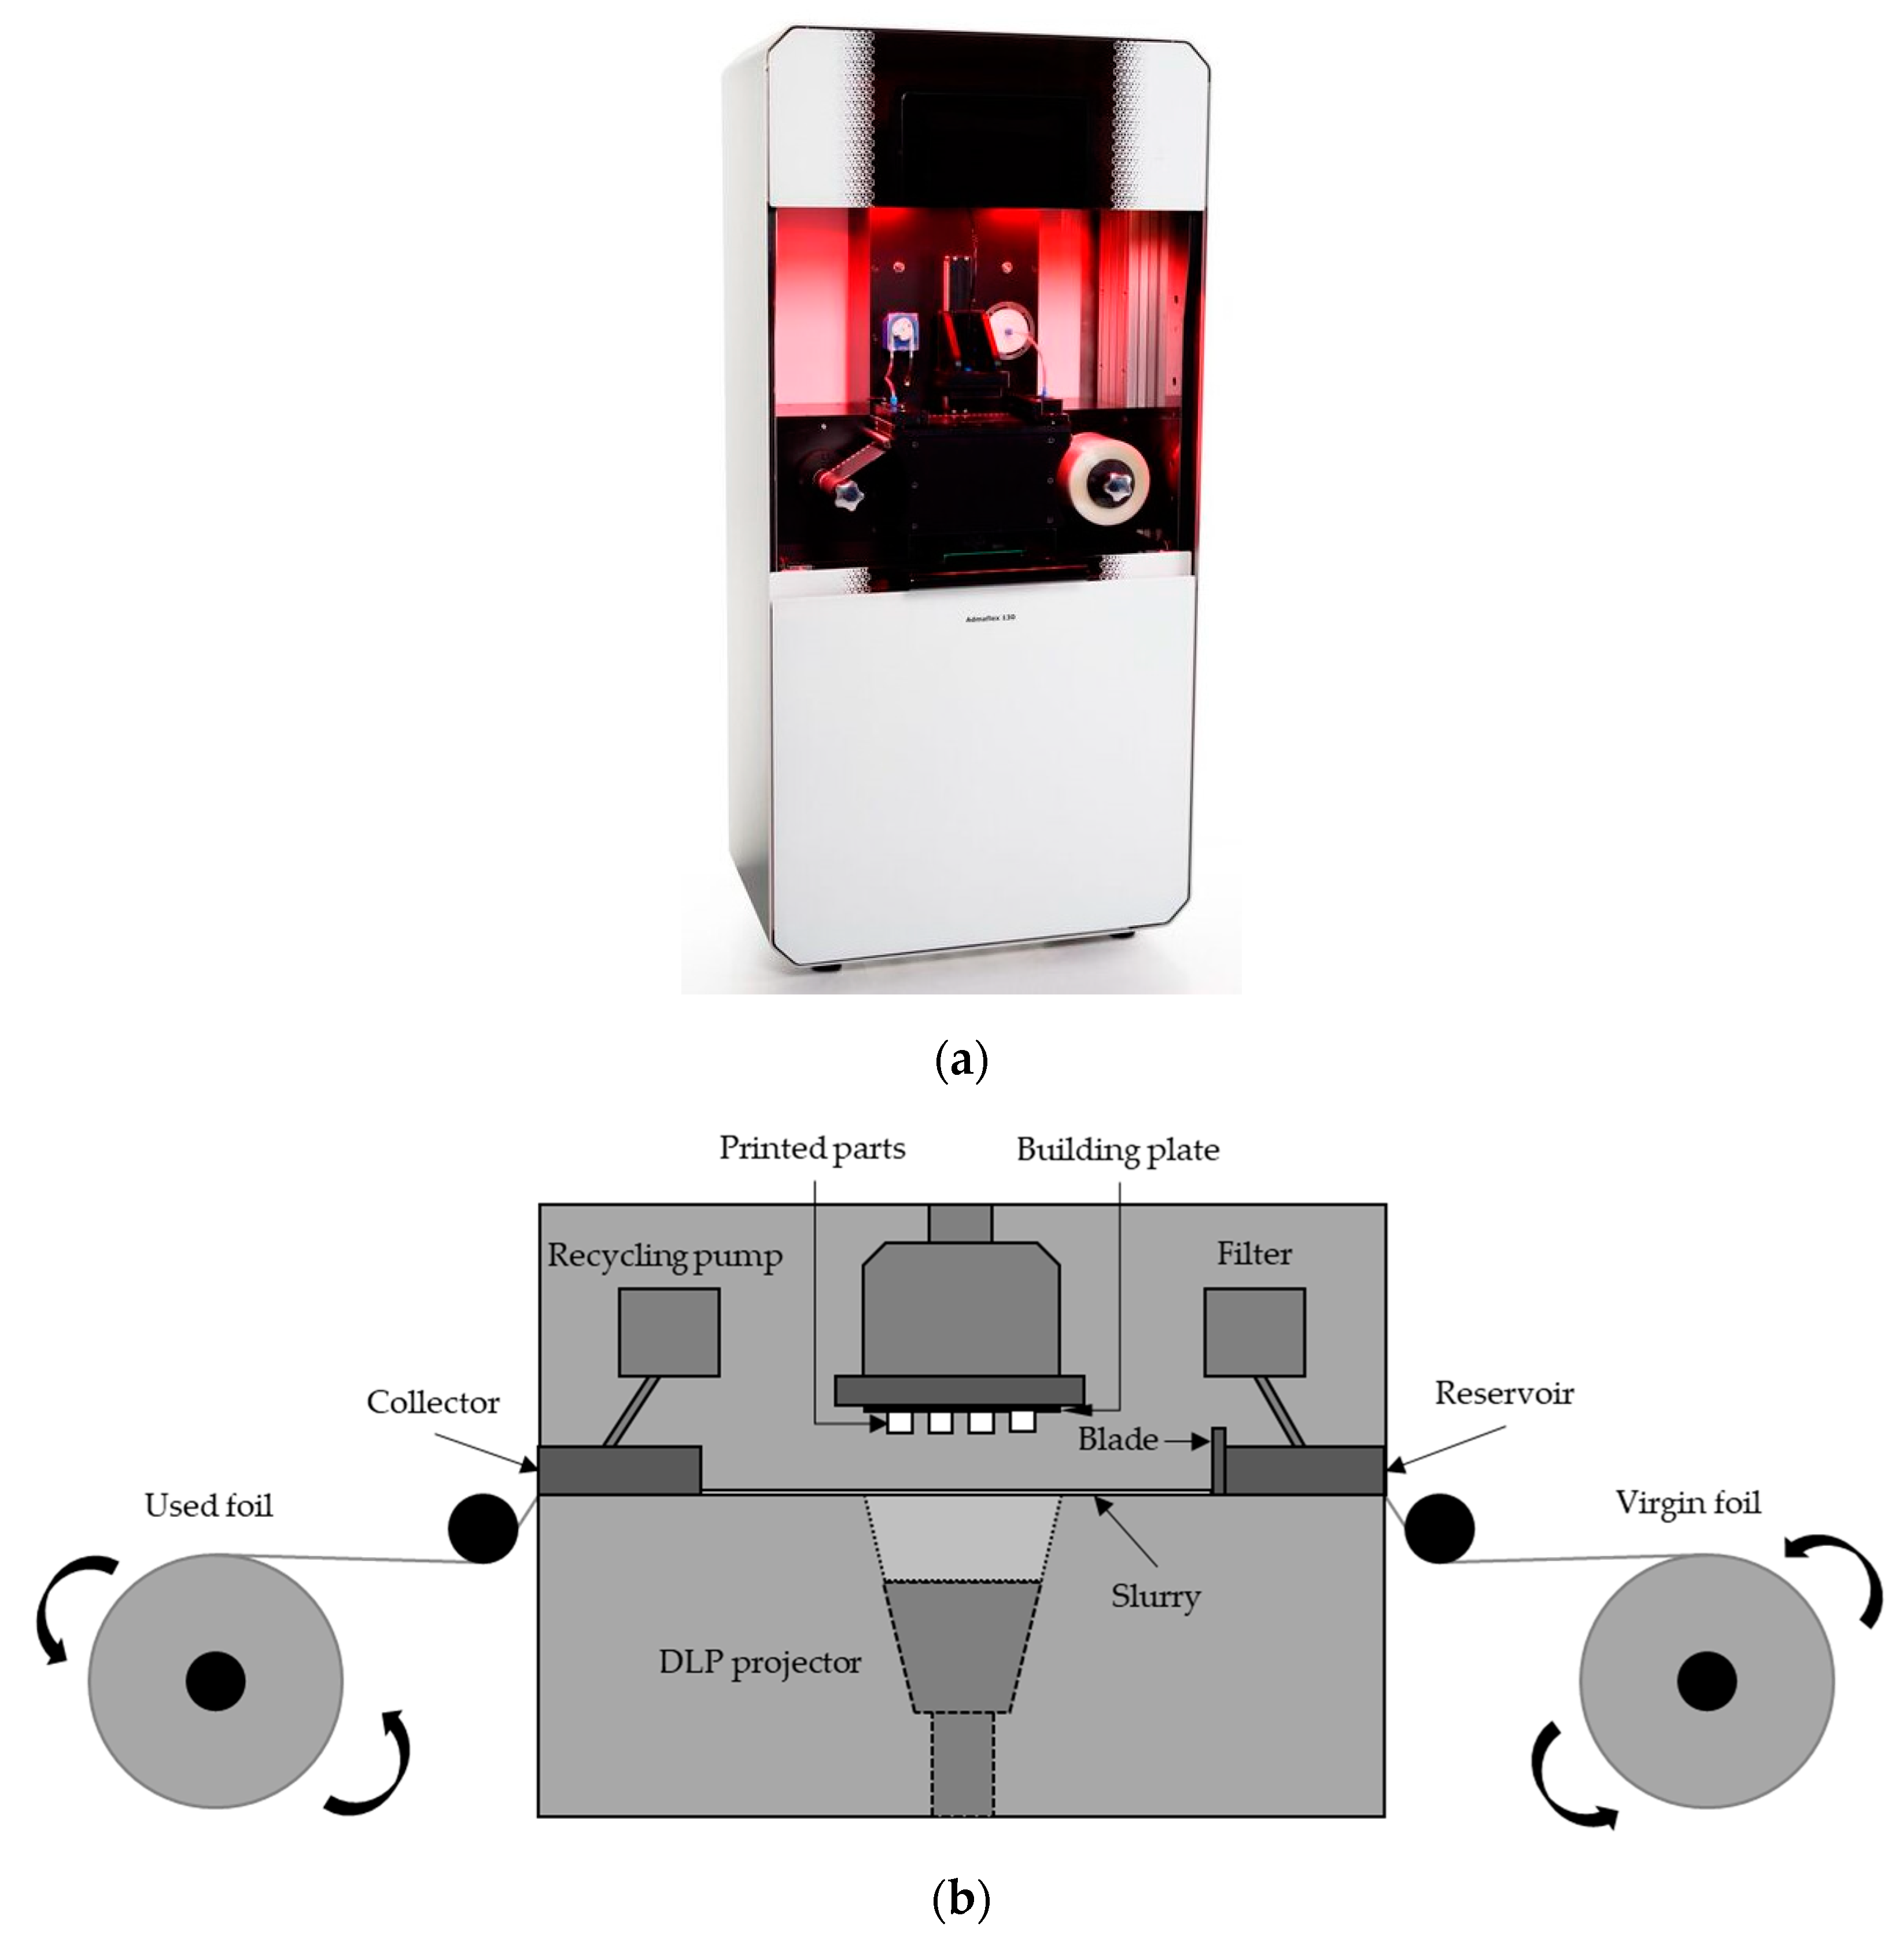
The resin was prepared by mixing polyfunctional and monofunctional monomers in different proportions together with a dispersant and a plasticizer (20 wt.% to the resin content) to prevent delamination. Diphenyl (2,4,6-trimethylbenzoyl) phosphine oxide (Sigma Aldrich, Gillingham, UK) was added to the resin mixture as a photoinitiator (1.0 wt.% of the photoreactive resin components). A difunctional and a monofunctional polymer were chosen in a proportion of 6:5 and a ceramic loading of 85 wt.% was selected to be implemented. The processes for preparing ceramic slurry were derived from the literature [49].
The first step consisted of blending the resin components using an overhead mixer at room temperature for 30 minutes, followed by the addition of the dispersant and another 30 minutes of stirring. Then, the ceramic powder was gradually added until a solid loading of 85 wt.% was reached. The photoinitiator was subsequently added to the combination, which was then mixed for further 30 min with the mechanical mixer and, finally, the slurry was placed in a turbula mixer for at least 12 h along with 6 mm spherical alumina grinding media (Industrie Bitossi S.p.A., Spicchio-Sovigliana, Italy) with a BPR = 1. Before the printing, the produced slurry was processed for 10 min in a vacuum degasser to eliminate air bubbles and minimise polymerisation inhibition.
Different dispersants, various percentages of dispersants, and diverse solid loadings were explored. Table 2 shows the components and parameters investigated.
First, the dispersant influence was investigated by trying three different dispersants at the same weight–content percentage to the ceramic powder content and the optimal dispersant was then selected. Second, the effect of the chosen dispersant weight content was studied by varying the weight content between 1% and 5% and the dispersant showing the ideal rheology behaviour was selected. Finally, the solid content workability range was explored by considering four different ceramic solid loadings and the optimal one was chosen. To comprehend the rheological properties of the prepared suspension, the rheology of the ceramic suspensions was examined with AR 500 (TA Instruments, New Castle, DE, USA) using a 40 mm parallel plate geometry in the shear rate window ranging from 0.1 to 300 s−1 at a constant temperature of 20.0 °C, in accordance with DLP printing conditions.

2.3. DLP

With a light source operating at a wavelength of λ = 405 nm, the Admaflex 130 (Admatec Europe BV, Alkmaar, The Netherlands) was employed as a 3D printing machine capable of achieving a resolution of 40 µm on the layer plane. The actual forming tool of the machine is composed of thousands of mirrors that move in accordance with pixels to imprint the picture on the slurry. The Admaflex 130 utilises a rotating foil system for transporting the slurry from the reservoir to the 3D construction area and subsequently to the collecting zone, where a pump mechanism returns the unneeded slurry to the reservoir. The light-reactive slurry is exposed to light at the machine’s operating wavelength and, as a result, the entire layer is cured at once due to the presence of multiple mirrors. Gradually, the green body is printed in its totality after being repeatedly cured, layer by layer (Figure 1b).
A single-layer curing approach was utilised to assess the critical exposure energy and depth of penetration by measuring the cure depth at various exposure energies. The working curve of the ceramic slurry depicts the slurry’s curing depth as a function of the light dosage for a particular light source. The vertical polymerisation depth, Cd, may be experimentally stated with Jacob’s equation:
Cd = Dp ln(E/Ec),
where Dp is the penetration depth—i.e., the distance at which light intensity decreases by e−1 [22]; E is the surface exposure energy density; and Ec is the critical surface exposure energy density for the slurry [17], which specifies the minimal energy density necessary for the photopolymerisation of the slurry [50]. Therefore, for higher values of Dp and smaller values of Ec, a lower amount of energy density is required to obtain a certain cure depth Cd. Ec and Dp are believed to be resin-specific metrics that are unaffected by exposure factors [51].
On a layer of photopolymerisable resin, a checkerboard picture was projected at different exposure surface powers for various exposure times. Table 3 illustrates the exposure times and exposure surface powers studied for understanding the curing behaviour.
The cured layers were peeled away from the foil and the thickness of the cured material was measured using a portable micrometre (Mitutoyo Digimatic Micrometer, MDC-25PX, Kawasaki, Japan). Five consecutive measurements were collected, and the average cure depth was determined, together with its standard deviation.
Following the single-layer curing tests, full-factorial design of experiments (DoE) was employed to design an experimental plan and determine the impact of printing settings on the dimensional accuracy. The analysis of variance was utilised to determine the relevant printing factors and their interactions with the process outputs [6]. Exposure power, exposure time, and sliced layer thickness were chosen as the experimental variables. The first variable represents the surface energy density delivered to the slurry for every second of exposure to the light source; the second variable expresses the period of time during which the phopolymerisable slurry is continuously cured under the light source for each layer; the third variable is the height of each individual slice of the model. Three levels were chosen for exposure duration, exposure power, and layer thickness. The exposure power is represented as a fraction of the DLP light source intensity, resulting in irradiance values of 3.52 mW/cm2 for 50‰, 6.69 mW/cm2 for 100‰, and 10.21 mW/cm2 for 150‰. The experimental matrix for the complete factorial experiment is presented in Table 4.
For each set of conditions, the printing of a total of 5 discs (CAD dimensions: diameter = 20 mm; thickness = 1.5 mm) and 5 squared plates (CAD dimensions: side = 15 mm; thickness = 1.5 mm) was attempted. The designed CAD parts were converted to .STL files and sliced to the corresponding layer thickness using the machine’s internal slicing software. For each layer, the delay before exposure was set to 15 s to allow the slurry to spread homogeneously on the layer, while the delay after exposure was set to 3 s to allow the layer to stabilise. In addition, the building platform was lifted and lowered each time by 6 mm at a speed of 2.5 mm/s to ensure a complete detachment of the cured layer from the foil and permit safe passage to the sliding foil. Finally, successful or acceptable samples were detached from the building platform and cleaned by using ethanol and compressed air. Minitab 21 statistical software was used to conduct an analysis of variance to determine the statistical relevance of each parameter.
The dimensions of the samples, as well as the geometrical accuracy and the shrinkage, were determined using a combination of a Vernier calliper and an optical microscope Alicona InfiniteFocusG5 plus (Bruker Alicona, Leicestershire, UK). The density of the samples was deducted adopting Archimedes’ principle and the optimal printing parameters were selected.

2.4. Thermal Post-Processing

Removing the photopolymerisable resin from the region between the ceramic particles is a vital step in post-processing 3D-printed components. During the debinding process, the organic components of the green body disintegrate into gas molecules, which disperse or pierce the surface of the green body and ultimately escape, creating interspaces between particles inside the brown body. Thermogravimetric analysis (TGA) and a differential scanning calorimetry (DSC) test were performed on an SDT NETZSCH STA with a heating rate of 5 °C/min to determine the mass loss of the DLP-printed green body and the crucial temperature for the binder removal. After printing more samples for the optimal printing parameters, 6 different debinding regimes were explored by varying the heating rate and the holding times, while keeping constant the 3 dwelling temperatures previously set according to the TGA/DSC test. Moreover, a pre-sintering step at 1000 °C was added to promote densification and facilitate the post-debinding sample handling. The debinding cycles were then carried out in a tube furnace (TSH/15/75/450, Elite Thermal Systems Ltd., Market Harborough, UK).
The dimensions and density of the samples were again tested and measured. Finally, the brown parts with the optimal properties were sintered according to the available facilities at 1700 °C for 12 h in a sintering furnace (HTF 17/27, Carbolite Gero, Sheffield, UK) with a heating rate of 10.0 °C/min in an air atmosphere in order to achieve fully dense alumina parts. A schematic summary of the entire experimental campaign is reported in Figure 2.

3. Results and Discussion
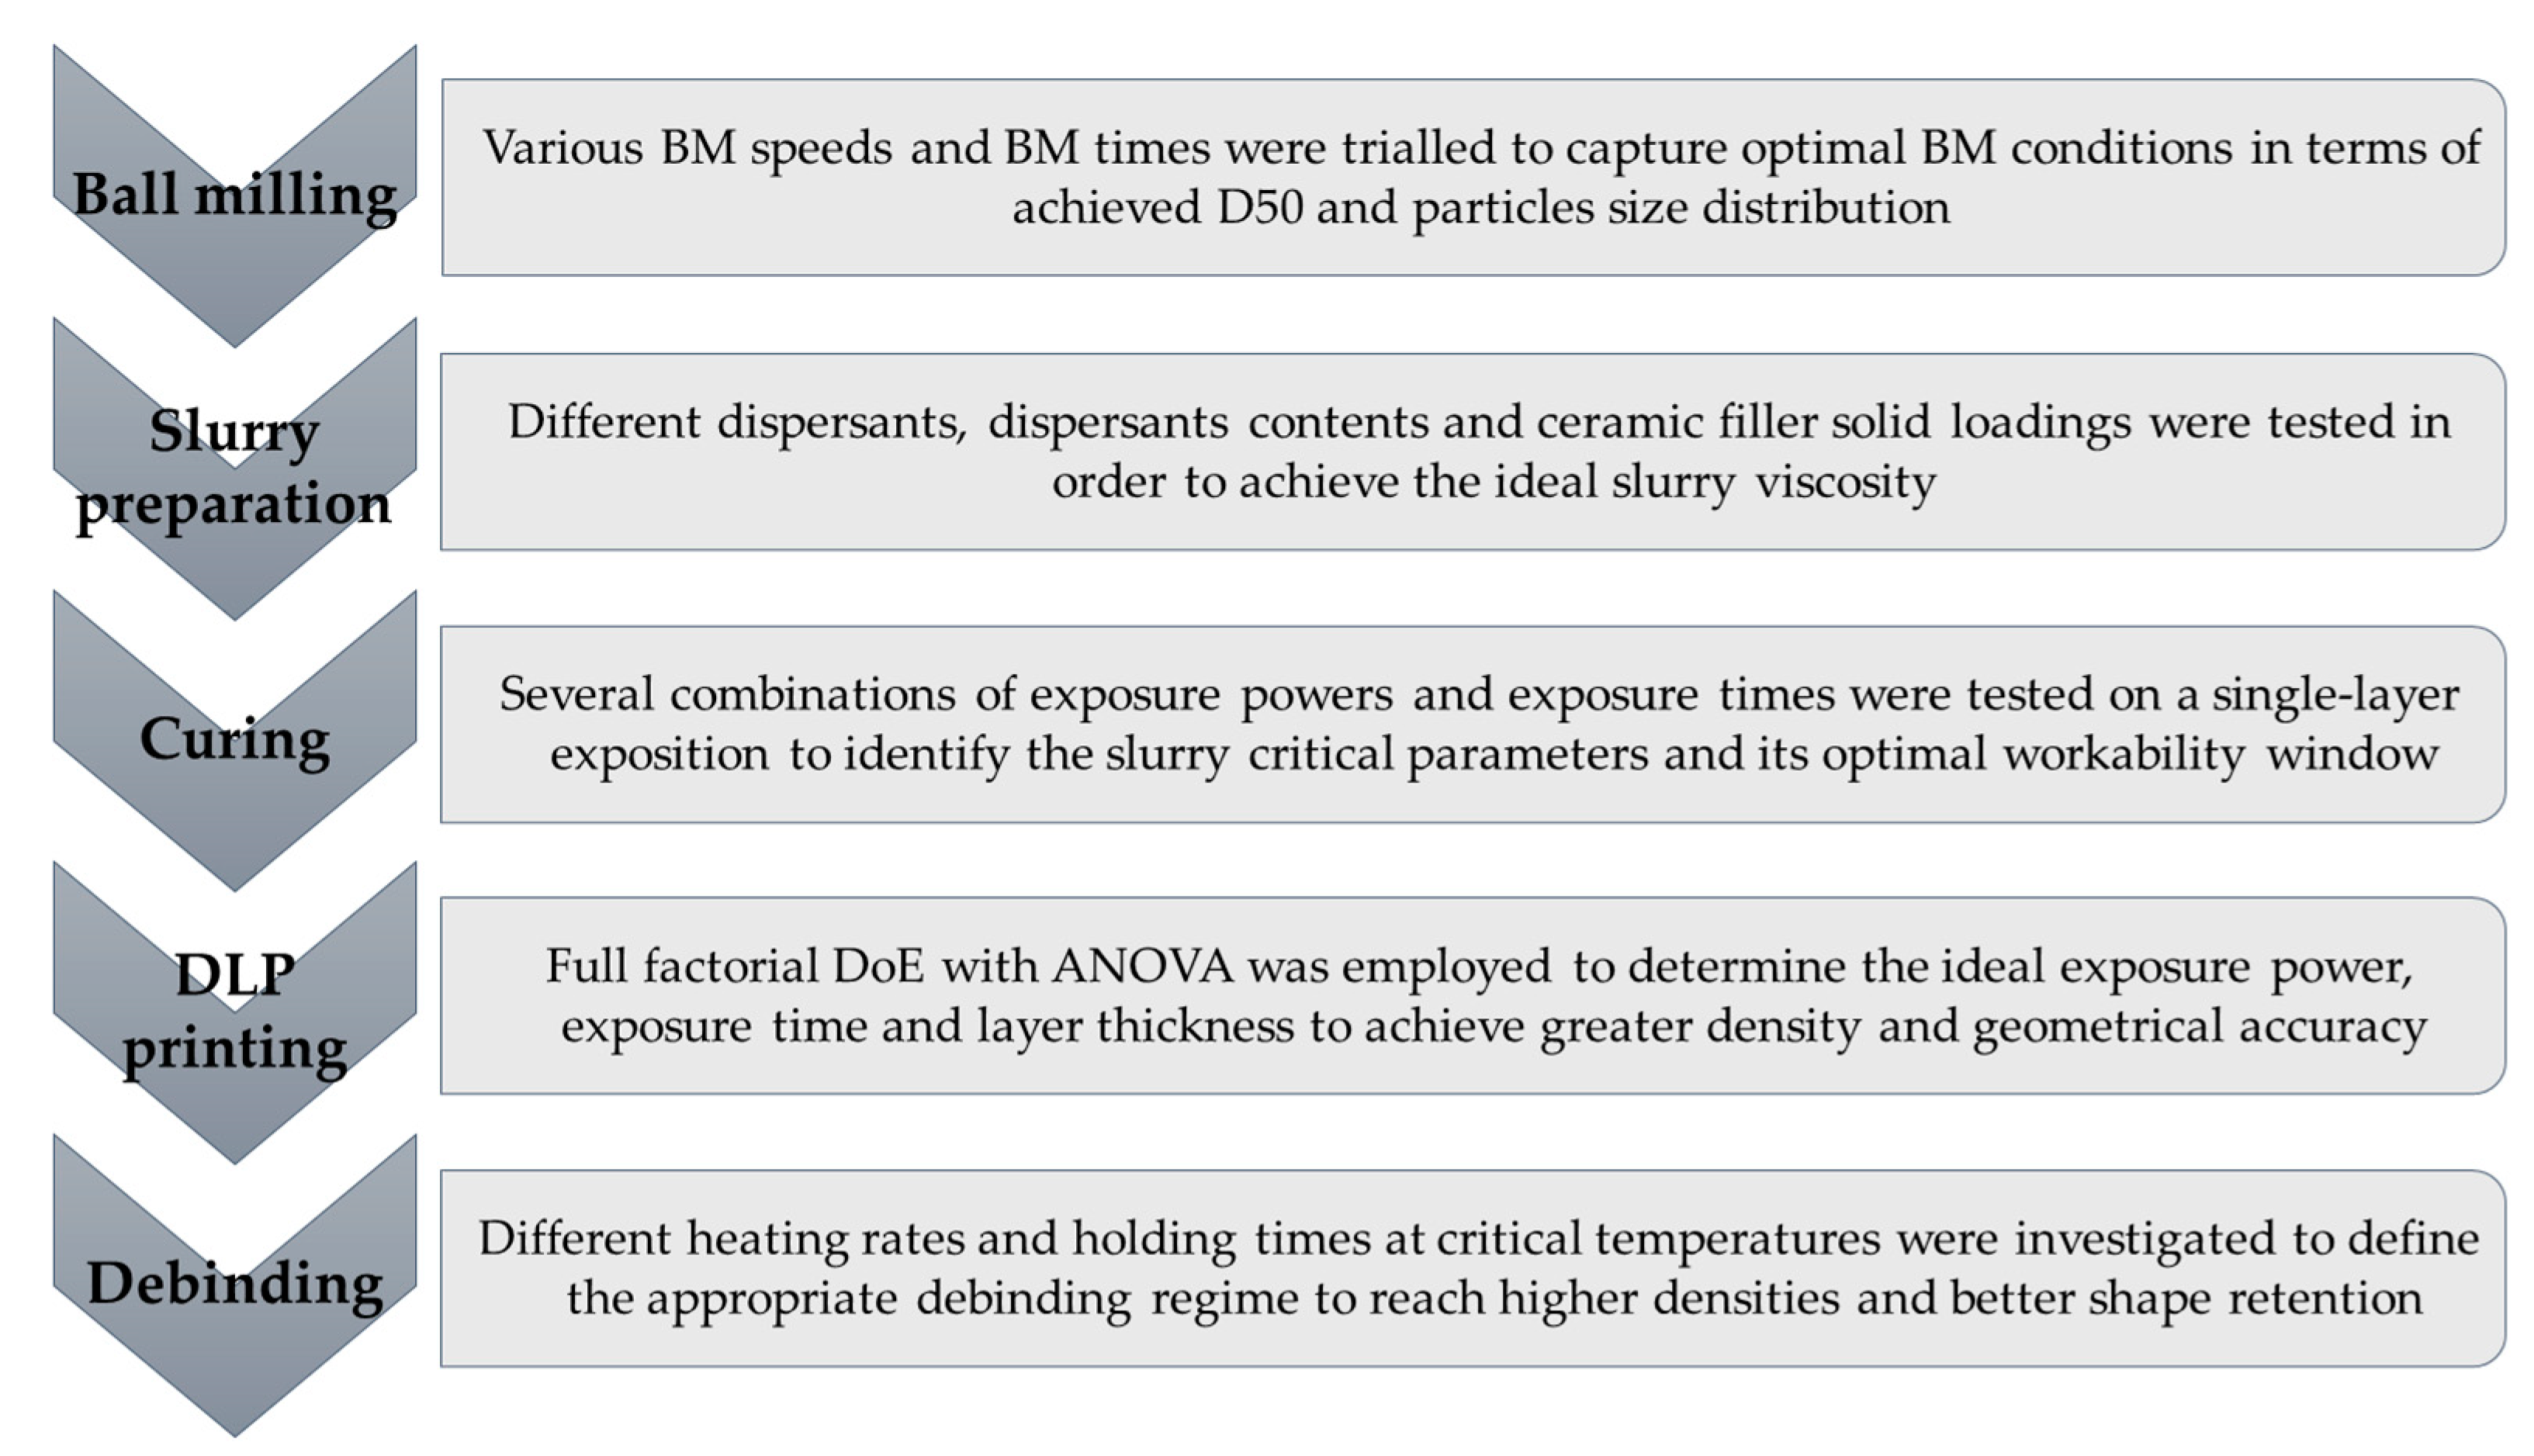
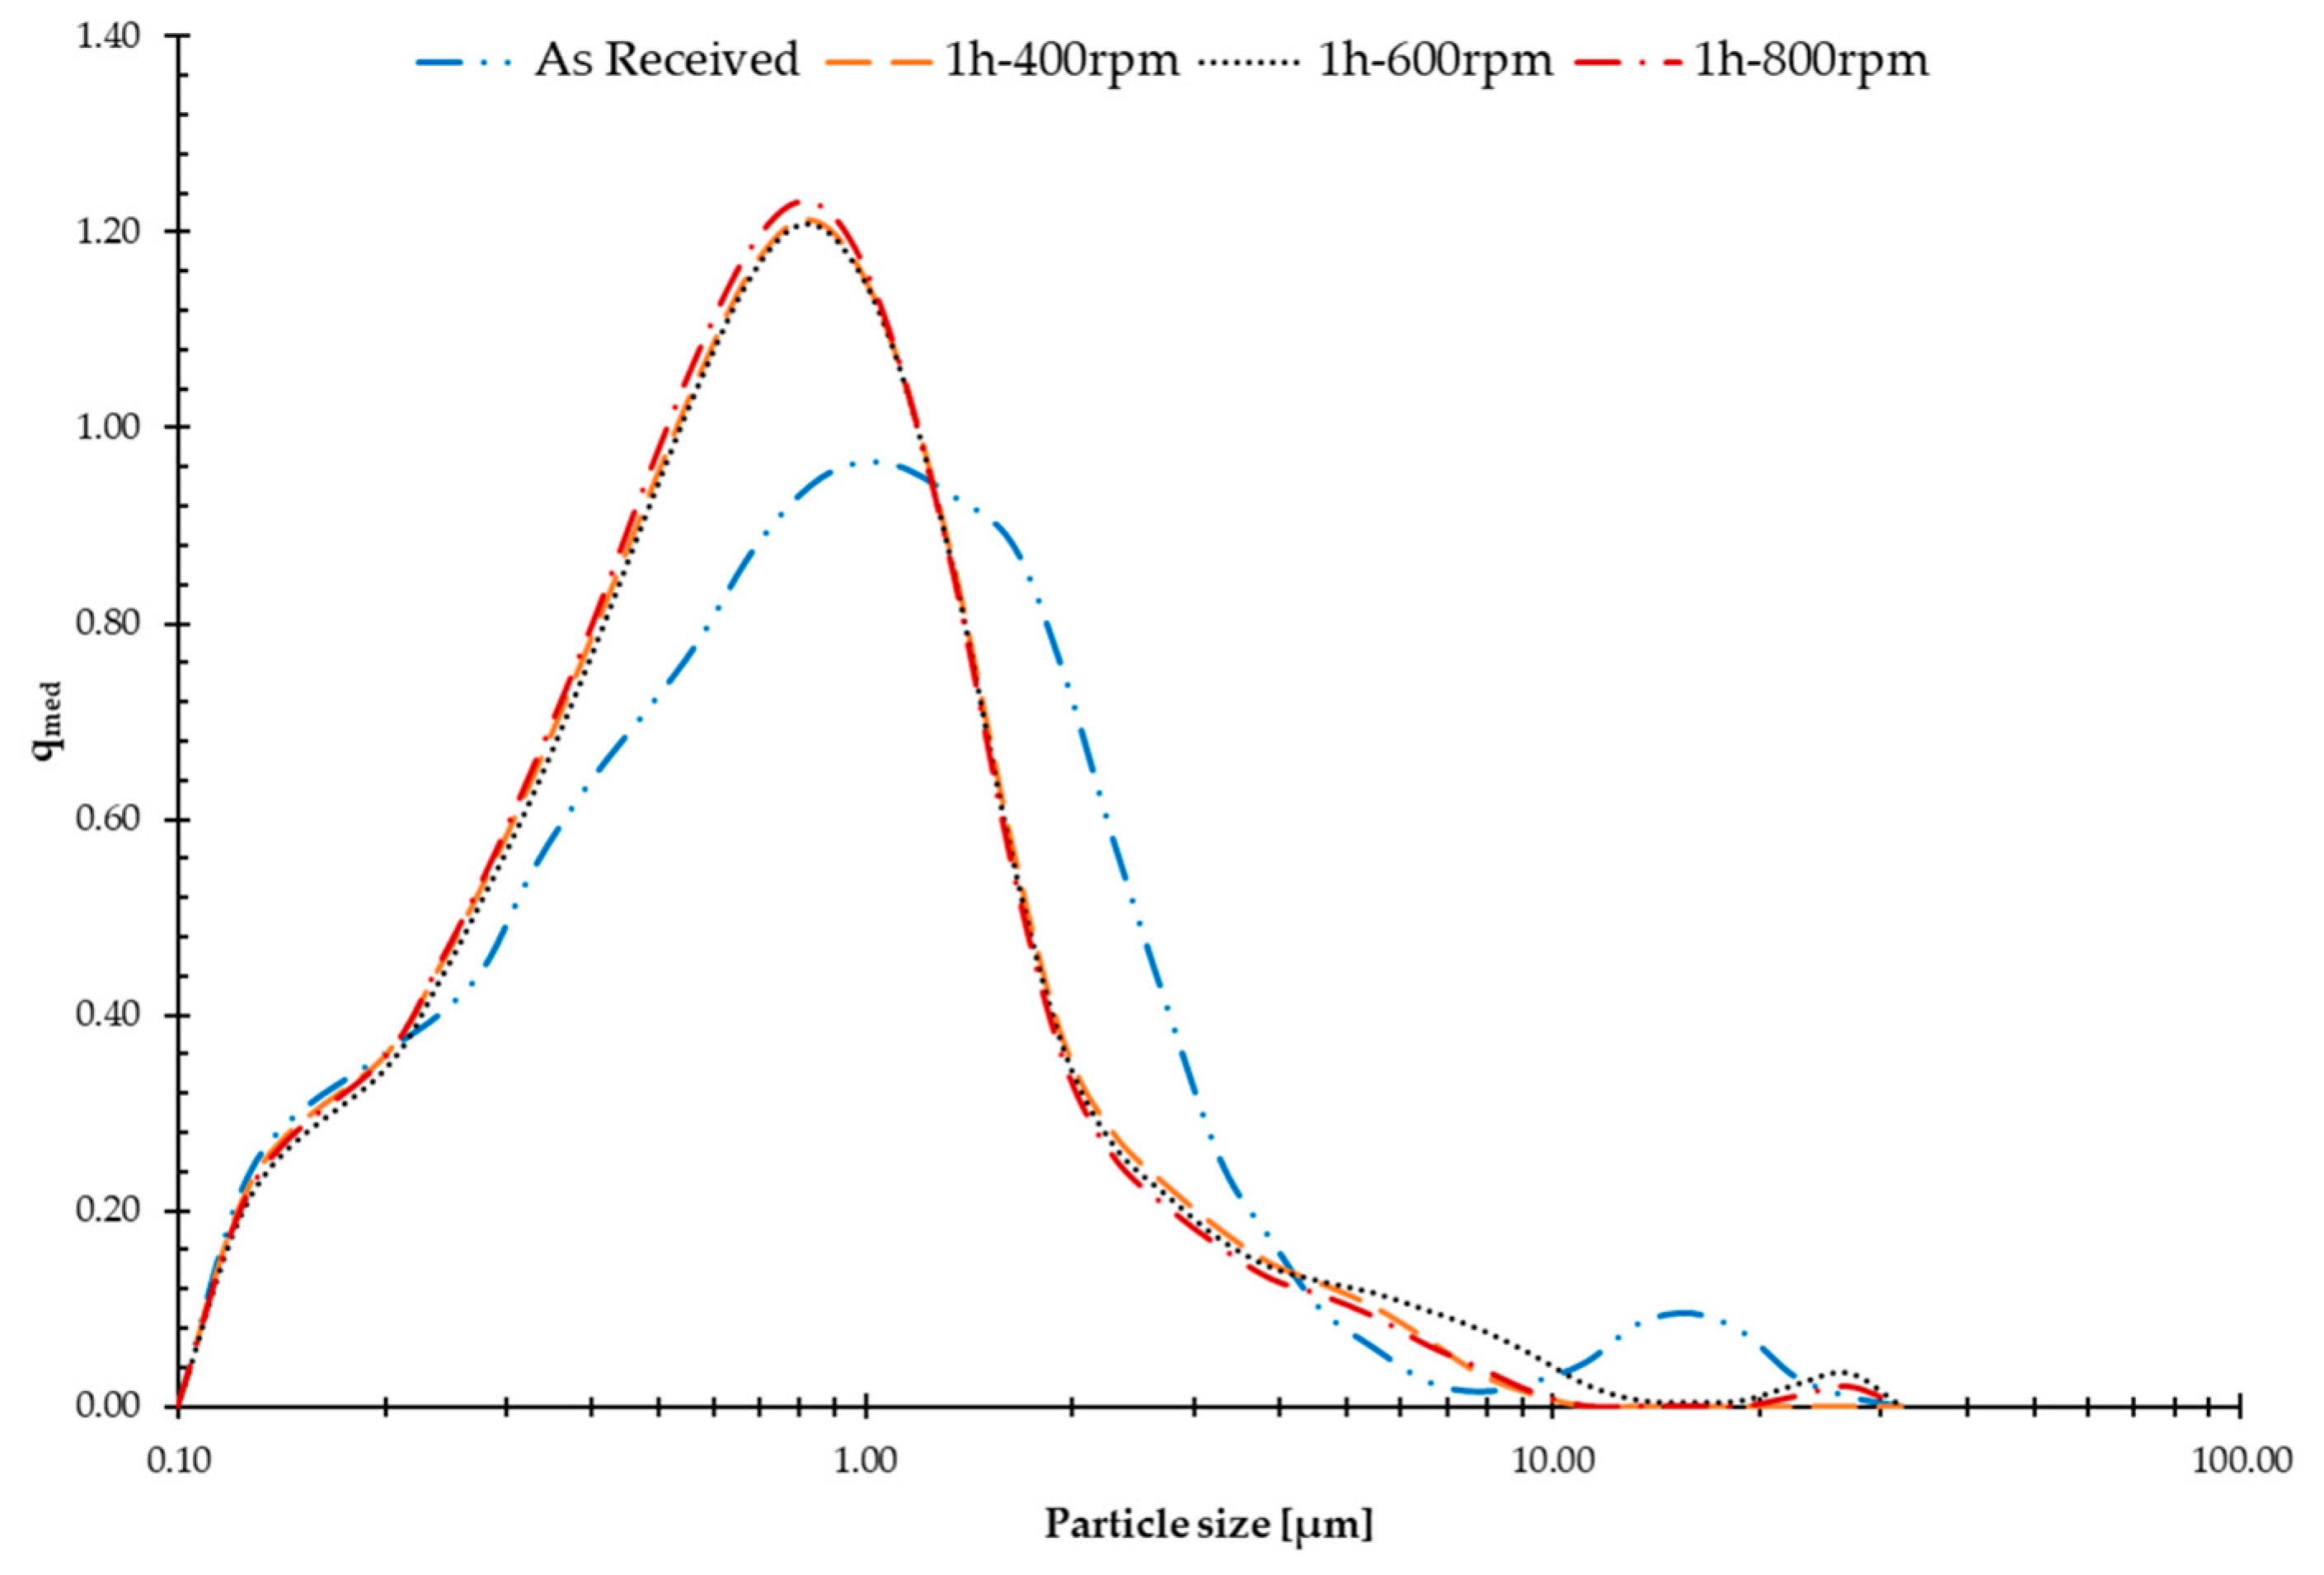
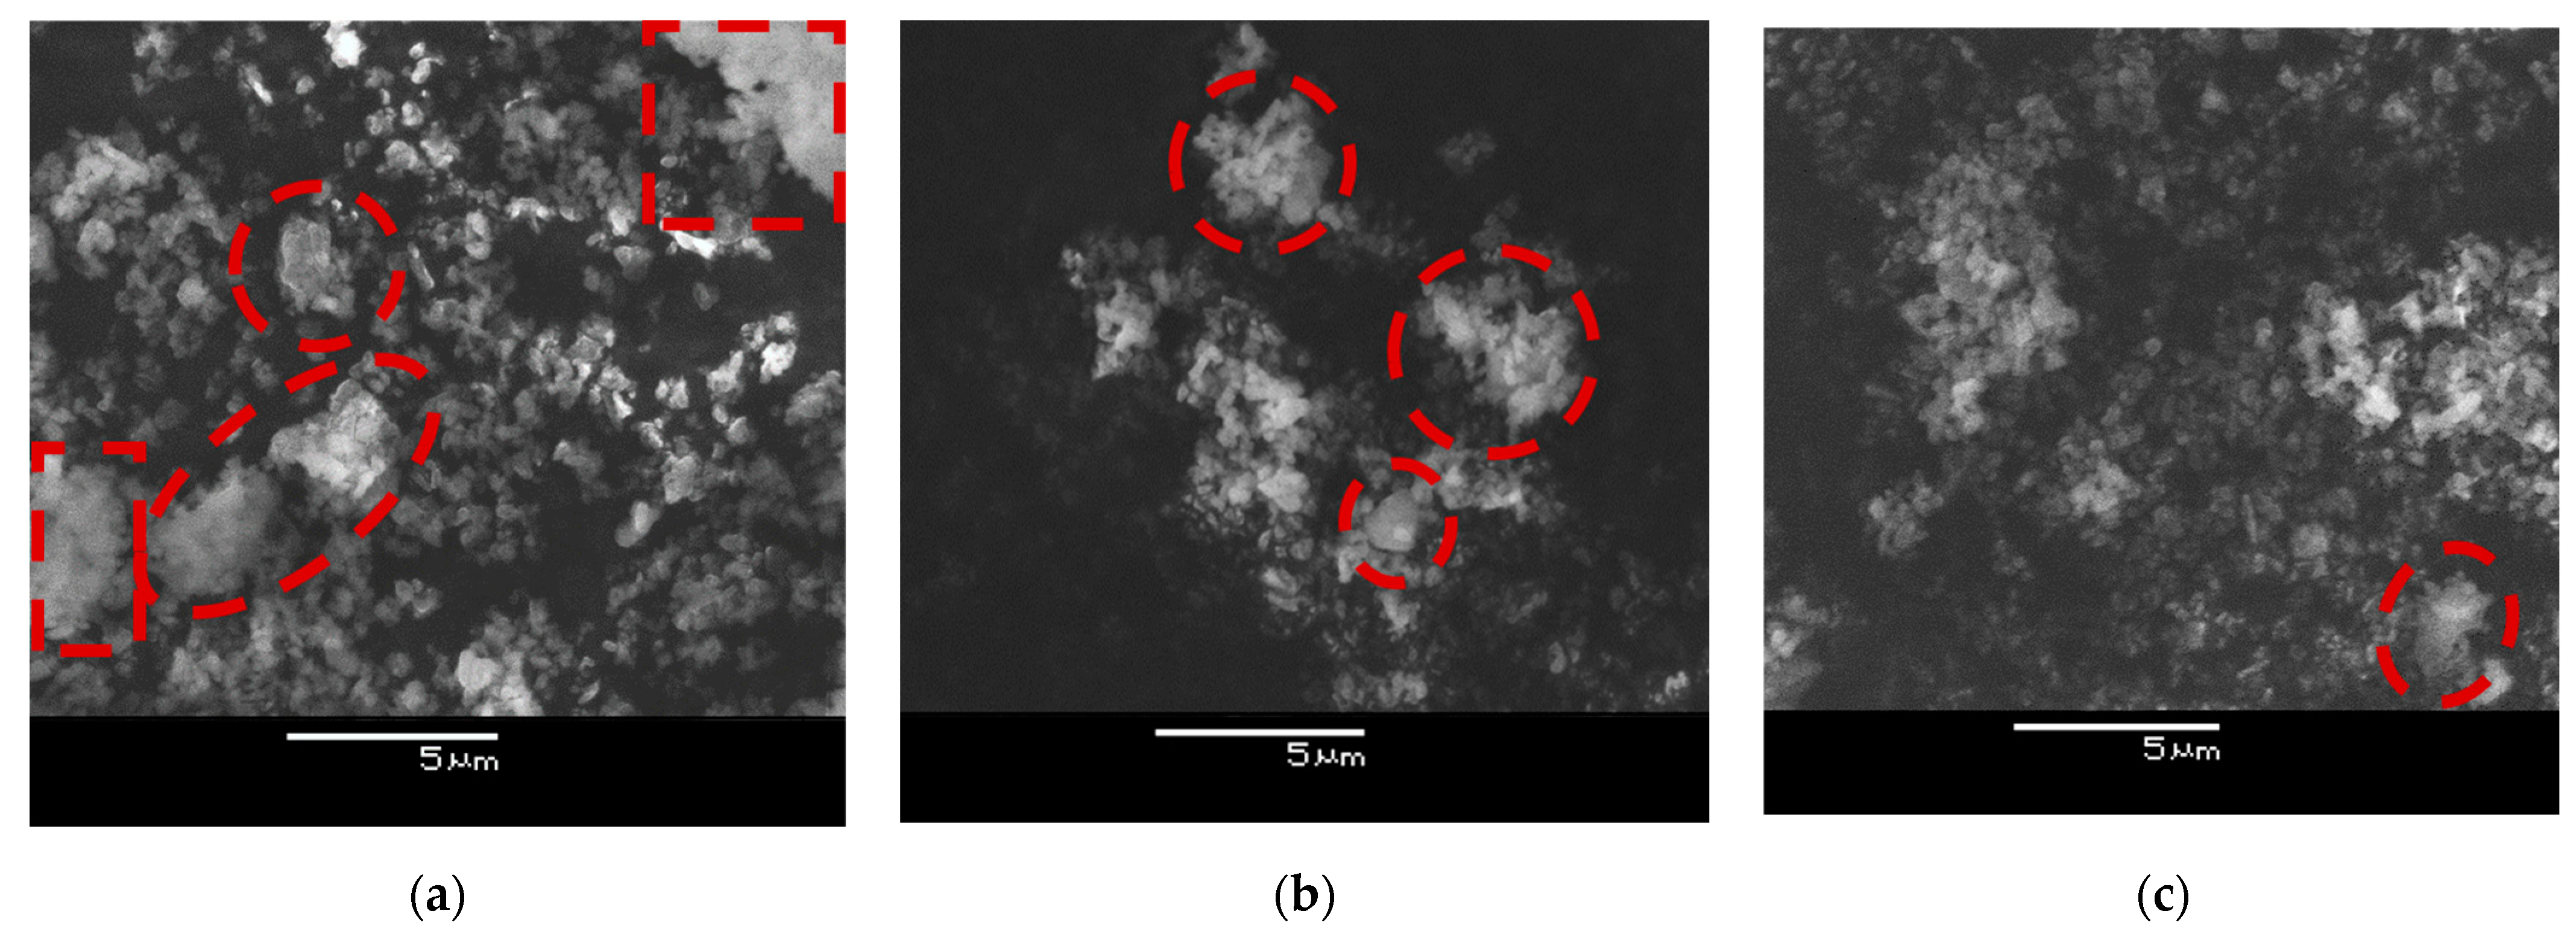
3.1. Ball Milling

The various ball-milling (BM) trials resulted in similar results, as the window explored in terms of milling time was chosen according to the existing literature and was quite restricted, as, in this process chain, the ball milling is a preprocessing step that aims to break the agglomerates in the as-received powder rather than significantly changing the powder-size distribution. In addition, longer ball-milling times would increase the slurry preparation time and, therefore, increase the total time duration of the process chain, the completion of which, in the case of additive manufacturing processes, is already relatively time-expensive. Hence, a tight range for ball-milling time was chosen while the ball-milling speed was allowed to change in a wider range, as reported previously in Table 1. Nevertheless, some of the trials, slightly more than other trials, managed to shift the distribution toward a lower average particle size, while breaking the agglomerates in the micron scale and leaving behind mostly sub-micron particles. For brevity, only the most successful trials are reported in Figure 3.
Even though all the results across all the trials conducted were similar, the results corresponding to the lowest level of BM time succeeded in deagglomerating the as-received powder and shifting the D50 0.92 ± 0.02 µm to ~0.75 µm. However, the run with the highest BM speed and, hence, the highest kinetic energy input, managed to achieve a D50 of 0.71 ± 0.01 µm, while also performing better than the other trials, with the same BM time, at reducing the presence of agglomerates. Furthermore, the samples were analysed under the SEM (Figure 4).
Although it is not easy at these magnifications to obtain high resolution, it can be seen that particles seem more deagglomerated as the BM speed is increased, suggesting that at lower BM times it is preferable to have a high kinetic input to thin out the ceramic powders. As a consequence, combining the results obtained from both PSAs and SEM images, the BM speed of 800 rpm and the BM time of 1 h were chosen to continue the investigation.

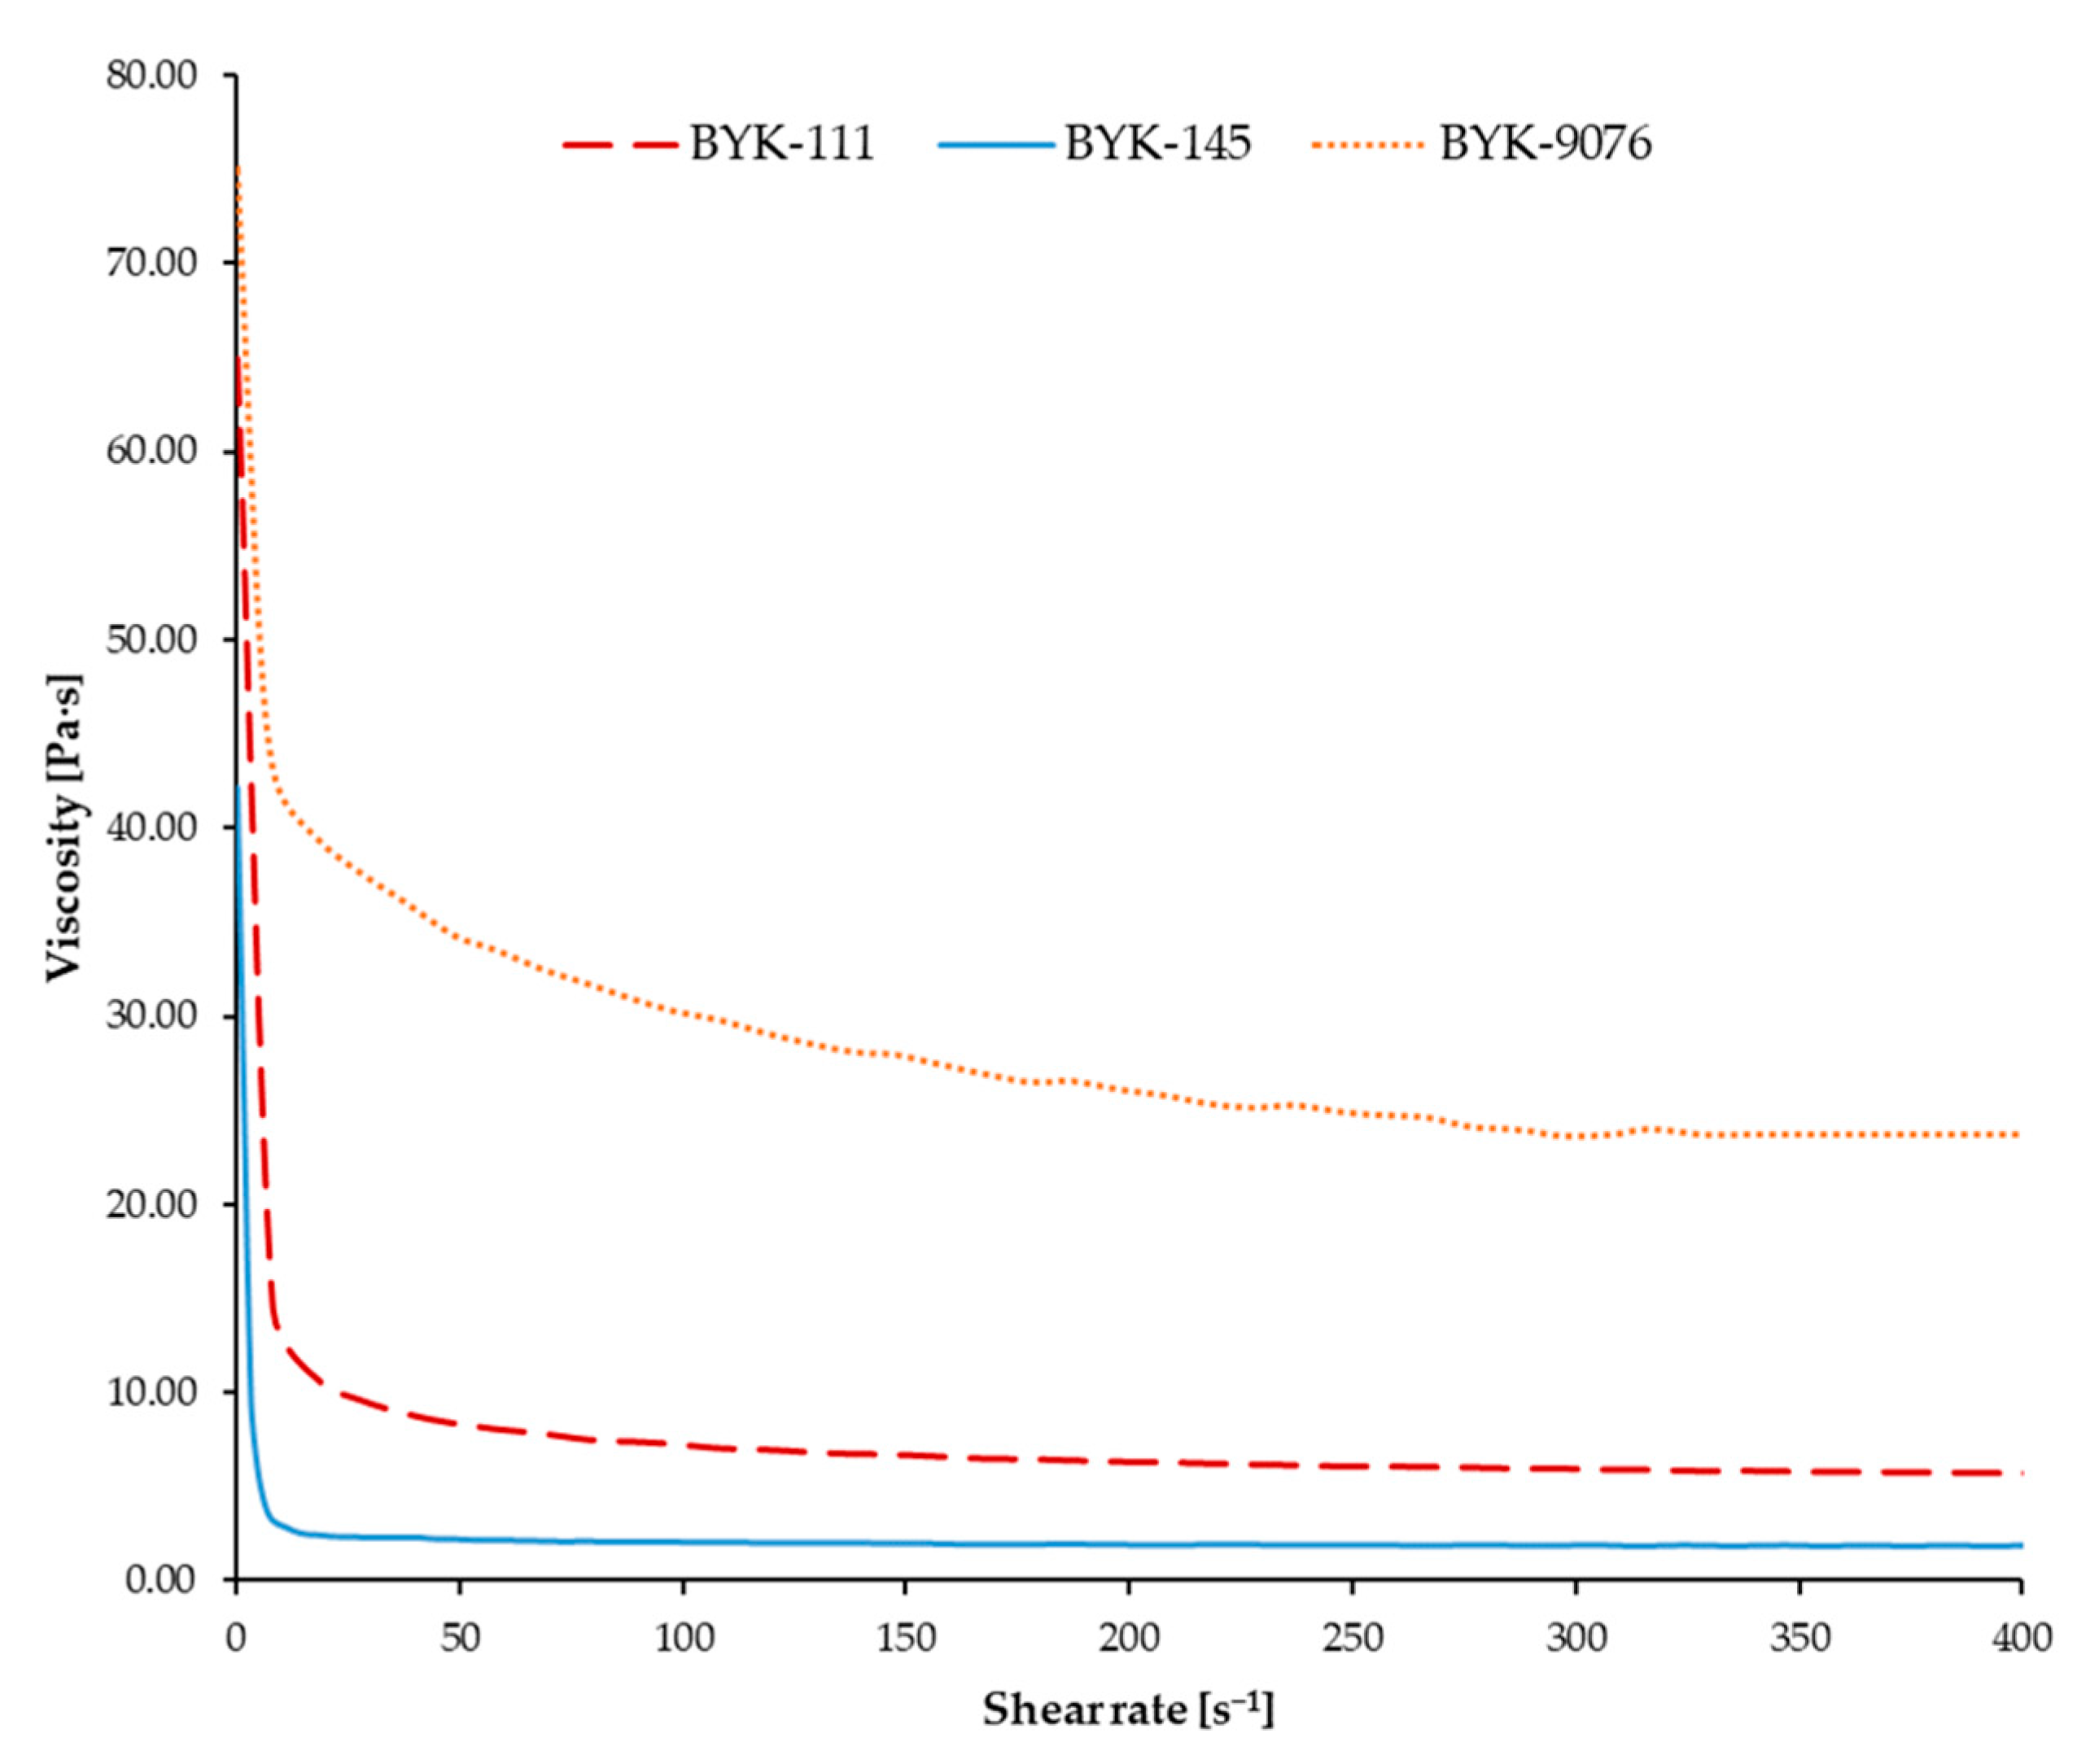
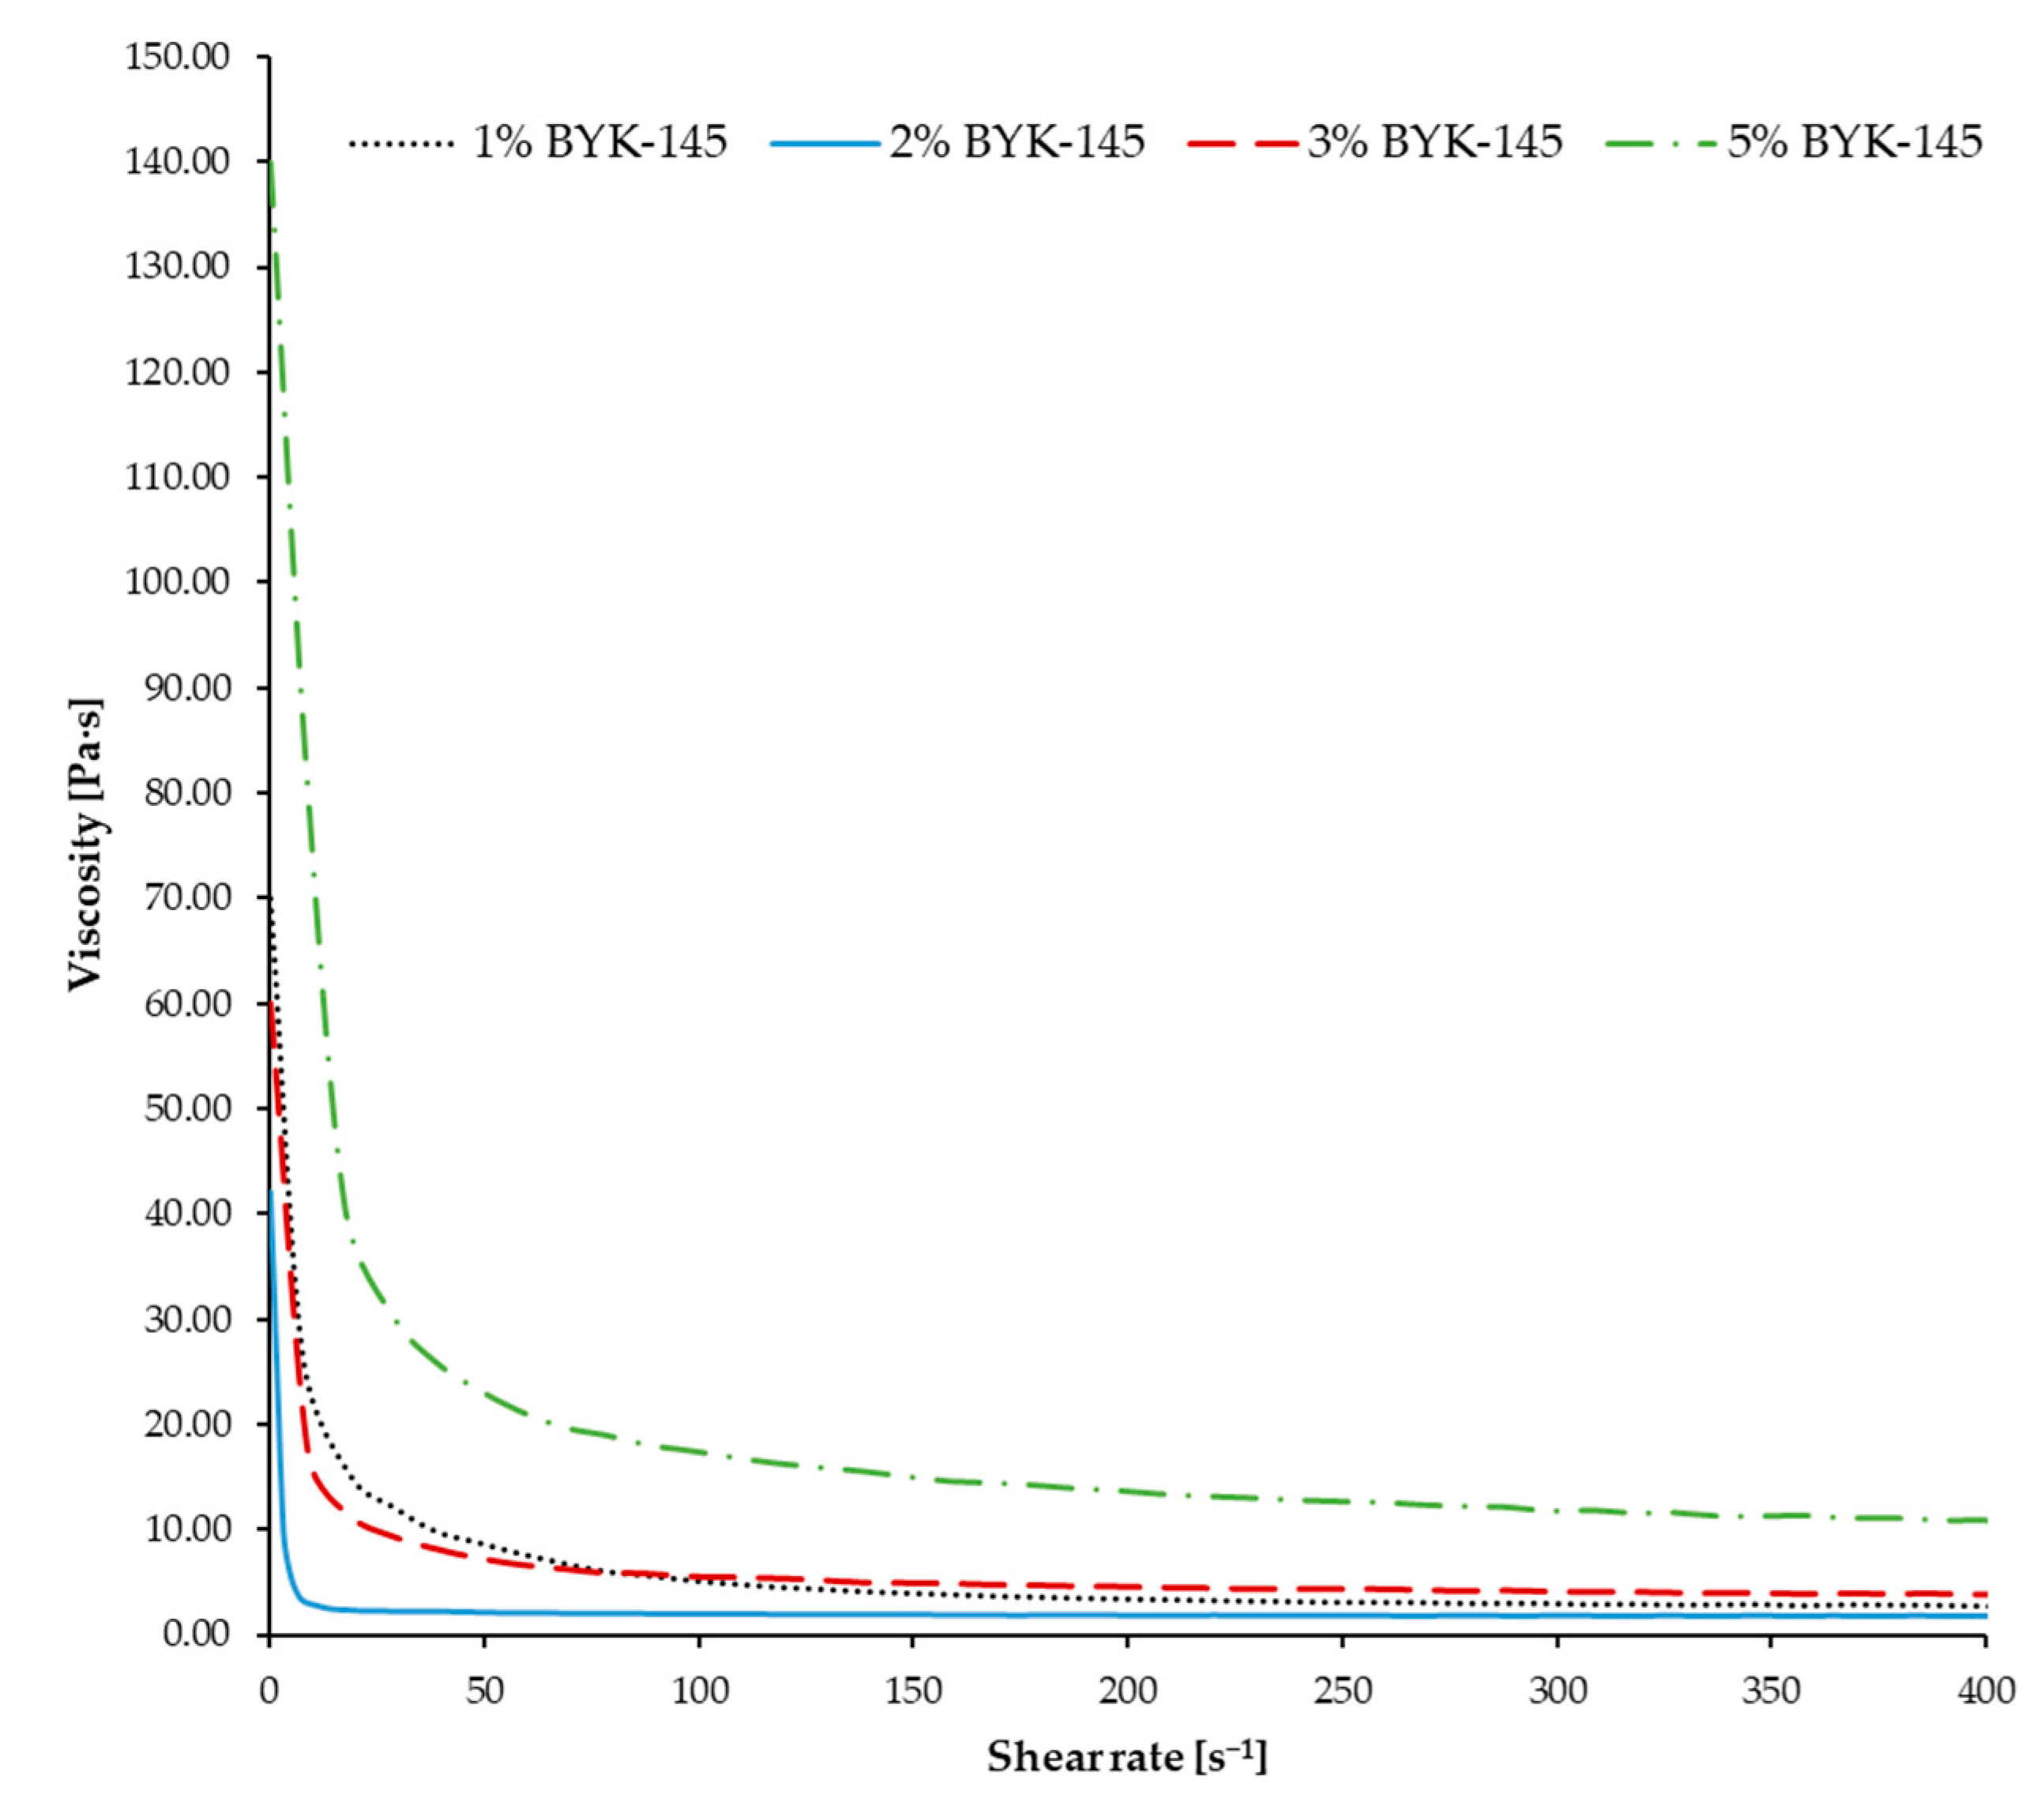
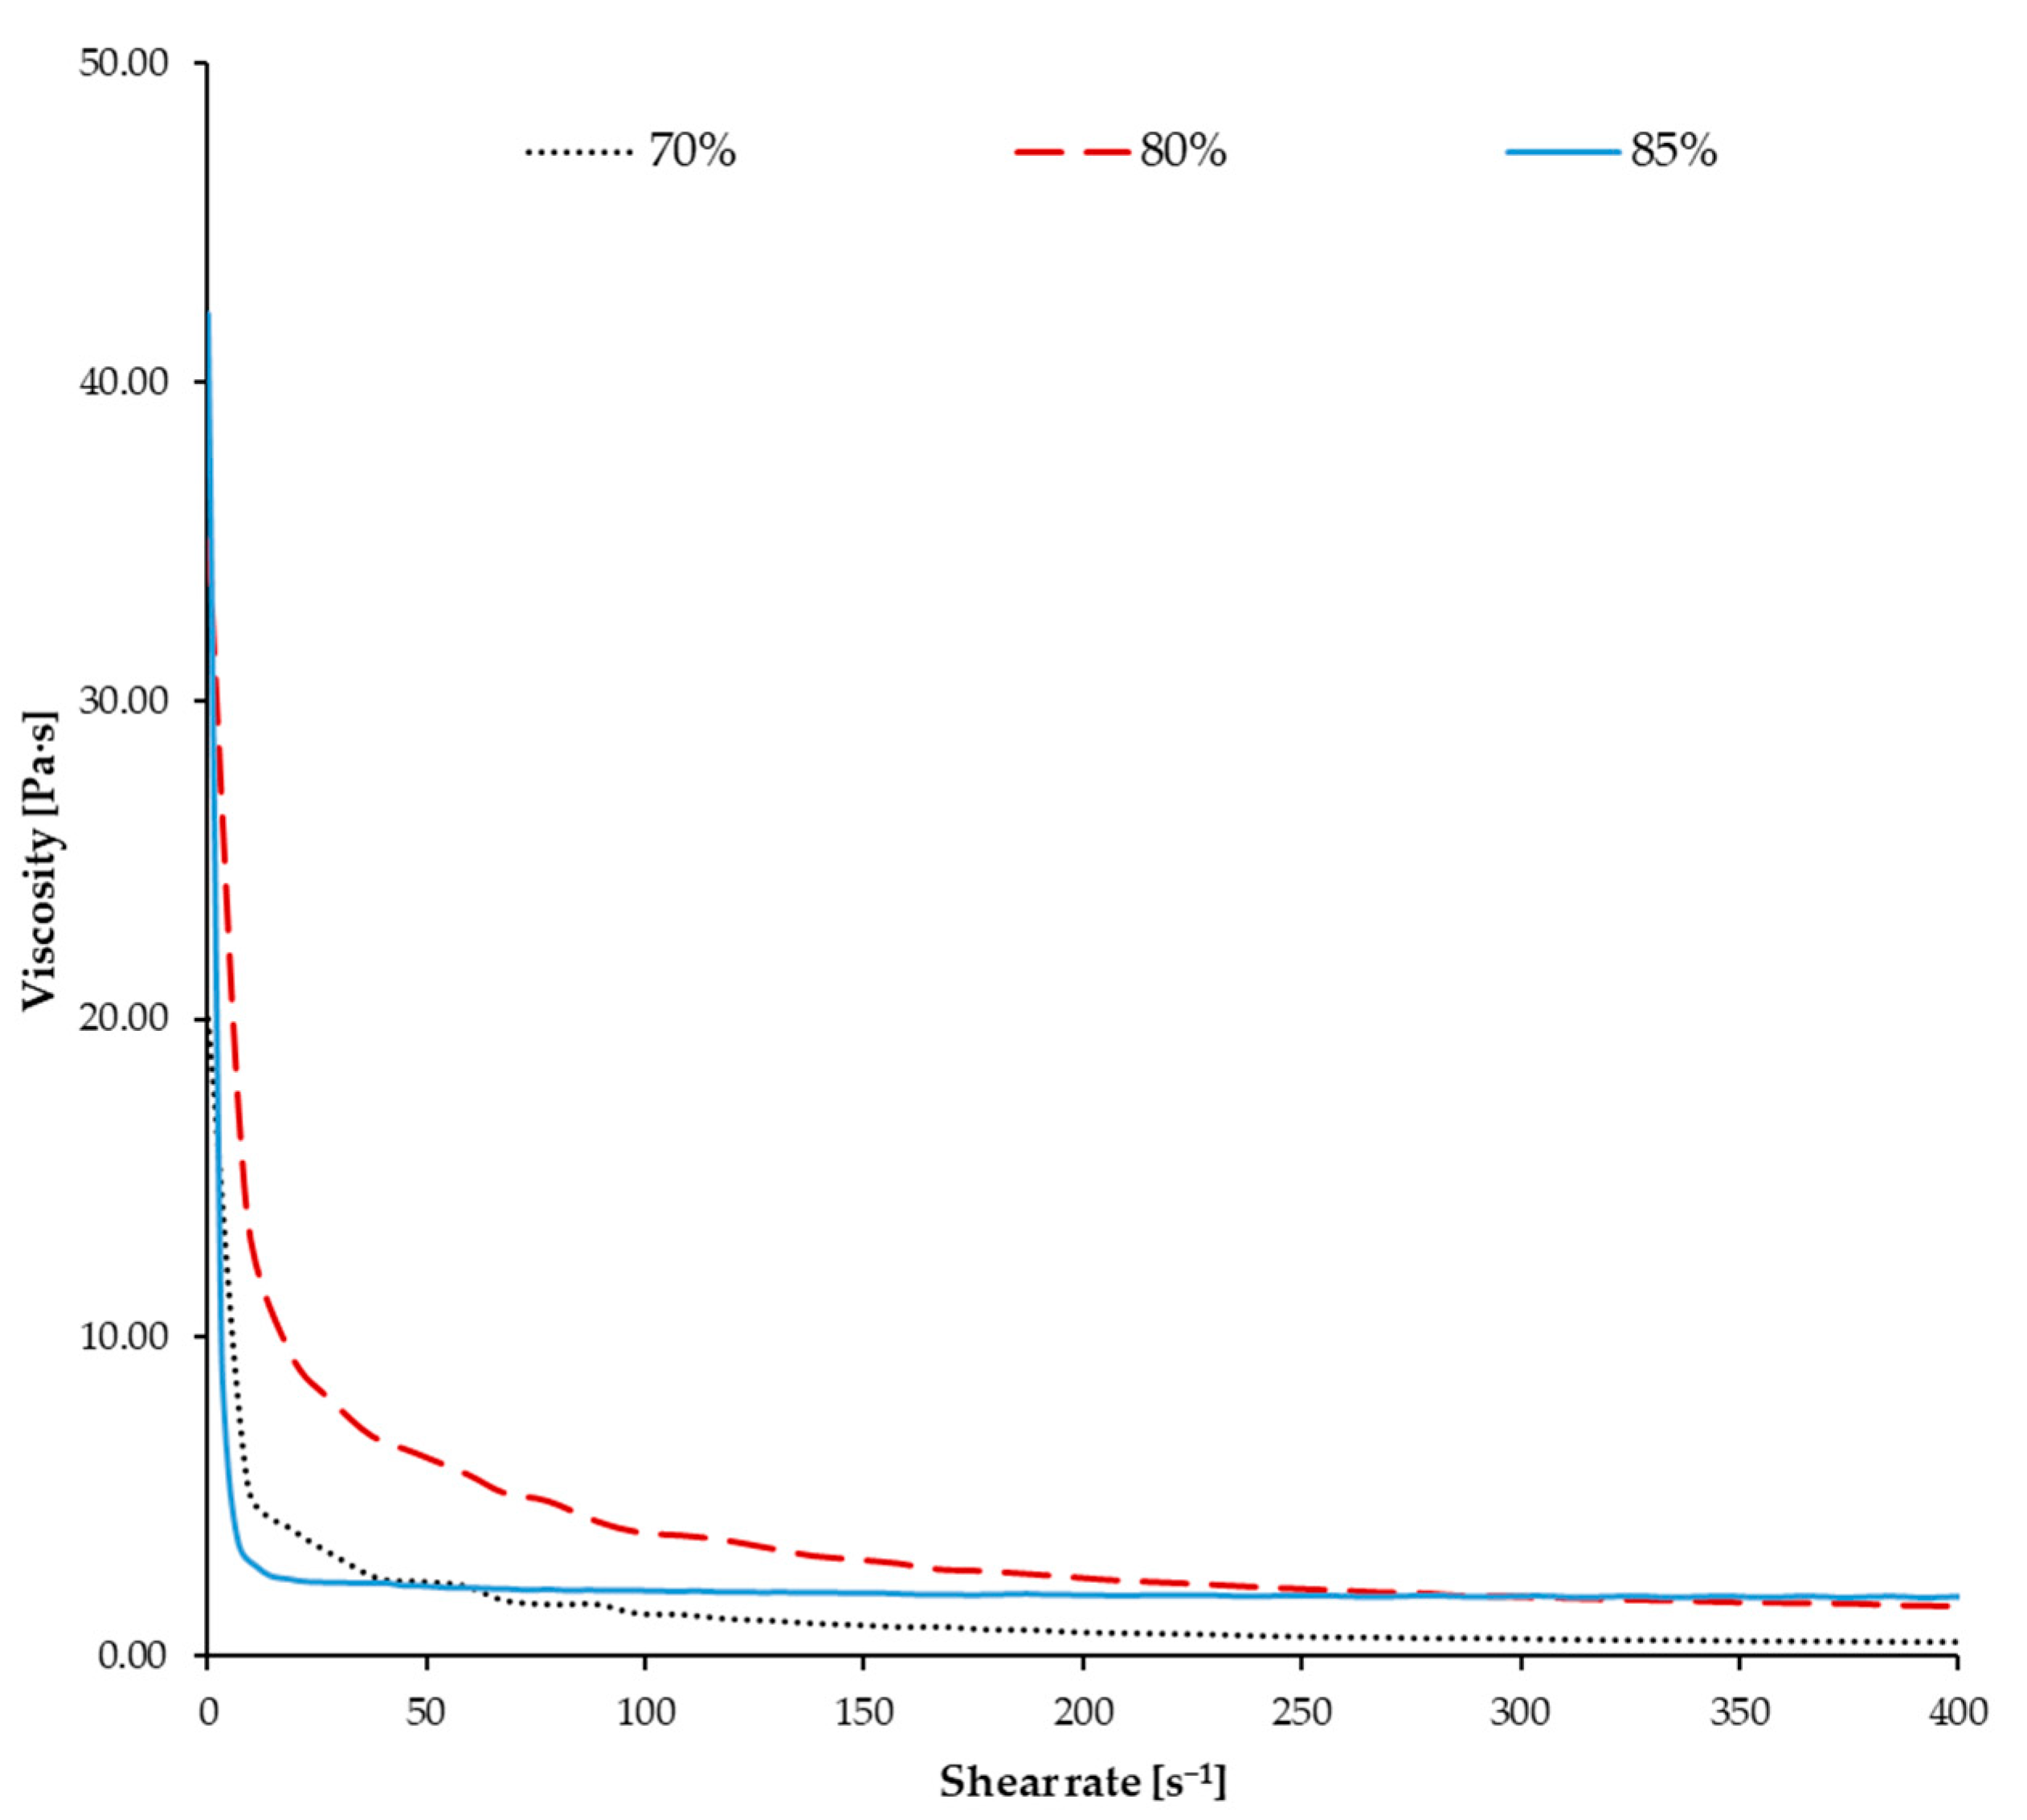
3.2. Slurries Characterisation

First, the rheology of the slurries with the chosen different dispersants was tested; the results are reported in Figure 5. It can be noticed that the viscosity of all the prepared slurries decreases at increasing shear rates and their viscosity does not change relevantly from shear rates higher than 20 s−1, which is the suggested behaviour for slurries that have to be used with Admaflex 130. However, they should have a shear-thinning behaviour with a dynamic viscosity below 10 Pa·s for shear rates between 10 and 300 s−1 [49]. When utilising a doctor blade gap of 120 µm, typical shear rates throughout the process can reach up to 200 s−1 on average. As a matter of fact, the BYK-9076 is not within the workability window previously defined. The slurry with the optimal performance is the one containing BYK-145 as a dispersant, as it possesses the rheology requirements needed to be DLP-printed with Admaflex 130, and both its stability and its lower viscosity, compared to the slurry with BYK-111, allow a better recovering of each layer during the printing process.
After choosing the optimal dispersant, its weight percentage content was varied to understand the different outcomes in terms of viscosity and to comprehend if there was a saturation value beyond which the dispersant is actually agglomerating rather than dispersing. Viscosity tests were then carried out, and the results are plotted in Figure 6.
As can be observed, initially the viscosity of the slurry slightly decreased when increasing the dispersant content from 1 wt.% to 2 wt.%, and it reached a stable value at smaller shear rates, which is the desired behaviour. However, if the content was increased to 3 wt.% or 5 wt.%, the viscosity values in the workability window of Admaflex130 increased. Therefore, the stability of the slurry is degraded if the dispersant concentration is too high [21]. Al2O3 particles are not efficiently modified by the dispersant when the concentration is extremely low; however, when its concentration was appropriately raised to 2 wt.%, the particles’ surface covering is more efficient, resulting in a more stable network of particles [52]. However, at higher concentrations, there is a surplus of dispersant, which promotes flocculation and, hence, increases the viscosity.
Afterwards, the role of the solid loading was examined; the rheology of the various slurries is reported in Figure 7. As expected, the 70 wt.% solid-loaded slurry exhibited a less viscous behaviour, which resulted in a more liquid slurry being unable to remain within the reservoir during the DLP printing and moved via the tape-casting foil system of Admaflex130 without spilling out. This was due to the extremely low viscosity (<1 Pa·s in the window of interest). On the contrary, the 80 wt.% loading resulted in a more viscous slurry than the 85 wt.% loaded slurry at lower shear rates, and slightly less viscous at higher shear rates. It is possible that the quantity of the dispersant was not optimal for the former, so the particles were flocculating at lower shear rates; however, as higher percentages of solid loading facilitate the densification of the finished samples while reducing the shrinkage and, hence, the insurgence of cracks due to the geometrical modifications, the 85 wt.% was preferred as it also showed better properties without further studies. The 90 wt.% solid-loaded slurry was also prepared, even though it was expected that increasing the packing fraction would have rapidly increased the suspension viscosity [53]. In fact, its consistency was more similar to a powder rather than a slurry, even after long mixing and varying the percentage of dispersant. This was essentially due to the reduction of the average distance between the ceramic particles when the solid loading was increased; as a consequence, a relevant increase in the friction between them resulted in a higher viscosity [54]. Therefore, it was concluded that such a high solid loading was not viable and the 85 wt.% solid-loaded slurry was selected for the continuation of the study.

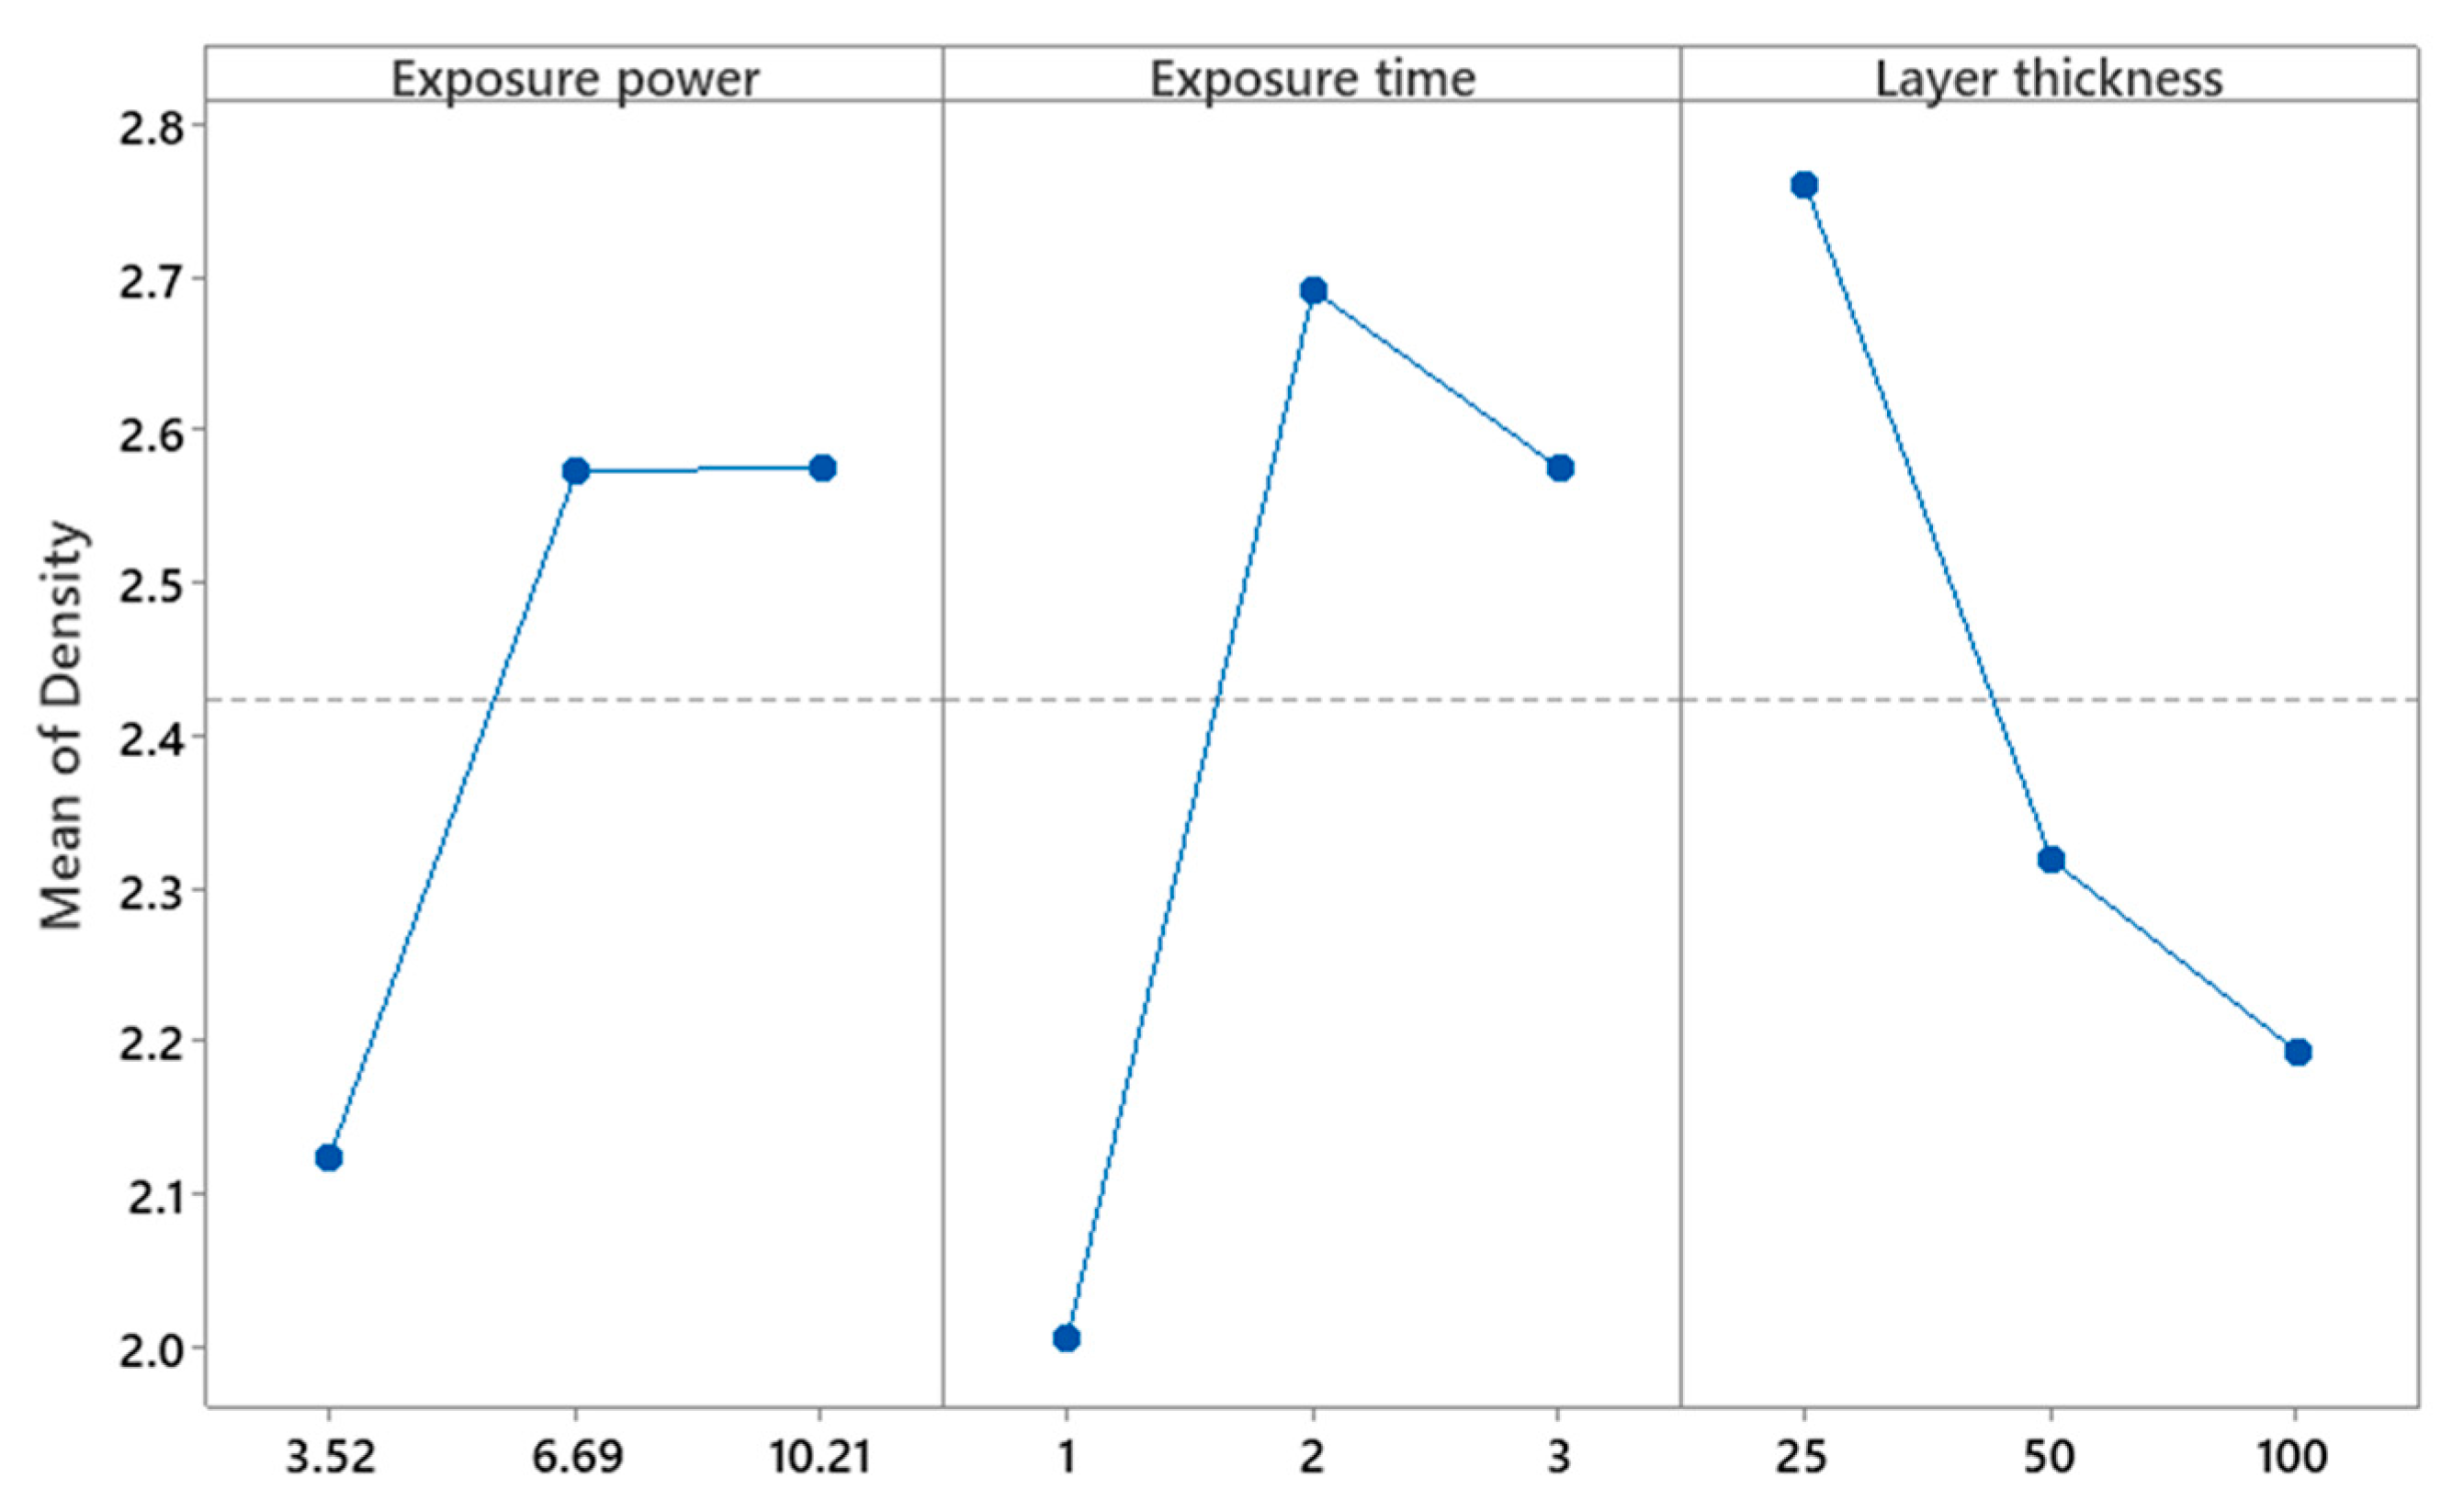
3.3. Curing Behaviour and DLP Printing

The curing behaviour of the selected slurry was analysed by registering several cure depth values at different exposure times and powers, which are reported in Figure 8.
The values of Dp and Ec can be deducted from the linear regression of the collected data and, in particular, Dp = 59.018 µm and Ec = 1.399 mJ/cm2. While the latter is compatible with a highly reactive slurry, the former describes a slurry that permits better control of lateral definition, as smaller values of Dp promote higher resolution [55]. In addition, even though all the values were registered while using different exposure parameters, all the collected data points lay acceptably around the trend line obtained from the linear regression with a good correlation coefficient, demonstrating that Dp and Ec are independent of the exposure conditions [51].
Afterwards, the printing trials were started following the schedule established through the DOE. Among all the trials undertaken, the 25 µm layer thickness samples were the most successful in terms of the density achieved and the fidelity of the dimensions to the starting CAD design (CAD diameter = 20 mm; CAD plate side = 15 mm) and, in particular, the ones corresponding to the lowest level of exposure power were the most outstanding, as can be seen in Figure 9 for discs and Figure 10 for plates.
The highest setting of power produced inaccurate parts with a high deviation from the corresponding dimension modelled via CAD and, also, a significant standard deviation, as the results were less predictable due to the light scattering phenomenon. Since the energy input was too high, the respective cure depth was the equivalent of a few layers which, hence, were irradiated many times repeatedly. In the case of an exposure time of 3 s and an exposure power of 150‰, the same layer was irradiated almost 10 times, as can be deducted from Figure 8; naturally, this caused relevant overcuring, dimensional inaccuracies, and higher standard deviations (Figure 11). Therefore, parts produced with the lowest exposure power among the samples printed with a layer thickness of 25 µm were considered the best ones (Figure 12) and, specifically, the parts that were exposed for 2 s and 3 s were labelled as the optimal ones, due to their good geometrical accuracy and final green density.
For the discs and plates with layer thicknesses of 50 µm and 100 µm, the samples that were tried to be produced at the lowest level of power and exposure time failed, as the energy input was probably not sufficient for guaranteeing enough light penetration to stick two consecutive layers in a stable way. Other conditions were all printed with different outcomes. Since the energy delivered to the layer in the same printing conditions, in terms of exposure time and power, was the same but the volume to which it was delivered was different, the samples with higher layer thickness failed or were mechanically weaker at lower energy input conditions, but survived successfully without heavy distortions or deviations at higher energetic conditions. However, due to the fact that for a specified thickness, the number of layers diminishes with the increase of the layer thickness, the 50 µm and, in particular, the 100 µm samples lacked a good interlayer cohesion, resulting in samples that had to be handled carefully and were slightly bendable. On the other hand, the 25 µm samples were more compacted and rigid and, thus, achieved a greater density, which was the main objective for producing, in the end, translucent parts. It was interesting to notice that, in general, across all the samples, an increase in the exposure time level, rather than an increase in the exposure power level when the same energy dose was delivered, led to better results, suggesting that the management of the exposure time is more significant than the management of exposure power. In fact, the slower energy delivery to the slurry when longer exposure times and lower exposure powers are adopted allows the layers of the green parts to be cured more gradually from the uncured slurry surface directly exposed to the DLP projector up to the previously cured layers within the curing depth, ensuring a more stable printing, better interlayer bonding, and increasing geometric accuracy. On the contrary, conveying the same energy dose by utilising higher exposure power levels and lower exposure times is more similar to an impulsive input of energy, which is less controllable and less accurate, resulting in a horizontal overcuring on the layer plane. Therefore, combinations of lower exposure powers and longer exposure times should be preferred when the optimal energy dose is already determined. It is very important to select the optimal set of parameters, as final sintered parts properties are dependent on the curing process during DLP printing, since the polymerisation grade of the green parts directly affects the bonded geometry of the unsintered alumina [56]. In addition, the high solid loading of small-sized ceramic particles ensures that the achievable final density is higher, as the capability to reach a greater sustainable packing factor allows a better densification [57].
Table 5 reports the significance values for the parameters investigated and their interactions, as obtained from Minitab 21, when density is imposed as the response to analyse, while Figure 13 and Figure 14 illustrate the factorial plots for the density.
Following the previous findings that confirmed that the significant process parameters consisted of the exposure time and its interaction with the exposure power, since their significance value was p < 0.05, the printing parameters of 25 µm as layer thickness, 2 s as exposure time, and 50‰ as exposure power were considered the optimal parameters and were selected to print more discs for the following debinding experiments. It must be noted that the low values of mean density corresponding to the lowest levels of exposure power and time were mainly due to the failed trials for the 50 µm and 100 µm layer thicknesses.

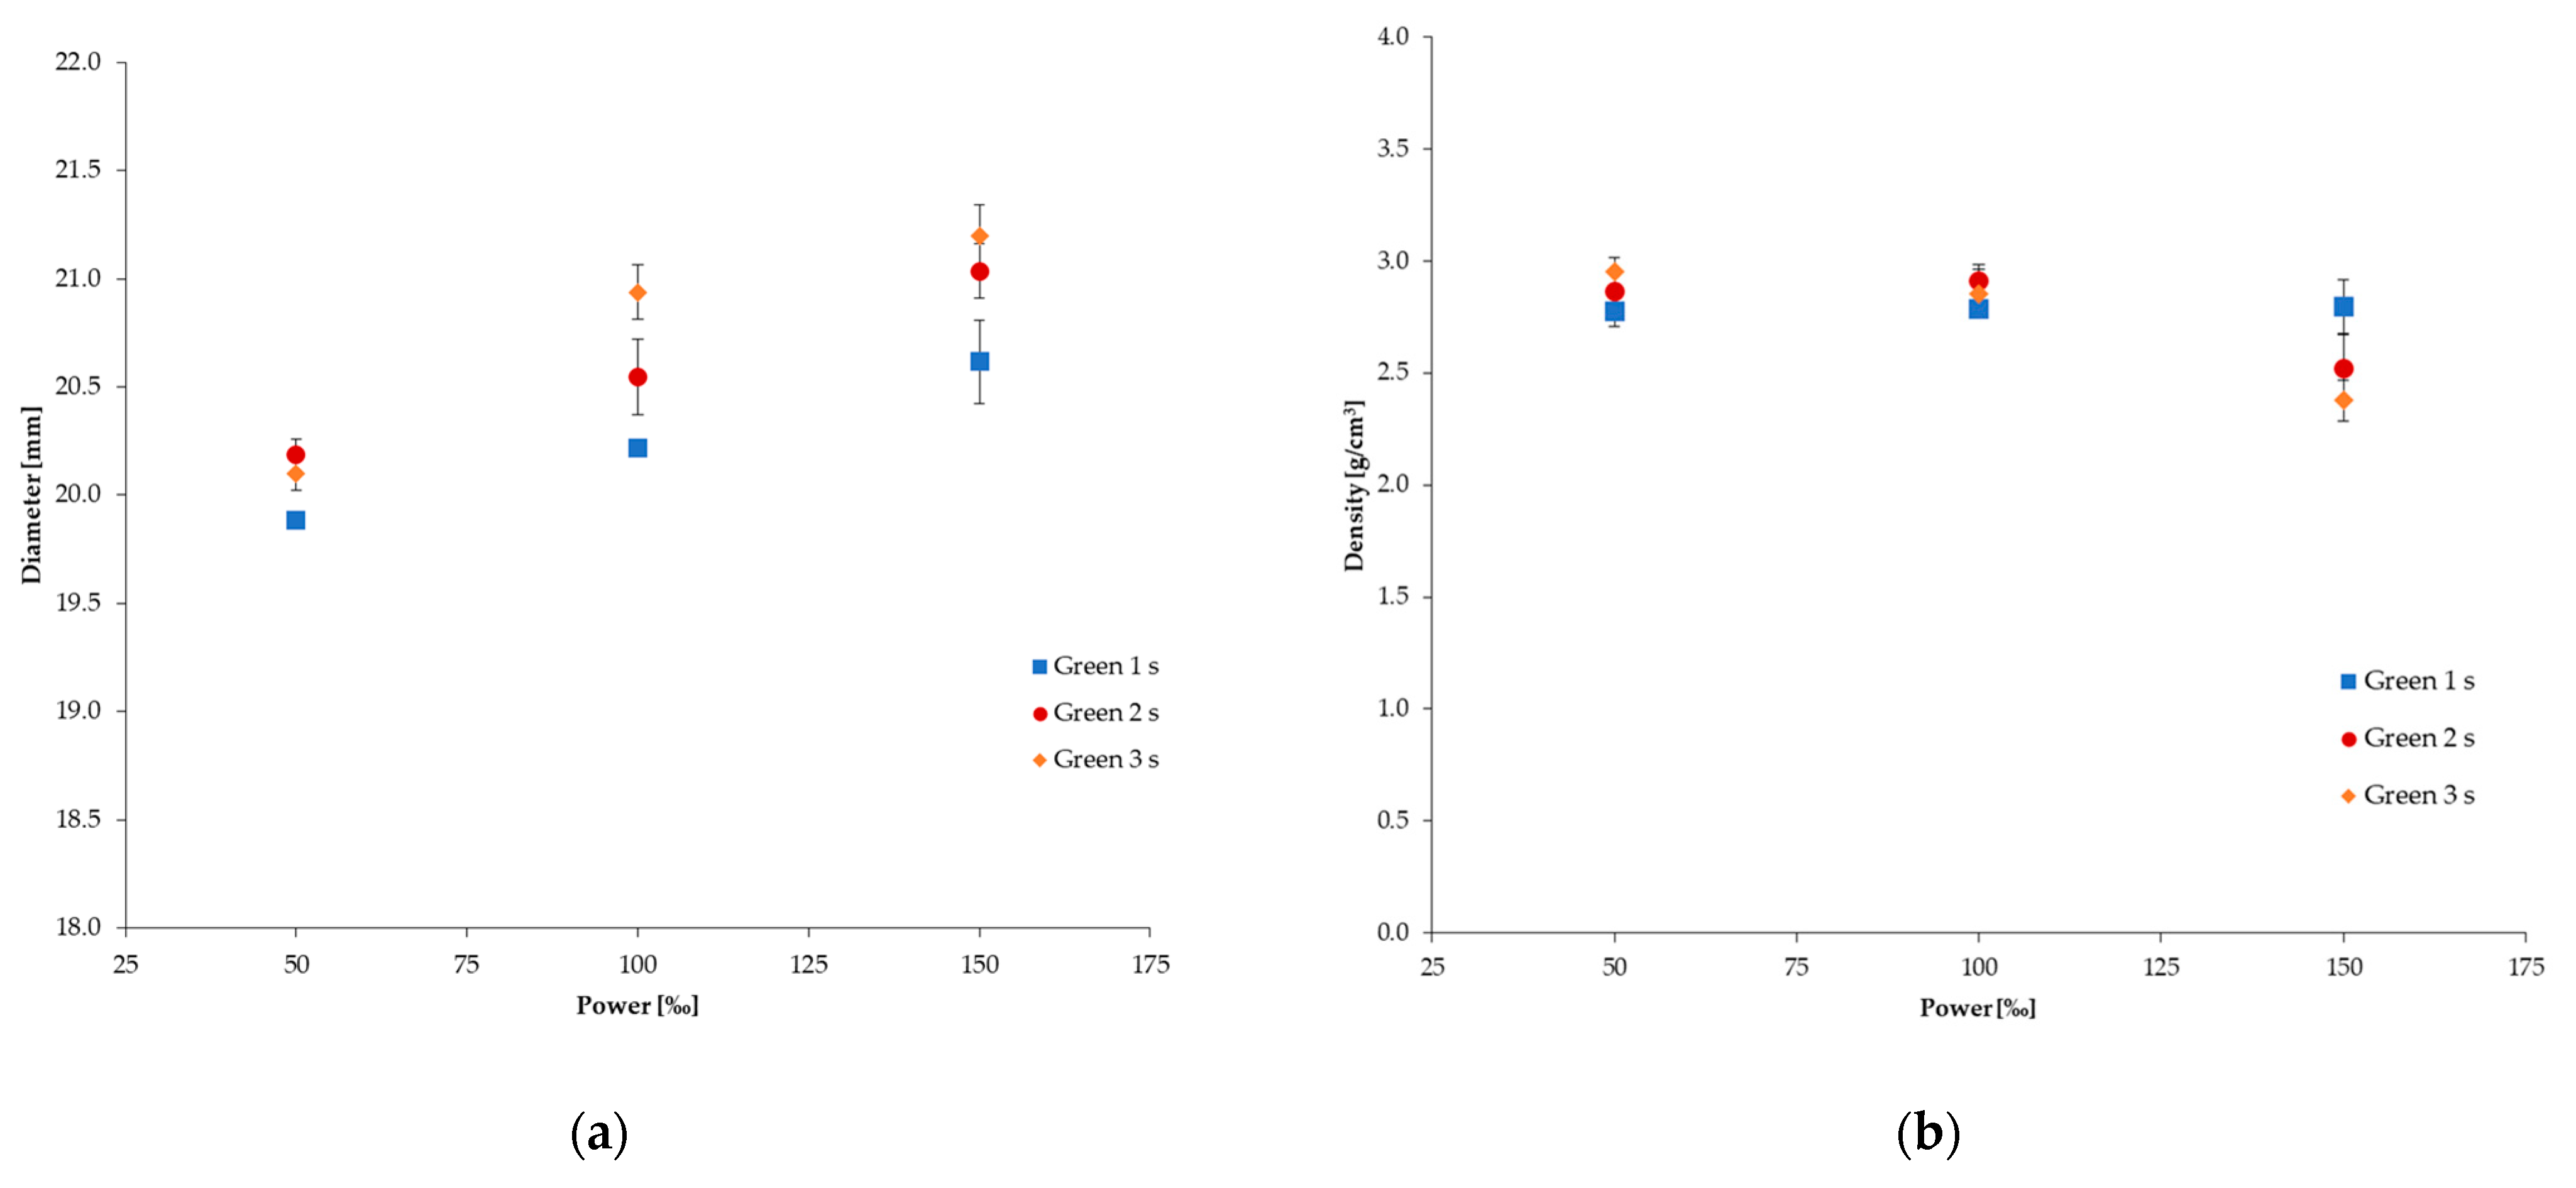
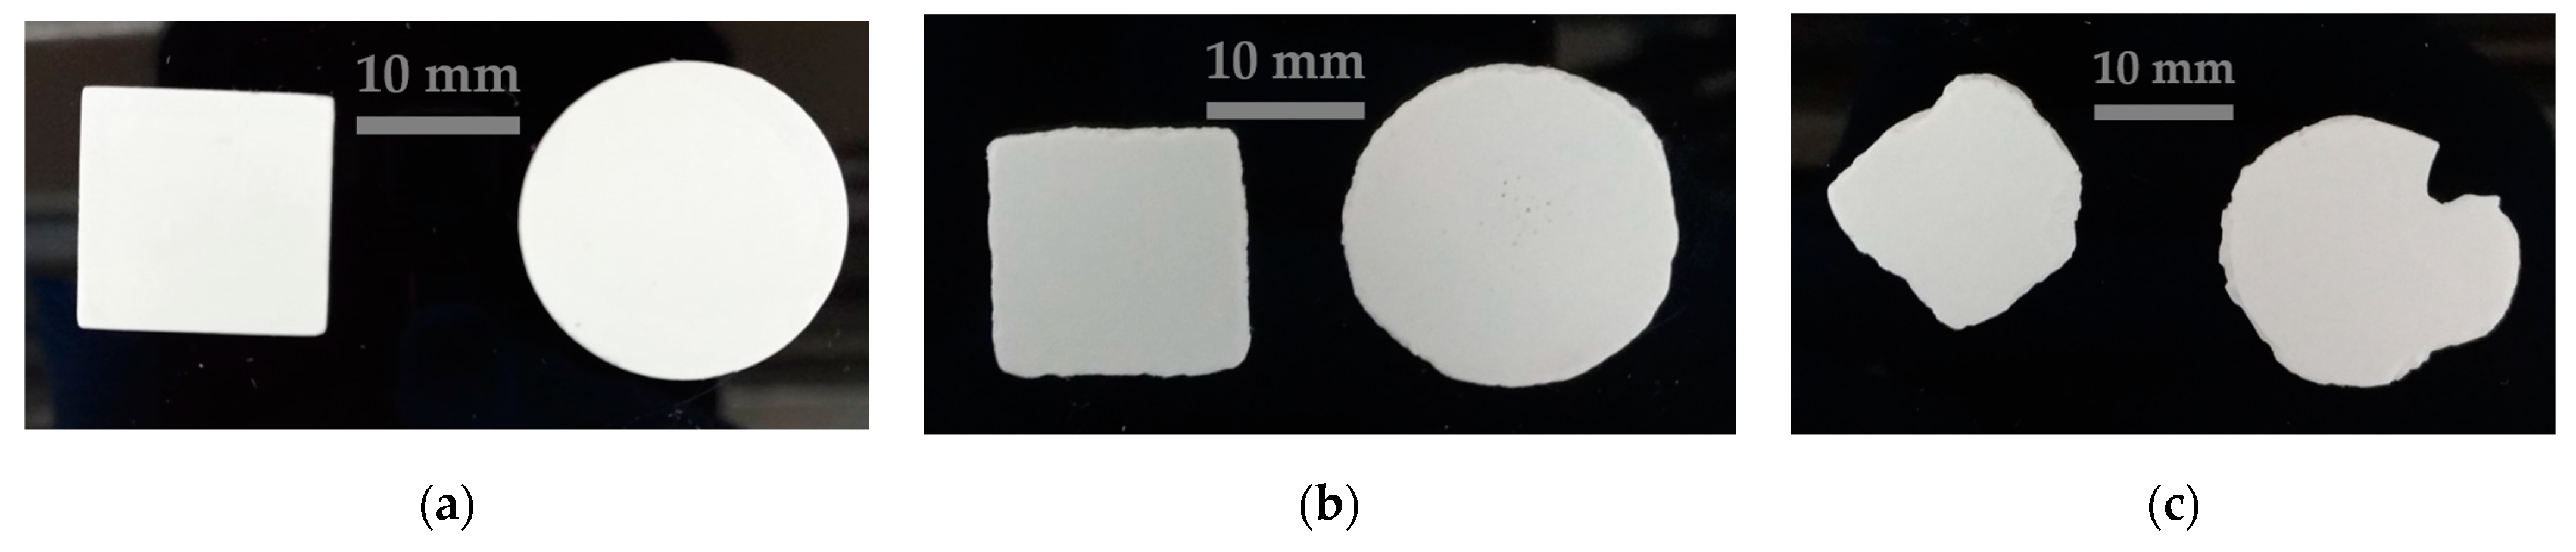
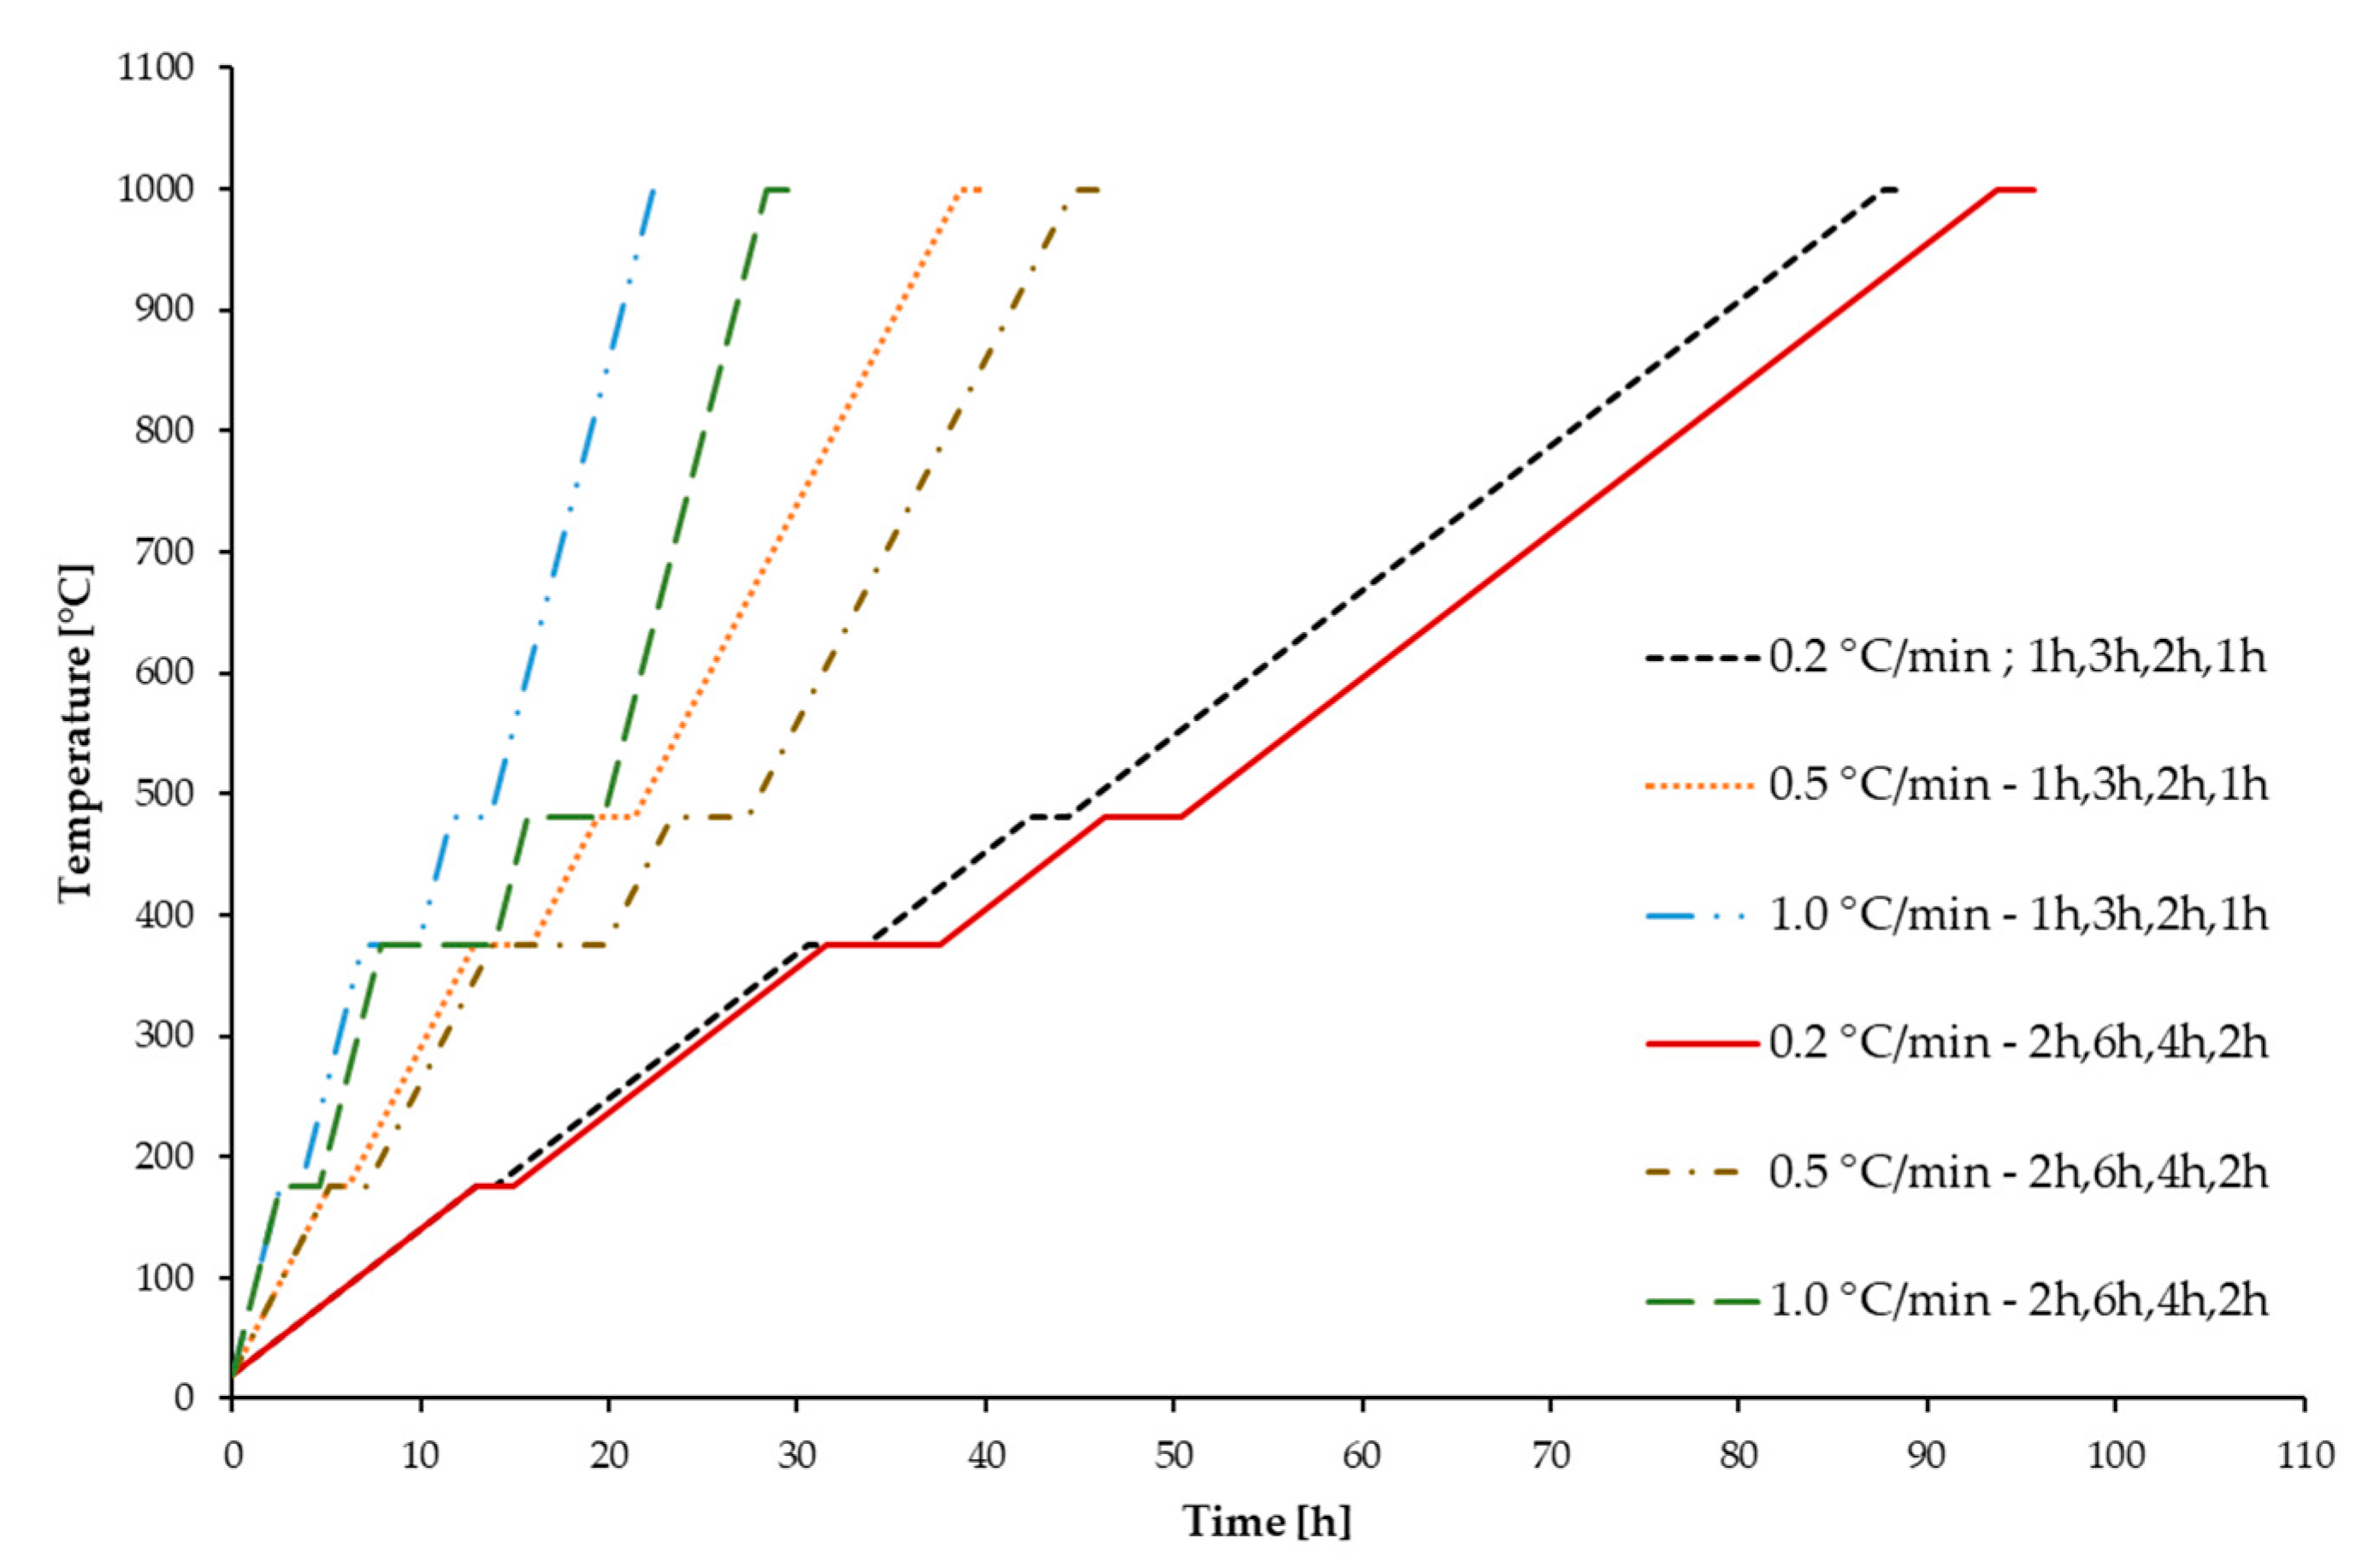
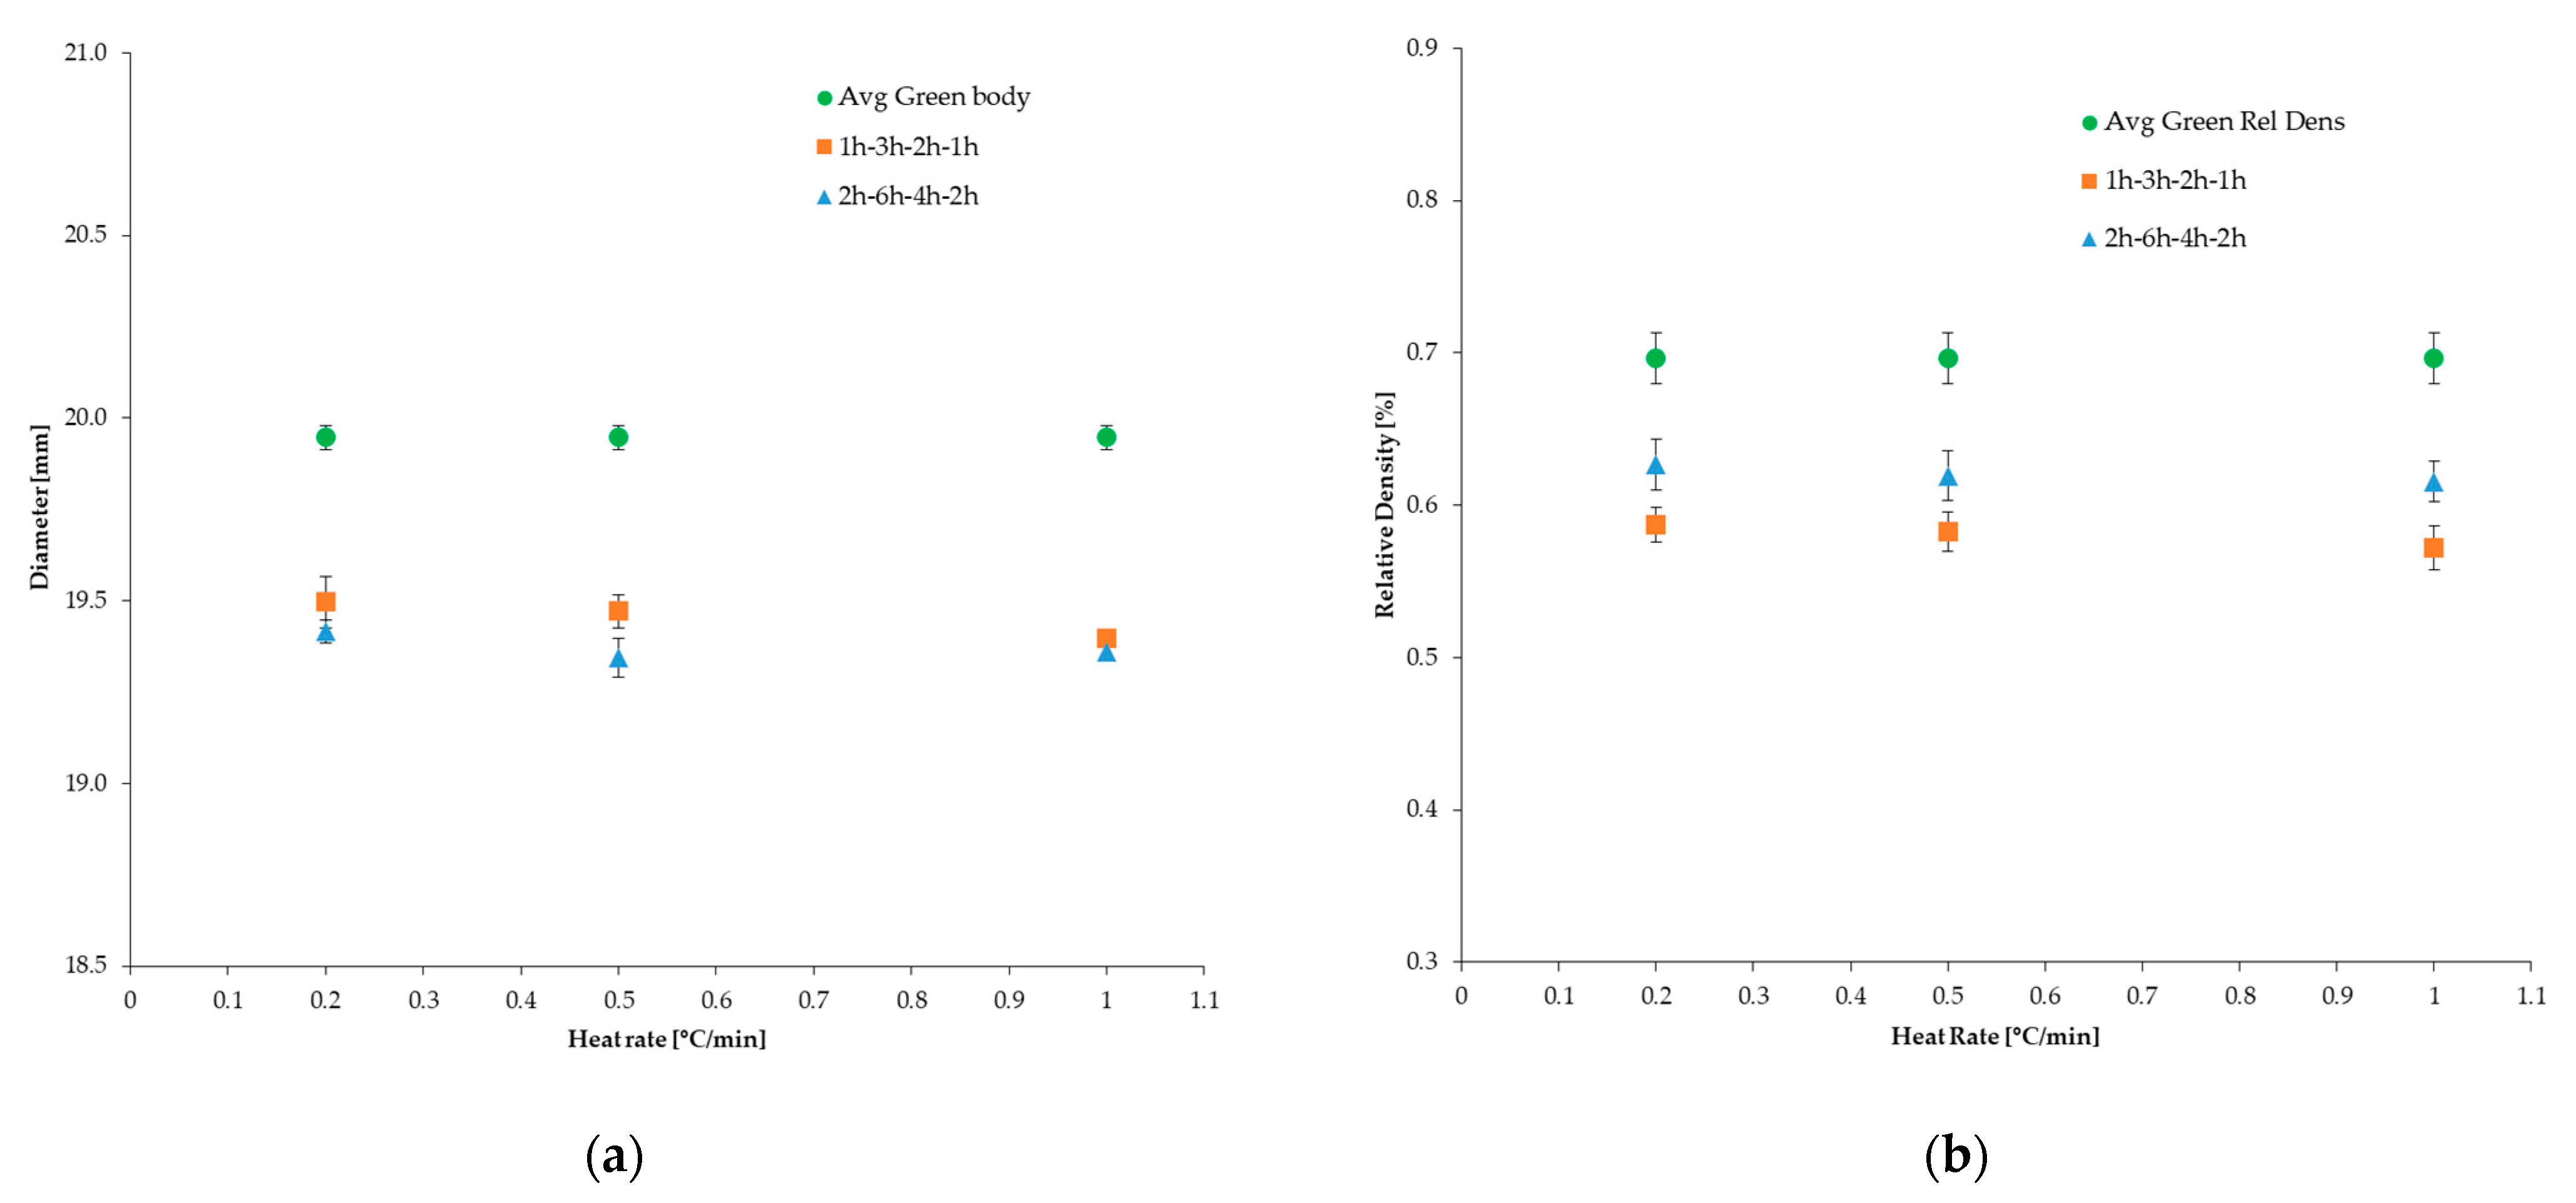
3.4. Thermal Post-Processing

The TGA–DSC study of the green body provided data on the breakdown behaviour of the organic materials in relation to the fluctuating temperature (Figure 15). At around 375 °C and 480 °C, two significant exothermic peaks were recorded and, as seen by the TG curve, the total mass loss was 15.29%, indicating the complete burnout of the organic components. The first mass loss began to occur when the temperature was between 150 °C and 250 °C. This weight loss can be ascribed to the evaporation of adsorbed water and residual cleaning solution. The second mass loss took place between 270 °C and 380 °C, while the third and last significant loss occurred between 390 °C and 550 °C, beyond which the mass loss was negligible. Since the starting ceramic powder was α-Al2O3, from the DSC curve it can be deduced that the thermal debinding reaction was an exothermic process with two major peaks, the former attributed to the oxidative decomposition of polymer chains and the latter ascribed to the thermal decomposition of the crosslinked polymer network [58]. The debinding regime was established, based on these findings. Figure 16 illustrates the temperature settings for the debinding procedure in detail. The temperature was increased from room temperature to 175 degrees Celsius and allowed to dwell at this initial temperature setpoint. The temperature was then raised to 375 degrees Celsius and sustained for another dwelling-time period in order to degrade the organics slowly and, as a result, alleviate the thermal strains on the ceramic components. Afterwards, the system was heated to 480 degrees Celsius and kept at this temperature. Finally, the temperature was steadily increased to 1000 degrees Celsius to eradicate any organic residue and to pre-sinter the sample, which was held for another dwelling and, then, left to cool down to room temperature. Throughout the whole debinding procedure, the rate of heating was regulated according to the ongoing scheduled trial. Figure 16 illustrates the debinding regimes investigated.
After undergoing debinding, the samples were again tested and measured to observe the geometrical dimensions and density evolution. The outcomes of these analyses are reported in Figure 17.
It was observed that at lower heating rates and longer dwelling times, the samples were able to reach higher densities, as the gradual removal of the binder over a longer time contributed to the reduction of residual pores [59] and, hence, to the reaching of higher brown densities. In fact, small heating rates when transitioning between peak dwelling temperatures provided more time for the organics to escape the ceramic structure, instead of being abruptly extracted and leaving behind cracks and defects. Moreover, longer holding times at significant dwelling temperatures ensured that all the corresponding organics exiting the sample were completely expelled. On the contrary, the highest heat rate of 1.0 °C/min, while allowing the samples to reach comparable densities to the ones obtained from the cycles at 0.2 °C/min, resulted in a lower diameter dimension, due to the rapid binder extraction, which caused loss of superficial debris and, hence, geometrical inaccuracy (Figure 18).
Following the previous results, the debinding cycle with a heat rate of 0.2 °C/min and dwelling times of 2 h, 6 h, 4 h, and 2 h was chosen to conclude this investigation. The samples were then prepared, following the process recipe established in this investigation, and finally heated up in an air sintering furnace at a heating rate of 10 °C/min until the temperature of 1700 °C was reached, then held in this condition for 12 h, after which they spontaneously cooled down inside the sintering furnace chamber. Another batch of samples was prepared following this process chain until the end, with the exception of adding MgO as a sintering aid in the starting slurry in a percentage of ~1000 ppm to promote densification and help with the management of the grain growth. Both samples exceeded the relative density of 98.5% and, in particular, the sample with MgO registered a relative density slightly higher than 99.0%, thereby starting to demonstrate a translucent behaviour (Figure 19).

4. Conclusions

A systematic method for determining the optimal components and process parameters for developing an efficient slurry in-house from the ball-milling parameters selection down to the debinding regimes to follow was extensively presented. This method can be applied to tailor the slurry properties to the desired values and develop specific slurries for particular scopes, such as, in this case, producing final parts that exhibit translucency, by working on constantly maintaining high values of relative densities. The main findings of this study can be summarised as follows.
  • Within the workability window explored, dry ball milling with low milling time and high milling speed (1 h and 800 rpm) was the most effective in reducing agglomerates to sharpen the as-received powder size distribution.
  • Among the investigated various dispersants and their concentrations, the most appropriate dispersant to use with the specific slurry prepared in this study was BYK-145 with a weight percentage content of 2% to the ceramic powder content.
  • Different solid loadings were examined and ~85 wt.% of ceramic filler resulted in the optimal choice, reducing the risk of heavy distortions and excessive thermal stress while guaranteeing high densities at all stages.
  • The curing behaviour of the prepared slurry was analysed and the conducted full-factorial DoE highlighted that exposure time and its interaction with the exposure power were the most significant parameters in the DLP printing of the developed slurry. Optimal printing parameters were 2 s as exposure time and 50‰ as exposure power when the layer thickness was set to 25 µm.
  • Among all the debinding trials investigated, lower heating rates (0.2 °C/min) and longer dwelling times delivered a more stable sample with higher relative density and geometrical dimensions retention.
  • Finally, samples were manufactured according to the process schedule established and sintered at 1700 °C for 12 h. The ones with the addition of MgO (1000 ppm) as a sintering aid started to demonstrate a translucent behaviour.
Future development of this work should be aimed at achieving more dense and translucent samples by utilising a high-performance sintering furnace able to work under vacuum at high temperatures or a microwave sintering furnace. In addition, a study on the effect of sintering parameters, such as heating rate and dwelling time as well as dwelling temperature, may provide useful information on the optimal sintering cycle to follow and result in decreased light refraction. In fact, to obtain higher translucency, the final relative density of the parts must be increased further over 99.5% while controlling and tailoring the grain growth to maximise light transmittance. This could be achieved by sintering the parts under vacuum at high temperatures (>1500 °C) in order to minimise air encapsulation and, hence, residual porosity, while improving the densification process.

Author Contributions

Conceptualization, methodology, investigation, formal analysis, data curation, and writing—original draft preparation, visualization, M.D.L.; investigation and writing—review and editing, C.S.; supervision and writing—review and editing, U.M.A. and K.E. All authors have read and agreed to the published version of the manuscript.

Funding

The authors would like to thank the Manufacturing Technology Centre (MTC) for the financial support of Michele De Lisi’s PhD project (Manufacturing Technology Centre, United Kingdom: 881440).

Data Availability Statement

All data are provided within the article and the provided references.

Acknowledgments

M.D.L. thanks the University of Birmingham and the Manufacturing Technology Centre (MTC) for the award of a PhD scholarship.

Conflicts of Interest

The authors declare no conflict of interest. The funders had no role in the design of the study; in the collection, analyses, or interpretation of data; in the writing of the manuscript; or in the decision to publish the results.

References

  1. Bikas, H.; Stavropoulos, P.; Chryssolouris, G. Additive manufacturing methods and modeling approaches: A critical review. Int. J. Adv. Manuf. Technol. 2016, 83, 389–405. [Google Scholar] [CrossRef] [Green Version]
  2. Chen, Z.; Li, Z.; Li, J.; Liu, C.; Lao, C.; Fu, Y.; Liu, C.; Li, Y.; Wang, P.; He, Y. 3D printing of ceramics: A review. J. Eur. Ceram. Soc. 2019, 39, 661–687. [Google Scholar] [CrossRef]
  3. Yang, L.; Miyanaji, H. Ceramic additive manufacturing: A review of current status and challenges. In Proceedings of the 28th Annual International Solid Freeform Fabrications Symposium—An Additive Manufacturing Conference, SFF 2017, Austin, TX, USA, 7–9 August 2017; Available online: https://hdl.handle.net/2152/89871 (accessed on 2 November 2021).
  4. Zocca, A.; Colombo, P.; Gomes, C.M.; Günster, J. Additive manufacturing of ceramics: Issues, potentialities, and opportunities. J. Am. Ceram. Soc. 2015, 98, 1983–2001. [Google Scholar] [CrossRef]
  5. Jasveer, S.; Jianbin, X. Comparison of different types of 3D printing technologies. Int. J. Sci. Res. Publ. 2018, 8, 1–9. [Google Scholar] [CrossRef]
  6. Farzadi, A.; Solati-Hashjin, M.; Asadi-Eydivand, M.; Osman, N.A.A. Effect of layer thickness and printing orientation on mechanical properties and dimensional accuracy of 3D printed porous samples for bone tissue engineering. PLoS ONE 2014, 9, e108252. [Google Scholar] [CrossRef] [PubMed]
  7. Tan, C.; Li, S.; Essa, K.; Jamshidi, P.; Zhou, K.; Ma, W.; Attallah, M.M. Laser Powder Bed Fusion of Ti-rich TiNi lattice structures: Process optimisation, geometrical integrity, and phase transformations. Int. J. Mach. Tools Manuf. 2019, 141, 19–29. [Google Scholar] [CrossRef] [Green Version]
  8. Hassanin, H.; Zweiri, Y.; Finet, L.; Essa, K.; Qiu, C.; Attallah, M. Laser Powder Bed Fusion of Ti-6Al-2Sn-4Zr-6Mo Alloy and Properties Prediction Using Deep Learning Approaches. Materials 2021, 14, 2056. [Google Scholar] [CrossRef]
  9. Bittredge, O.; Hassanin, H.; El-Sayed, M.A.; Eldessouky, H.M.; Alsaleh, N.A.; Alrasheedi, N.H.; Essa, K.; Ahmadein, M. Fabrication and Optimisation of Ti-6Al-4V Lattice-Structured Total Shoulder Implants Using Laser Additive Manufacturing. Materials 2022, 15, 3095. [Google Scholar] [CrossRef]
  10. El-Sayed, M.A.; Essa, K.; Ghazy, M.; Hassanin, H. Design optimization of additively manufactured titanium lattice structures for biomedical implants. Int. J. Adv. Manuf. Technol. 2020, 110, 2257–2268. [Google Scholar] [CrossRef]
  11. Essa, K.; Hassanin, H.; Attallah, M.M.; Adkins, N.J.; Musker, A.J.; Roberts, G.T.; Tenev, N.; Smith, M. Development and testing of an additively manufactured monolithic catalyst bed for HTP thruster applications. Appl. Catal. A Gen. 2017, 542, 125–135. [Google Scholar] [CrossRef] [Green Version]
  12. Fu, X.; Zou, B.; Xing, H.; Li, L.; Li, Y.; Wang, X. Effect of printing strategies on forming accuracy and mechanical properties of ZrO2 parts fabricated by SLA technology. Ceram. Int. 2019, 45, 17630–17637. [Google Scholar] [CrossRef]
  13. Ozog, P.; Blugan, G.; Kata, D.; Graule, T. Influence of the printing parameters on the quality of alumina ceramics shaped by UV-LCM technology. J. Ceram. Sci. Technol. 2019, 10, 1–10. [Google Scholar] [CrossRef]
  14. Sun, C.; Zhang, X. The influences of the material properties on ceramic microstereolithography. Sens. Actuators A. 2002, 101, 364–370. [Google Scholar] [CrossRef]
  15. Gentry, S.P.; Halloran, J.W. Depth and width of cured lines in photopolymerizable ceramic suspensions. J. Eur. Ceram. Soc. 2013, 33, 1981–1988. [Google Scholar] [CrossRef]
  16. Hu, K.; Wei, Y.; Lu, Z.; Wan, L.; Li, P. Design of a shaping system for stereolithography with high solid loading ceramic suspensions. 3D Print. Addit. Manuf. 2018, 5, 311–318. [Google Scholar] [CrossRef]
  17. Komissarenko, D.A.; Sokolov, P.S.; Evstigneeva, A.D.; Shmeleva, I.A.; Dosovitsky, A.E. Rheological and curing behavior of acrylate-based suspensions for the DLP 3D printing of complex zirconia parts. Materials 2018, 11, 2350. [Google Scholar] [CrossRef] [Green Version]
  18. Varghese, G.; Moral, M.; Castro-García, M.; López-López, J.J.; Marín-Rueda, J.R.; Yagüe-Alcaraz, V.; Hernández-Afonso, L.; Ruiz-Morales, J.C.; Canales-Vázquez, J. Fabrication and characterisation of ceramics via low-cost DLP 3D printing. Bol. Soc. Esp. Ceram. Vidrio 2018, 57, 9–18. [Google Scholar] [CrossRef]
  19. Sokolov, P.S.; Komissarenko, D.A.; Shmeleva, I.A.; Slyusar, I.V.; Dosovitskiy, G.A.; Evdokimov, P.V.; Putlyaev, V.I.; Dosovitskiy, A.E. Suspensions on the basis of stabilised zirconium oxide for three-dimensional printing. IOP Conf. Ser. Mater. Sci. Eng. 2018, 347, 012012. [Google Scholar] [CrossRef]
  20. Mitteramskogler, G.; Gmeiner, R.; Felzmann, R.; Gruber, S.; Hofstetter, C.; Stampfl, J.; Ebert, J.; Wachter, W.; Laubersheimer, J. Light curing strategies for lithography-based additive manufacturing of customized ceramics. Addit. Manuf. 2014, 1, 110–118. [Google Scholar] [CrossRef]
  21. Zhang, K.; Xie, C.; Wang, G.; He, R.; Ding, G.; Wang, M.; Dai, D.; Fang, D. High solid loading, low viscosity photosensitive Al2O3 slurry for stereolithography based additive manufacturing. Ceram. Int. 2019, 45, 203–208. [Google Scholar] [CrossRef]
  22. Abouliatim, Y.; Chartier, T.; Abelard, P.; Chaput, C.; Delage, C. Optical characterization of stereolithography alumina suspensions using the Kubelka-Munk model. J. Eur. Ceram. Soc. 2009, 29, 919–924. [Google Scholar] [CrossRef]
  23. Sun, J.; Binner, J.; Bai, J. Effect of surface treatment on the dispersion of nano zirconia particles in non-aqueous suspensions for stereolithography. J. Eur. Ceram. Soc. 2019, 39, 1660–1667. [Google Scholar] [CrossRef]
  24. Wang, J.C.; Dommati, H. Fabrication of zirconia ceramic parts by using solvent based slurry stereolithography and sintering. Int. J. Adv. Manuf. Technol. 2018, 98, 1537–1546. [Google Scholar] [CrossRef]
  25. Griffith, M.L.; Halloran, J. Ultraviolet curing of highly loaded ceramic suspensions for stereolithography of ceramics. In Proceedings of the International Solid Free Fabrication Symposium, Austin, Texas, USA, 8–10 August 1994; pp. 396–403. [Google Scholar] [CrossRef]
  26. Song, S.Y.; Park, M.S.; Lee, D.; Lee, J.W.; Yun, J.S. Optimization and characterization of high-viscosity ZrO2 ceramic nanocomposite resins for supportless stereolithography. Mater. Des. 2019, 180, 107960. [Google Scholar] [CrossRef]
  27. Shuai, X.; Zeng, Y.; Li, P.; Chen, J. Fabrication of fine and complex lattice structure Al2O3 ceramic by digital light processing 3D printing technology. J. Mater. Sci. 2020, 55, 6771–6782. [Google Scholar] [CrossRef]
  28. Guo, J.; Zeng, Y.; Li, P.; Chen, J. Fine lattice structural titanium dioxide ceramic produced by DLP 3D printing. Ceram. Int. 2019, 45, 23007–23012. [Google Scholar] [CrossRef]
  29. Wang, K.; Qiu, M.; Jiao, C.; Gu, J.; Xie, D.; Wang, C.; Tang, X.; Wei, Z.; Shen, L. Study on defect-free debinding green body of ceramic formed by DLP technology. Ceram. Int. 2020, 46, 2438–2446. [Google Scholar] [CrossRef]
  30. De Lisi, M.; Kovacev, N.; Attia, U.M.; Essa, K. Numerical Simulation of Sintering of DLP Printed Alumina Ceramics. Aerospace 2022, 9, 336. [Google Scholar] [CrossRef]
  31. Hassanin, H.; Essa, K.; Elshaer, A.; Imbaby, M.; El-Mongy, H.H.; El-Sayed, T.A. Micro-fabrication of ceramics: Additive manufacturing and conventional technologies. J. Adv. Ceram. 2021, 10, 1–27. [Google Scholar] [CrossRef]
  32. Kovacev, N.; Li, S.; Zeraati-Rezaei, S.; Hemida, H.; Tsolakis, A.; Essa, K. Effects of the internal structures of monolith ceramic substrates on thermal and hydraulic properties: Additive manufacturing, numerical modelling and experimental testing. Int. J. Adv. Manuf. Technol. 2021, 112, 1115–1132. [Google Scholar] [CrossRef]
  33. Kovacev, N.; Li, S.; Li, W.; Zeraati-Rezaei, S.; Tsolakis, A.; Essa, K. Additive Manufacturing of Novel Hybrid Monolithic Ceramic Substrates. Aerospace 2022, 9, 255. [Google Scholar] [CrossRef]
  34. Kovacev, N.; Doustdar, O.; Li, S.; Tsolakis, A.; Herreros, J.M.; Essa, K. The synergy between substrate architecture of 3D-printed catalytic converters and hydrogen for low-temperature aftertreatment systems. Chem. Eng. Sci. 2023, 269, 118490. [Google Scholar] [CrossRef]
  35. Klein, C.A. Figures of merit for high-energy laser-window materials: Thermal lensing and thermal stresses. Laser-Induc. Damage Opt. Mater. 2006 2007, 6403, 40308. [Google Scholar] [CrossRef]
  36. Moynihan, C.T.; Loehr, S.R. Chemical durability of fluoride glasses. Mater. Sci. Forum. 1988, 32–33, 243–253. [Google Scholar] [CrossRef]
  37. Bayya, S.; Sanghera, J.S.; Aggarwal, I.D.; Chin, G. Vis-IR transmitting window materials. SPIE 2005, 5786, 262–271. [Google Scholar] [CrossRef]
  38. Goldman, L.M.; Hartnett, T.M.; Wahl, J.M.; Ondercin, R.J.; Olson, K. Recent advances in aluminum oxynitride (ALON) optical ceramic. In Proceedings of the SPIE Window and Dome Technologies and Materials VII, Orlando, FL, USA, 7 September 2001; Volume 4375, pp. 71–78. [Google Scholar] [CrossRef]
  39. Beyer, R.A.; Kerwien, H. Evaluation of ALON for cannon window application. In Proceedings of the SPIE Window and dome technologies and materials VI, Orlando, FL, USA, 26 July 1999; Volume 3705, pp. 113–118. [Google Scholar] [CrossRef] [Green Version]
  40. Goldman, L.M.; Twedt, R.; Balasubramanian, S.; Sastri, S. ALON optical ceramic transparencies for window, dome and transparent armor applications. In Proceedings of the SPIE Window and dome technologies and materials XII, Orlando, FL, USA, 20 May 2011; Volume 8016. [Google Scholar] [CrossRef]
  41. Askinazi, J.; Wientzen, R.V.; Khattak, C.P. Development of large aperture, monolithic sapphire optical windows. In Proceedings of the SPIE Window and Dome Technologies and Materials VII, Orlando, FL, USA, 7 September 2001; Volume 4375, pp. 1–11. [Google Scholar] [CrossRef]
  42. Patterson, M.C.L.; DiGiovanni, A.; Roy, D.W.; Gilde, G. Spinel armor—Clearly the way to go. In Ceramic Engineering and Science Proceedings: 27th Annual Cocoa Beach Conference on Advanced Ceramics and Composites: A; Wiley-Blackwell on behalf of the American Ceramic Society: Columbus, OH, USA, 2003; Volume 24, pp. 441–446. [Google Scholar] [CrossRef]
  43. Patterson, M.C.L.; DiGiovanni, A.A.; Fehrenbacher, L.; Roy, D.W. Spinel: Gaining momentum in optical applications. In Proceedings of the SPIE Window and Dome Technologies and Materials VIII, Orlando, FL, USA, 26 September 2003; Volume 5078, pp. 71–79. [Google Scholar] [CrossRef]
  44. Jones, I.K.; Seeley, Z.M.; Cherepy, N.J.; Duoss, E.B.; Payne, S.A. Direct ink write fabrication of transparent ceramic gain media. Opt. Mater. 2018, 75, 19–25. [Google Scholar] [CrossRef]
  45. Seeley, Z.; Yee, T.; Cherepy, N.; Drobshoff, A.; Herrera, O.; Ryerson, R.; Payne, S.A. 3D printed transparent ceramic YAG laser rods: Matching the core-related refractive index. Opt. Mater. 2020, 107, 110121. [Google Scholar] [CrossRef]
  46. Zhang, G.; Carloni, D.; Wu, Y. 3D printing of transparent YAG ceramics using copolymer-assisted slurry. Ceram. Int. 2020, 46, 17130–17134. [Google Scholar] [CrossRef]
  47. Hostaša, J.; Schwentenwein, M.; Toci, G.; Esposito, L.; Brouczek, D.; Piancastelli, A.; Pirri, A.; Patrizi, B.; Vannini, M.; Biasini, V. Transparent laser ceramics by stereolithography. Scr. Mater. 2020, 187, 194–196. [Google Scholar] [CrossRef]
  48. Cooperstein, I.; Indukuri, S.R.K.C.; Bouketov, A.; Levy, U.; Magdassi, S. 3D printing of micrometer-sized transparent ceramics with on-demand optical-gain properties. Adv. Mater. 2020, 32, 2001675. [Google Scholar] [CrossRef]
  49. Gonzalez, P.; Schwarzer, E.; Scheithauer, U.; Kooijmans, N.; Moritz, T. Additive manufacturing of functionally graded ceramic materials by stereolithography. J. Vis. Exp. 2019, 2019, 1–8. [Google Scholar] [CrossRef] [Green Version]
  50. Griffith, M.L.; Halloran, J.W. Scattering of ultraviolet radiation in turbid suspensions. J. Appl. Phys. 1997, 81, 2538–2546. [Google Scholar] [CrossRef] [Green Version]
  51. Bennett, J. Measuring UV curing parameters of commercial photopolymers used in additive manufacturing. Addit. Manuf. 2017, 18, 203–212. [Google Scholar] [CrossRef] [PubMed]
  52. Tomasik, P.; Schilling, C.H.; Jankowiak, R.; Kim, J.C. The role of organic dispersants in aqueous alumina suspensions. J. Eur. Ceram. Soc. 2003, 23, 913–919. [Google Scholar] [CrossRef]
  53. Wang, D.; Chen, T.; Zeng, Y.; Chen, X.; Xing, W.; Fan, Y.; Qiao, X. Optimization of UV-curable alumina suspension for digital light processing of ceramic membranes. J. Membr. Sci. 2022, 643, 120066. [Google Scholar] [CrossRef]
  54. Chèvremont, W.; Chareyre, B.; Bodiguel, H. Quantitative study of the rheology of frictional suspensions: Influence of friction coefficient in a large range of viscous numbers. Phys. Rev. Fluids 2019, 4, 064302. [Google Scholar] [CrossRef]
  55. Delhote, N.; Bila, S.; Baillargeat, D.; Chartier, T.; Verdeyme, S. Advanced design and fabrication of microwave components based on shape optimization and 3D ceramic stereolithography process. In Advances in Ceramics—Synthesis and Characterization, Processing and Specific Applications; Intechopen: London, UK, 2011; Volume 11, pp. 243–276. [Google Scholar] [CrossRef] [Green Version]
  56. Cramer, C.L.; Wilt, J.K.; Campbell, Q.A.; Han, L.; Saito, T.; Nelson, A.T. Accuracy of stereolithography printed alumina with digital light processing. Open Ceram. 2021, 8, 100194. [Google Scholar] [CrossRef]
  57. Xu, X.; Zhou, S.; Wu, J.; Liu, S.; Ma, S.; Cheng, T. Study of alumina ceramic parts fabricated via DLP stereolithography using powders with different sizes and morphologies. Int. J. Appl. Ceram. Technol. 2023, 20, 1167–1193. [Google Scholar] [CrossRef]
  58. Wang, L.; Liu, X.; Wang, G.; Tang, W.; Li, S.; Duan, W.; Dou, R. Partially Stabilized Zirconia Moulds Fabricated by Stereolithographic Additive Manufacturing via Digital Light Processing. Mater. Sci. Eng. A 2020, 770, 138537. [Google Scholar] [CrossRef]
  59. Sim, J.H.; Koo, B.K.; Jung, M.; Kim, D.S. Study on Debinding and Sintering Processes for Ceramics Fabricated Using Digital Light Processing (DLP) 3D Printing. Processes 2022, 10, 2467. [Google Scholar] [CrossRef]
Figure 1. (a) Admaflex 130; (b) schematic of the Admaflex 130 DLP process.
Machines 11 00321 g001
Figure 2. Schematics of the whole experimental campaign.
Machines 11 00321 g002
Figure 3. Particle size distribution of the as-received and the most successful BMed powders.
Machines 11 00321 g003
Figure 4. SEM images of BM powders: (a) 1 h 400 rpm; (b) 1 h 600 rpm; (c) 1 h 800 rpm. Visible agglomerates are circled in dashed lines.
Machines 11 00321 g004
Figure 5. Viscosity vs. shear rate of slurries with different dispersants.
Machines 11 00321 g005
Figure 6. Viscosity vs. shear rate of slurries with BYK-145 at different weight contents.
Machines 11 00321 g006
Figure 7. Viscosity vs. shear rate of slurries with different solid loadings.
Machines 11 00321 g007
Figure 8. Cure depth values of the slurry at different exposure powers and times.
Machines 11 00321 g008
Figure 9. Diameter dimension (a) and measured density (b) of the DLPed discs with 25 µm layer thickness.
Machines 11 00321 g009
Figure 10. Side dimension (a) and measured density (b) of the DLPed plates with 25 µm layer thickness.
Machines 11 00321 g010
Figure 11. DLP printed part with 25 µm as layer thickness, 3 s exposure time, and exposure power of (a) 50‰; (b) 100‰; (c) 150‰.
Machines 11 00321 g011
Figure 12. DLP printed part with 25 µm as layer thickness, 50‰ s exposure time, and exposure time of (a) 1 s; (b) 2 s; (c) 3 s, same as Figure 11a.
Machines 11 00321 g012
Figure 13. Effect of the process parameters on the mean of the density.
Machines 11 00321 g013
Figure 14. Effect of the process parameters interactions on the mean of the density.
Machines 11 00321 g014
Figure 15. TG–DSC curves of the DLPed Al2O3 sample.
Machines 11 00321 g015
Figure 16. Debinding regimes explored.
Machines 11 00321 g016
Figure 17. Diameter dimension (a) and measured density (b) of the debound discs.
Machines 11 00321 g017
Figure 18. (a) Sample debound at 0.2 °C/min for the longer set of holding times; (b) sample debound at 1.0 °C/min for the longer set of holding times.
Machines 11 00321 g018
Figure 19. (a) Sample prepared following the process recipe herein described; (b) sample prepared following the process recipe herein described with the addition of MgO as a sintering aid.
Machines 11 00321 g019
Table 1. Ball-milling parameter combinations investigated.
RunMilling Speed [rpm]Milling Time [h]
14001
24002
34003
46001
56002
66003
78001
88002
98003
Table 2. Investigated slurry preparation parameters.
Parameter
DispersantBYK-111BYK-145BYK-9076
Dispersant content1 wt.%2 wt.%3 wt.%5 wt.%
Solid loading75 wt.%80 wt.%85 wt.%90 wt.%
Table 3. Curing parameters investigated.
Exposure Time [s]Exposure Surface Power [mW/cm2]
1233.526.6910.2113.9317.24
Table 4. DoE factors, levels, and experimental matrix of the DLP experimental campaign.
FactorsLevels
Exposure power [mW/cm2]3.526.6910.21
Exposure time [s]123
Layer thickness [µm]2550100
Experiment[mW/cm2][s][µm]
13.52125
23.52150
33.521100
43.52225
53.52250
63.522100
73.52325
83.52350
93.523100
106.69125
116.69150
126.691100
136.69225
146.69250
156.692100
166.69325
176.69350
186.693100
1910.21125
2010.21150
2110.211100
2210.21225
2310.21250
2410.212100
2510.21325
2610.21350
2710.213100
Table 5. p-values of analysed factors and their interactions.
Factorp-Value
Exposure power0.109
Exposure time0.027
Layer thickness0.066
Exposure power – Exposure time0.023
Exposure power – Layer thickness0.269
Exposure time – Layer thickness0.246
Disclaimer/Publisher’s Note: The statements, opinions and data contained in all publications are solely those of the individual author(s) and contributor(s) and not of MDPI and/or the editor(s). MDPI and/or the editor(s) disclaim responsibility for any injury to people or property resulting from any ideas, methods, instructions or products referred to in the content.

